EHMT2 methyltransferase governs cell identity in the lung and is required for KRAS G12D tumor development and propagation
- Department of Translational Oncology, Genentech, Inc, United States
- Department of Bioinformatics & Computational Biology, Genentech, Inc, United States
- Department of Immunology, Genentech, Inc, United States
- Department of Molecular Biology, Genentech, Inc, United States
- Department of Pathology, Genentech, Inc, United States
- Department of Genetics, Stanford University, United States
- Department of Discovery Oncology, Genentech, Inc, United States
Figures
Figure 1 with 1 supplement

EHMT2 activity is required for KrasG12D;Trp53 (KP) tumorsphere self-renewal.
(A) Western blot analysis of EHMT2 in tumor-propagating cell (TPC) and non-TPC. Actin was used as loading control. (B) Flow cytometry analysis of EHMT2 in TPC and non-TPC (blue, TPC, red, non-TPC; gray, Isotype). (C) Quantification of EHMT2 geometric fluorescence intensity (gMFI) in (B) (n=2, mean ± SEM; two-tailed t-test, *p=0.05). (D) Tumorsphere formation of KP-derived primary cells seeded with increasing doses of EHMT2 inhibitor (n=2, mean ± SEM, One-way ANOVA with multiple testing, *p<0.005). (E) Western blot analysis showing reductions in H3K9me2/3 following EHMT2 inhibitor treatment (EHMT2i, EHMT2 inhibition) histone H3 was used as loading control. Ratio of H3K9me to H3 is depicted at the bottom of the Western blot. (F) Representative image of primary tumorspheres following secondary passaging in the absence of either vehicle control or EHMT2 inhibitor (EHMT2i, EHMT2 inhibition. Scale bar 100 μm). (G) Quantitation of tumorsphere growth after secondary passaging (n=5; mean ± SEM; two-tailed paired t-test, **p<0.005). (H) Relative qRT-PCR of Ehmt2 transcripts from primary tumorspheres, expressing either short hairpin RNA (shRNA) control (shControl), or shRNAs against Ehmt2 (shEhmt2. 1, shEhmt2. 2), (n=2; mean ± SEM; two-tailed paired t-test, *p<0.05). (I) Quantification of turbo RFP (tRFP)-positive tumorspheres following secondary passage of primary tumorspheres expressing control or Ehmt2 shRNAs. (shEhmt2.1, n=2; mean ± SD, shEhmt2.2, n=3; mean ± SD; two-tailed paired t-test, *p<0.05, shEHMT2.1 p=0.09).
-
Figure 1—source data 1
Western blot for Figure 1A showing G9a (EHMT2) in non-TPC vs TPC.
- https://cdn.elifesciences.org/articles/57648/elife-57648-fig1-data1-v2.zip
-
Figure 1—source data 2
Western blot (right side) for Figure 1A showing ACTIN in non-TPC vs TPC.
- https://cdn.elifesciences.org/articles/57648/elife-57648-fig1-data2-v2.zip
Figure 1—figure supplement 1

Schematic overview of tumorsphere assay.
Figure 2 with 2 supplements
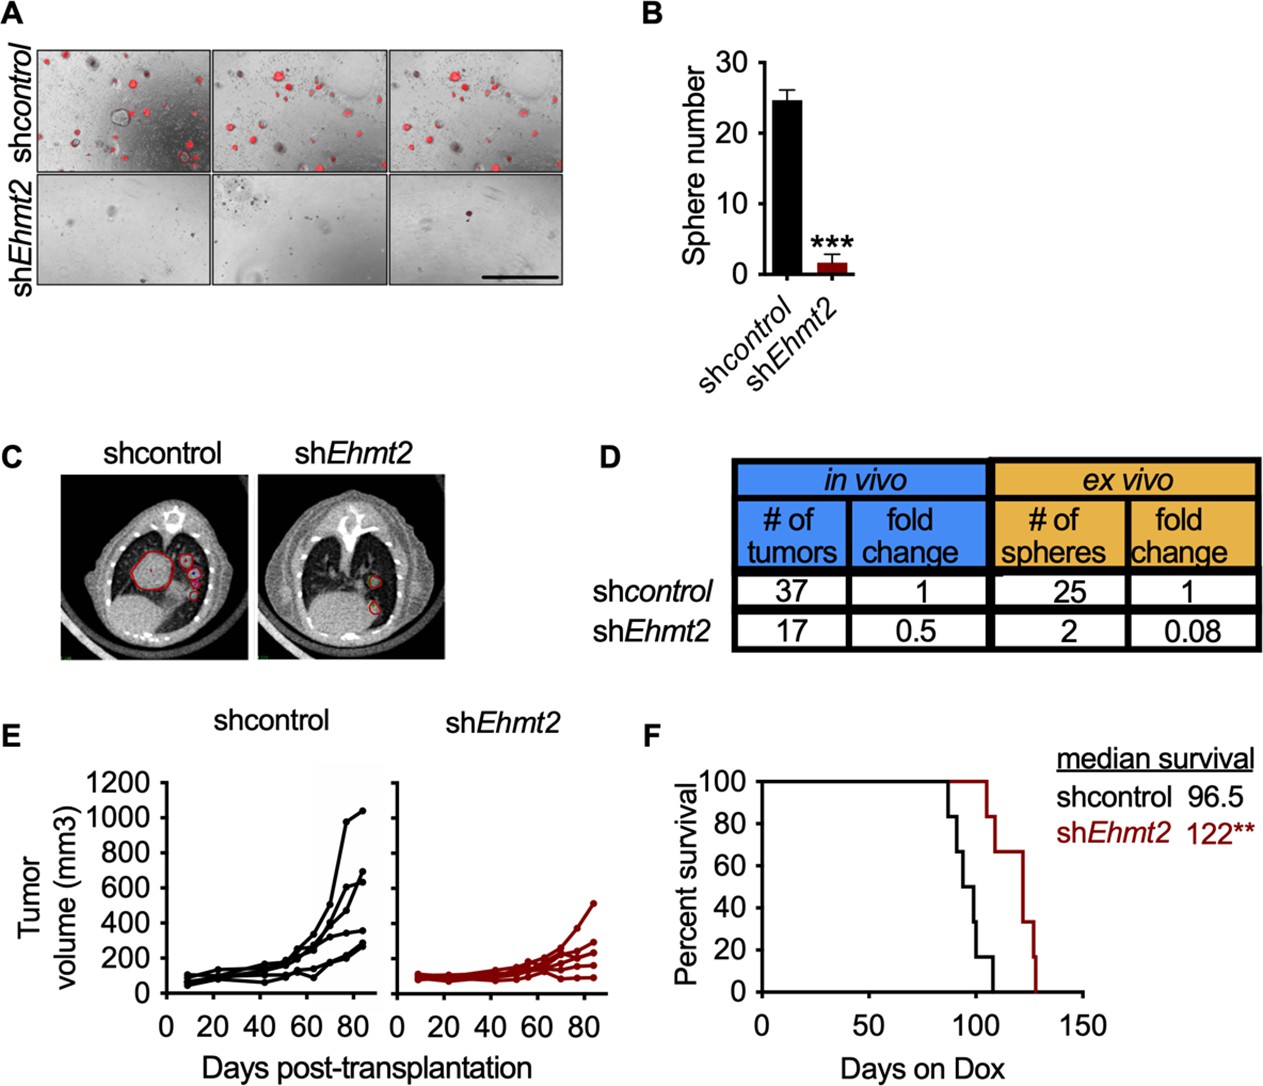
EHMT2 is required for in vivo tumor self-renewal.
(A) Ex vivo analysis of tumorsphere formation from primary orthotopic transplanted cells, expressing either short hairpin RNA (shRNA) control (shcontrol) or shRNAs against Ehmt2 (shEhmt2) (n=3 ± SD) Scale bar 500µM. (B) Quantification of tumorsphere formation in panel (A), two tailed t-test, ***p<0.0005 (C) Representative μ-CT images of shcontrol- or shEhmt2-expressing tumors (n=6) red circles depicting tumors. (D) Table comparing efficiencies of secondary passage in vivo and ex vivo from orthotopically-transplanted primary KP cells, expressing shcontrol (n=6) or shEhmt2 (n=6). (E) Overall tumor volume in secondary recipient mice orthotopically transplanted with KP cells from primary recipients, expressing either shRNAs targeting control (shcontrol) or Ehmt2 (shEhmt2.1) (n=6) tumor volume at end of study by treatment, Mann-Whitney test, *p<0.05. (F) Graph indicates survival of mice depicted in (E) (n=6 per group. Geha-Breslow-Wilcoxon test, **p<0.005).
Figure 2—figure supplement 1
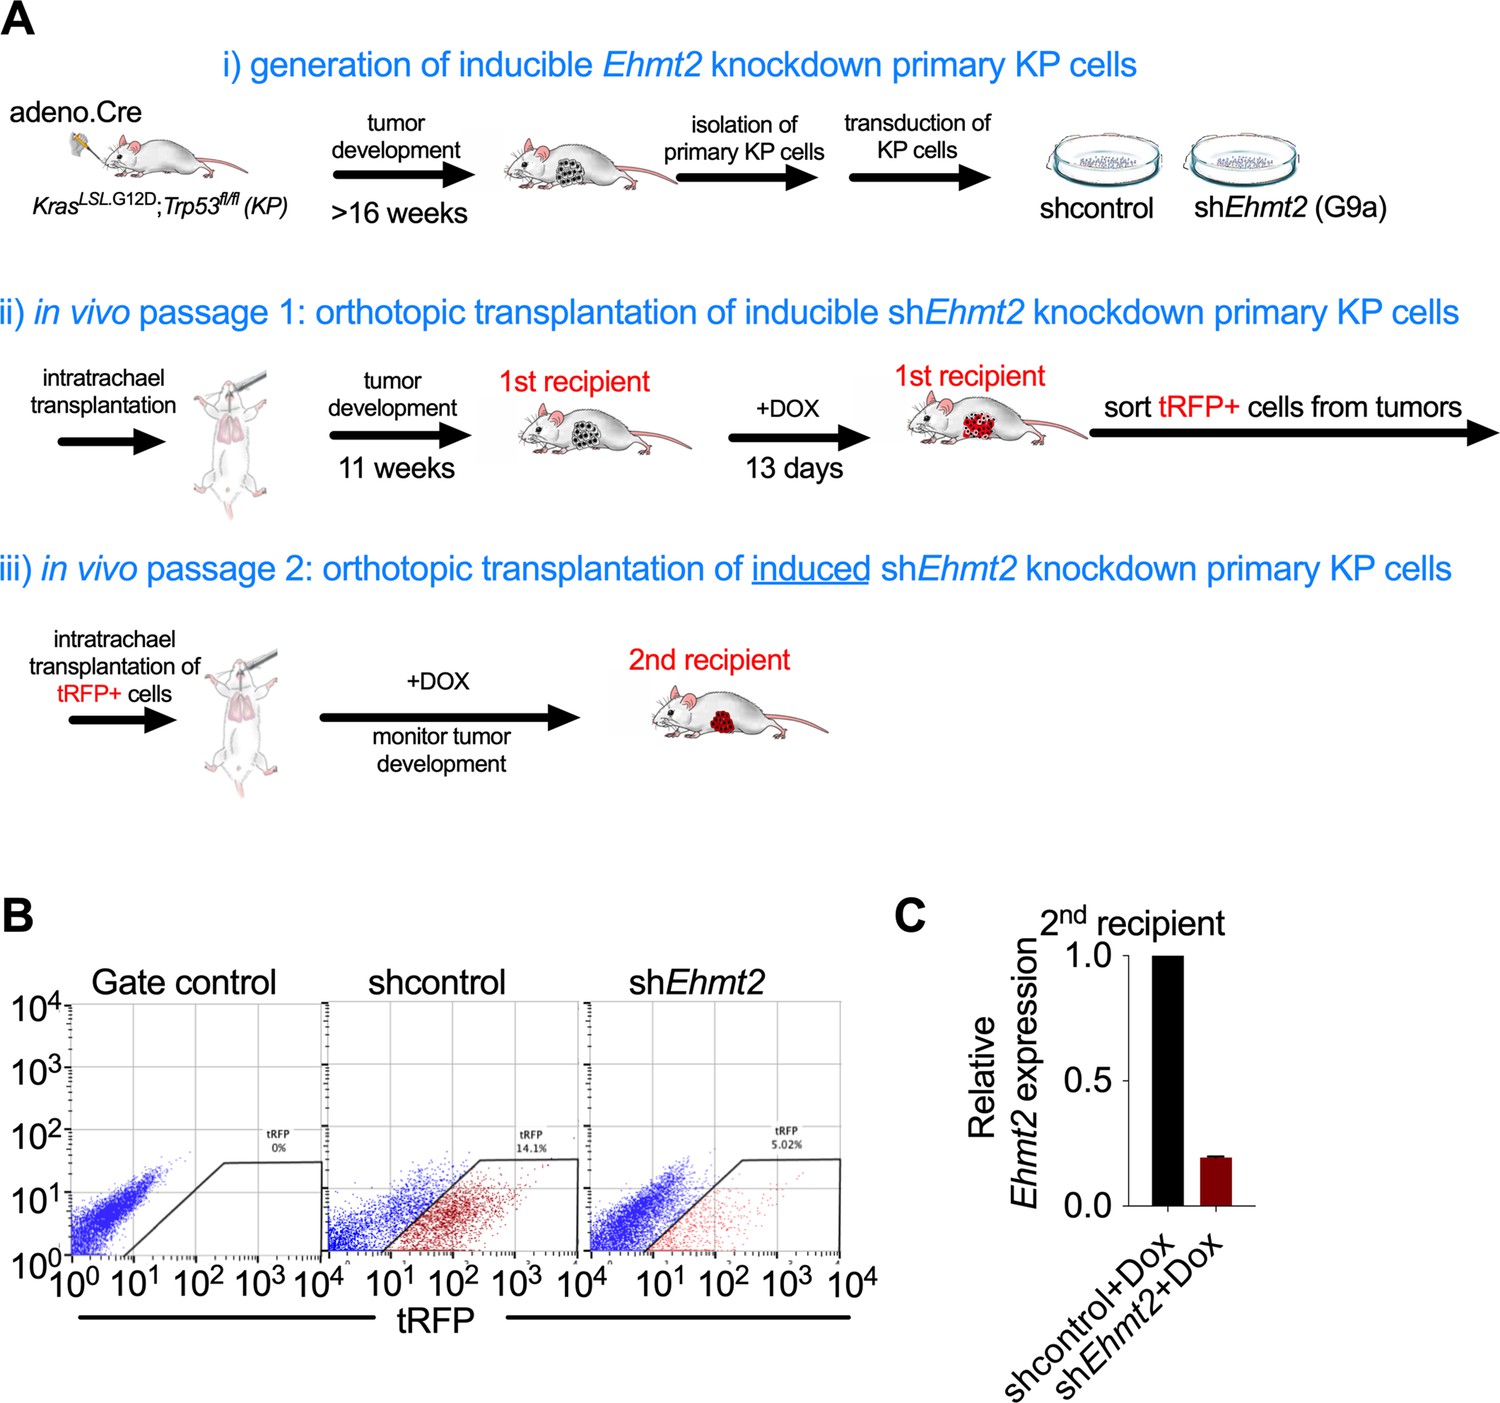
Analysis of in vivo serial orthotopic transplantation of primary KP cells harboring Ehmt2 targeting hairpins.
(A) Schematic representation of serial orthotopic transplantation of primary KP cells can be viewed in three basic parts: (i) Primary tumors are initated via intranasal infection of adenovirus expressing Cre recombinase in KrasLSL.G12D; Trp53flox/flox (KP) mice. Tumors develop with a latency of approximately 16 weeks. Primary tumors are isolated from KP mice and immediately transduced with lentiviral constructs harboring doxycycline-inducible hairpins and a tRFP label to facilitate identification of hairpin-expressing cells. Transduced primary KP cells are then orthotopically seeded into the lungs of wild-type recipient mice via intratracheal administration. Animals are thereafter monitored for tumor formation using microCT. Once tumor formation is confirmed in the first recipient mice, animals are stratified and dosed with doxycycline for 13 consecutive days to induce expression of latent hairpins targeting either Ehmt2 or control transcripts. After 13 days of expression, tumors from the first recipients are harvested and tRFP + cells are sorted to identify hairpin expressing cells. (ii) tRFP + cells are then orthotopically transplanted into the second recipient. The animals are maintained on doxycycline and tumor growth is monitored. (B) Flow cytometry showing gating strategy of primary tRFP-sorted cells prior to secondary transplantation (left plot, tRFP gate control; middle and right plot, sorted tRFP-positive cells from shcontrol and shEhmt2, respectively). (C) Relative expression of shEhmt2.2 in tRFP-sorted tumor cells prior to secondary transplantation (n=6).
Figure 2—figure supplement 2

Analysis of terminal tumors from in vivo serial orthotopic transplantation of primary KP cells harboring Ehmt2 targeting hairpins.
(A) Relative expression of Ehmt2 transcripts from tumors of shcontrol and shEhmt2.2 secondary recipients at study termination, showing no statistical difference (each point represents one tumor from n=9 for each group). (B) Micrographs showing extracted tumor areas taken for transcript expression analysis from both control and shEhmt2 secondary recipient tumor transplants.
Figure 3 with 6 supplements
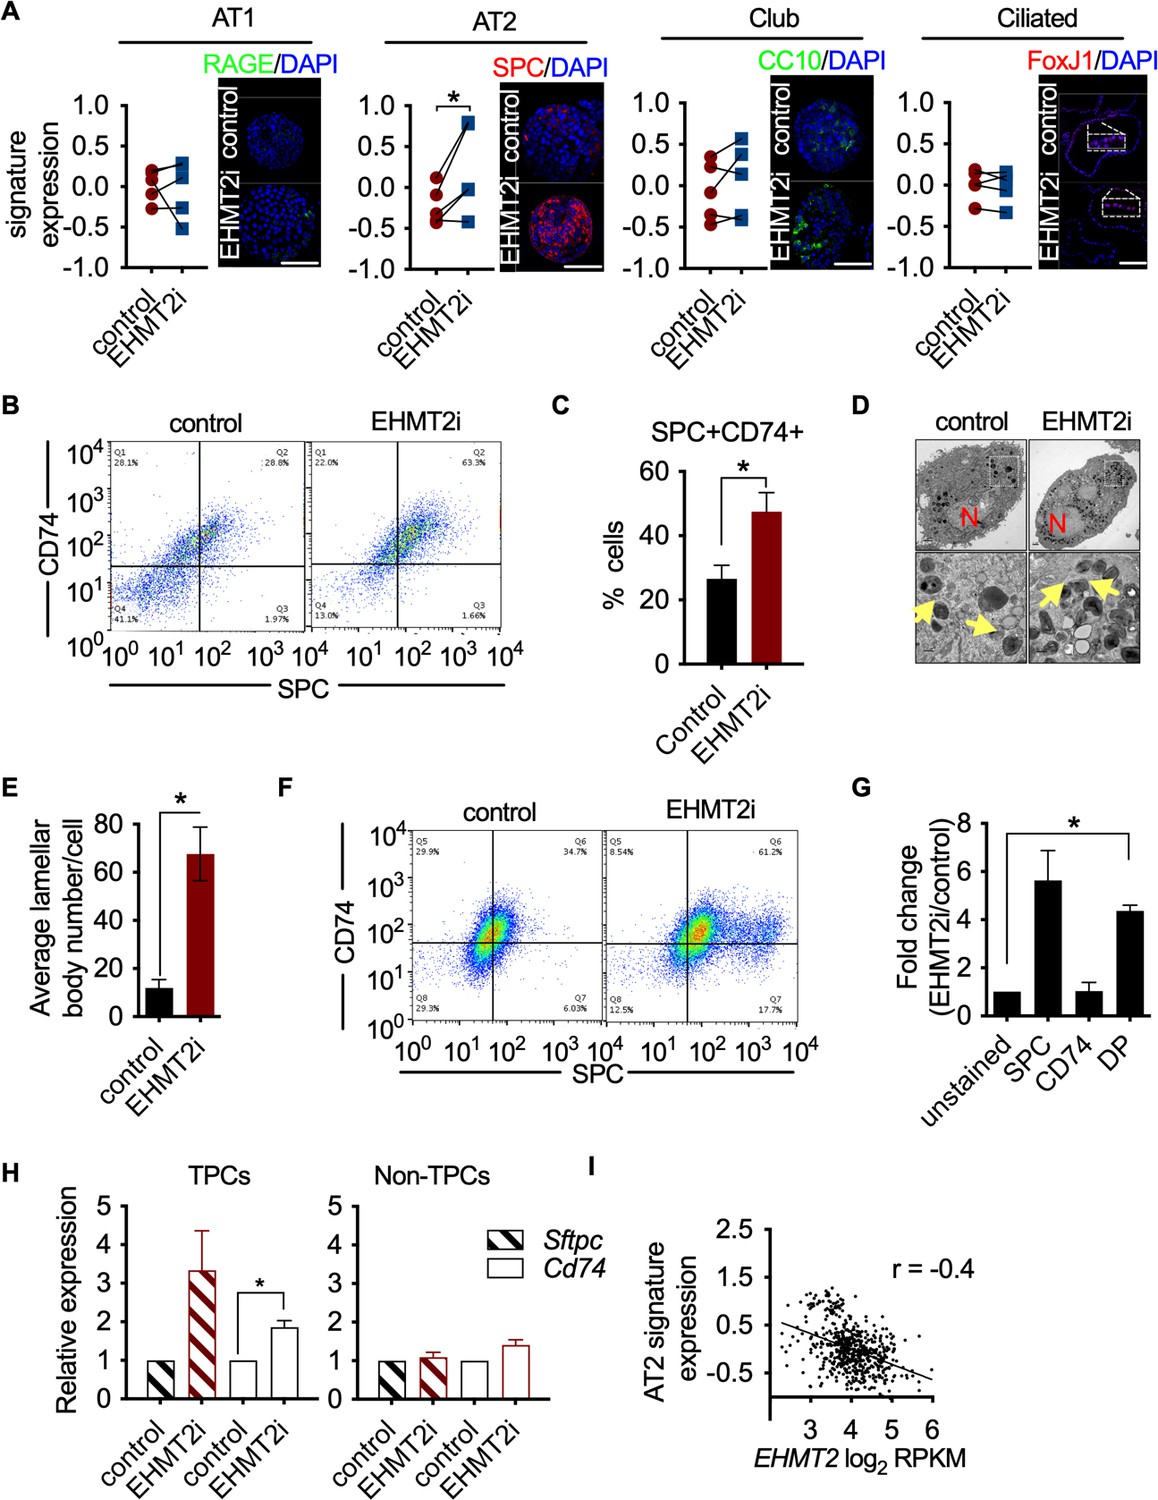
EHMT2 preserves TPC function by preventing AT2 differentiation.
(A) Graphs show enrichment analyses of distinct alveolar cell-lineage gene signatures in transcriptomes generated from KP-derived primary tumorspheres following EHMT2 inhibition (EHMT2i) vs vehicle control (control) (n=4; mean Z-score ± SEM, two-tailed paired t-test, *p<0.05), each paired with immunofluorescence (IF) micrographs of representative canonical marker from their respective cell lineage. Scale bar 100µM (See Figure (S3E) for quantitation of IF). (B) Representative flow cytometry of cells derived from primary tumorspheres treated with either vehicle control (control) or EHMT2 inhibitor (EHMT2i) for 5 days and immuno-stained for alveolar type 2 (AT2) markers surfactant protein C (SPC) and CD74. (C) Quantification of the SPC-CD74 double positive (DP) population depicted in (B). (n=4; mean ± SEM, two-tailed paired t-test, *p<0.05). (D) Representative transmission electron microscopy (TEM) image of cells extracted from primary tumorspheres, treated as in (B). (Upper panel, scale bar 2 μm; lower panel, respective insets in the upper panel, scale bar 0.5 μm). (N, nucleus; yellow arrows, lamellar bodies). (E) Quantification of TEM in (D) (n=2; mean ± SEM, two-tailed paired t-test, *p<0.05). (F) Representative flow cytometry of tumor-propagating cells (TPCs) sorted after EHMT2 inhibitor (EHMT2i)- or vehicle control-treatment of primary tumorspheres and immuno-stained for AT2 markers SPC and CD74. (G) Quantification of (F), showing fold-change in EHMT2i/control ratio of AT2 markers SPC and CD74 (n=2; mean ± SEM, One-way ANOVA with Tukey’s multiple comparison test, **p<0.005). (H) Relative expression of Sftpc and Cd74 transcripts in EHMT2i vs control; TPC and non-TPC, respectively. (n=3; mean ± SEM, two-tailed paired t-test, *p<0.05). (I) Spearman’s rank correlation analysis between orthogonal human AT2 gene signatures and EHMT2 transcript in 546 human lung adenocarcinomas (LUAD). (n=546, linear regression analysis, ***p<0.0001, r=−0.4).
Figure 3—figure supplement 1

EHMt2 inhibition reduces apoptosis and proliferation in tumorspheres.
(A) Proliferation in KP-derived primary tumorspheres demonstrated by BrdU staining, following 5 days with EHMT2 inhibitor (EHMT2i) or vehicle control (control) (red, BrdU immunofluorescence; blue, 4′,6-diamidino-2-phenylindole (DAPI) counterstain; scale bar 100 μm). (B) Quantification of BrdU-positive nuclei depicted in (a) (two-tailed paired t-test; n=3; mean ± SEM, *p<0.05). (C) Micrographs indicate apoptosis (CC3, cleaved caspase-3) in primary tumorspheres, following 5 days with EHMT2i or control (blue, DAPI counterstain; scale bar 500 μm). (D) Quantification of CC3-positive area per sphere area, depicted in (c). (two-tailed paired t-test n=2; mean ± SEM, **p<0.01).
Figure 3—figure supplement 2

Quantification of immunostaining in control and EHMT2i-treated tumorspheres (RAGE: control, n=28; EHMT2i, n=21).
Surfactant protein C (SPC): control, n=15; EHMT2i, n=9; two-tailed paired t-test, p<0.005. CC10: control, n=15; EHMT2i, n=9; two-tailed paired t-test, **p<0.05. (FoxJ1: control, n=28; EHMT2i, n=21).
Figure 3—figure supplement 3
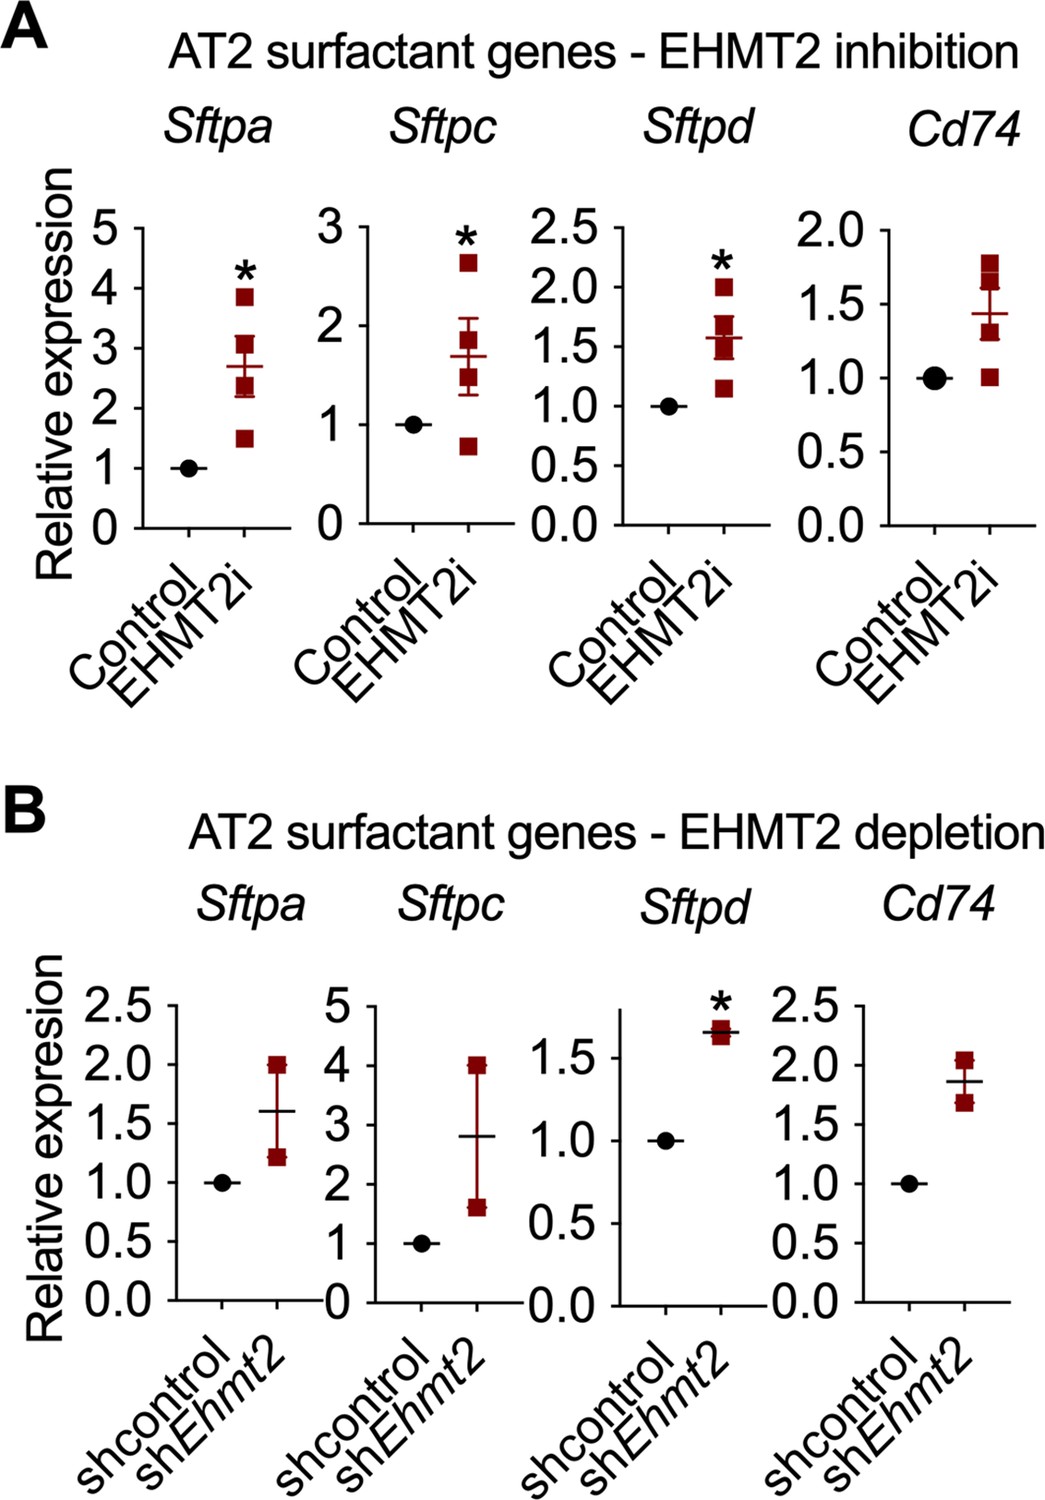
Induction of surfactants following EHMT2 depletion and pharmacologic inhibition.
(A) Relative expression of surfactants and Cd74 transcripts following EHMT2 inhibition (n=4 ± SEM; p<0.05) or shEhmt2 vs shcontrol (control) (two-tailed paired t-test n=4 ± SEM; *p<0.05). (B) Relative expression of surfactants and Cd74 transcripts following EHMT2 inhibition (n=4 ± SEM; *p<0.05) or shEhmt2 vs shcontrol (control) (n=2 ± SEM).
Figure 3—figure supplement 4

Relative expression of alveolar type 2 (AT2) markers in tRFP-sorted tumor cells derived from primary recipients expressing either shcontrol or shEhmt2 (n=3; mean ± SEM; Sftpc, Slc34a2, Lamp3, Cd74; two-tailed paired t-test *p<0.05).
Figure 3—figure supplement 5

Quantification of tumor-propagating cell (TPC) fraction following EHMT2i vs control (n=19; mean ± SEM; two-tailed paired t-test *p<0.05).
Figure 3—figure supplement 6

Spearman’s rank correlation analysis between orthogonal human alveolar gene signatures and EHMT2 transcript in 546 human lung adenocarcinomas (LUAD) (n=546, linear regression analysis p<0.0001).
Figure 4 with 4 supplements
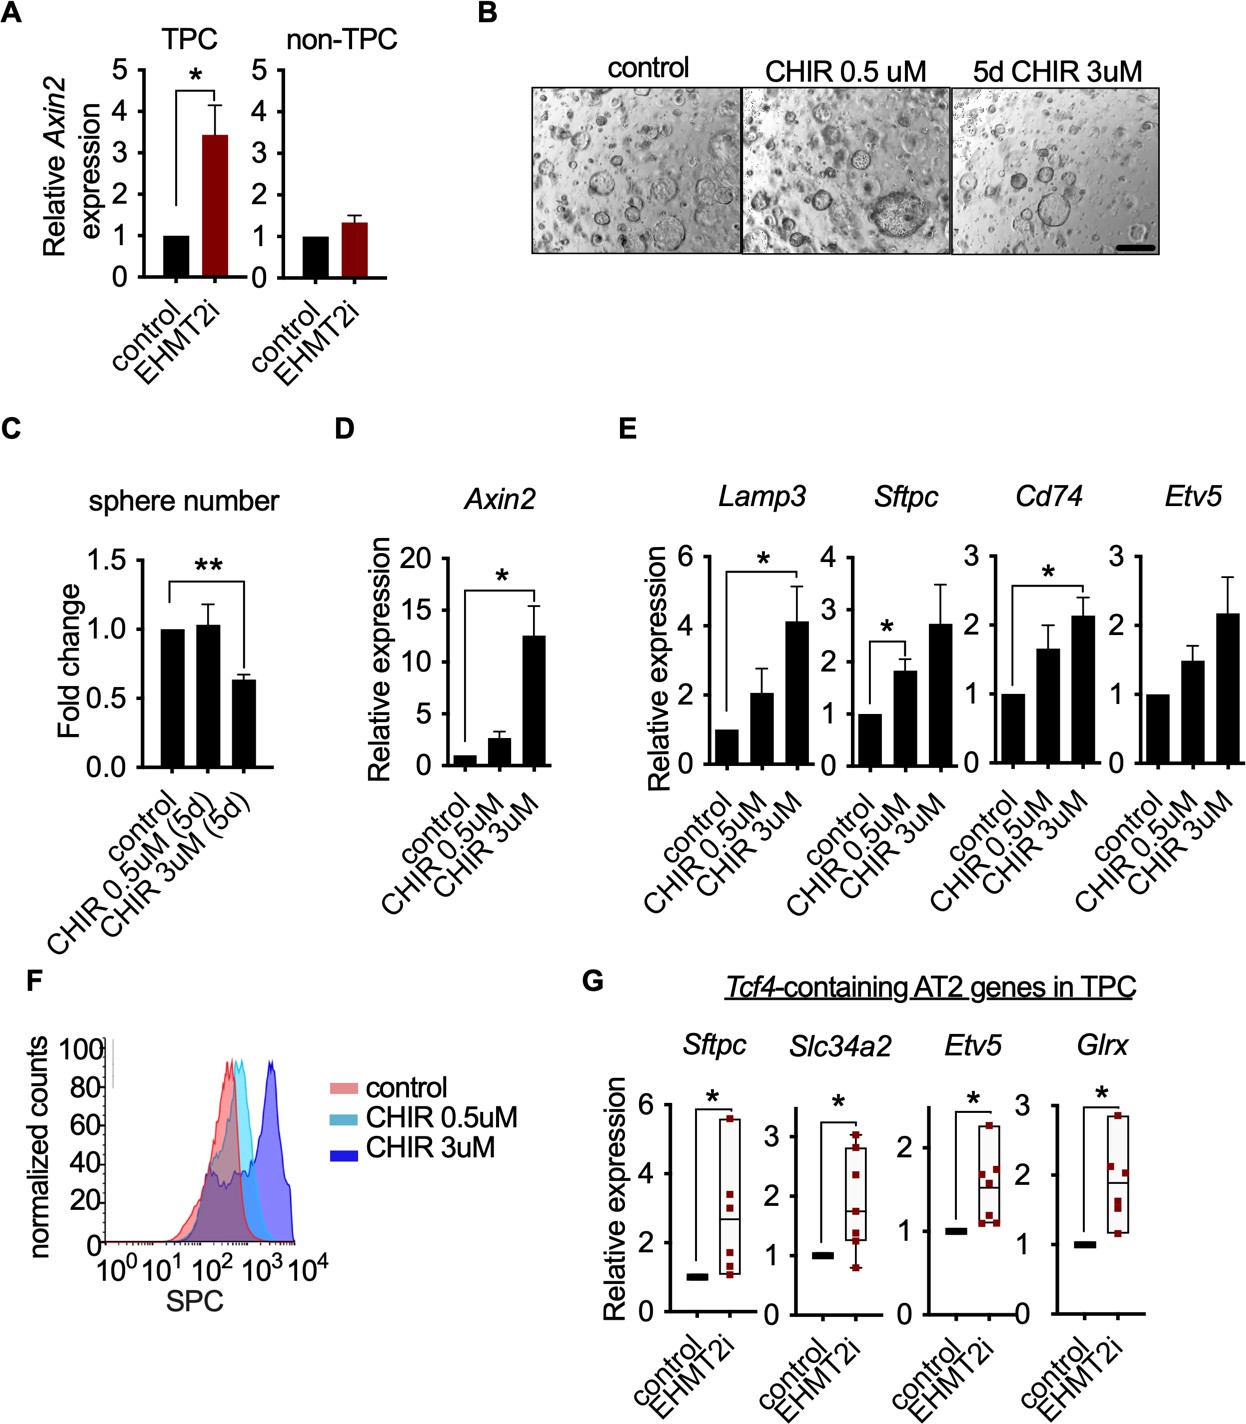
Wnt activation impairs TPC self-renewal and induces AT2 cell lineage marker expression.
(A) Relative expression of Axin2 transcripts in tumor-propagating cells (TPCs) and non-TPC following EHMT2 inhibition (EHMT2i) vs vehicle control (control) (n=4 mean± SEM; two-tailed paired t-test, *p<0.05). (B) Representative micrographs of primary tumorspheres passaged to single cells following 5 days of the GSK3b inhibitor, CHIR (5 days CHIR) at indicated doses vs vehicle control (control) and assessed for secondary sphere formation (scale bar 100 μm). (C) Quantification of sphere formation experiments as represented in (b) (n=4 mean ± SEM; two-tailed paired t-test, **p<0.005). (D) Relative expression of Axin2 transcripts in primary tumorspheres (n=5 mean ± SEM, two-tailed paired t-test, *p<0.05). (E) Relative expression of alveolar type 2 (AT2) markers in tumorspheres (n=5 mean ± SEM, two-tailed paired t-test, *p<0.05). (F) Flow cytometry for surfactant protein C (SPC) in primary tumorspheres, treated with two doses of GSK3β inhibitor (CHIR) for 5 days vs vehicle control (control). (G) Relative expression of TCF4-containing AT2 markers in TPCs, treated with EHMT2i vs control (n=6, mean ± SEM, two-tailed paired t-test, *p<0.05).
Figure 4—figure supplement 1

EHMT2 inhibition does not induce broad changes in chromatin accessibility.
Scatter plots showing correlation of relative transposase-accessible chromatin using sequencing (ATAC-seq) tag counts for all peaks (A) or promoters only (B), from vehicle control (control) and EHMT2-inhibited (EHMT2i) tumor-propagating cells (TPCs) isolated from tumorspheres 5 days after inhibitor treatment. Overall 331 peaks and 57 peaks demonstrated increased and decreased accessibility, respectively (a) (n=3; FDR<0.05; fold change>1.5).
Figure 4—figure supplement 2

Unbiased enrichment analysis of transcription factor (TF) binding motifs, revealing enrichment of Tcf4 motifs in promoter regions of distal alveolar cell-lineage gene signatures vs background, depicted in red and gray color bars, respectively.
Bottom table displays how Tcf4 motifs rank in each of the cell lineage gene signatures.
Figure 4—figure supplement 3

Relative expression of TCF4-containing alveolar type 2 (AT2) markers in tumor-propagating cells (TPCs), treated with EHMT2i vs control (n=6, mean ± SEM,).
Figure 4—figure supplement 4

Integrated genome viewer tracks of transposase-accessible chromatin using sequencing (ATAC-seq) generated from tumor-propagating cells (TPCs).
Tracks showing location of tcf4 motifs within promoters of alveolar type 2 (AT2)-lineage markers (red rectangles, Tcf4 motif locations).
Figure 5
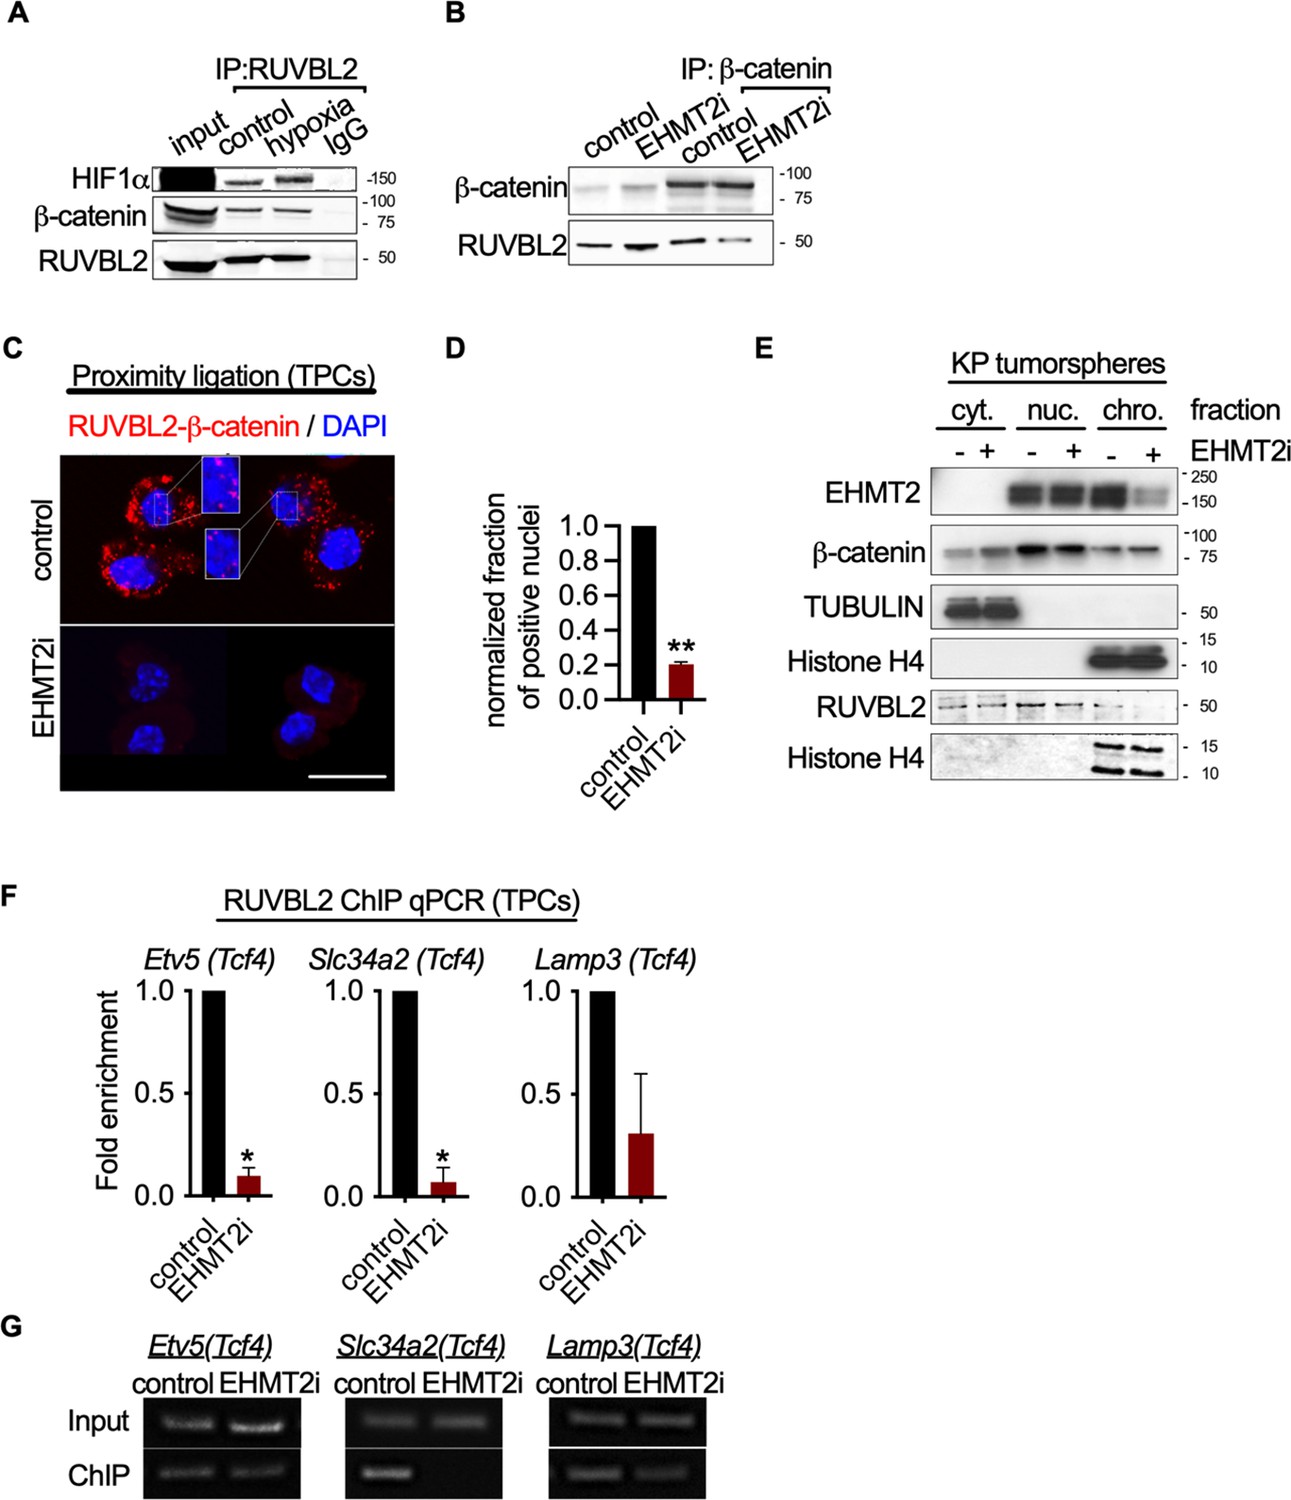
EHMT2 restrains Tcf4-mediated gene transcription by repressing chromatin bound β-catenin through RUVBL2.
(A) Western blot demonstrating expression of HIF1-α and β-catenin in A549 lysates immunoprecipitated with RUVBL2 antibody. Cells were cultured under hypoxic conditions (1% O2) vs control (ambient O2). (B) Western blot demonstrating co-immunoprecipitation of RUVBL2 in A549 lysates co-immunoprecipitated with β-catenin antibody. Cells were treated with EHMT2 inhibitor vs control. (C) Proximity ligation assay in EHMT2i-treated vs vehicle-treated tumor-propagating cells (TPCs) (red, RUVBL2-β-catenin proximity ligation; blue, DAPI counterstain). Insets show a magnification of the red signal in nuclei of vehicle-treated TPCs (scale 10 μm). (D) Quantification of normalized nuclei with a positive signal (n=2; mean ± SEM, two-tailed paired t-test, **p<0.05). (E) Cytoplasmic (cyt), nuclear (nuc) and chromatin (chro) subcellular fractionation of EHMT2i-treated (as indicated) tumorspheres compared to control. Histone H4 and Tubulin are loading controls of chromatin and cytoplasmic fractions, respectively. (F) Chromatin immunoprecipitation using RUVBL2 antibody followed by qPCR (ChIP-qPCR) of areas flanking a Tcf4 binding sites in promoters of the alveolar type 2 (AT2) genes Etv5, Slc34a2 and Lamp3 (n=2 mean ± SEM; Etv5, Slc34a2, two-tailed paired t-test, *p<0.05). (G) Representative qPCR of Tcf4 binding motif within promoters of AT2 genes.
-
Figure 5—source data 1
Western blot for Figure 5E showing G9a (EHMT2) expression in subcellular fractionation of EHMT2i-treated tumorspheres compared to control.
- https://cdn.elifesciences.org/articles/57648/elife-57648-fig5-data1-v2.zip
-
Figure 5—source data 2
Western blot for Figure 5E showing TUBULIN expression in middle membrane (upper band) in subcellular fractionation of EHMT2i-treated tumorspheres compared to control.
- https://cdn.elifesciences.org/articles/57648/elife-57648-fig5-data2-v2.zip
-
Figure 5—source data 3
Western blot for Figure 5E showing histone H4 expression in the bottom membrane and beta catenin expression (upper membrane) in subcellular fractionation of EHMT2i-treated tumorspheres compared to control.
- https://cdn.elifesciences.org/articles/57648/elife-57648-fig5-data3-v2.zip
Figure 6 with 7 supplements
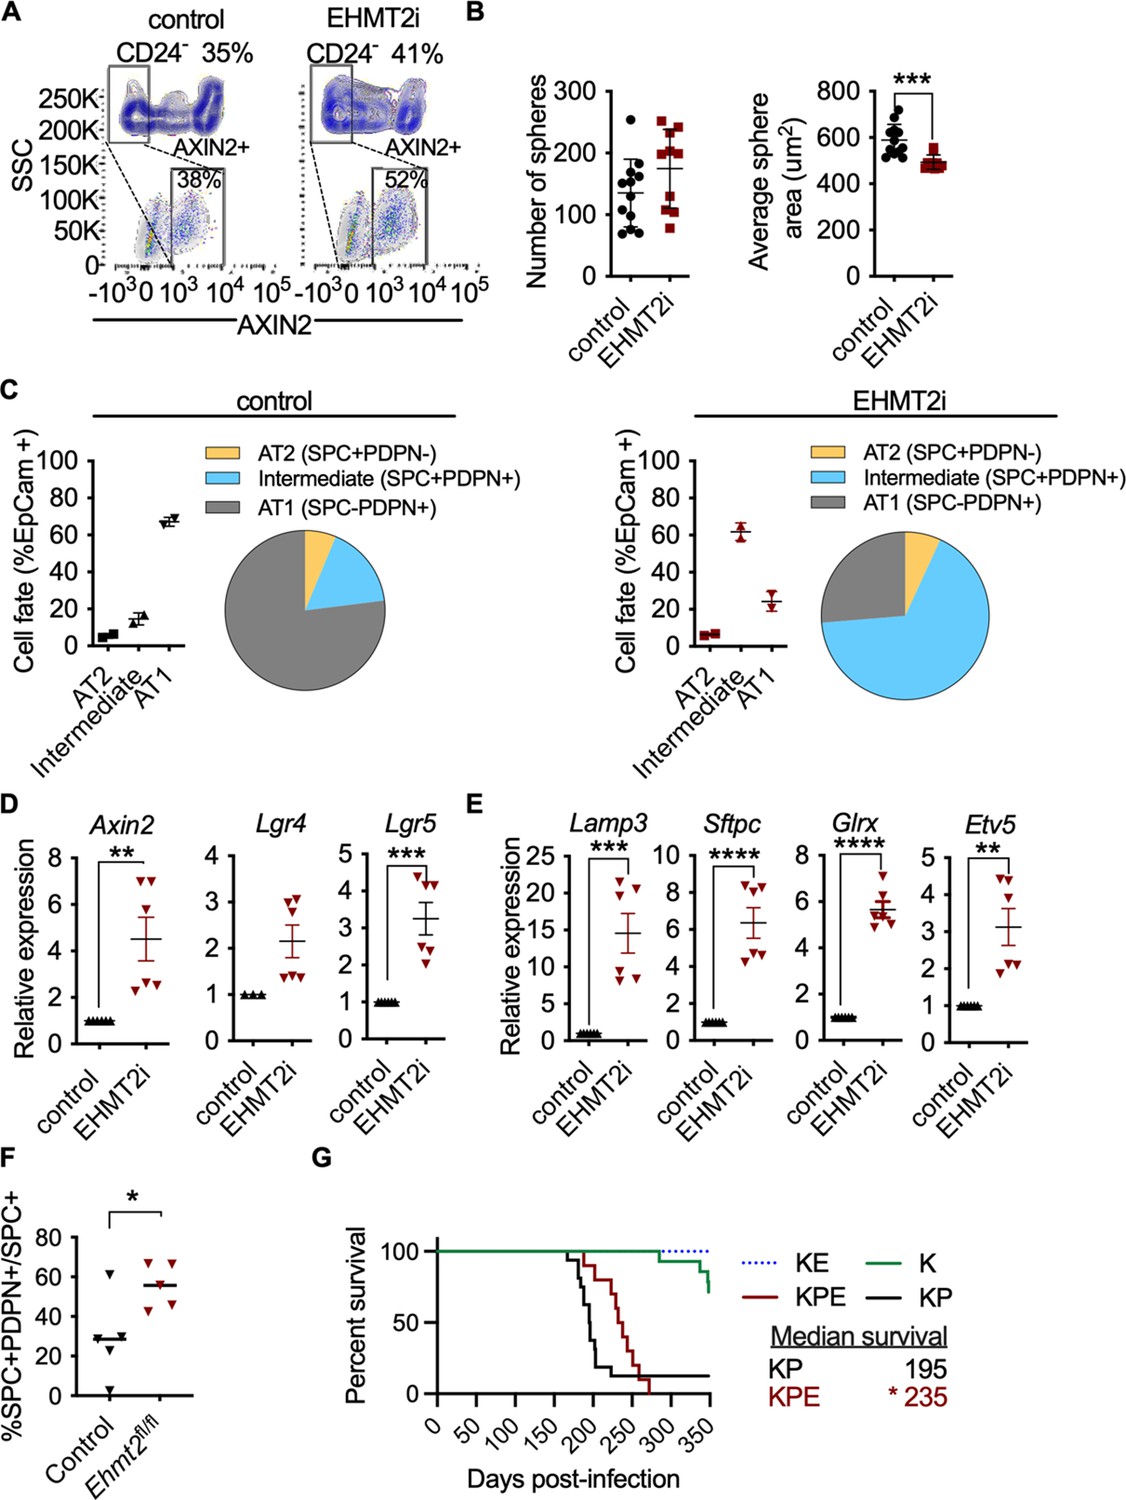
EHMT2 controls Wnt signaling and in AT2 cells and impairs tumor initiation.
(A) Scatter and contour plots demonstrating intracellular staining of AXIN2 in CD24 negative (CD24-) epithelial cells sorted from EHMT2-inhibited mice compared to control (n=6 for each group). The blue contour plot shows gating on the CD24- cell population. (B) Sphere number and size in alveospheres after treatment with EHMT2 inhibitor (EHMT2i) vs control. (n=10 ± SEM, two-tailed paired t-test, ***p<0.01). (C) Cell-lineage marker analysis of alveospheres, treated with either vehicle control or EHMT2i. Each panel shows a graph and a pie-chart depicting epithelial percentages of the AT1 marker podoplanin (PDPN) and the alveolar type 2 (AT2) marker surfactant protein C (SPC). (n=2 ± SEM), (D) Relative expression of Axin2, Lgr4 and Lgr5 transcripts (n=6–9 ± SEM, two-tailed paired t-test, **p<0.005, ***p<0.0001). (E) Relative expression of tcf4-containing AT2 transcript markers (n=6 ± SEM; two-tailed paired t-test, **p<0.05, ****p<0.0001). (F) Percentage of SPC +PDPN + double-positive cells out of SPC +in wildtype (control) (n=5) and Ehmt2fl/fl (n=5) groups, 4 days post hyperoxic (75% O2) injury. Quantitation represented as per-mouse, two-tailed paired t-test, *p<0.05 (G) Survival of KrasG12D;Trp53 (KP) (n=16), KrasG12D;Trp53;Ehmt2fl/f (KPE) (n=10), KrasG12D (K) (n=14) and KrasG12D;Ehmt2fl/f (KE) (n=9). Gehan-Breslow-Wilcoxon test, (*p<0.05).
Figure 6—figure supplement 1

Calibration of Axin2 antibody.
(A) Flow cytometry of AXIN2 following 48 hr of GSK3β inhibitor treatment in the RKO colorectal cell line (RKO +48 hr CHIR) compared to vehicle control (RKO) (Isotype depicted in grey; RKO in orange; CHIR-treated RKO in purple). (B) Calibration of an Axin2 antibody used in Figure 6A and S6A using immunohistochemistry of AXIN2 in APCfl/fl and APCfl/fl; ROSA26CreERT2 villi (n=4).
Figure 6—figure supplement 2

Mean fluorescence intensity (MFI) of surfactant protein C (SPC) in alveolar type 2 (AT2) and intermediate alveosphere-derived cells, following EHMT2 inhibition vs control (n=2 ± SEM; Control (AT2) vs EHMT2i (AT2), two-tailed t-test, * p<0.05).
Figure 6—figure supplement 3

Relative expression of Ehmt2 transcript in pooled tdTomato + cells, denoting Cre exposure, from Ehmtfl/fl vs control (n=6).
Figure 6—figure supplement 4

Representative image showing TdTomato-expressing cells a (yellow) and surfactant protein C (SPC)-expressing cells following 5 days of intratracheal infection with AAV9-Cre.
Dashed lines mark airways. Inset magnification shows colocalization of tdTomato-expressing cells (yellow) and SPC (Red).
Figure 6—figure supplement 5

Schematic representation of Hyperoxic (75% O2) experiment.
WT and Ehmt2fl/fl mice were infected with AAV9-Cre. 5 days following infection, mice were exposed to hyperoxic conditions for 5 days and allowed to recover for 4 days.
Figure 6—figure supplement 6
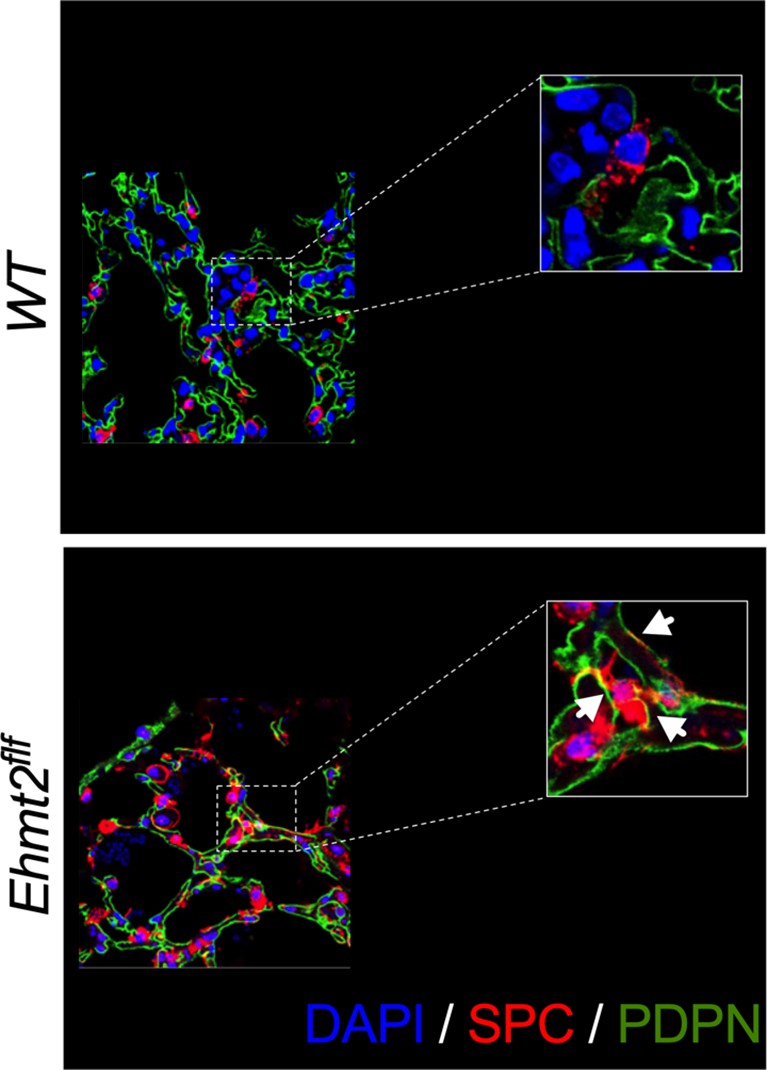
Representative images of surfactant protein C (SPC) + podoplanin (PDPN) + double positive cells.
White arrows in the inset show double positive cells in Ehmt2fl/fl mice or single stained SPC or PDPN–only in WT mice, respectively.
Figure 6—figure supplement 7

Decreased tumor burden in KPE mice.
(A) Graph shows cumulative tumor number detected by μ-CT scan at different time points following tumor initiation in KP mice (black) (n=16) and KPE mice (red) (n=10). (B) Graph shows tumor volume quantified by μ-CT scan at different time points following tumor initiation in KP mice (black) and KPE (red).
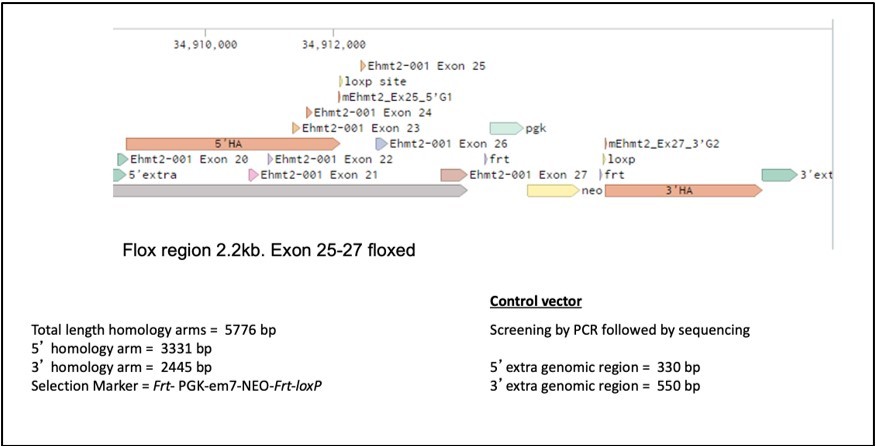
Scheme 1
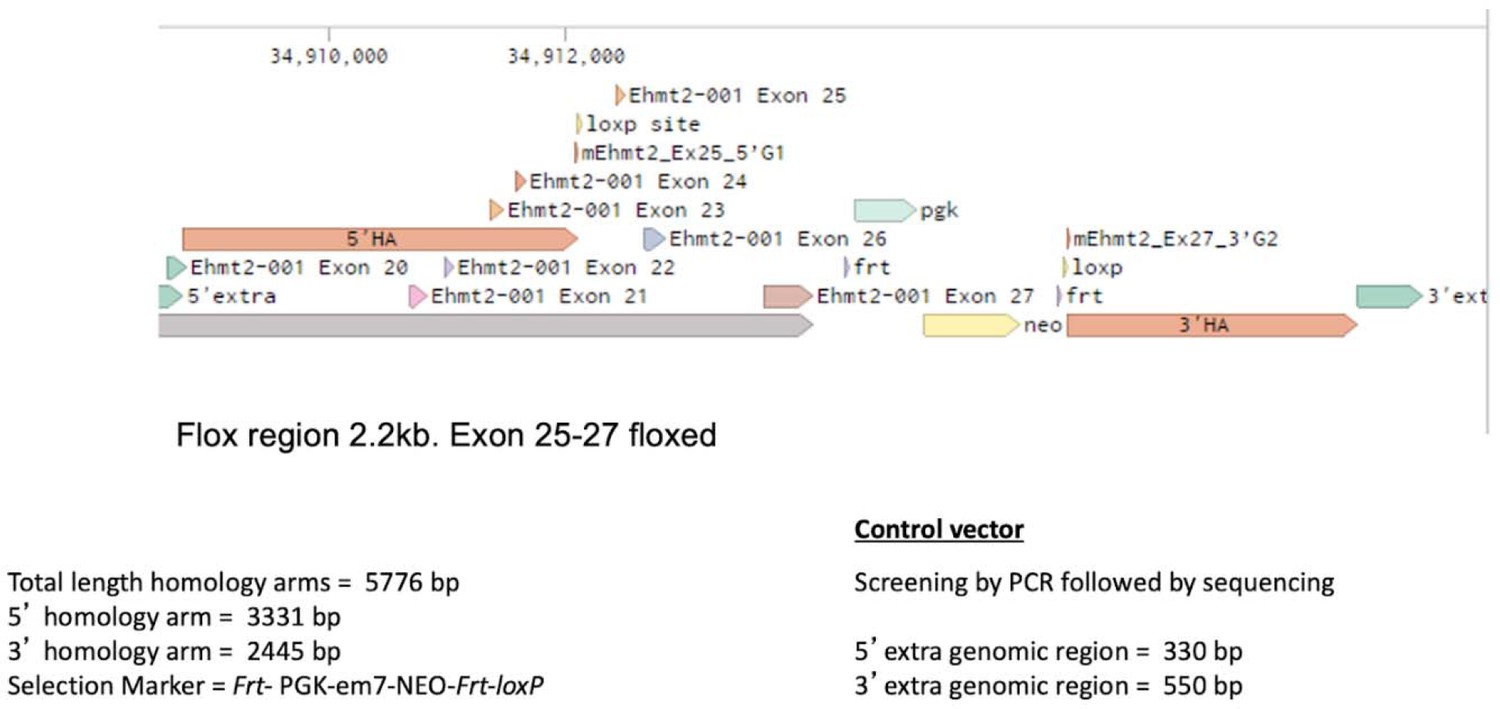
Ehmt2 CKO-Genomic Structure.
Author response image 1
Author response image 2
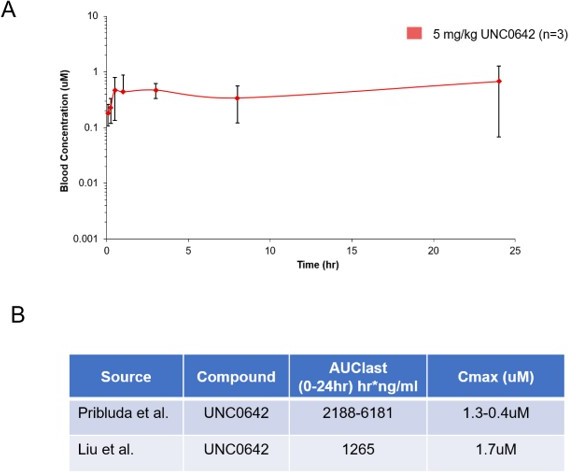
Pharmacokinetic behavior of UNC0642: (A) concentration from plasma measured at 8 time points with 3 animals per time point after a single 5 mg/kg intraperitoneal dose of UNC0642 using a PEG400/H2O (60/40) formulation.
(B) Summary table of observed parameters from Liu et al., 2013 and Pribluda et al. Note no formulation information is available from Liu et al., 2013.
Author response image 3
Author response image 4
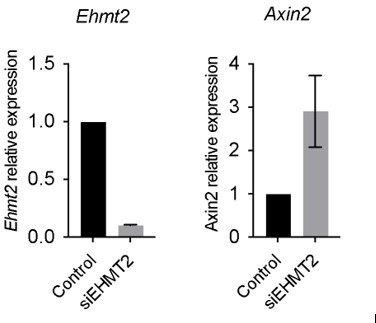
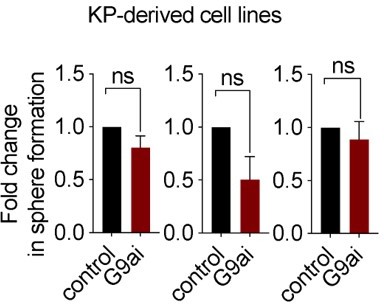
4 day knockdown with siRNA hairpin targeting G9a.
Author response image 5

Tables
Key resources table
| Reagent type (species) or resource | Designation | Source or reference | Identifiers | Additional information |
|---|---|---|---|---|
| Cell lines (Homo-sapiens) | A549 | ATCC | CRM-CCL-185 | Short tandem repeat profiling, SNP fingerprinting, and mycoplasma testing were used for strict quality control. |
| Cell lines (Homo-sapiens) | MRC5 | ATCC | CCL-171 | Short tandem repeat profiling, SNP fingerprinting, and mycoplasma testing were used for strict quality control. |
| Cell lines (Homo-sapiens) | RKO | ATCC | CRL-2577 | Short tandem repeat profiling, SNP fingerprinting, and mycoplasma testing were used for strict quality control. |
| Antibody | (rat monoclonal); CD45 biotin conjugated | BD Biosciences | 553078; clone 20-F11 | (1:200) |
| Antibody | (rat monoclonal);Ter119 biotin conjugated | BD Biosciences | 553672; clone Ter119 | (1:200) |
| Antibody | (goat polyclonal); clone MEC13.3; CD31 biotin conjugated | BD Biosciences | 553371 | (1:200) |
| Antibody | (rat monoclonal); CD24 PerCP-eFluor 710 | eBioscience | 46–0242 | (1:300) |
| Antibody | (rat monoclonal); EPCAM-FITC | Biolegend | 118208; Clone G8.8 | (1:20) |
| Antibody | (rat monoclonal); ITGB4-PE | Biolegend | 123602; clone 346–11 A | (1:20) |
| Antibody | (armenian hamster monoclonal); Notch1-APC | Biolegend | 130613; clone HMN1-12 | (1:80) |
| Antibody | (armenian hamster monoclonal); Notch2-APC | Biolegend | 130714; clone HMN2-35 | (1:80) |
| Antibody | (armenian hamster monoclonal); Notch3-APC | eBioescience | 17-5763-82; clone HMN3-133 | (1:80) |
| Antibody | (armenian hamster monoclonal); Notch4-APC | Biolegend | 128413; clone HMN4-14 | (1:80) |
| Antibody | (rat monoclonal); Fc-Block | BD Biosciences | 553141; clone 2.4 /G2 | (1:1000) |
| Antibody | (mouse monoclonal); CD74-BUV395 | BD Biosciences | 740274; clone ln-1 | (1:25) |
| Antibody | (rabbit polyclonal); Pro-SPC | Abcam | ab170699 | (1:200) |
| Antibody | (rabbit monoclonal); G9a | Abcam | ab185050; clone EPR18894 | (1:1000) |
| Antibody | (mouse monoclonal); Podoplanin | ThermoFisher | MA5-16113; clone 8.1.1 | (1:200) |
| Antibody | (rabbit polyclonal); Alexa Fluor 488 | ThermoFisher | A-21206 | (1:500) |
| Antibody | (mouse monoclonal); BrdU | NeoMarkers | MS-1058-PO; clone BRD.3 | (1:200) |
| Antibody | (mouse monoclonal); Cleaved Caspase-3 | Cell signaling Technology | 9661 | (1:300) |
| Antibody | (rabbit polyclonal); CC10 | SantaCruz Biotechnology | 9772 | (1:200) |
| Antibody | (mouse monoclonal); FoxJ1 | eBioscience | 14-9965-82; clone 2A5 | (1:25) |
| Antibody | (rat monoclonal); Rage | R&D Systems | 175410; clone MAB1179 | (1:100) |
| Antibody | (mouse monoclonal); Actin | BD Biosciences | 612656; clone C4 | (1:20,000) |
| Antibody | (rabbit polyclonal); Axin2 | Abcam | 109307; clone EPR2005 | (1:100) |
| Antibody | (mouse monoclonal); H3K9me2 | Abcam | Ab1220 | (1:1000) |
| Antibody | (rabbit polyclonal); RUVBL2 | Bethyl Laboratories | A302-536 | Western |
| Antibody | (mouse monoclonal); Beta-catenin | BD Biosciences | 610153 | Western |
| Antibody | (rabbit polyclonal); H3K9me3 | Active Motif | 39161 | (1:1000) |
| Antibody | (mouse monoclonal); Histone H3 | Cell Signaling Technology | 3638; clone 96C10 | (1:1000) |
| Antibody | (rabbit polyclonal); RUVBL2 | Bethyl Laboratories | A5302-537A | Immunoprecipitation |
| Antibody | (rabbit polyclonal); Beta-catenin | ThermoFisher | 71–2700 | Immunoprecipitation |
| Chemical compound, drug | PE/Cy7 Streptavidin | Biolegend | 405206 | (1:300) |
| Chemical compound, drug | UNC0642 | Biotechne | 5132 | |
| Chemical compound, drug | CHIR99021 | Biotechne | 4423 | |
| Commercial assay, kit | Matrigel | Corning | 356231 | |
| Commercial assay, kit | Dynabeads Co-IP kit | ThermoFisher | 14–321 | |
| Commercial assay, kit | PerfeCTa | QuantaBio | 95146–005 | |
| Commercial assay, kit | True-ChIP Kit | Diagenode | C01010140 | |
| Commercial assay, kit | SAGM media | Lonza | CC-3118 | |
| Commercial assay, kit | Collagenase/Dispase | Roche | COLLD-RO | 2 ug/ml final concentration |
| Transfected construct (bacteriophage P1) | Adeno CMV-Cre | Baylor College of Medicine | Adeno CMV-Cre | Concentration 1.2 × 10⁷ plaque-forming units |
| Transfected construct (bacteriophage P1) | Adeno-Flp-Ires-Cre | Baylor College of Medicine | Adeno-Flp-Ires-Cre | Concentration 1.2 × 10⁷ plaque-forming units |
| Transfected construct (bacteriophage P1) | AAV9-Cre | Virovek | AAV9-Cre | 2E13 vg/ml dilution 1:60 in 60 ul vol. |
| Other | Bioruptor Pico | Diagenode | B01080010 | |
| Other | Influx cell sorter | BD Biosciences | NA | |
| Software, algorithm | Flowjo | BD Biosciences | Flowjo.com | |
| Software, algorithm | ImageJ | ImageJ | https://imagej.nih.gov/ij/ |
-
Primer sequences included in Supplementary file 2.
-
SPC: surfactant protein C.
Additional files
-
Supplementary file 1
Summary of transcripts with 100% sequence identify to shEhmt2a seed sequence reported in Rowbotham et al., 2018.
The seed for shEhmt2 was queried in NCBI BLAST and the resulting query results are shown.
- https://cdn.elifesciences.org/articles/57648/elife-57648-supp1-v2.docx
-
Supplementary file 2
Primer sequences.
- https://cdn.elifesciences.org/articles/57648/elife-57648-supp2-v2.docx
-
MDAR checklist
- https://cdn.elifesciences.org/articles/57648/elife-57648-mdarchecklist1-v2.pdf
Download links
A two-part list of links to download the article, or parts of the article, in various formats.
Downloads (link to download the article as PDF)
Open citations (links to open the citations from this article in various online reference manager services)
Cite this article (links to download the citations from this article in formats compatible with various reference manager tools)
EHMT2 methyltransferase governs cell identity in the lung and is required for KRAS G12D tumor development and propagation
eLife 11:e57648.
https://doi.org/10.7554/eLife.57648


