Increased longevity due to sexual activity in mole-rats is associated with transcriptional changes in the HPA stress axis
- Computational Biology Group, Leibniz Institute on Aging – Fritz Lipmann Institute, Germany
- Core Facility Life Science Computing, Leibniz Institute on Aging – Fritz Lipmann Institute, Germany
- Institute of Physiology, University Hospital, University of Duisburg-Essen, Germany
- Core Facility Sequencing, Leibniz Institute on Aging – Fritz Lipmann Institute, Germany
- Department of General Zoology, Faculty of Biology, University of Duisburg-Essen, Germany
- Department of Game Management and Wildlife Biology, Faculty of Forestry and Wood Sciences, Czech University of Life Sciences, Czech Republic
- Institute of Pathology and Neuropathology, University Hospital, University of Duisburg-Essen, Germany
- Department of Zoology, University of South Bohemia, Czech Republic
- Department of Nuclear Medicine, University Hospital, University of Duisburg-Essen, Germany
- Central Animal Laboratory, University Hospital, University of Duisburg-Essen, Germany
Figures
Figure 1 with 1 supplement

Motivation (A) and principle of the experimental setup (B).
(A) For both species of the Fukomys genus that were examined in this study – Fukomys mechowii and Fukomys micklemi – it was shown that, in captivity, breeders live significantly longer than non-breeders. Lifespan data were redrawn from Dammann and Burda, 2006 and Dammann et al., 2011. (B) Schematic overview of animal treatments. Non-breeders (open shapes) are offspring of the breeder pair of their family (filled shapes) and do not mate with other members of the same family because of incest avoidance in Fukomys (Burda, 1995). Therefore, non-breeders of opposite sexes were taken from different families – labeled as ‘Family A’ (blue) and ‘Family B’ (red) – and permanently housed in a separate terrarium. The two unrelated animals mated with each other, thus producing offspring and becoming breeders of the new ‘Family C’ (green). In addition to the animals that were promoted to be slower-aging breeders, age-matched controls that remained in the faster-aging non-breeders of ‘Family A’ and ‘Family B’ were included in our study – in most cases full siblings (ideally litter mates) of the respective new breeders. After at least 2 years and two pregnancies in ‘Family C’, breeders from ‘Family C’ and their controls from Colonies A and B were put to death, and tissues were sampled for later analysis, which included identification of differentially expressed genes. The shown experimental scheme was conducted with 5–7 (median 6) specimens per cohort (defined by breeding status, sex, species) and 12–15 tissues (median 14) per specimen: in total, 46 animals and 636 samples.
Figure 1—figure supplement 1
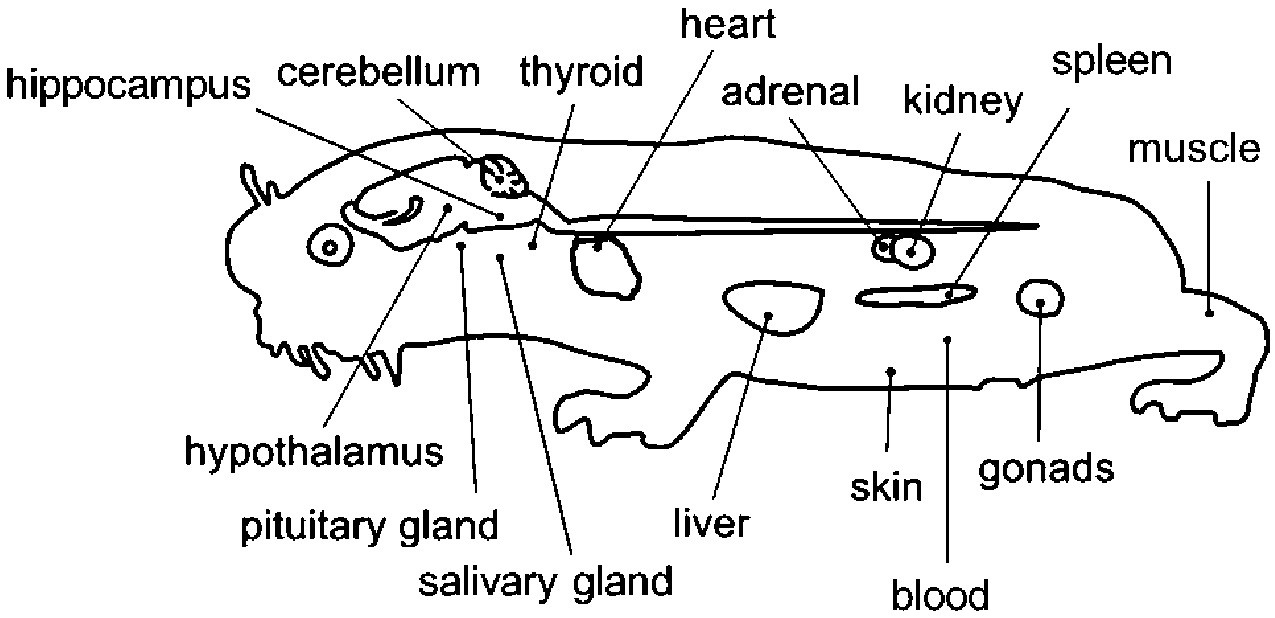
Overview of the tissues examined in this study with a schematic mole-rat representation.
Figure 2 with 2 supplements
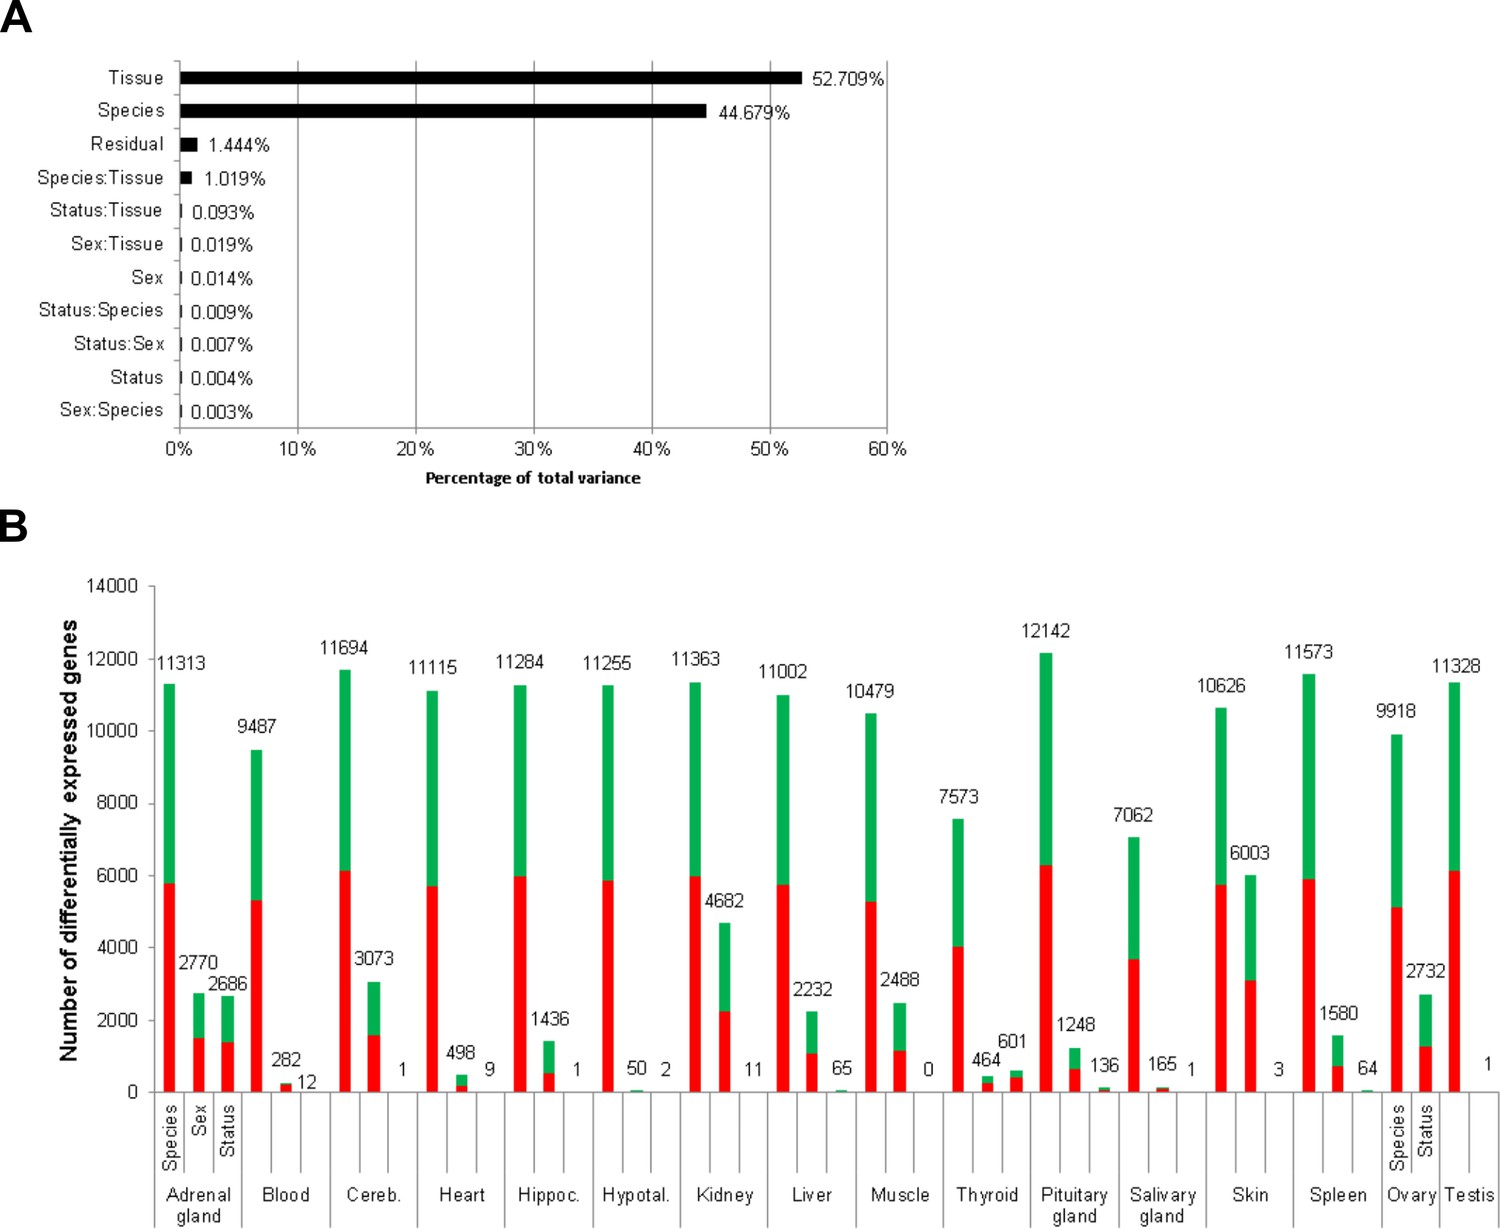
Total variance distribution (A) and numbers of differentially expressed genes (B).
(A) Relative contribution of the model factors (breeding status, sex, species, tissue) and their combinations (:) to the total variance in the examined data set. The relative contributions were determined by principal variance component analysis. (B) Numbers of identified differentially expressed genes per tissue and model factor (first column, species; second, sex; third, status). Stacked bars indicate the proportions of up- and down-regulated genes (red and green, respectively; directions: F. mechowii vs. F. micklemi, female vs. male, breeder vs. non-breeder).
Figure 2—figure supplement 1
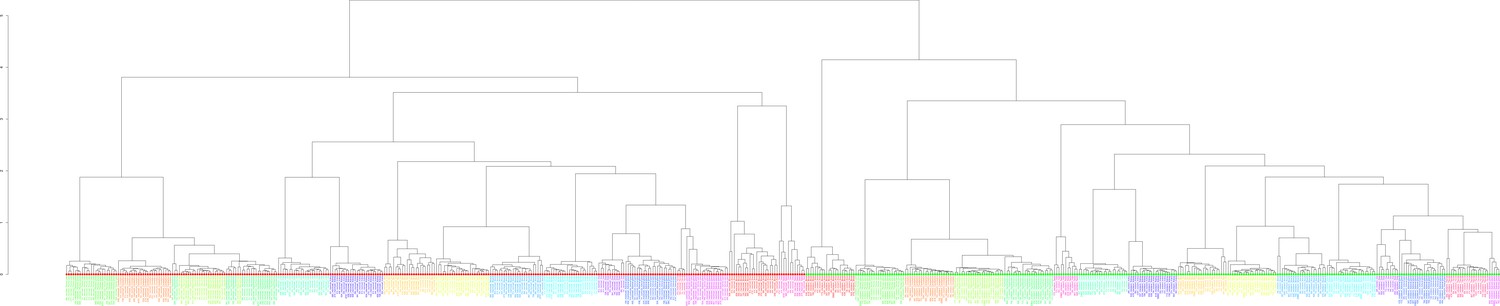
Clustering of the 636 examined samples.
Clustering was performed based on the Euclidean distance of logarithmized pairwise Pearson read count correlations according to the unweighted pair group method with arithmetic mean. Bigger sample labels, breeders; smaller sample, non-breeders.
Figure 2—figure supplement 2
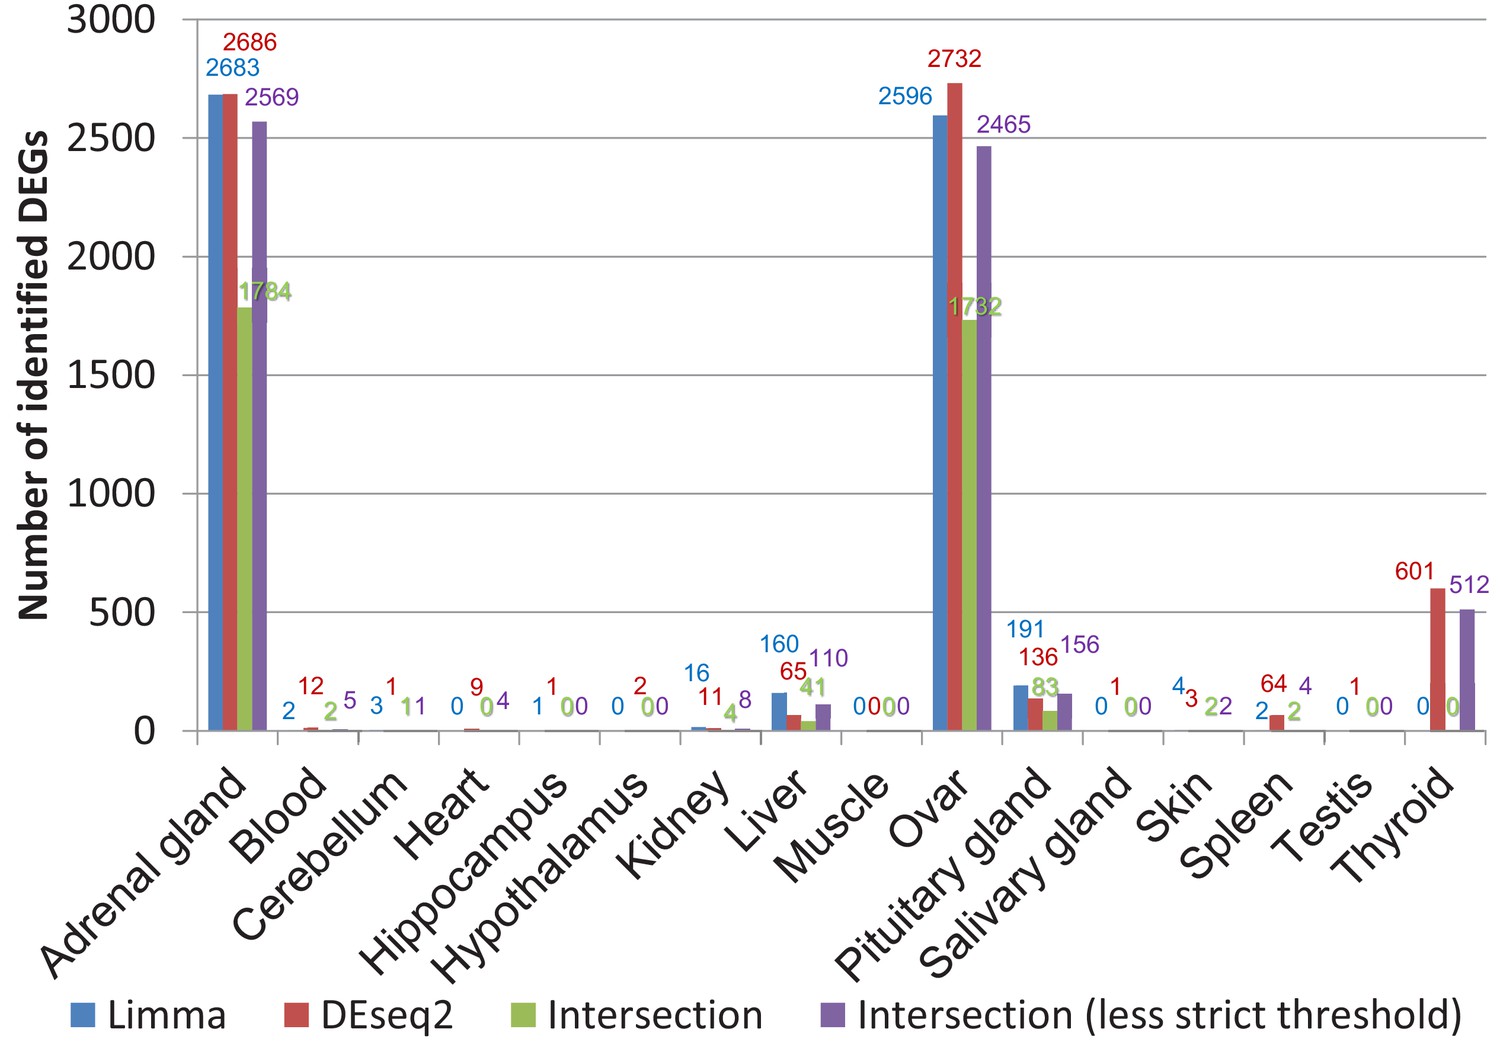
Comparison of differentially expressed genes identified by DESeq2 and limma (worker vs. breeders).
The false discovery rate (FDR) threshold used for both programs was 0.05. To account for the threshold effect, in a less strict approach all genes were counted that have an FDR < 0.05 with one program and an FDR < 0.1 with the respective other program.
Figure 3
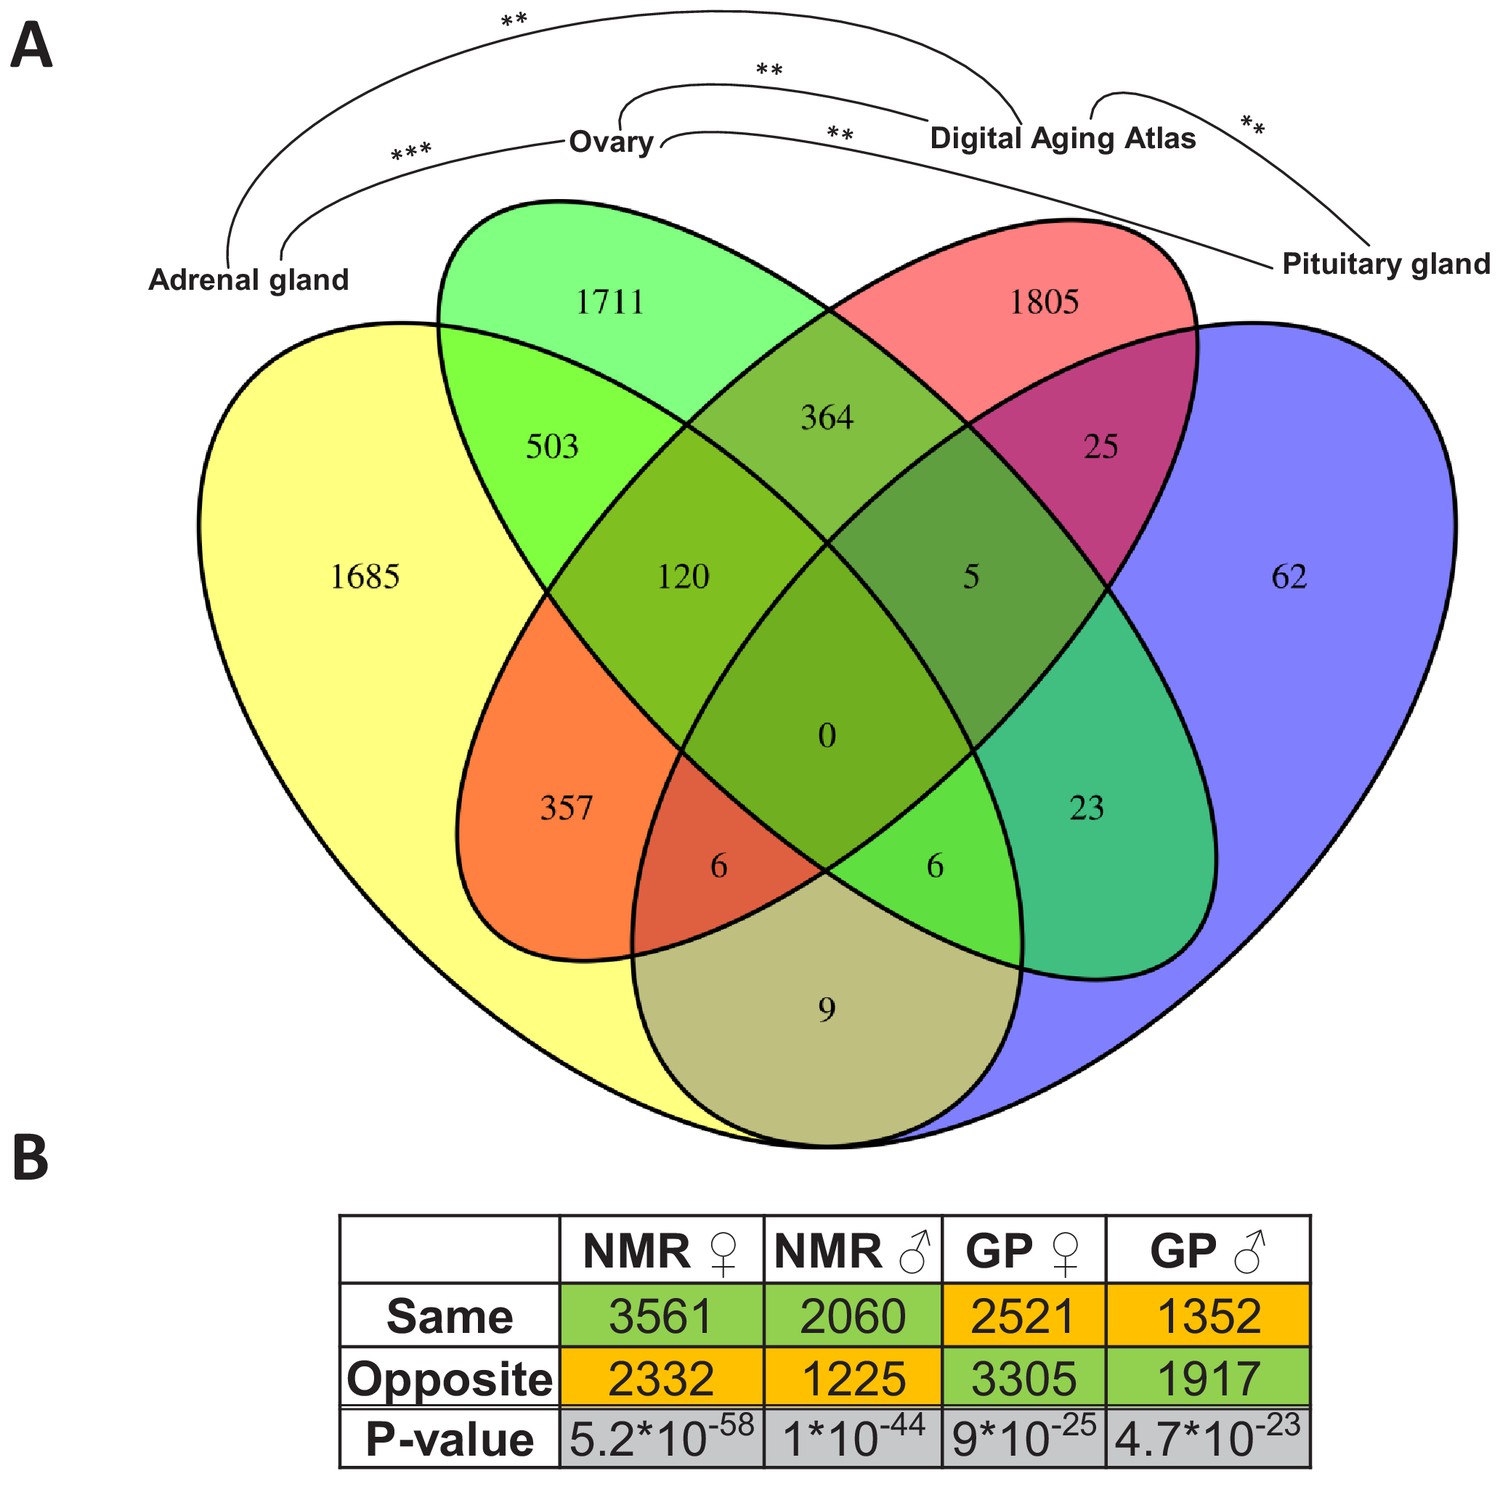
Assessment of the aging relevance of genes that are differentially expressed between breeders and non-breeders.
(A) For each tissue, we separately tested whether the identified differentially expressed genes between status groups significantly overlapped with the genes within the Digital Aging Atlas database (Fisher’s exact test, false discovery rate [FDR] < 0.05). Significant overlaps were found for three tissues: adrenal gland, ovary, and pituitary gland. The Venn diagram depicts the overlaps of these three tissues with the Digital Aging Atlas and with each other (**FDR < 0.01; ***FDR < 0.001). (B) A similar experiment comparing the transcriptomes of breeders vs. non-breeders was recently conducted in naked mole-rats (NMRs) and guinea pig (GPs) (Bens et al., 2018). For NMR, there is also evidence that breeders have a (slightly) longer lifespan than non-breeders, whereas for GP the opposite is assumed (Bens et al., 2018; Ruby et al., 2018). Across 10 tissues that were examined in both studies, the analysis determined whether status-dependent differentially expressed genes identified in the current study were regulated in the same or opposite direction in NMR and GP (Supplementary file 1f). The listed p-values (two-sided binomial exact test; hypothesized probability, 0.5) describe how extremely the ratio of genes expressed in the same and opposite directions deviates from a 50:50 ratio. Green and orange indicate the majority and minority of genes within a comparison, respectively. Figure created with BioRender.com.
Figure 4 with 11 supplements
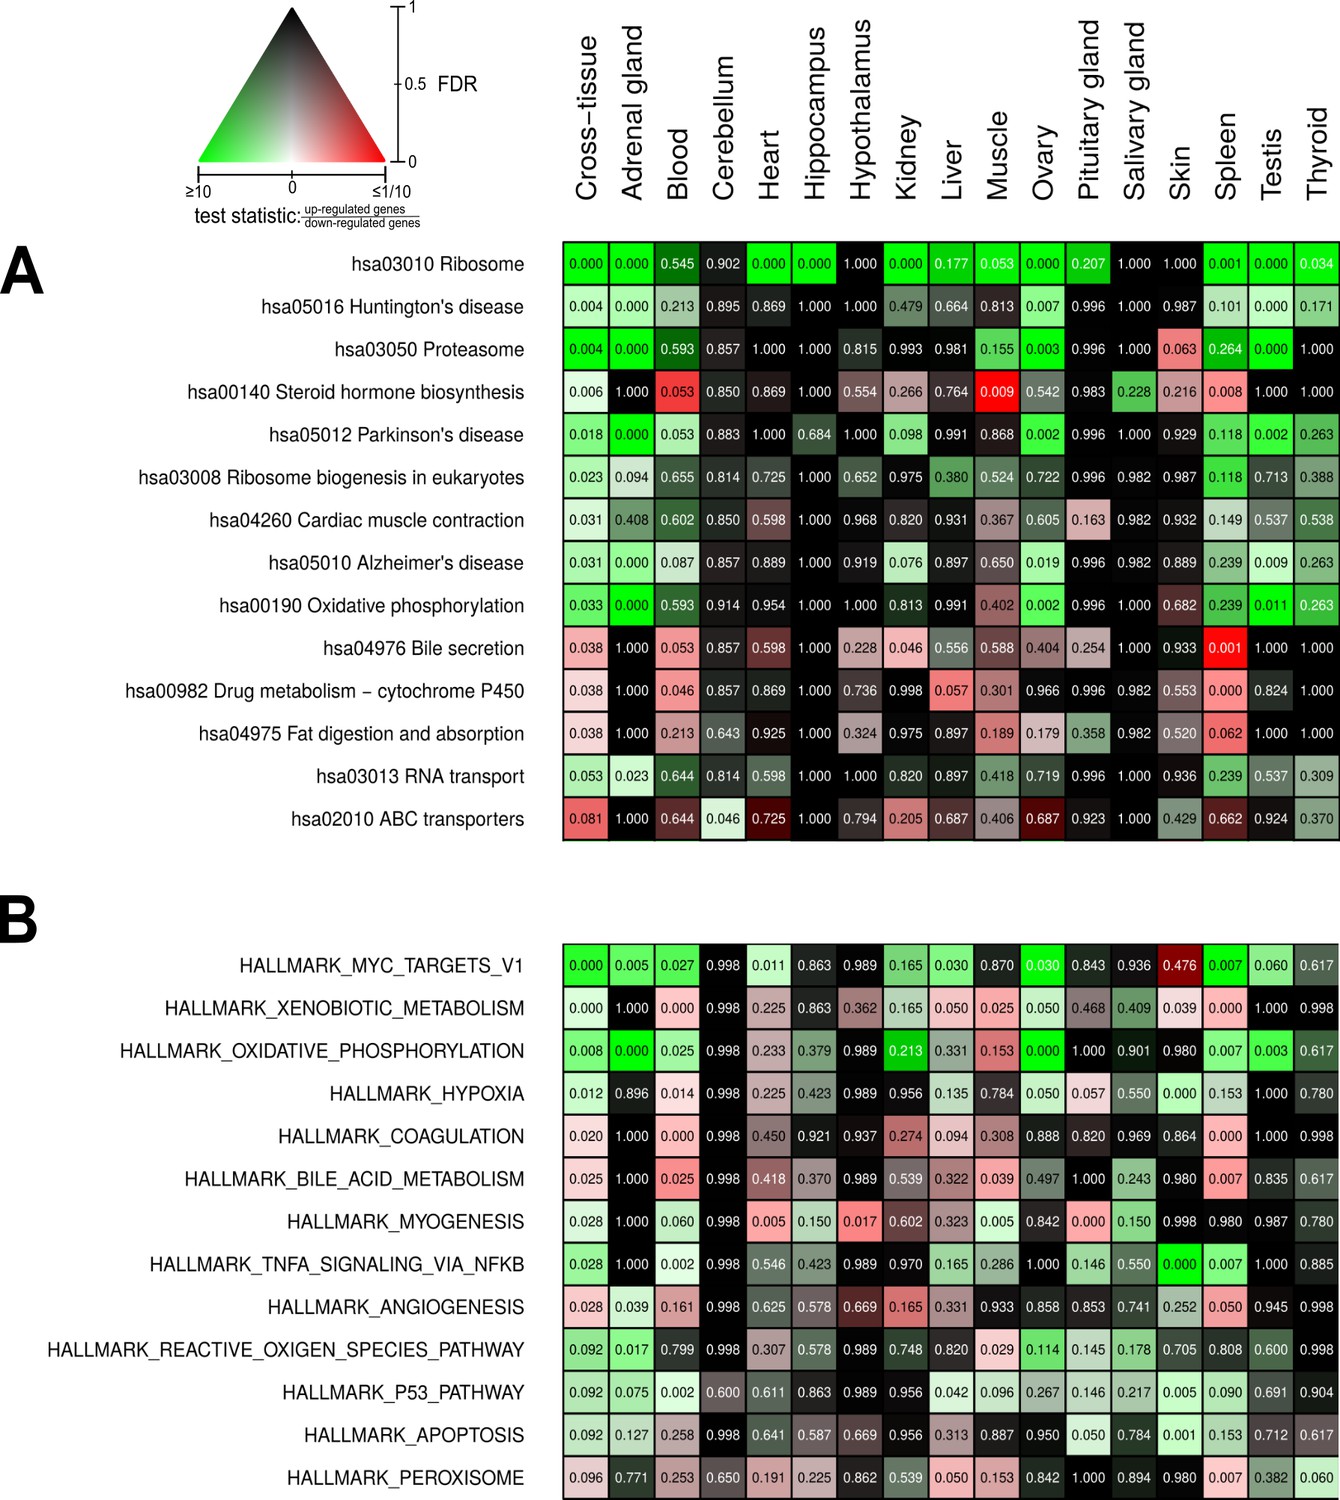
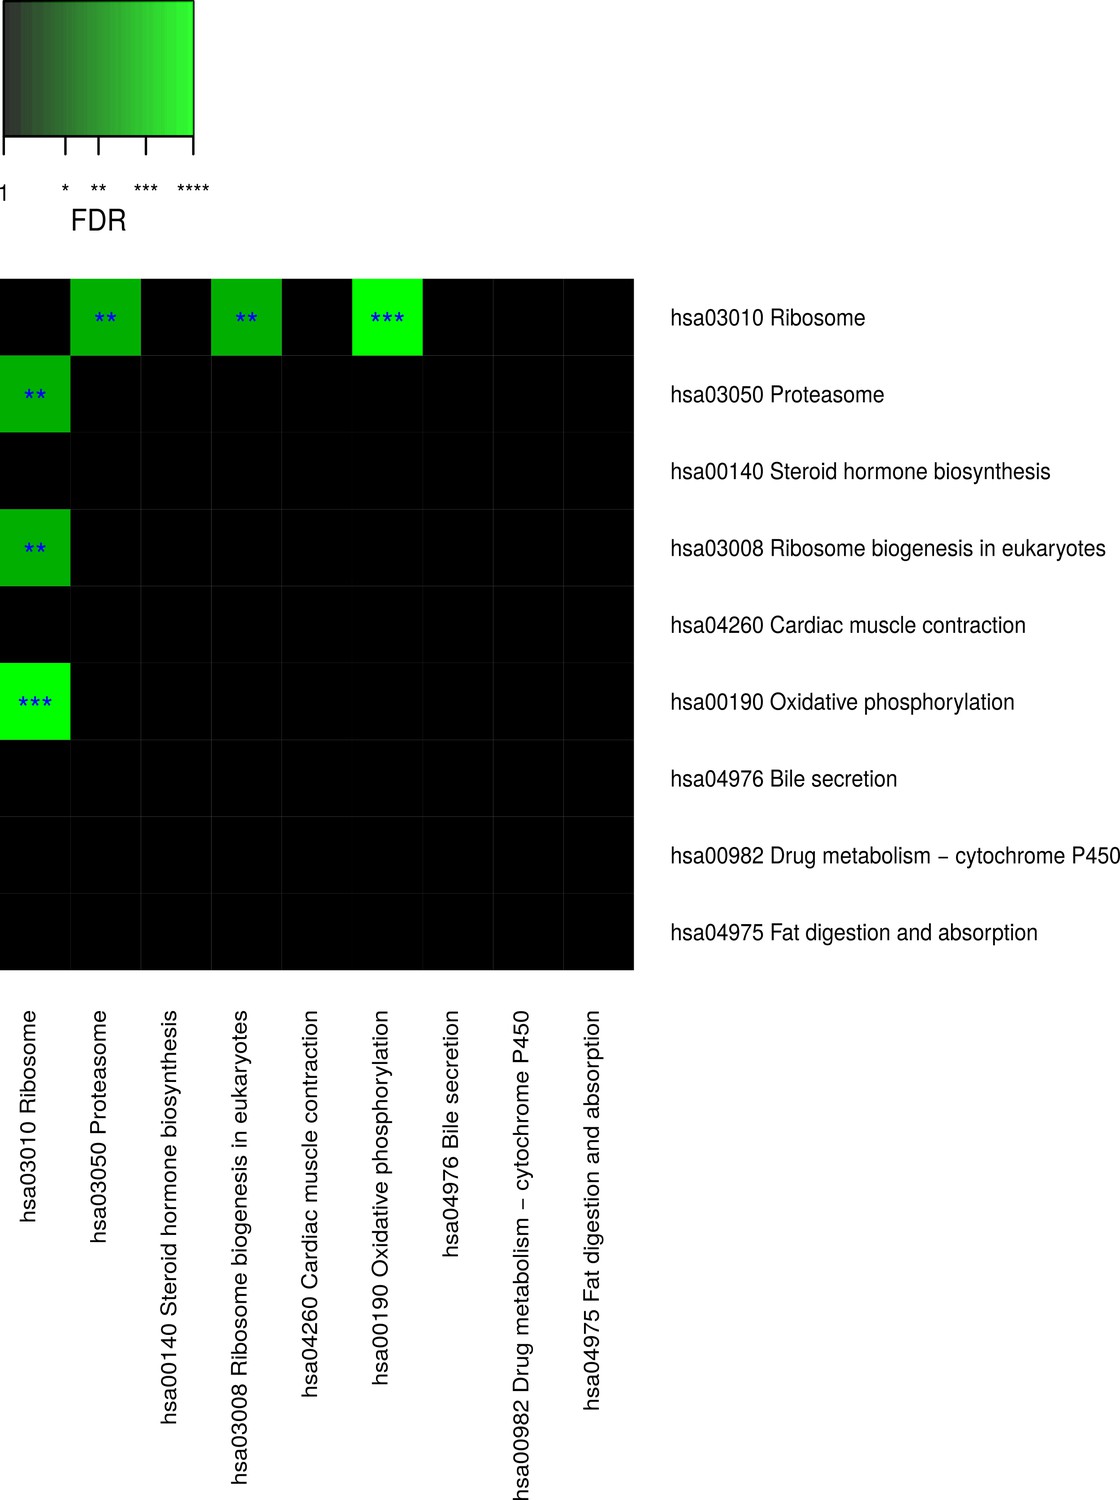
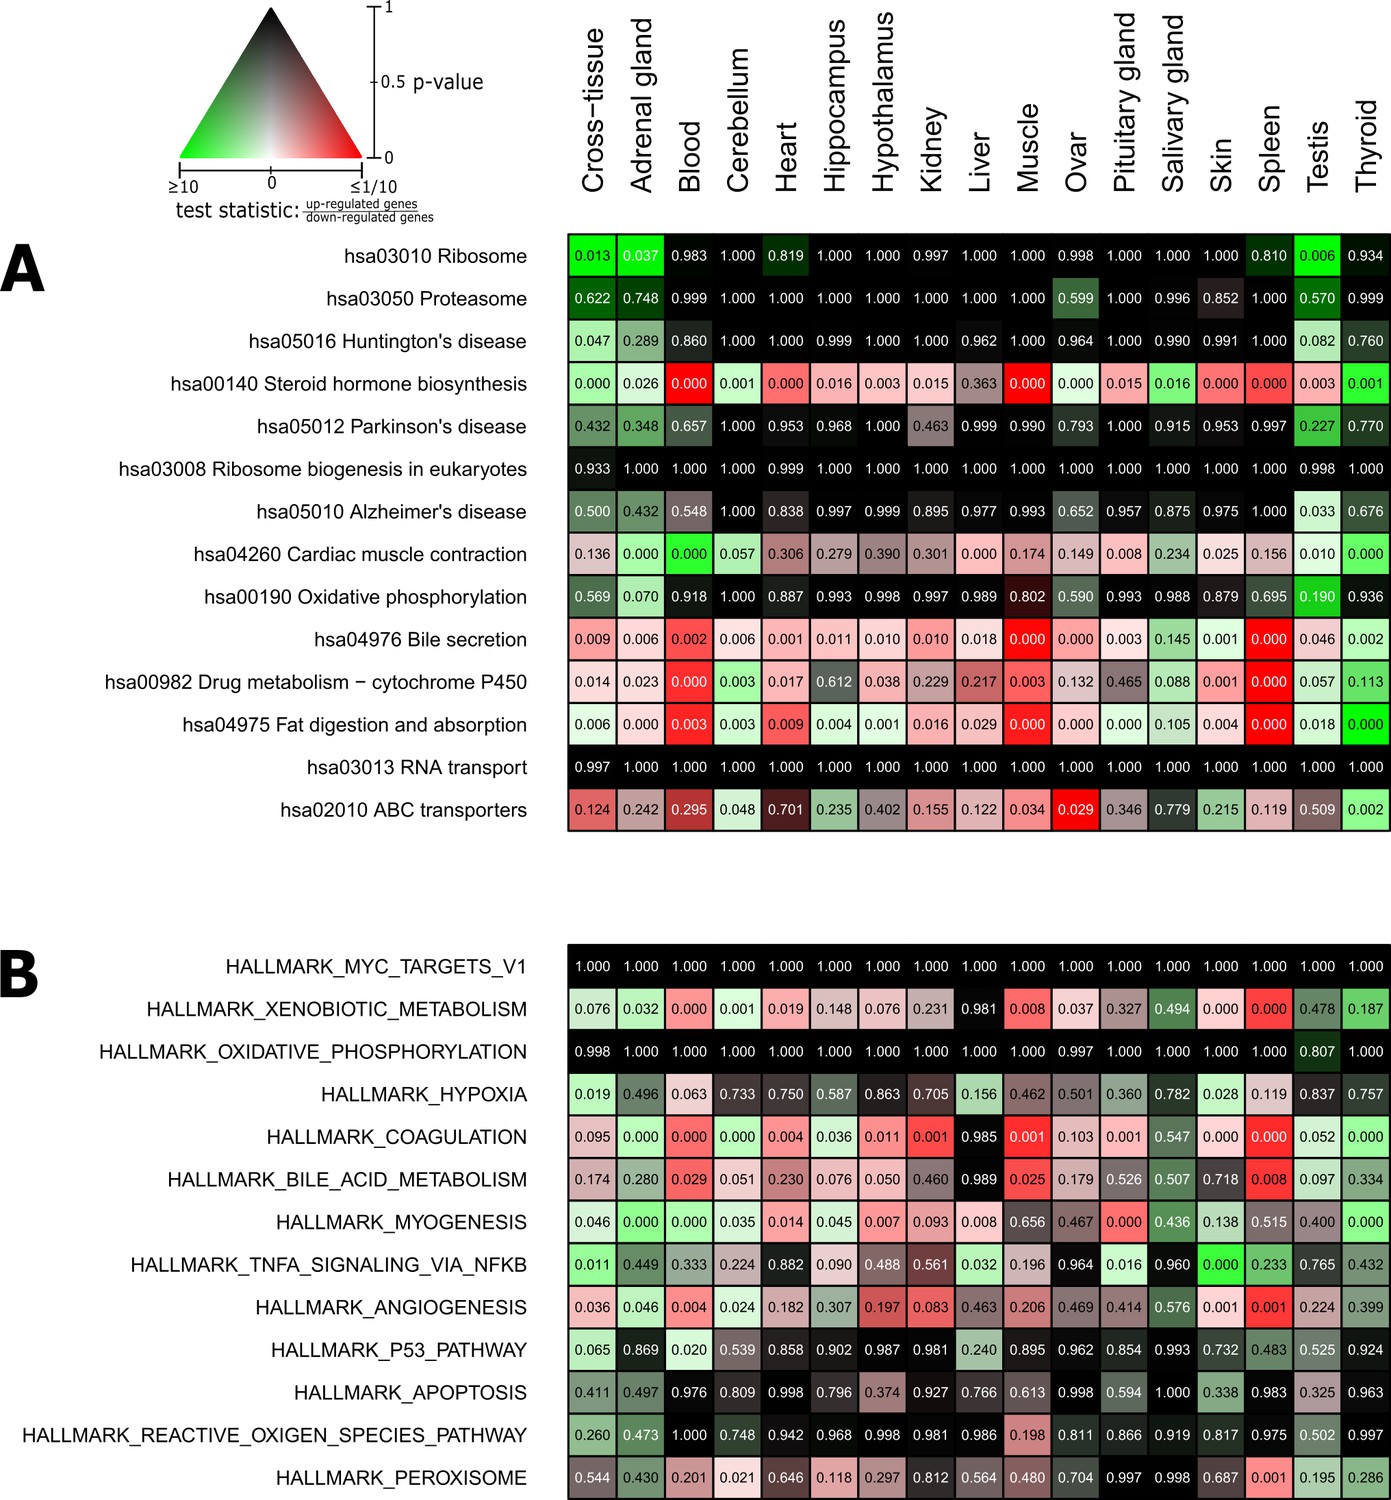
Pathways and metabolic functions enriched for status-dependent differential gene expression.
Shown are all Kyoto Encyclopedia of Genes and Genomes pathways (A) and Molecular Signatures Database hallmarks (B) that are enriched for differential gene expression between breeders and non-breeders at the weighted cross-tissue level (false discovery rate [FDR], <0.1). This enrichment analysis was carried out threshold-free, which is why tissues without differentially expressed individual genes (see Figure 2B) can also show differentially expressed pathways. The numbers within the cells give the FDR, that is, the multiple testing corrected p-value, for the respective pathway/hallmark and tissue. As indicated by the color key, red and green indicate up- or down-regulated in breeders, respectively. White indicates a pathway/hallmark that is significantly affected by differential expression and whose signals for up- and down-regulation are approximately balanced. Dark colors up to black mean that there is little or no evidence that the corresponding pathway/hallmark is affected by differential gene expression. Figure 4—figure supplements 1 and 2 provide detailed overviews of all pathways/hallmarks that are enriched in at least one tissue for status-dependent differential expression signals.
Figure 4—figure supplement 1
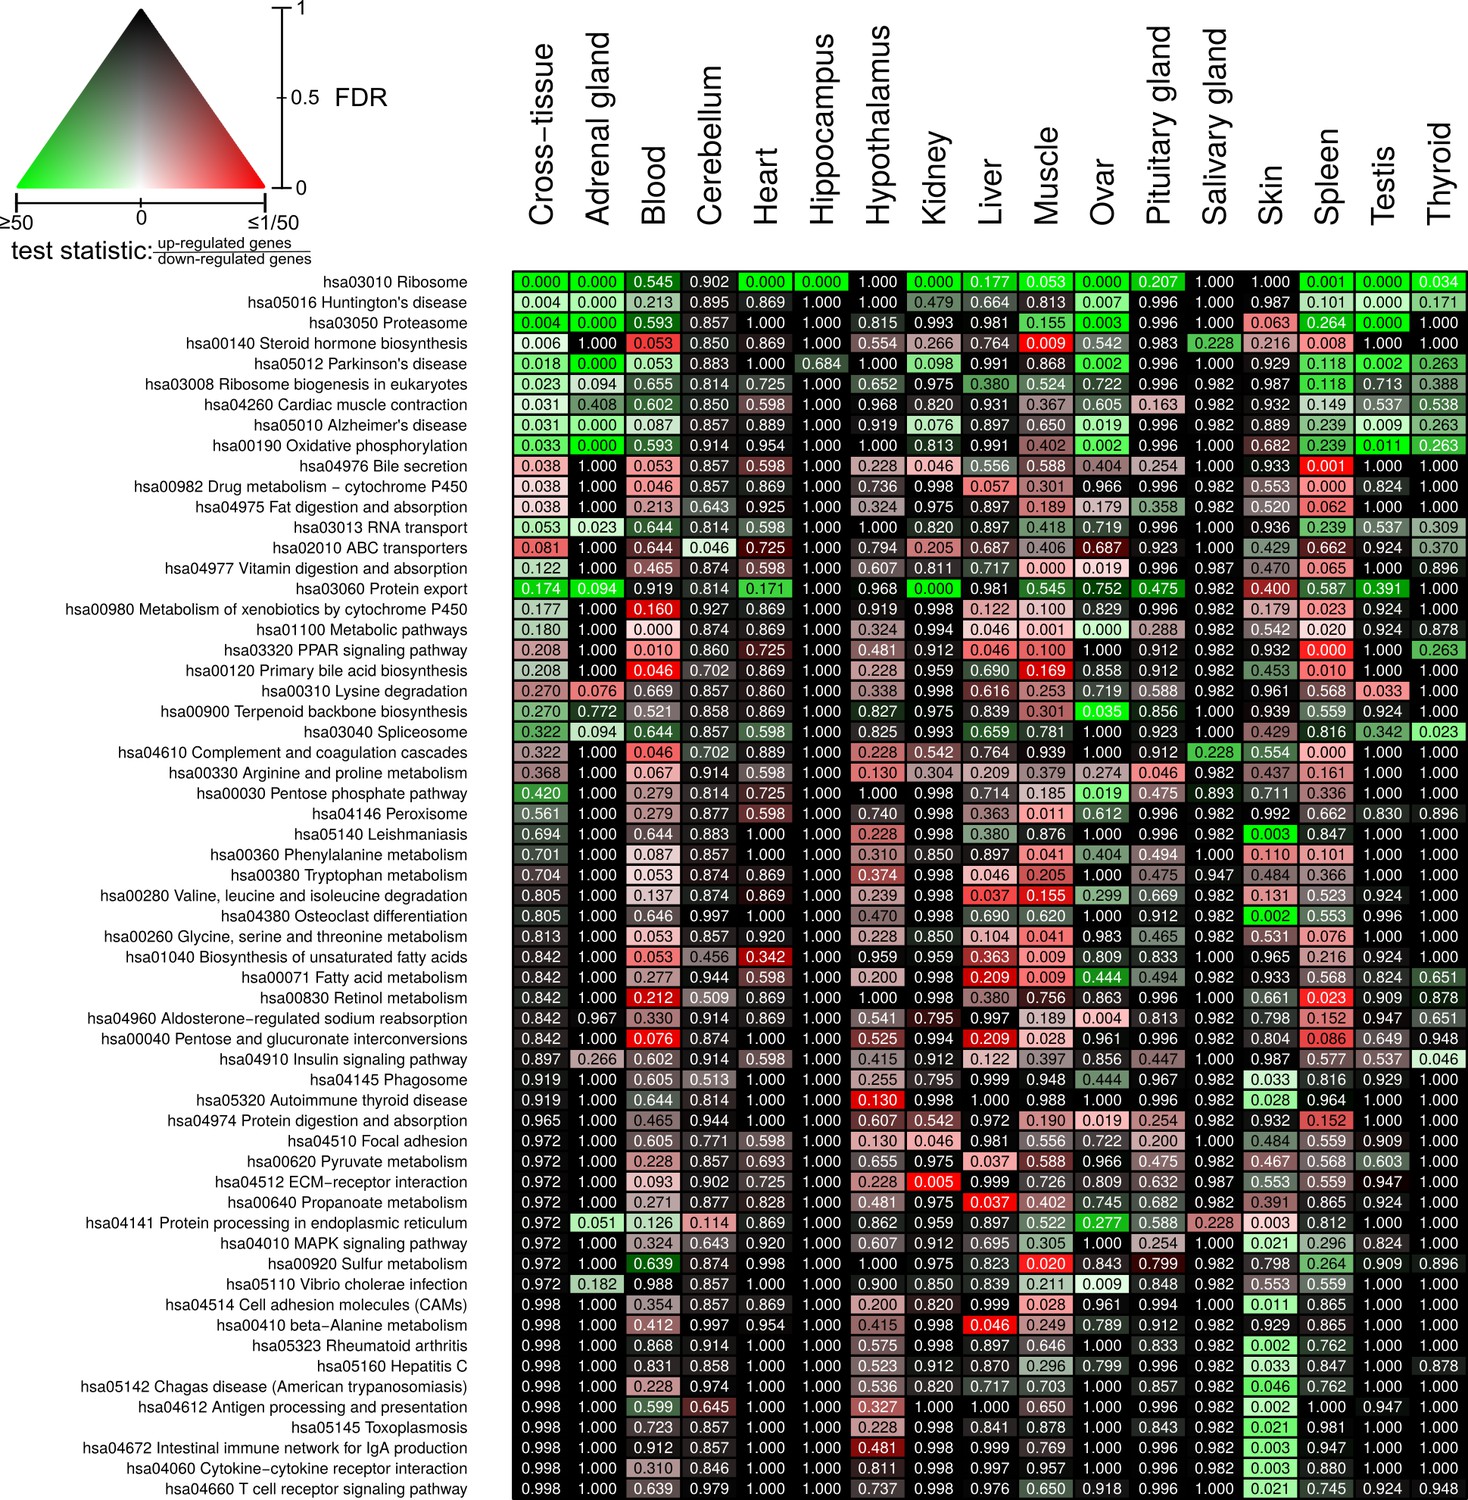
Full overview of Kyoto Encyclopedia of Genes and Genomes pathways that are enriched for status-dependent differential gene expression.
Listed are all pathways that show a significant differential expression signal (false discovery rate [FDR] < 0.05) in at least one of the tissues or on the cross-tissue level (FDR < 0.1).
Figure 4—figure supplement 2
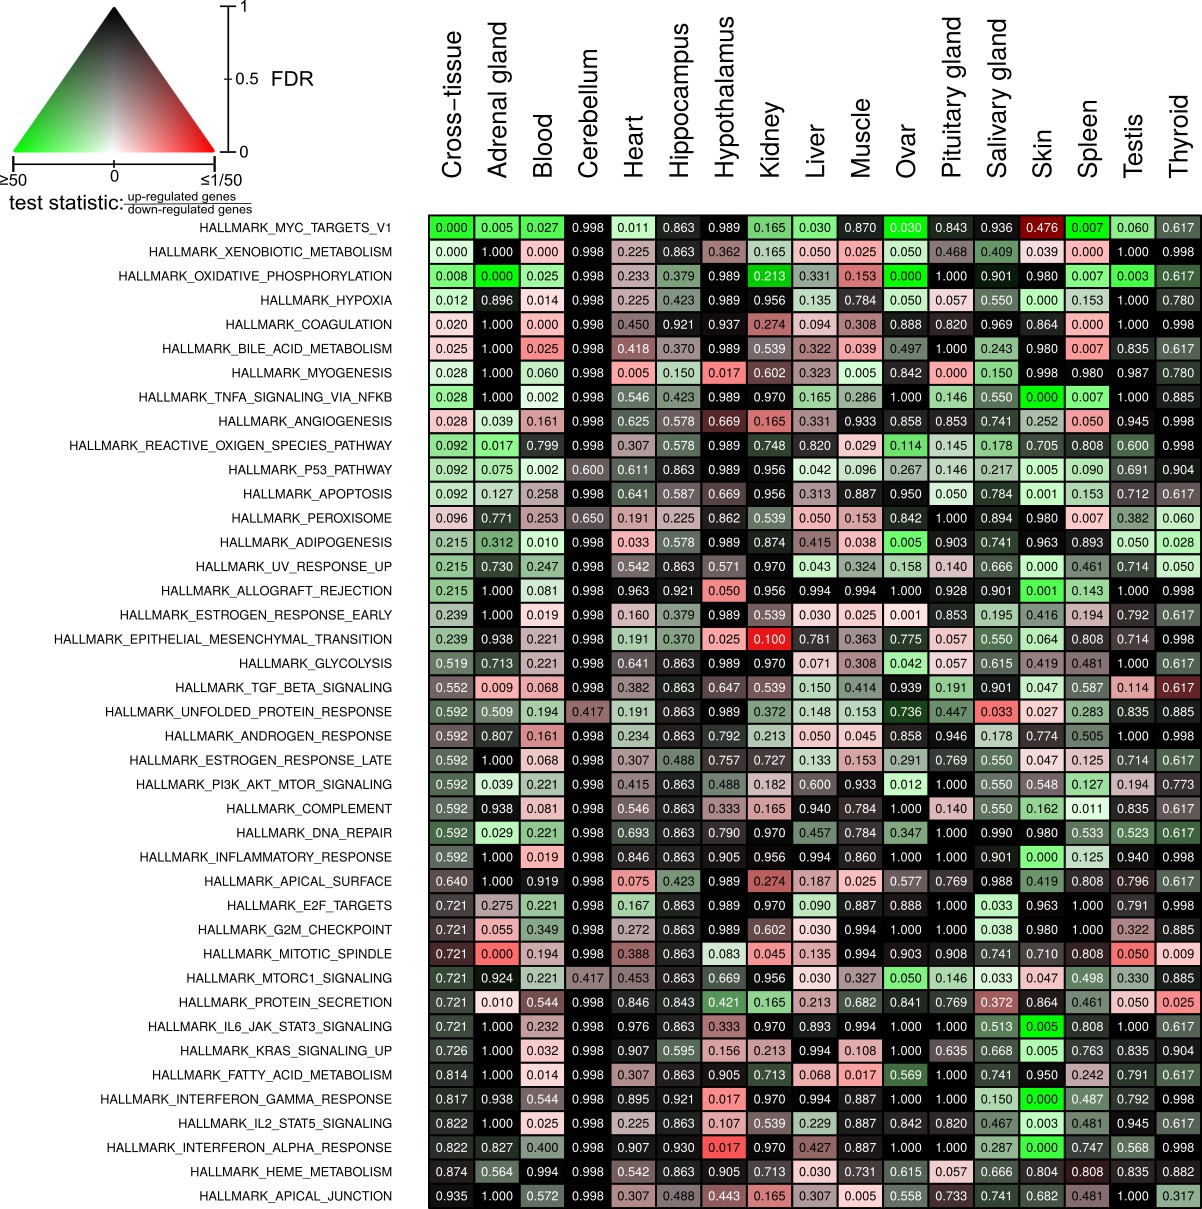
Full overview of Molecular Signatures Database hallmarks that are enriched for status-dependent differential gene expression.
Listed are all pathways that show a significant differential expression signal (false discovery rate [FDR] < 0.05) in at least one of the tissues or on the cross-tissue level (FDR < 0.1).
Figure 4—figure supplement 3
Pairwise connectivity of metabolic pathways that are enriched for caste-dependent differential gene expression at the cross-tissue level.
Pairwise pathway connectivities were determined based on read counts of all examined 636 samples via a weighted gene co-expression network analysis. Significance was determined against empirically estimated null distributions (see Materials and methods) The following three Kyoto Encyclopedia of Genes and Genomes pathways were excluded since the respective enrichments are likely to be only derivatives from other enrichments (see Results, Figure 4—figure supplements 5–7): ‘hsa05016 Huntington’s disease’, ‘hsa05012 Parkinson’s disease’, ‘hsa050 Alzheimer’s disease’. * False discovery rate (FDR) < 0.05, **FDR < 0.01, ***FDR < 0.001.
Figure 4—figure supplement 4
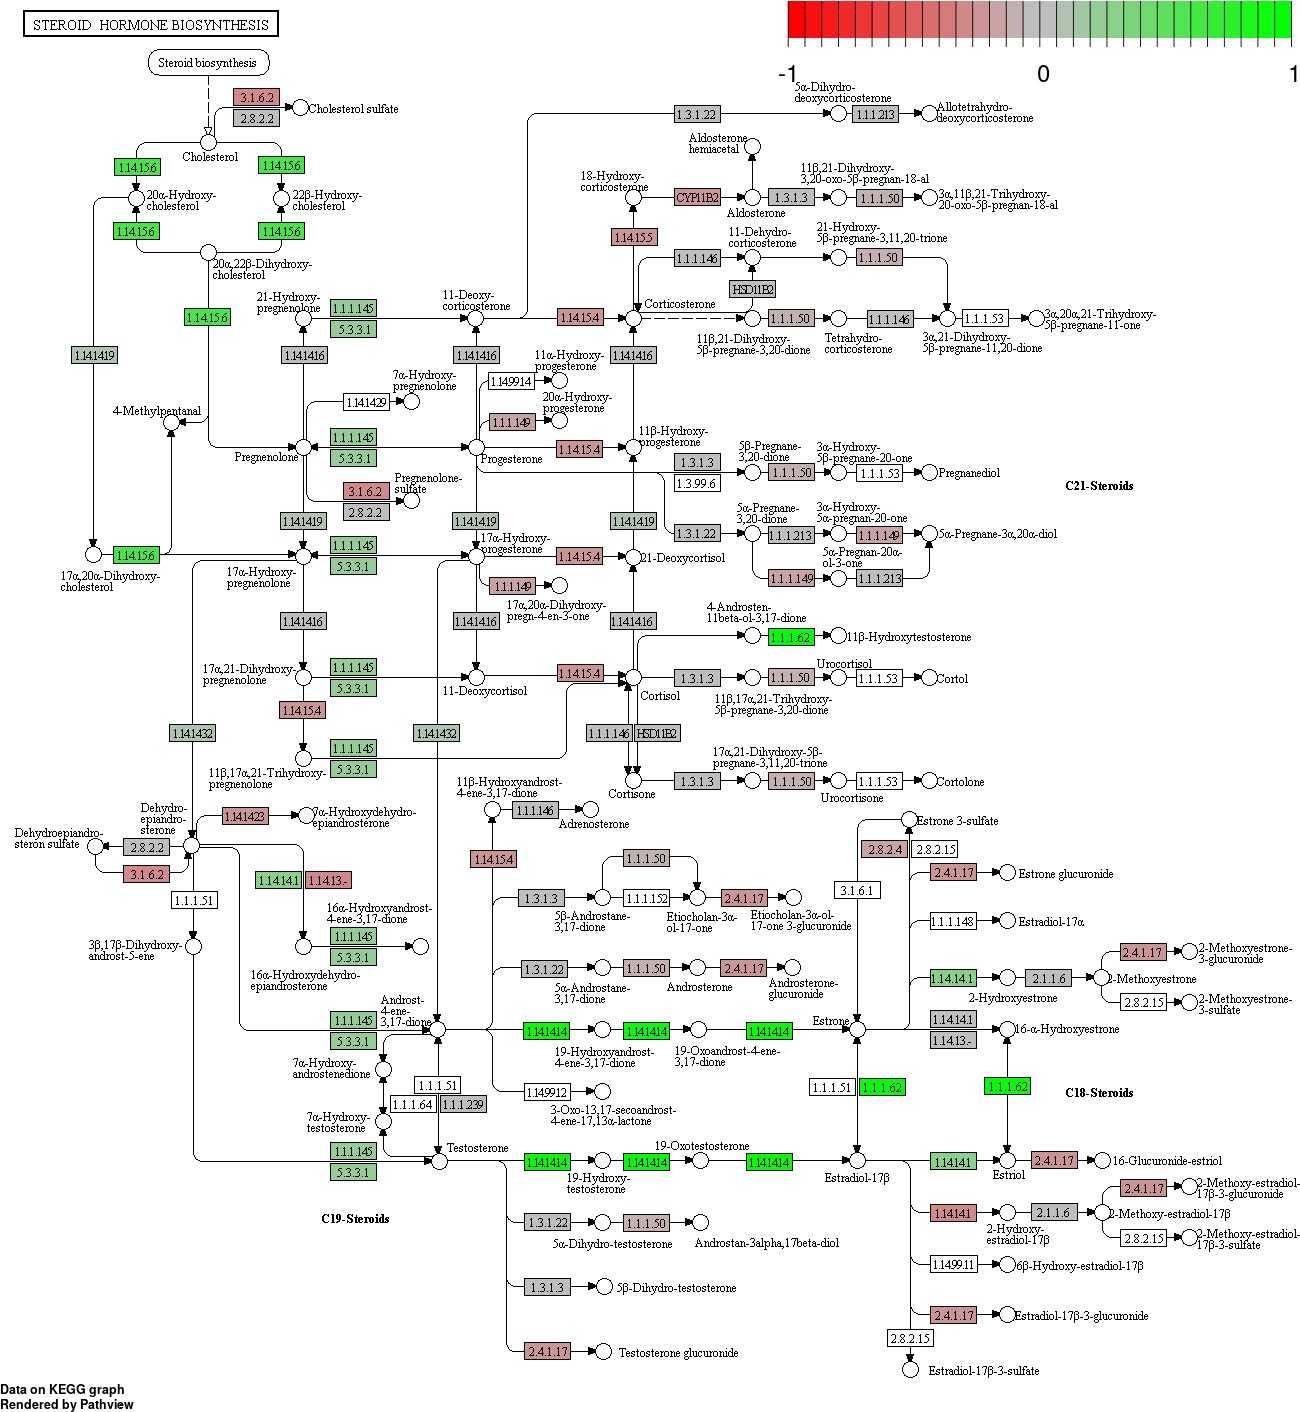
Status-dependent regulation of Kyoto Encyclopedia of Genes and Genomes pathway hsa00140 steroid hormone biosynthesis at the cross-tissue level.
Green/red color depicts the log2-fold-change (see legend for scale) with direction breeder/non-breeder.
Figure 4—figure supplement 5
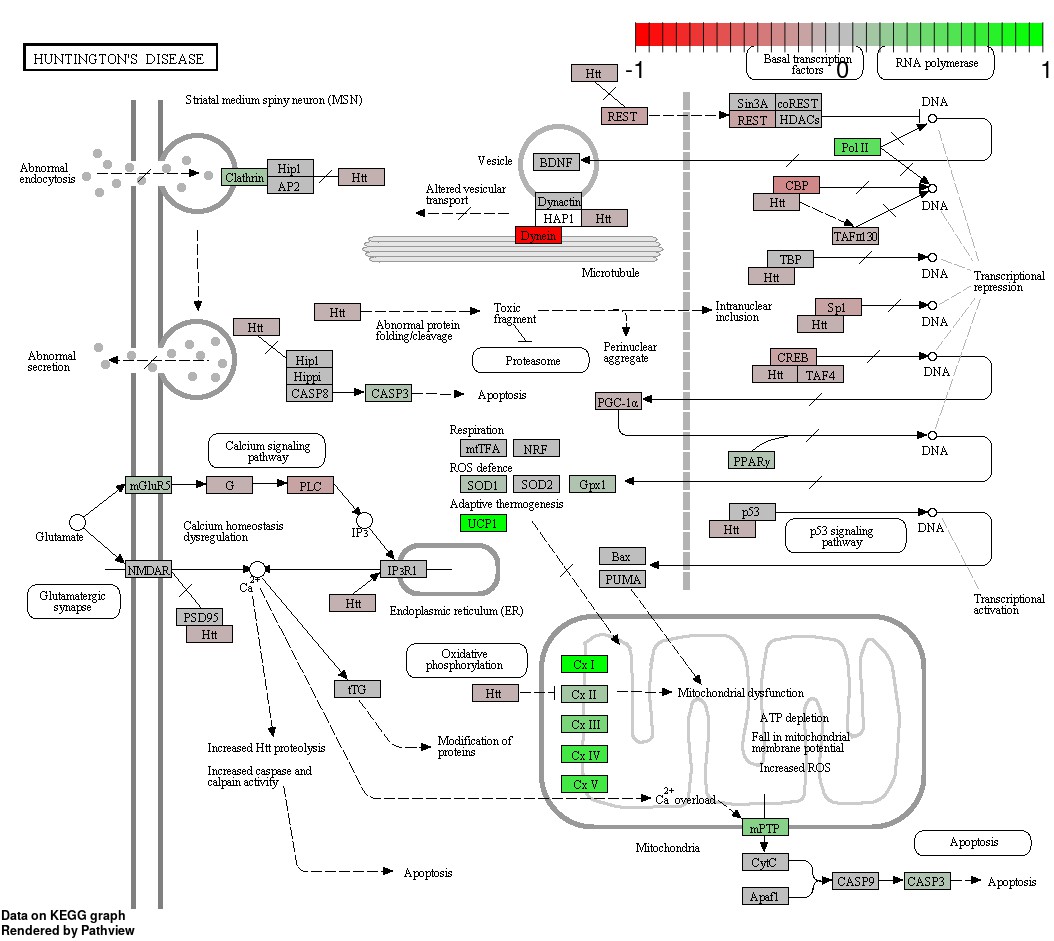
Status-dependent regulation of Kyoto Encyclopedia of Genes and Genomes pathway hsa05016 Huntington’s disease at the cross-tissue level.
The signal is mainly driven by the differential expression of the mitochondrial respiratory chain. Green/red color depicts the cross-tissue log2-fold-change (see legend for scale) with direction breeder/non-breeder.
Figure 4—figure supplement 6
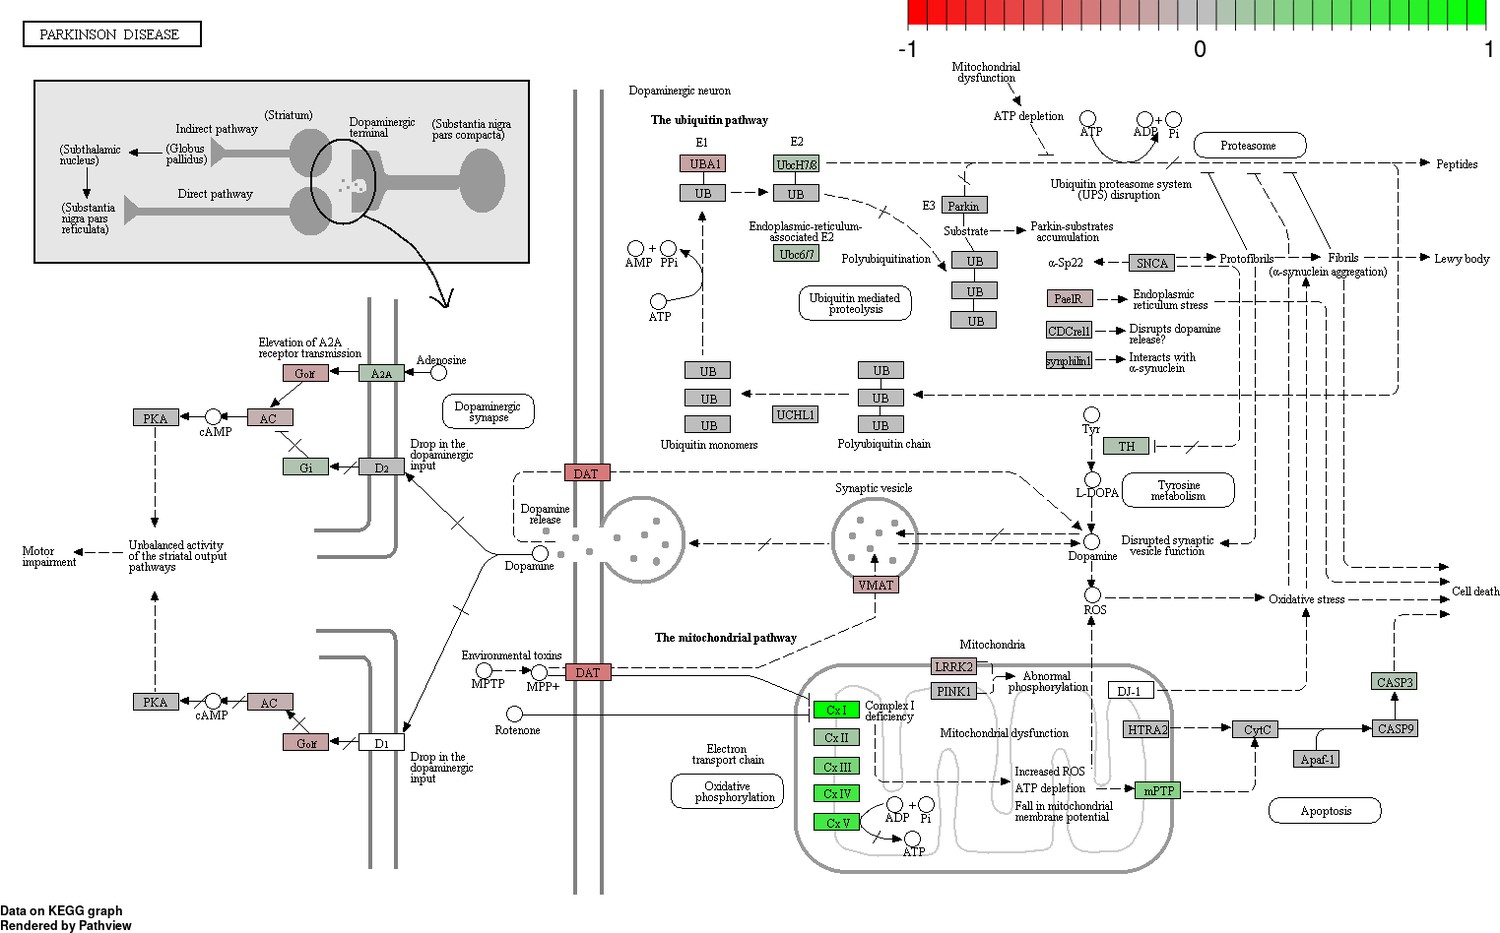
Status-dependent regulation of Kyoto Encyclopedia of Genes and Genomes pathway hsa05012 Parkinson’s disease at the cross-tissue level.
The signal is mainly driven by the differential expression of the mitochondrial respiratory chain. Green/red color depicts the cross-tissue log2-fold-change (see legend for scale) with direction breeder/non-breeder.
Figure 4—figure supplement 7
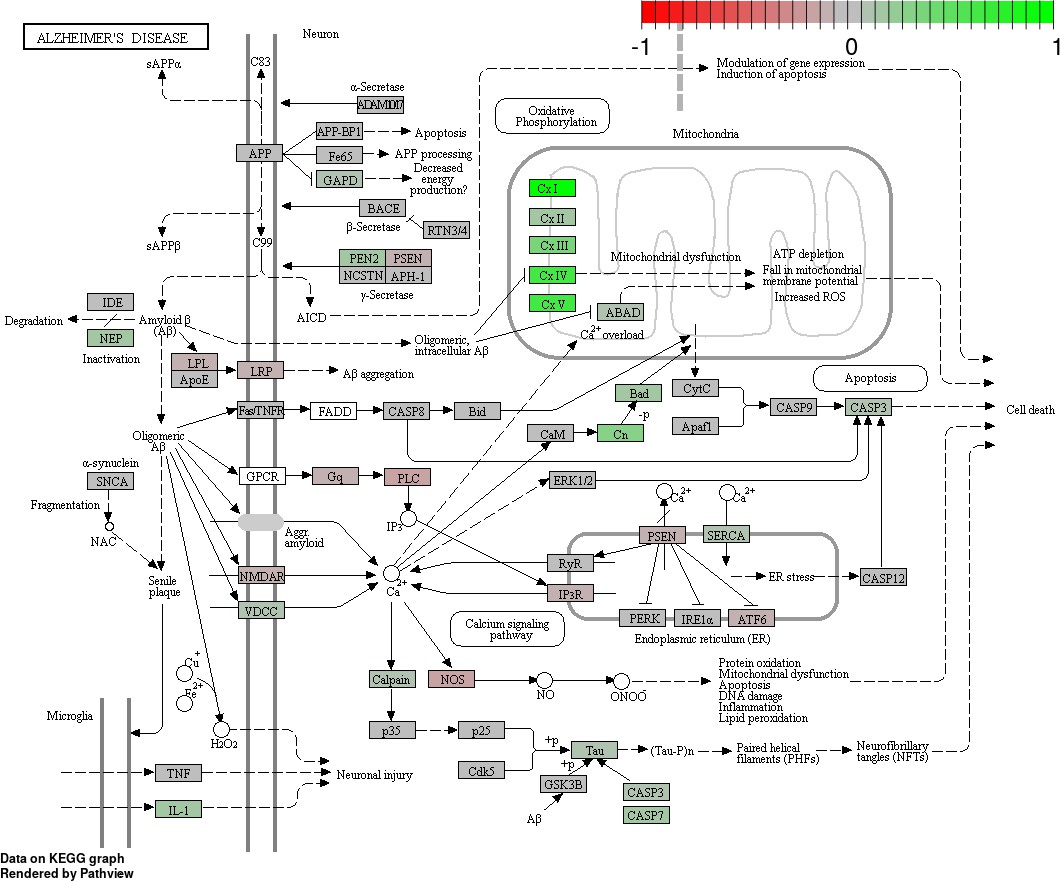
Status-dependent regulation of Kyoto Encyclopedia of Genes and Genomes pathway hsa050160 Alzheimer’s disease at the cross-tissue level.
The signal is mainly driven by the differential expression of the mitochondrial respiratory chain. Green/red color depicts the cross-tissue log2-fold-change (see legend for scale) with direction breeder/non-breeder.
Figure 4—figure supplement 8
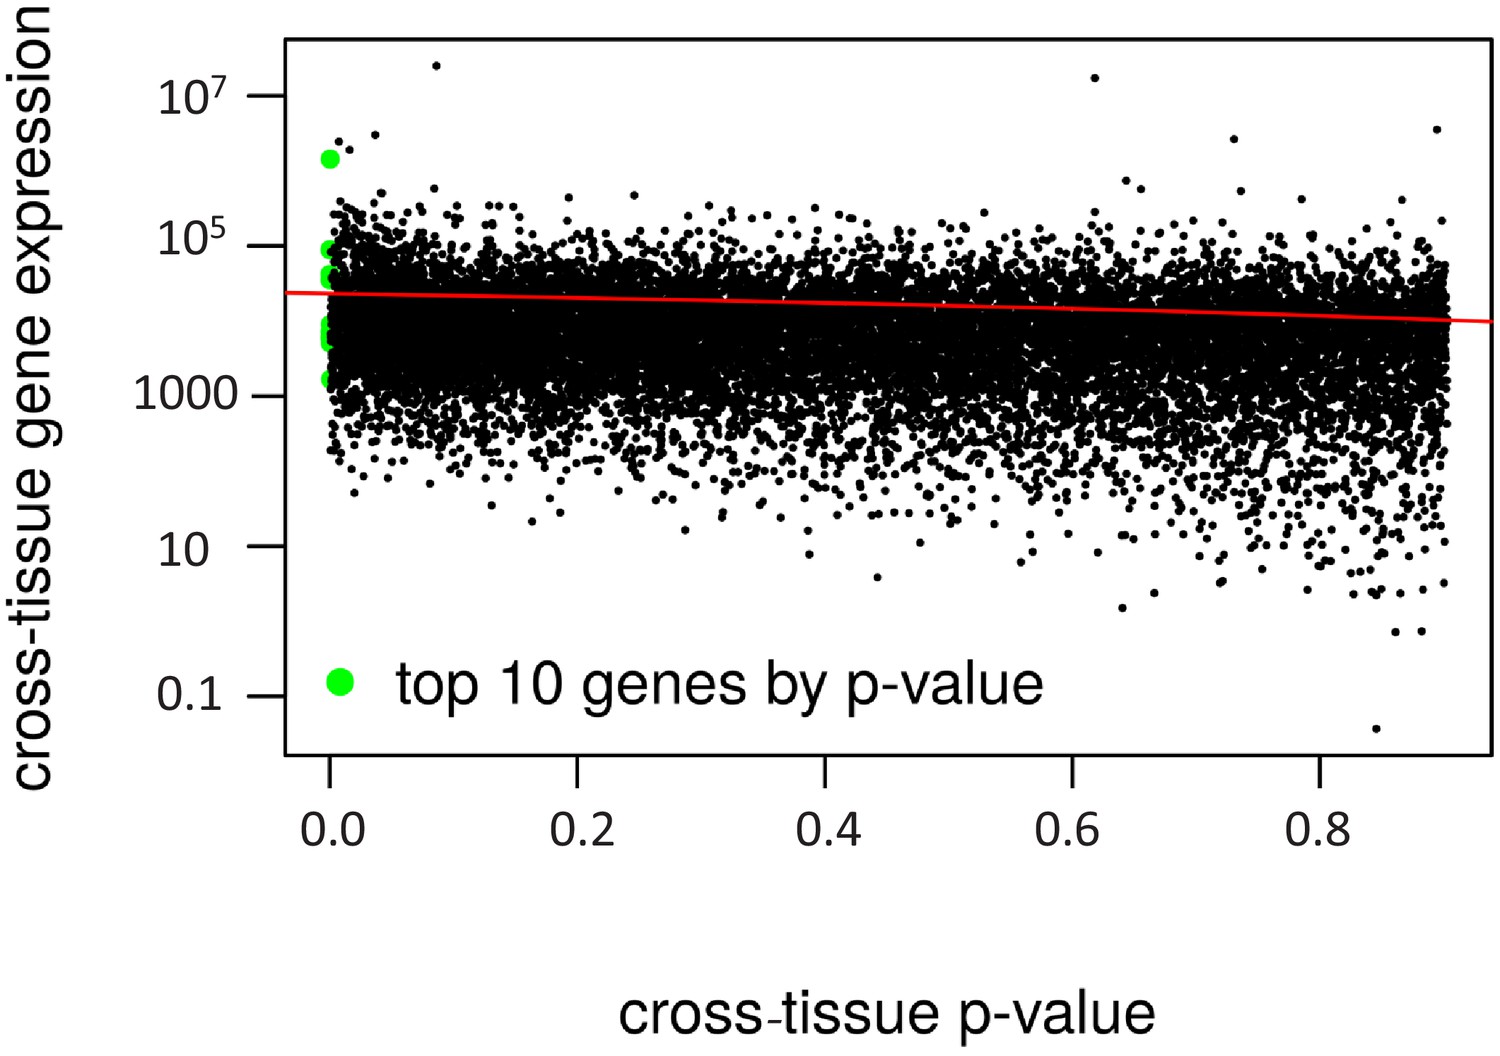
Cross-tissue p-value vs. gene expression.
The cross-tissue gene expression is represented by the sum of the DeSeq2 baseMean values. The regression line is in red (negative correlation, R2 = 0.04).
Figure 4—figure supplement 9
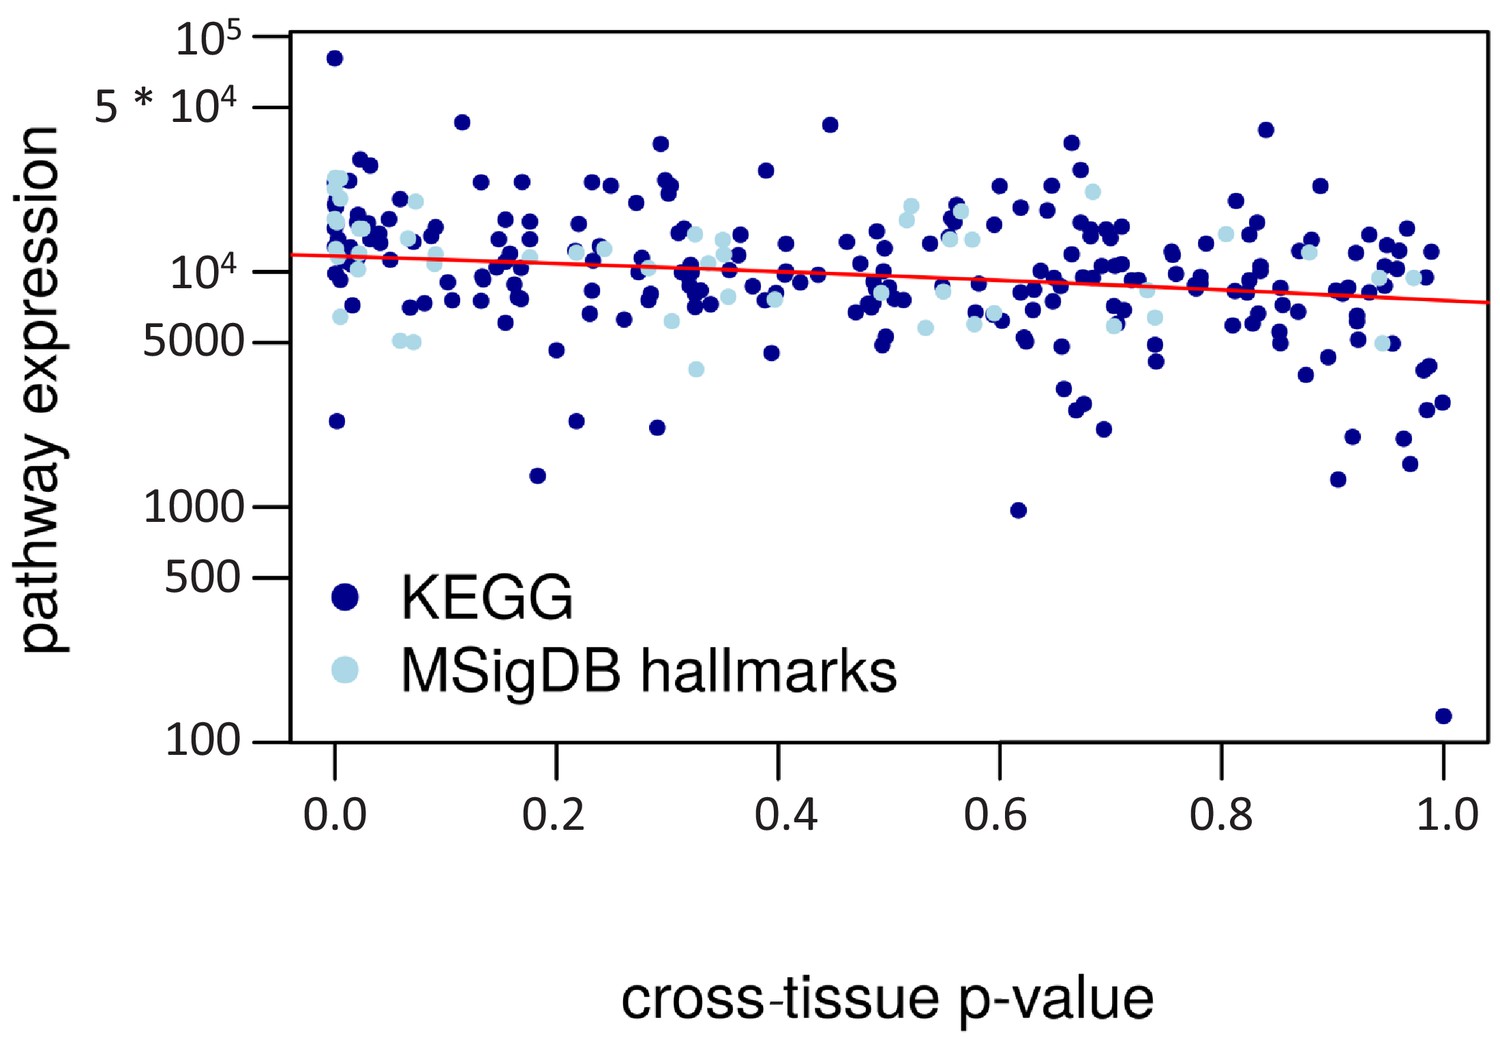
Cross-tissue p-value vs. pathway expression.
The cross-tissue pathway expression is represented by the median of the respective cross-tissue gene expressions. The regression line is in red (negative correlation, R2 = 0.12).
Figure 4—figure supplement 10
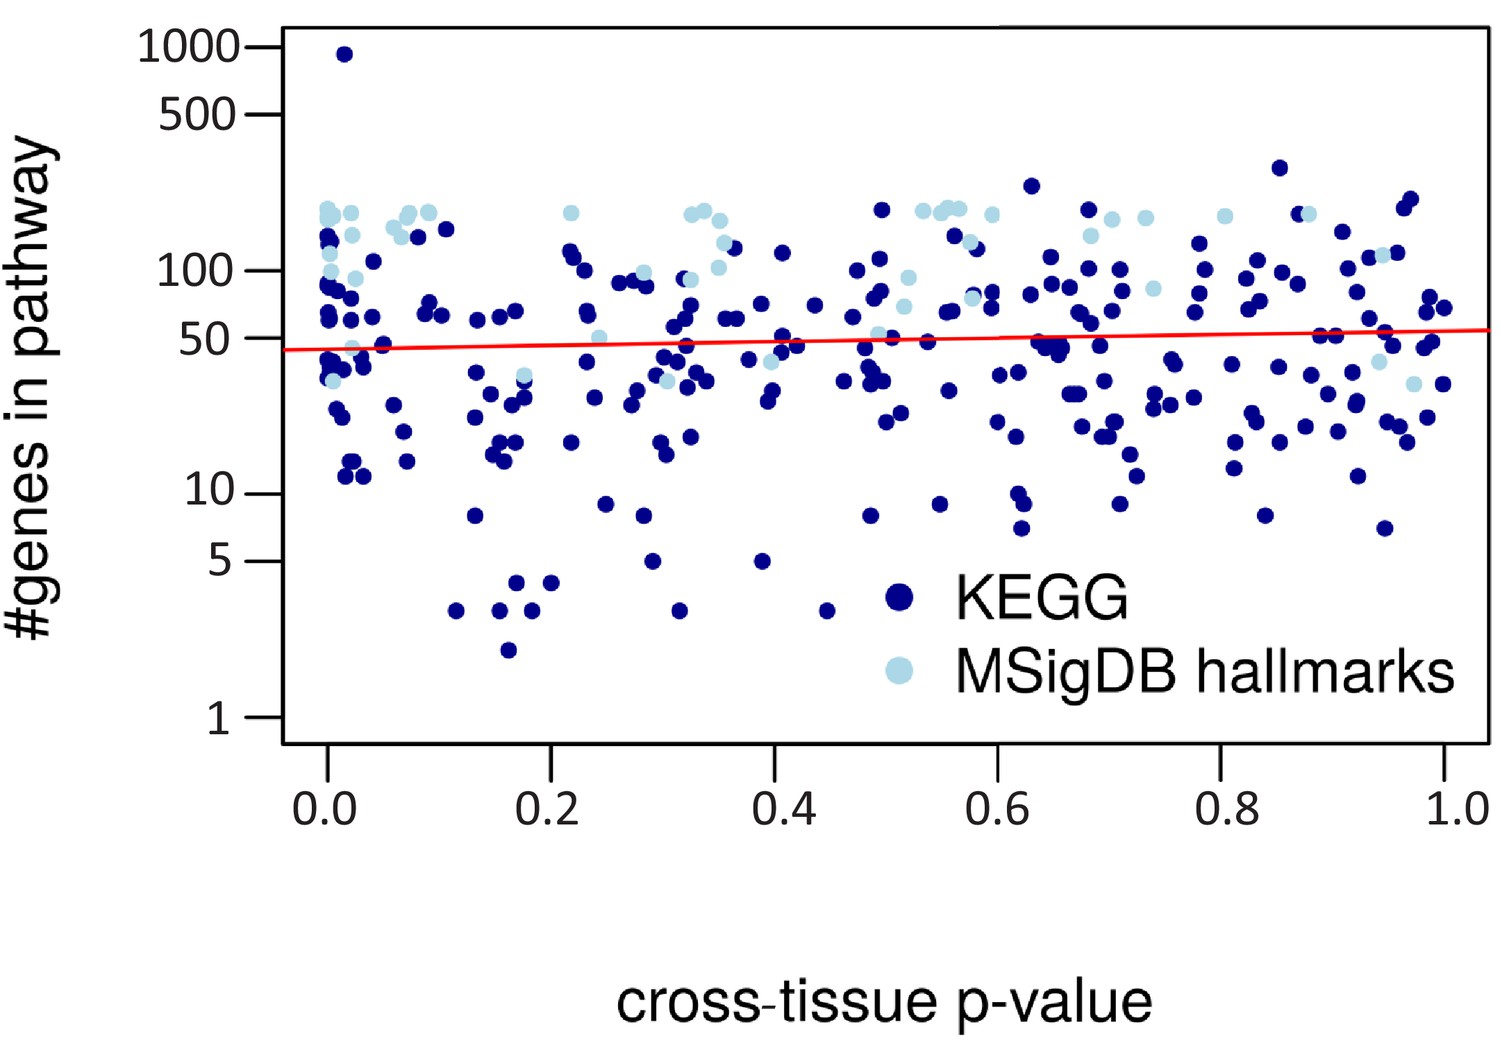
Cross-tissue p-value vs. pathway size.
The regression line is in red (R2 = 0.00).
Figure 4—figure supplement 11
Pathways and metabolic functions enriched for status-dependent differential gene expression checked by another enrichment method.
Shown are all Kyoto Encyclopedia of Genes and Genomes pathways (A) and Molecular Signatures Database hallmarks (B) that are enriched for differential gene expression between breeders and non-breeders at the weighted cross-tissue level using our default enrichment method with p-value-based test statistics (false discovery rate, <0.1, compare Figure 4). The p-values shown in the cells correspond to an alternative enrichment method using fold-change-based test statistics. As indicated by the color key, red and green indicate up- or down-regulated in breeders, respectively. White indicates a pathway/hallmark that is significantly affected by differential expression and whose signals for up- and down-regulation are approximately balanced. Dark colors up to black mean that there is little or no evidence that the corresponding pathway/hallmark is affected by differential gene expression.
Figure 5
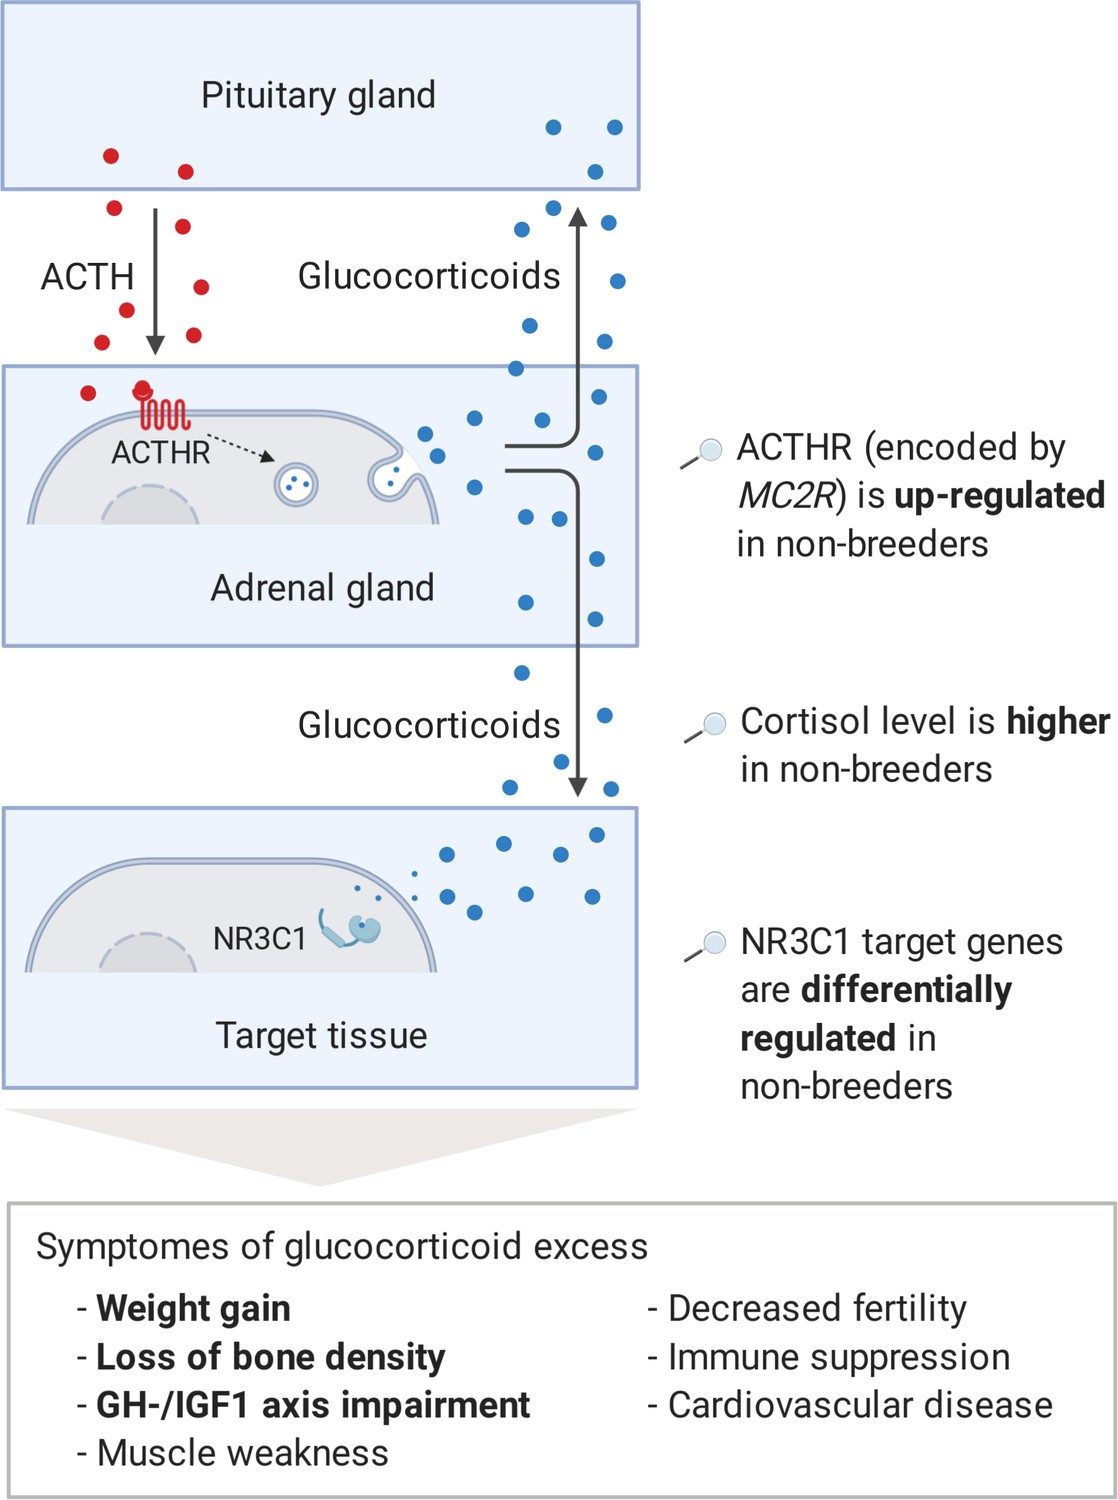
Model of the stress axis as a key mechanism for status-dependent lifespan differences in Fukomys.
From a wide range of mammals, including humans (Ferraù and Korbonits, 2015), dogs (Kooistra and Galac, 2012), horses (McCue, 2002), cats (Meijer et al., 1978), and guinea pigs (Zeugswetter et al., 2007), it is known that chronic glucocorticoid excess leads to a number of pathological symptoms that largely overlap with those of aging and result in considerably higher mortality rates for affected individuals (Etxabe and Vazquez, 1994, #808). The most common cause of chronic glucocorticoid excess is excessive secretion of the adrenocorticotropic hormone (ACTH) by the pituitary gland. ACTH is transported via the blood to the adrenal cortex where it binds to the ACTH-receptor (ACTHR; encoded by the gene MC2R), which induces the production of glucocorticoids, especially cortisol. Glucocorticoids are transported to the various tissues, where they exert their effect by activating the glucocorticoid receptor (NR3C1) that acts as a transcription factor and regulates hundreds of genes. The constant overuse of this transcriptional pattern eventually leads to the listed symptoms. Our hypothesis is that the permanent, high expression of the ACTH-receptor in Fukomys non-breeders causes effects similar to those known from overproduction of the hormone. In line with this hypothesis, (i) cortisol levels are increased in non-breeders and (ii) target genes of the glucocorticoid receptor are highly enriched for status-dependent differential gene expression. Furthermore, the animals were examined for common symptoms of chronic glucocorticoid excess: (iii) non-breeders gained more weight during the experiment than breeders, (iv) exhibited lower bone density at the end of the experiment, and (v) lower gene expression in the growth hormone/insulin-like growth factor 1 axis than breeders.
Figure 6 with 1 supplement
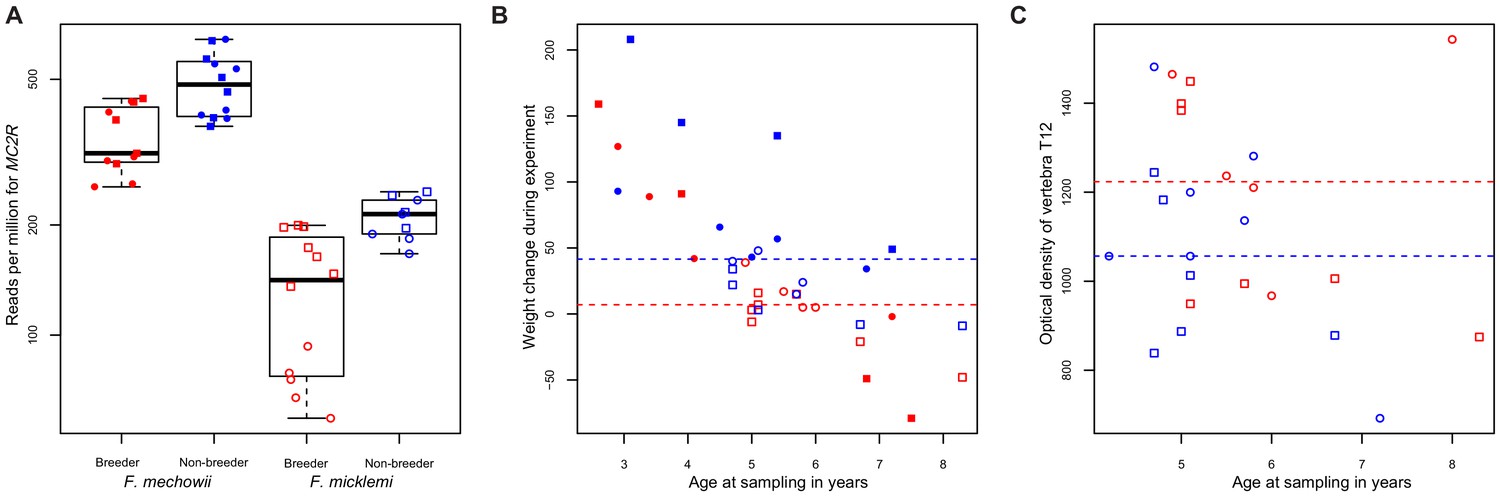
MC2R gene expression and physiological measurements.
(A) Gene expression of MC2R, coding for the adrenocorticotropic hormone receptor, in breeders and non-breeders of Fukomys mechowii and Fukomys micklemi. (B) Weight gain of the animals during the experiment. (C) Measured optical densities of vertebra T12 of F. micklemi breeders and non-breeders. Red, breeders; blue, non-breeders; filled, F. mechowii; unfilled, F. micklemi; circles, females; squares, males; dashed line, median. Statistically significant differences between breeders and non-breeders were determined with (A) DESeq2 (Love et al., 2014) and (B, C) analysis of variance with status, species, sex, and age as independent variables (see Materials and methods).
Figure 6—figure supplement 1
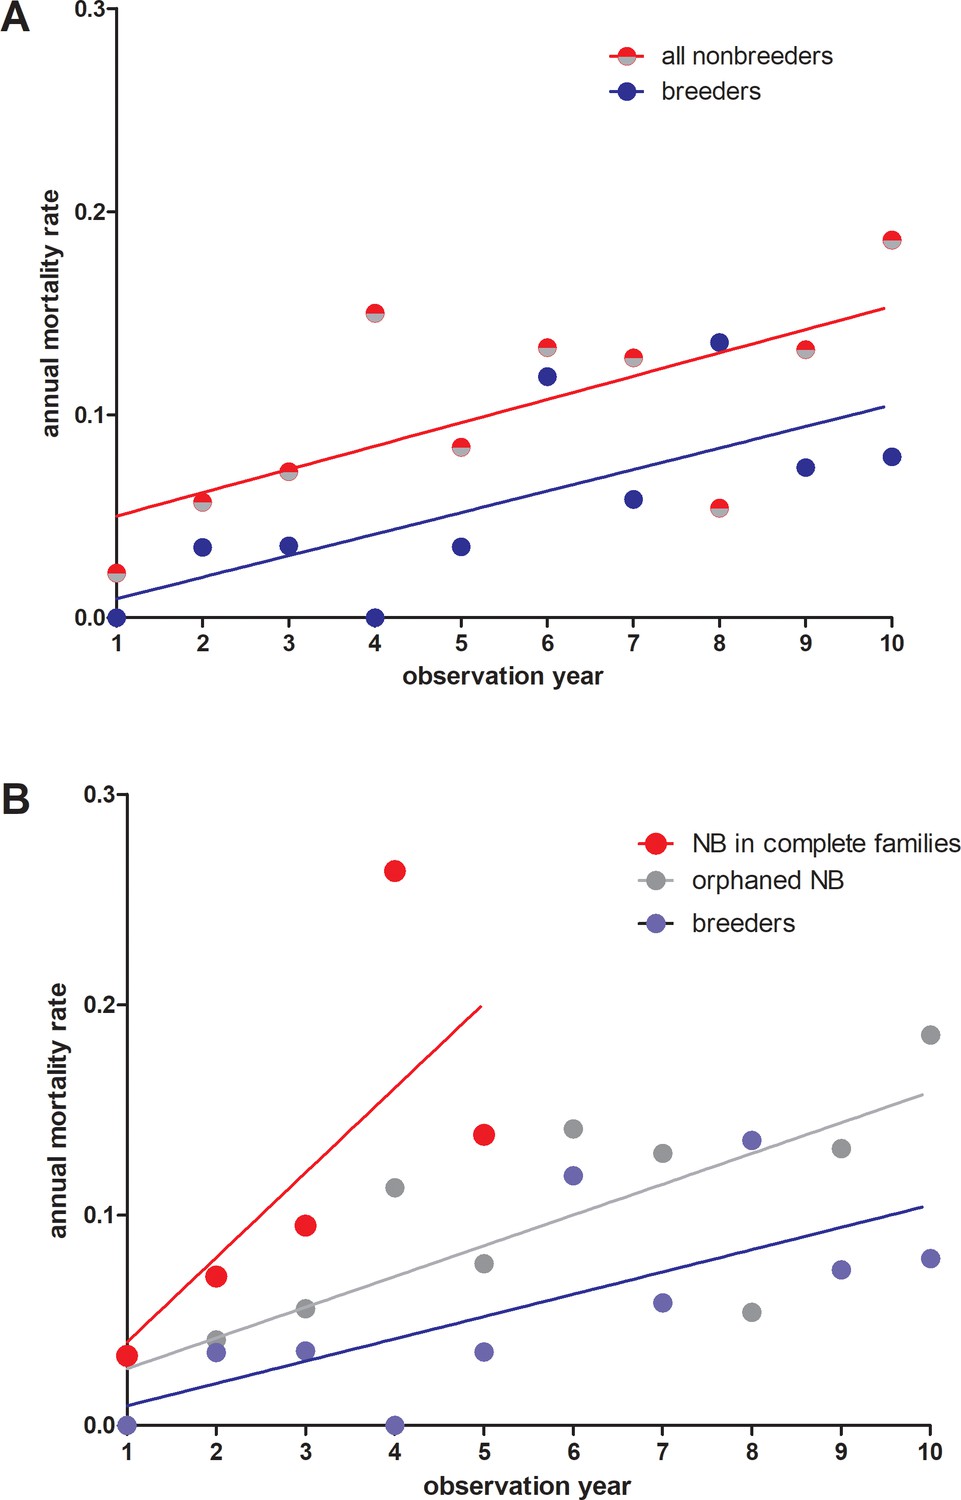
Annual mortality rates in giant mole-rats Fukomys mechowii.
(A) All non-breeders vs. breeders. Annual mortality rates differ significantly across all age classes (paired t-test, two-tailed, t = 2.309 df=9, p=0.0463). (B) Same data as in (A), but for non-breeders differentiated between animals living in complete families (high cortisol) vs. orphaned non-breeders living in families where at least one parent was absent (low cortisol). Annual mortality rates during the first five observation years (all three groups represented) differed significantly between groups (repeated measures ANOVA, F = 5.436, p=0.0323). Tukey post-hoc testing: p<0.05 for breeders vs. non-breeders from complete families; all other comparisons: p>0.05.Comparison breeders vs. orphaned non-breeders across all age classes (10 observation years: paired t-test, two-tailed, t = 1.983, df = 9, p=0.0787).
Tables
Table 1
Top 10 genes regarding weighted cross-tissue differential expression signal.
| Weighted cross-tissue | Tissue with highest expression | ||||||
|---|---|---|---|---|---|---|---|
| p-Value | FDR | log2-foldchange* | Tissue | % of cross-tissue expression | FDR | log2-foldchange* | |
| SULT2A1 | 0.00E+00 | 0.000 | −3.19 | Liver | 97.42 | 5.27E-06 | -3.26 |
| MC2R | 6.00E-06 | 0.046 | −0.53 | Adrenal gland | 89.53 | 8.78E-05 | -0.56 |
| INHA | 1.60E-05 | 0.081 | 1.57 | Ovary | 67.91 | 1.54E-05 | 2.22 |
| INHA – tissue with second highest expression | Testis | 27.61 | 0.56 | 0.21 | |||
| CYP11A1 | 5.90E-05 | 0.224 | 0.61 | Ovary | 45.55 | 5.49E-05 | 0.91 |
| CYP11A1 – tissue with second highest expression | Adrenal gland | 43.63 | 1.48E-03 | 0.47 | |||
| NLRP14 | 1.17E-04 | 0.355 | −0.80 | Ovary | 68.98 | 2.84E-05 | −1.25 |
| NLRP14 – tissue with second highest expression | Testis | 18.67 | 0.54 | 0.19 | |||
| GH | 2.58E-04 | 0.618 | 0.45 | Pituitary gland | 99.96 | 1.99E-02 | 0.45 |
| IGF1 | 3.62E-04 | 0.618 | 0.59 | Ovary | 51.73 | 1.20E-04 | 0.76 |
| IGF1 – tissue with second highest expression | Liver | 36.28 | 0.39 | 0.24 | |||
| ZP4 | 3.74E-04 | 0.618 | −1.16 | Ovary | 95.30 | 1.99E-03 | −1.23 |
| TCL1A | 5.33E-04 | 0.618 | −1.05 | Ovary | 90.12 | 2.14E-03 | −1.18 |
| PNLIPRP2 | 5.69E-04 | 0.618 | 1.36 | Ovary | 76.08 | 2.23E-03 | 1.65 |
-
*Direction: breeder/non-breeder.
Tissues are listed if they contribute at least 10% to cross-tissue expression.
-
FDR: false discovery rate.
Table 2
Behavior of important aging-relevant genes and pathways in this study.
| Gene/pathway | Regulation in indicated direction and species can reduce lifespan | Regulation in indicated direction and species can extend lifespan† | Differentially expressed in this study in indicated tissues and direction* | Gene/pathway is expressed mainly in the following tissues |
|---|---|---|---|---|
| GH1 | Mouse ↑1 | Mouse ↓2, rat ↓2 | Pituitary gland ↑ | Pituitary gland |
| IGF1 | – | Mouse ↓2 | Adrenal gland ↑, ovary ↑ | Liver, ovary |
| IGF1R | – | Mouse ↓1, worm ↓3, fly ↓3 | Adrenal gland ↓, ovary ↓ | Many |
| KL | Mouse ↓3 | Mouse ↑3, worm ↑3 | Ovary ↓ | Endocrine tissue, kidney |
| SIRT1 | – | Mouse ↑6, worm ↑7, fly ↑7 | – | All |
| MYC | – | Mouse ↓8 | Thyroid ↑ | All |
| mTOR | – | Mouse ↓9, worm↓9, fly ↓9 | Adrenal gland ↓ | All |
| PRKAA2 (AMPK) | – | Worm ↑9 | – | Many |
| TP53 | Mouse ↑11, Fly ↑11 | Worm ↓11, mouse ↑11, fly ↑11 | – | All |
| SOD2 | – | Worm ↓10, fly ↑10 | – | All |
| FOXO3 | Fly ↑12 | – | Ovary ↓, adrenal gland ↓ | All |
| Protein synthesis | – | Mouse ↓8, worm ↓9, fly ↓9 | Many ↑ | All |
| Proteasome | – | Worm ↑14, fly ↑14 | Gonads ↑, adrenal gland ↑ | All |
| Lysosome | – | Worm ↑13 | – | All |
| Respiratory chain | – | Worm↓15, fly ↓16, killifish ↓17 | Gonads ↑, Adrenal gland ↑, Blood ↑, Spleen ↑ | All |
| Apoptosis | Mouse ↑11, fly ↑11 | Worm ↓11, mouse ↑11, fly ↑11 | Skin ↑, pituitary gland ↑ | All |
-
*Direction: breeder/non-breeder.
†Direction: old/young.
-
1Allolio and Arlt, 2002, 2Bartke, 2019, 3van Heemst, 2010, 4Elibol and Kilic, 2018, 5Kwon et al., 2015, 6Satoh et al., 2013, 7Burnett et al., 2011, 8Hofmann et al., 2015, 9Johnson et al., 2013, 10Edrey and Salmon, 2014, 11Feng et al., 2011, 12Giannakou et al., 2004, 13Carmona-Gutierrez et al., 2016, 14Saez and Vilchez, 2014, 15Dillin et al., 2002, 16Copeland et al., 2009, 17Baumgart et al., 2016.
–: either not affecting lifespan or not known to the best of our knowledge (columns 1 and 2); no change (column 3).
Additional files
-
Source data 1
Cross-tissue enrichments details, transcript sequences and DESeq2 results.
(a) For each Kyoto Encyclopedia of Genes and Genomes pathway and Molecular Signatures Database hallmark that was detected to be significantly (false discovery rate < 0.1) enriched for status-dependent differential expression at the weighted cross-tissue level, the data set contains a *.tsv file with the genes that form the respective pathway/hallmark sorted by their individual contribution to the enrichment. The files also provide an overview of the p-values and fold-changes of those genes in those tissues in which the genes are expressed most highly. (b) (fa.gz) Transcript isoforms of F. mechowii used for read mapping. (c) (fa.gz) Transcript isoforms of F. micklemi used for read mapping. (d) (tsv.gz) Raw read counts for all 17,065 genes and 636 samples that were analyzed in this study using RNA-seq. (e) (zip) DESeq2 results for status-dependent gene expression (direction: breeder/non-breeder). The data set contains one *.tsv file per analyzed tissue. (f) (zip) DESeq2 results for sex-dependent gene expression (direction: female/male). The data set contains one *.tsv file per analyzed tissue. (g) (zip) DESeq2 results for species-dependent gene expression (direction: mechowii/micklemi). The data set contains one *.tsv file per analyzed tissue.
- https://cdn.elifesciences.org/articles/57843/elife-57843-data1-v2.zip
-
Source data 2
Single-tissue enrichments, cross-tissue gene results, Digital Aging Atlas, comparison with naked mole-rat, glucocorticoid receptor targets, comparison with Cushing’s disease and batch effects.
(a) Enrichment analysis results for status-dependent gene expression on Kyoto Encyclopedia of Genes and Genomes pathways. The data set contains one *.tsv file per analyzed tissue, as well as an additional *.tsv file for the weighted cross-tissue level results. (b) (zip) Enrichment analysis results for status-dependent gene expression on Molecular Signatures Database hallmarks. The data set contains one *.tsv file per analyzed tissue, as well as an additional *.tsv file for the weighted cross-tissue level results. (c) (tsv.gz) Overview of the weighted cross-tissue differential gene expression analysis. Contains all p-values, fold-changes, and mean expression values for all genes across all tissues as well as the weighted, combined cross-tissue test statistics, p-values, and fold-changes for all genes. (d) (tsv) Genes of the Digital Aging Atlas used in this study. (e) (zip) Comparison of status-dependent differentially expressed genes with results of an earlier, similar study involving naked mole-rats and guinea pigs. The data set contains one *.tsv file for each of the 10 tissues that were examined in both studies. Each *.tsv file lists the differentially expressed genes for the respective tissue as identified in this study with the determined false discovery rates and fold-changes, as well as the fold-changes determined in the earlier study using naked mole-rats and guinea pigs. (f) (zip) Glucocorticoid receptor target genes that were determined by Phuc Le et al. and tested in this study for enrichment of status-dependent differential gene expression. The data set contains one *.tsv file each for target genes determined via chromatin immunoprecipitation and differential gene expression analysis. Phuc Le et al. determined differentially expressed genes between mice that were treated with exogenous glucocorticoids and untreated controls. The relevant table columns from Phuc Le et al. were added by human gene symbol and Entrez IDs that were used for enrichment analysis. (g) (tsv) Comparison of Control vs Cushing’s disease and breeder vs. non-breeder gene expression. (h) (zip) BatchQC reports. This data set contains the results from the analysis of possible batch effects via BatchQC. There is one report for each combination of the 16 tissues and 2 species examined in this study.
- https://cdn.elifesciences.org/articles/57843/elife-57843-data2-v2.zip
-
Supplementary file 1
Samples, animals, pairing schemes, comparison with naked mole-rat and guinea pig, glucocorticoid receptor target enrichment, sequencing runs, co-expression networks and bone densities.
(a) Overview of number of samples that were examined with regard to status, sex, species, and tissue. (b) Animal description. (c) Overview of the tissues that were successfully sampled for each type of animal. (d) Pairing scheme: F. mechowii. (e) Pairing scheme: F. micklemi. (f) Analysis of the direction of status-dependent differentially expressed genes that were identified in this study (two Fukomys species) in similar experiments with naked mole-rats and guinea pigs (Bens et al., 2018, https://www.ncbi.nlm.nih.gov/pmc/articles/PMC6090939/). (g) Analysis of status-dependent differential gene expression enrichment on glucocorticoid receptor target genes that were determined by Phuc Le et al., 2005 (https://www.ncbi.nlm.nih.gov/pmc/articles/PMC1186734/), using chromatin immunoprecipitation. (h) Analysis of status-dependent differential gene expression enrichment on glucocorticoid receptor target genes that were determined by Phuc Le et al., 2005 (https://www.ncbi.nlm.nih.gov/pmc/articles/PMC1186734/), using a differential gene expression analysis. (i) Sample descriptions. (j) Run descriptions. (k) Weighted gene co-expression network analysis module clustering and functional enrichment analysis regarding these modules. (l) Bone density measurements.
- https://cdn.elifesciences.org/articles/57843/elife-57843-supp1-v2.xlsx
-
Transparent reporting form
- https://cdn.elifesciences.org/articles/57843/elife-57843-transrepform-v2.docx
Download links
A two-part list of links to download the article, or parts of the article, in various formats.
Downloads (link to download the article as PDF)
Open citations (links to open the citations from this article in various online reference manager services)
Cite this article (links to download the citations from this article in formats compatible with various reference manager tools)
Increased longevity due to sexual activity in mole-rats is associated with transcriptional changes in the HPA stress axis
eLife 10:e57843.
https://doi.org/10.7554/eLife.57843


