Augmented curation of clinical notes from a massive EHR system reveals symptoms of impending COVID-19 diagnosis
- nference, United States
- Mayo Clinic, United States
- nference Labs, India
- Mayo Clinic Laboratories, United States
Figures
Figure 1 with 2 supplements
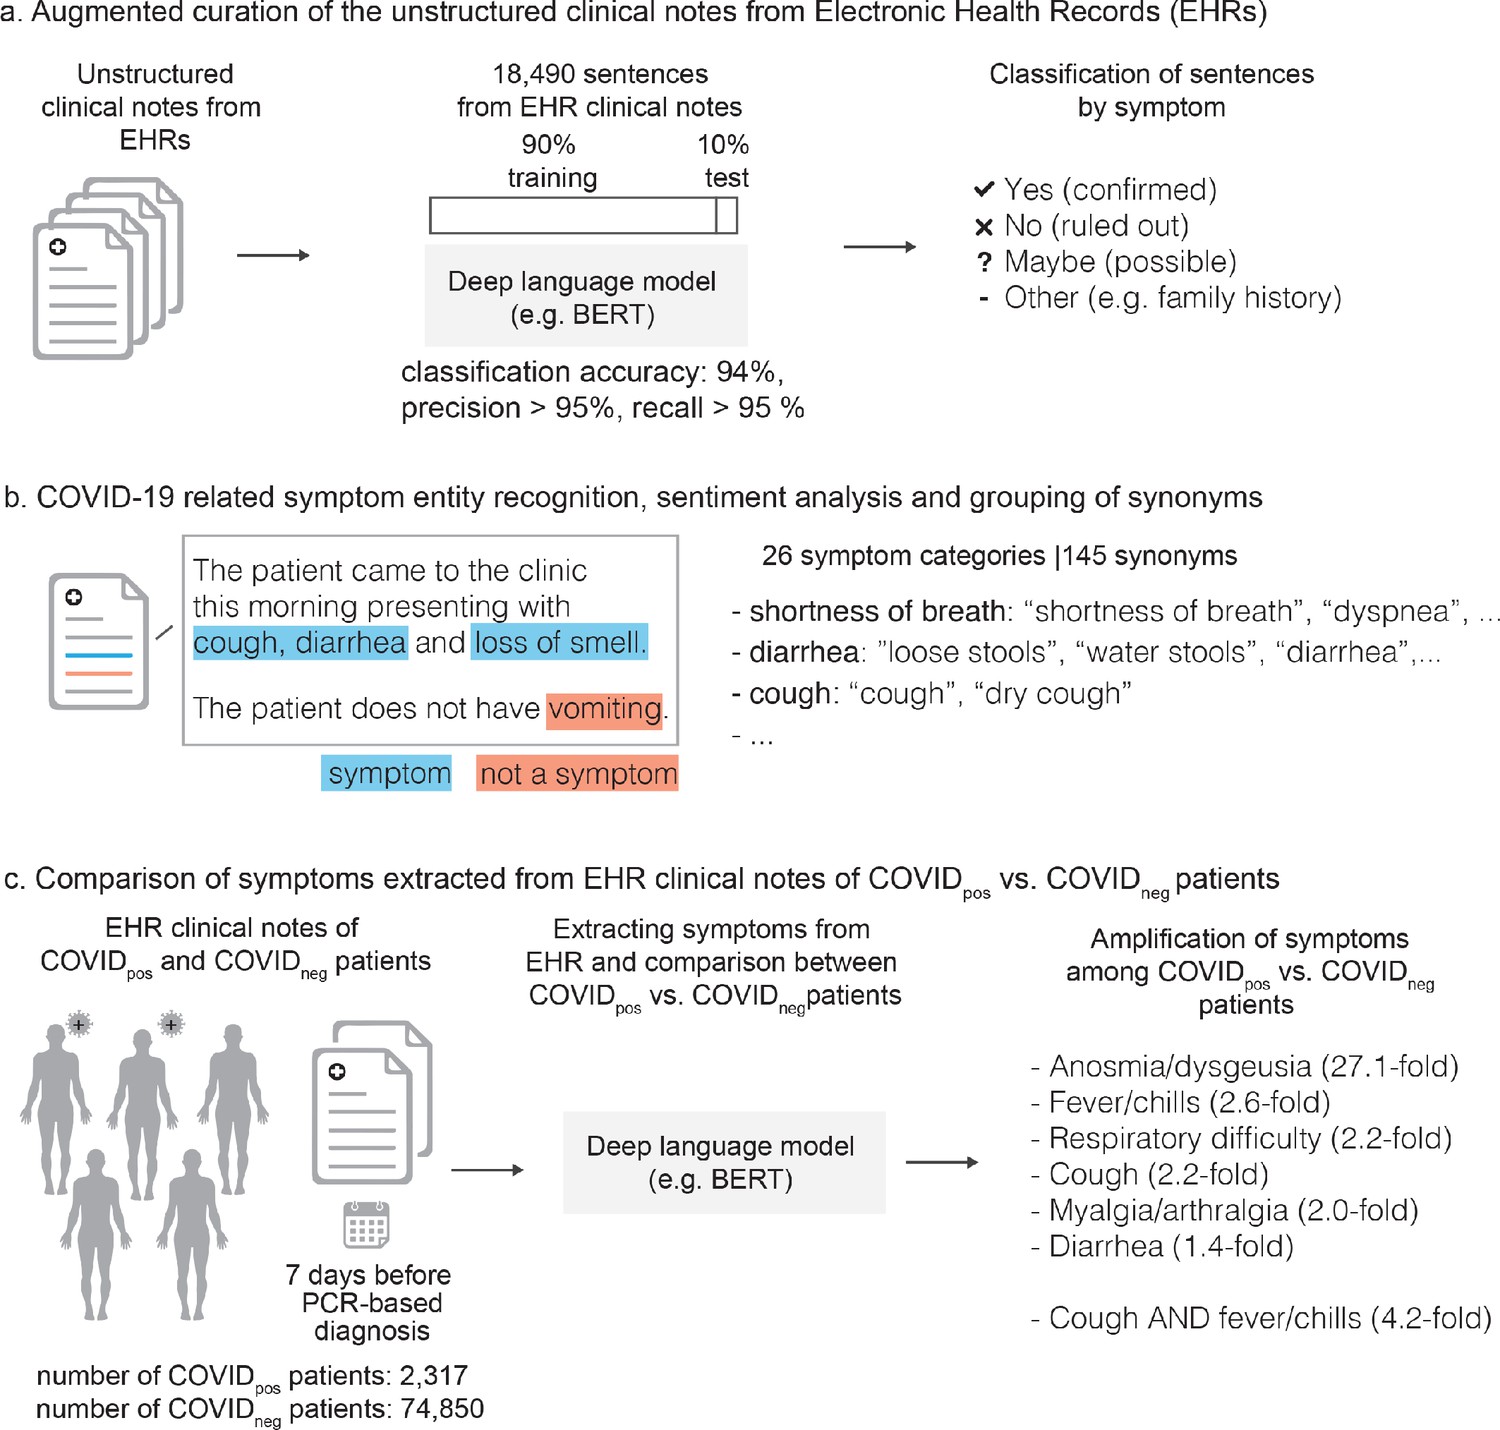
Augmented curation of the unstructured clinical notes and comparison of symptoms between COVIDpos vs. COVIDneg patients.
(a) Augmented curation of the unstructured clinical notes from Electronic Health Records (EHRs). (b) COVID-19-related symptom entity recognition, sentiment analysis and grouping of synonyms. (c) Comparison of symptoms extracted from EHR clinical notes of COVIDpos vs. COVIDneg patients.
Figure 1—figure supplement 1
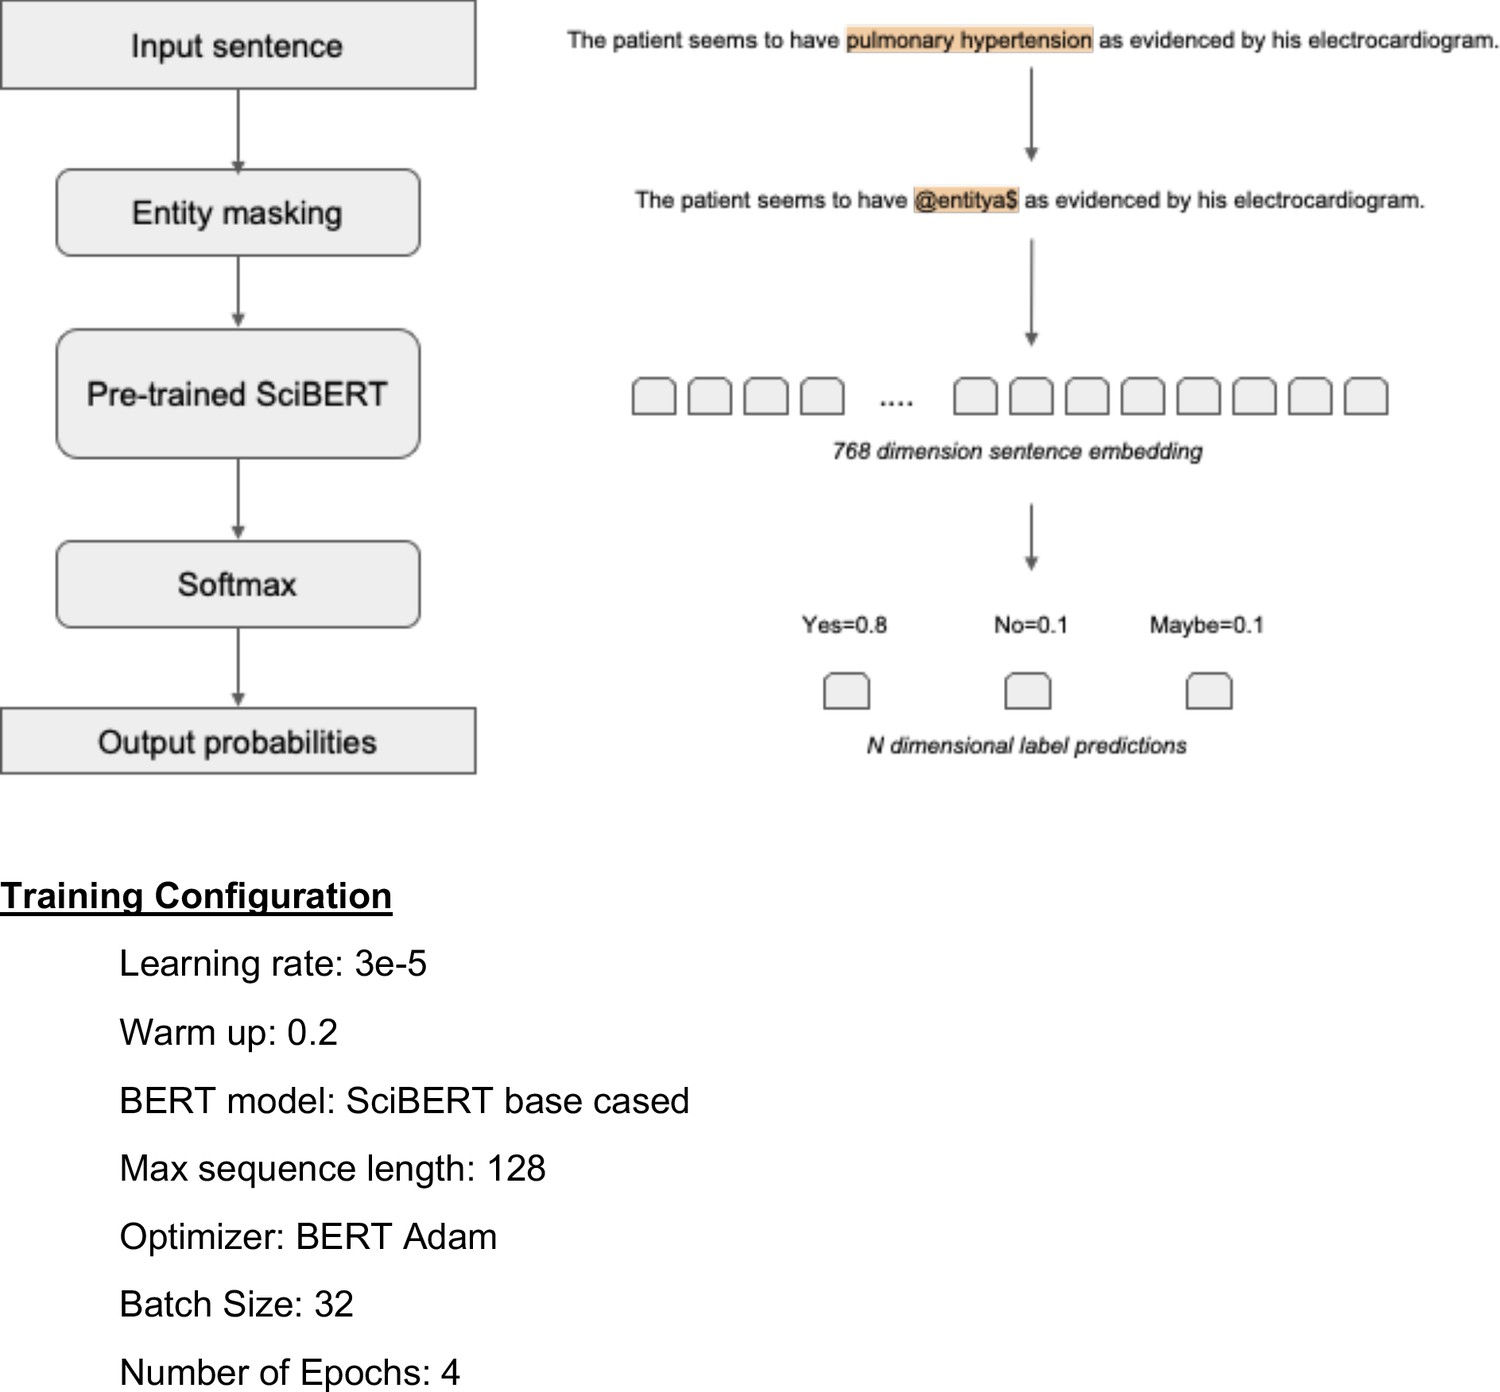
SciBERT Architecture and Training Configuration.
Figure 1—figure supplement 2
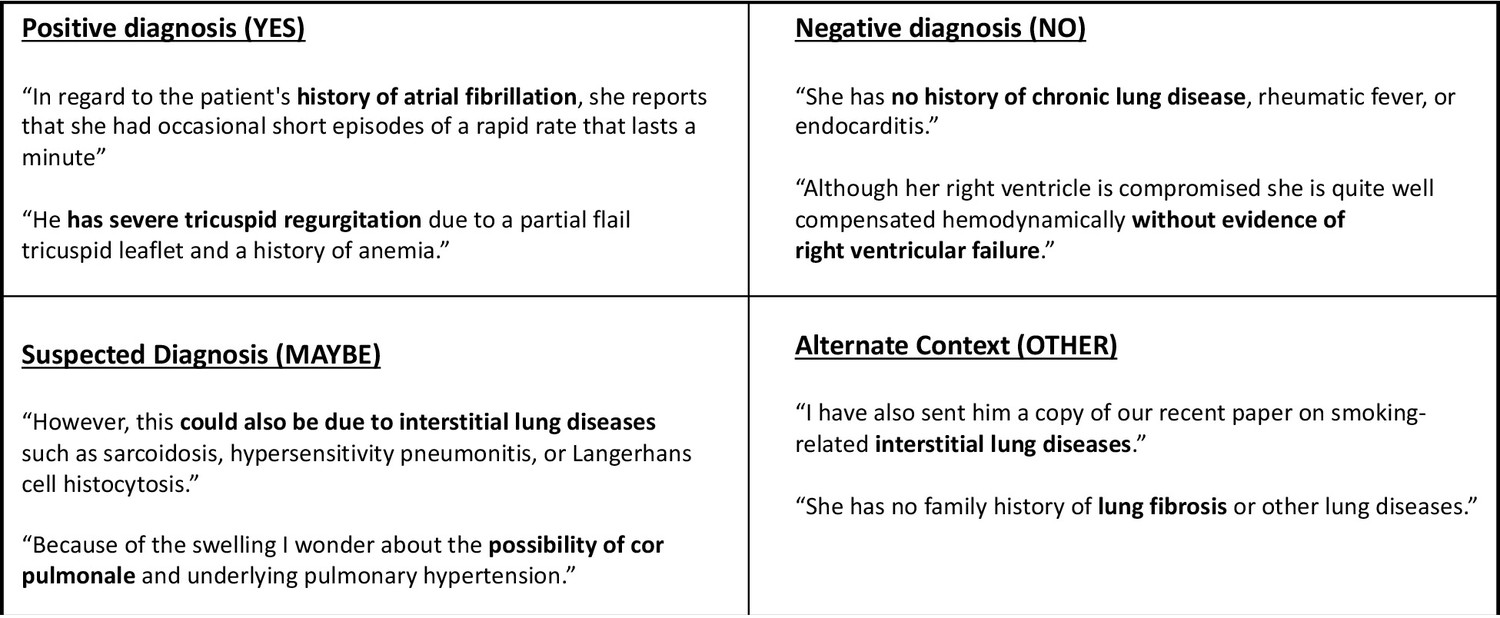
Examples of Sentence Classification Used in Training a SciBERT Model for Phenotype/Symptom Sentiment Analysis.
Tables
Table 1
Augmented curation of the unstructured clinical notes from the EHR reveals specific clinically confirmed phenotypes that are amplified in COVIDpos patients over COVIDneg patients in the week prior to the SARS-CoV-2 PCR testing date.
The key COVIDpos amplified symptoms in the week preceding PCR testing (i.e. day = −7 to day = −1) are highlighted in gray (p-value<1E-10). The ratio of COVIDpos to COVIDneg proportions represents the fold change amplification of each phenotype in the COVIDpos patient set (symptoms are sorted based on this column).
| Symptom (p-value<1E-10 in gray) | COVID+ Count (%) (N = 2317) | COVID- Count (%) (N = 74850) | (COVID+/COVID-) Relative Ratio | Relative ratio (95% CI) | 2-tailed p-value | BH-corrected p-value |
|---|---|---|---|---|---|---|
| Altered or diminished sense of taste or smell | 145 (6.3%) | 173 (0.2%) | 27.08 | (21.81, 33.62) | <1E-300 | <1E-300 |
| Fever/chills | 750 (32.4%) | 9421 (12.6%) | 2.57 | (2.42, 2.74) | 3.57E-169 | 4.64E-168 |
| Cough | 769 (33.2%) | 11083 (14.8%) | 2.24 | (2.11, 2.38) | 4.60E-129 | 3.99E-128 |
| Respiratory difficulty | 681 (29.4%) | 10082 (13.5%) | 2.18 | (2.04, 2.33) | 3.06E-105 | 1.99E-104 |
| Myalgia/Arthralgia | 288 (12.4%) | 4620 (6.2%) | 2.01 | (1.8, 2.25) | 5.35E-34 | 2.78E-33 |
| Rhinitis | 200 (8.6%) | 2947 (3.9%) | 2.19 | (1.92, 2.52) | 2.25E-29 | 9.75E-29 |
| Headache | 325 (14.0%) | 6124 (8.2%) | 1.71 | (1.55, 1.9) | 1.34E-23 | 4.98E-23 |
| Congestion | 228 (9.8%) | 4261 (5.7%) | 1.73 | (1.53, 1.96) | 4.45E-17 | 1.45E-16 |
| GI upset | 195 (8.4%) | 10670 (14.3%) | 0.59 | (0.52, 0.68) | 1.74E-15 | 5.03E-15 |
| Wheezing | 49 (2.1%) | 3765 (5.0%) | 0.42 | (0.32, 0.56) | 1.82E-10 | 4.73E-10 |
| Dermatitis | 26 (1.1%) | 2519 (3.4%) | 0.33 | (0.23, 0.5) | 2.60E-09 | 6.15E-09 |
| Generalized symptoms | 169 (7.3%) | 8129 (10.9%) | 0.67 | (0.58, 0.78) | 4.82E-08 | 1.04E-07 |
| Respiratory Failure | 73 (3.2%) | 1363 (1.8%) | 1.73 | (1.38, 2.19) | 3.09E-06 | 6.18E-06 |
| Diarrhea | 228 (9.8%) | 5452 (7.3%) | 1.35 | (1.19, 1.53) | 3.47E-06 | 6.44E-06 |
| Pharyngitis | 160 (6.9%) | 3635 (4.9%) | 1.42 | (1.22, 1.66) | 7.05E-06 | 1.22E-05 |
| Chest pain/pressure | 148 (6.4%) | 6122 (8.2%) | 0.78 | (0.67, 0.92) | 1.88E-03 | 3.06E-03 |
| Change in appetite/intake | 95 (4.1%) | 2271 (3.0%) | 1.35 | (1.11, 1.66) | 3.37E-03 | 5.15E-03 |
| Otitis | 13 (0.6%) | 874 (1.2%) | 0.48 | (0.29, 0.85) | 6.98E-03 | 1.01E-02 |
| Cardiac | 95 (4.1%) | 2443 (3.3%) | 1.26 | (1.03, 1.54) | 2.62E-02 | 3.59E-02 |
| Fatigue | 229 (9.9%) | 8268 (11.0%) | 0.89 | (0.79, 1.02) | 7.83E-02 | 1.02E-01 |
| Conjunctivitis | 9 (0.4%) | 167 (0.2%) | 1.74 | (0.95, 3.52) | 1.00E-01 | 1.24E-01 |
| Dry mouth | 5 (0.2%) | 316 (0.4%) | 0.51 | (0.24, 1.3) | 1.28E-01 | 1.51E-01 |
| Hemoptysis | 13 (0.6%) | 283 (0.4%) | 1.48 | (0.89, 2.65) | 1.61E-01 | 1.78E-01 |
| Dysuria | 16 (0.7%) | 732 (1.0%) | 0.71 | (0.45, 1.18) | 1.64E-01 | 1.78E-01 |
| Diaphoresis | 35 (1.5%) | 979 (1.3%) | 1.15 | (0.84, 1.63) | 3.99E-01 | 4.15E-01 |
| Neuro | 150 (6.5%) | 4952 (6.6%) | 0.98 | (0.84, 1.15) | 7.86E-01 | 7.86E-01 |
Table 2
Temporal analysis of the EHR clinical notes for the week preceding PCR testing (i.e. day −7 to day −1), leading up to the day of PCR testing (day 0) in COVIDpos and COVIDneg patients.
Temporal enrichment for each symptom is quantified using the ratio of COVIDpos patient proportion over the COVIDneg patient proportion for each day. The patient proportions in the rows labeled ‘Positive’ and ‘Negative’ represent the fraction of COVIDpos (n = 2,317) and COVIDneg (n = 74,850) patients with the specified symptom on each day. Symptoms with p-value<1E-10 are highlighted in green and 1E-10 < p value<1E-03 in gray.
| Symptom | COVID-19 (N = 77167) | Day = −7 | Day = −6 | Day = −5 | Day = −4 | Day = −3 | Day = −2 | Day = −1 |
|---|---|---|---|---|---|---|---|---|
| Altered or diminished sense of taste or smell | Positive (n = 2317) | 4.75E-03 | 3.88E-03 | 3.45E-03 | 2.59E-03 | 1.73E-03 | 0.00E+00 | 4.75E-03 |
| Negative (n = 74850) | 1.07E-04 | 4.01E-05 | 1.07E-04 | 1.07E-04 | 9.35E-05 | 2.27E-04 | 9.75E-04 | |
| Ratio (Positive/Negative) | 44.42 | 96.91 | 32.30 | 24.23 | 18.46 | 0.00 | 4.87 | |
| p-value | 1.14E-44 | 2.24E-48 | 3.17E-28 | 2.35E-18 | 8.94E-11 | 4.68E-01 | 5.85E-08 | |
| Cough | Positive | 2.55E-02 | 2.29E-02 | 1.90E-02 | 1.64E-02 | 1.38E-02 | 8.63E-03 | 7.94E-02 |
| Negative | 4.88E-03 | 5.30E-03 | 5.21E-03 | 5.33E-03 | 5.73E-03 | 8.40E-03 | 8.71E-02 | |
| Ratio (Positive/Negative) | 5.22 | 4.31 | 3.64 | 3.08 | 2.41 | 1.03 | 0.91 | |
| p-value | 8.42E-40 | 7.44E-28 | 2.43E-18 | 2.68E-12 | 6.68E-07 | 9.06E-01 | 1.95E-01 | |
| Diarrhea | Positive | 8.20E-03 | 7.77E-03 | 6.04E-03 | 4.32E-03 | 4.75E-03 | 2.59E-03 | 2.68E-02 |
| Negative | 3.70E-03 | 4.26E-03 | 4.58E-03 | 4.09E-03 | 4.58E-03 | 5.61E-03 | 3.78E-02 | |
| Ratio (Positive/Negative) | 2.22 | 1.82 | 1.32 | 1.06 | 1.04 | 0.46 | 0.71 | |
| p-value | 5.59E-04 | 1.17E-02 | 3.08E-01 | 8.66E-01 | 9.08E-01 | 5.32E-02 | 5.81E-03 | |
| Fever/chills | Positive | 2.42E-02 | 2.20E-02 | 1.94E-02 | 1.68E-02 | 1.34E-02 | 6.47E-03 | 7.90E-02 |
| Negative | 3.39E-03 | 3.74E-03 | 3.90E-03 | 4.42E-03 | 4.61E-03 | 6.77E-03 | 7.48E-02 | |
| Ratio (Positive/Negative) | 7.12 | 5.88 | 4.98 | 3.81 | 2.90 | 0.96 | 1.06 | |
| p-value | 1.15E-54 | 4.31E-40 | 6.52E-29 | 1.64E-17 | 2.36E-09 | 8.62E-01 | 4.52E-01 | |
| Respiratory Difficulty | Positive | 2.24E-02 | 2.11E-02 | 1.81E-02 | 1.55E-02 | 1.25E-02 | 8.20E-03 | 5.35E-02 |
| Negative | 5.06E-03 | 5.70E-03 | 5.81E-03 | 5.87E-03 | 6.16E-03 | 8.66E-03 | 7.65E-02 | |
| Ratio (Positive/Negative) | 4.43 | 3.71 | 3.12 | 2.65 | 2.03 | 0.95 | 0.70 | |
| p-value | 2.07E-28 | 8.72E-21 | 9.41E-14 | 4.56E-09 | 1.48E-04 | 8.15E-01 | 3.89E-05 | |
| Change in appetite/intake | Positive | 1.73E-03 | 1.73E-03 | 1.73E-03 | 5.18E-03 | 4.32E-03 | 5.61E-03 | 1.86E-02 |
| Negative | 1.30E-03 | 1.36E-03 | 1.34E-03 | 1.39E-03 | 1.40E-03 | 1.91E-03 | 1.35E-02 | |
| Ratio (Positive/Negative) | 1.33 | 1.27 | 1.29 | 3.73 | 3.08 | 2.94 | 1.37 | |
| p-value | 5.72E-01 | 6.42E-01 | 6.14E-01 | 3.53E-06 | 3.43E-04 | 9.41E-05 | 4.03E-02 | |
| Myalgia/Arthralgia | Positive | 8.20E-03 | 9.06E-03 | 7.77E-03 | 6.47E-03 | 5.61E-03 | 2.59E-03 | 3.84E-02 |
| Negative | 2.24E-03 | 3.05E-03 | 3.17E-03 | 2.99E-03 | 2.87E-03 | 3.99E-03 | 2.72E-02 | |
| Ratio (Positive/Negative) | 3.65 | 2.98 | 2.45 | 2.16 | 1.95 | 0.65 | 1.41 | |
| p-value | 9.33E-09 | 4.91E-07 | 1.44E-04 | 2.98E-03 | 1.68E-02 | 2.88E-01 | 1.18E-03 | |
| Congestion | Positive | 6.91E-03 | 6.47E-03 | 5.18E-03 | 3.45E-03 | 5.18E-03 | 2.16E-03 | 1.94E-02 |
| Negative | 1.95E-03 | 2.38E-03 | 1.98E-03 | 2.36E-03 | 2.18E-03 | 2.95E-03 | 2.63E-02 | |
| Ratio (Positive/Negative) | 3.54 | 2.72 | 2.62 | 1.46 | 2.38 | 0.73 | 0.74 | |
| p-value | 2.87E-07 | 1.01E-04 | 8.47E-04 | 2.92E-01 | 2.78E-03 | 4.86E-01 | 4.07E-02 | |
| Rhinitis | Positive | 7.77E-03 | 6.04E-03 | 4.32E-03 | 3.02E-03 | 2.16E-03 | 8.63E-04 | 1.38E-02 |
| Negative | 1.23E-03 | 1.42E-03 | 1.32E-03 | 1.36E-03 | 1.38E-03 | 2.04E-03 | 1.96E-02 | |
| Ratio (Positive/Negative) | 6.32 | 4.27 | 3.26 | 2.22 | 1.57 | 0.42 | 0.70 | |
| p-value | 2.08E-16 | 2.61E-08 | 1.58E-04 | 3.63E-02 | 3.21E-01 | 2.11E-01 | 4.59E-02 |
Additional files
-
Supplementary file 1
Enrichment of diagnosis codes.
(A) Enrichment of diagnosis codes amongst COVIDpos patients in the week preceding PCR testing. (B) Enrichment of diagnosis codes amongst COVIDneg patients in the week preceding PCR testing. (C) Symptoms and their synonyms used for the EHR analysis. (D) Pairwise analysis of symptoms in the COVIDpos and COVIDneg cohorts. The pairwise symptom combinations with BH-corrected p-value<0.01 are summarized. (E) Patients with at least one clinical note over time. (F) SciBERT vs. BioClinicalBERT Phenotype Sentiment Model Performance on 18,490 sentences. (G) Model Performance Trained on 18,490 Sentences Containing 250 Different Cardiovascular, Pulmonary, and Metabolic Phenotype. (H) Model Performance Trained on 21,678 Sentences Containing 250 Different Cardiovascular, Pulmonary, and Metabolic Phenotypes and Expanded to Include 26 COVID-related Symptoms. (I) Synonym classification model performance
- https://cdn.elifesciences.org/articles/58227/elife-58227-supp1-v3.docx
-
Transparent reporting form
- https://cdn.elifesciences.org/articles/58227/elife-58227-transrepform-v3.pdf
Download links
A two-part list of links to download the article, or parts of the article, in various formats.
Downloads (link to download the article as PDF)
Open citations (links to open the citations from this article in various online reference manager services)
Cite this article (links to download the citations from this article in formats compatible with various reference manager tools)
Augmented curation of clinical notes from a massive EHR system reveals symptoms of impending COVID-19 diagnosis
eLife 9:e58227.
https://doi.org/10.7554/eLife.58227


