Cytoplasmic mRNA decay represses RNA polymerase II transcription during early apoptosis
- Department of Molecular and Cell Biology; University of California, Berkeley, United States
- Department of Plant and Microbial Biology; University of California, Berkeley, United States
- Howard Hughes Medical Institute, Berkeley, United States
Figures
Figure 1 with 1 supplement
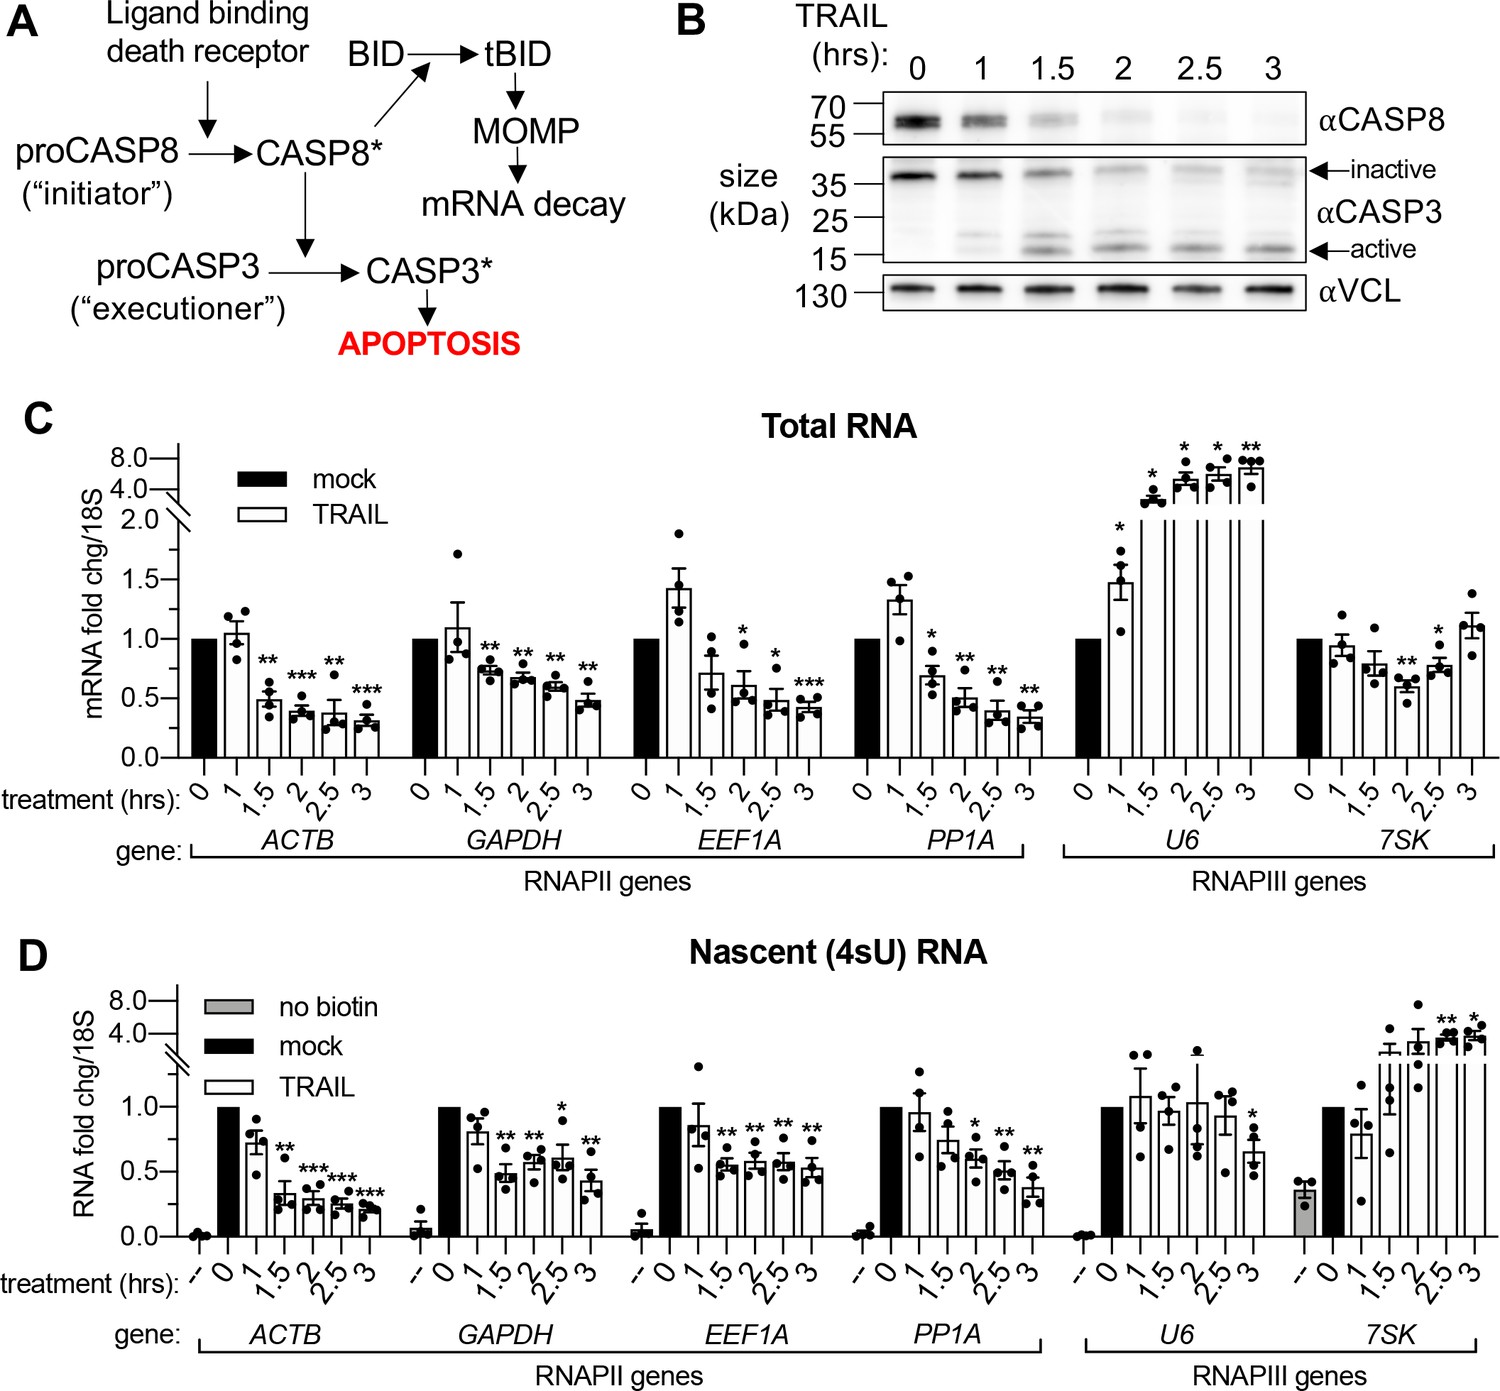
mRNA decay during early apoptosis is accompanied by reduced synthesis of RNAPII transcripts.
(A) Schematic representation of how the extrinsic apoptotic pathway accelerates mRNA decay. (B) Western blot of HCT116 lysates showing the depletion of full-length caspase 8 (CASP8) and caspase 3 (CASP3) over a time course of 100 ng/μL TRAIL treatment. Vinculin (VCL) serves as a loading control. Blot representative of those from four biological replicates. (C, D) RT-qPCR quantification of total (C) and nascent 4sU pulse-labeled (D) RNA at the indicated times post TRAIL treatment of HCT116 cells (n = 4). Also see Figure 1—figure supplement 1. No biotin control quantifies RNA not conjugated to biotin that is pulled down with strepdavidin selection beads. Fold changes were calculated from Ct values normalized to 18S rRNA in reference to mock treated cells. Graphs display mean ± SEM with individual biological replicates represented as dots. Statistically significant deviation from a null hypothesis of 1 was determined using one sample t test; *p<0.05, **p<0.01, ***p<0.001 (p values provided in Supplementary file 1A for all figures).
Figure 1—figure supplement 1
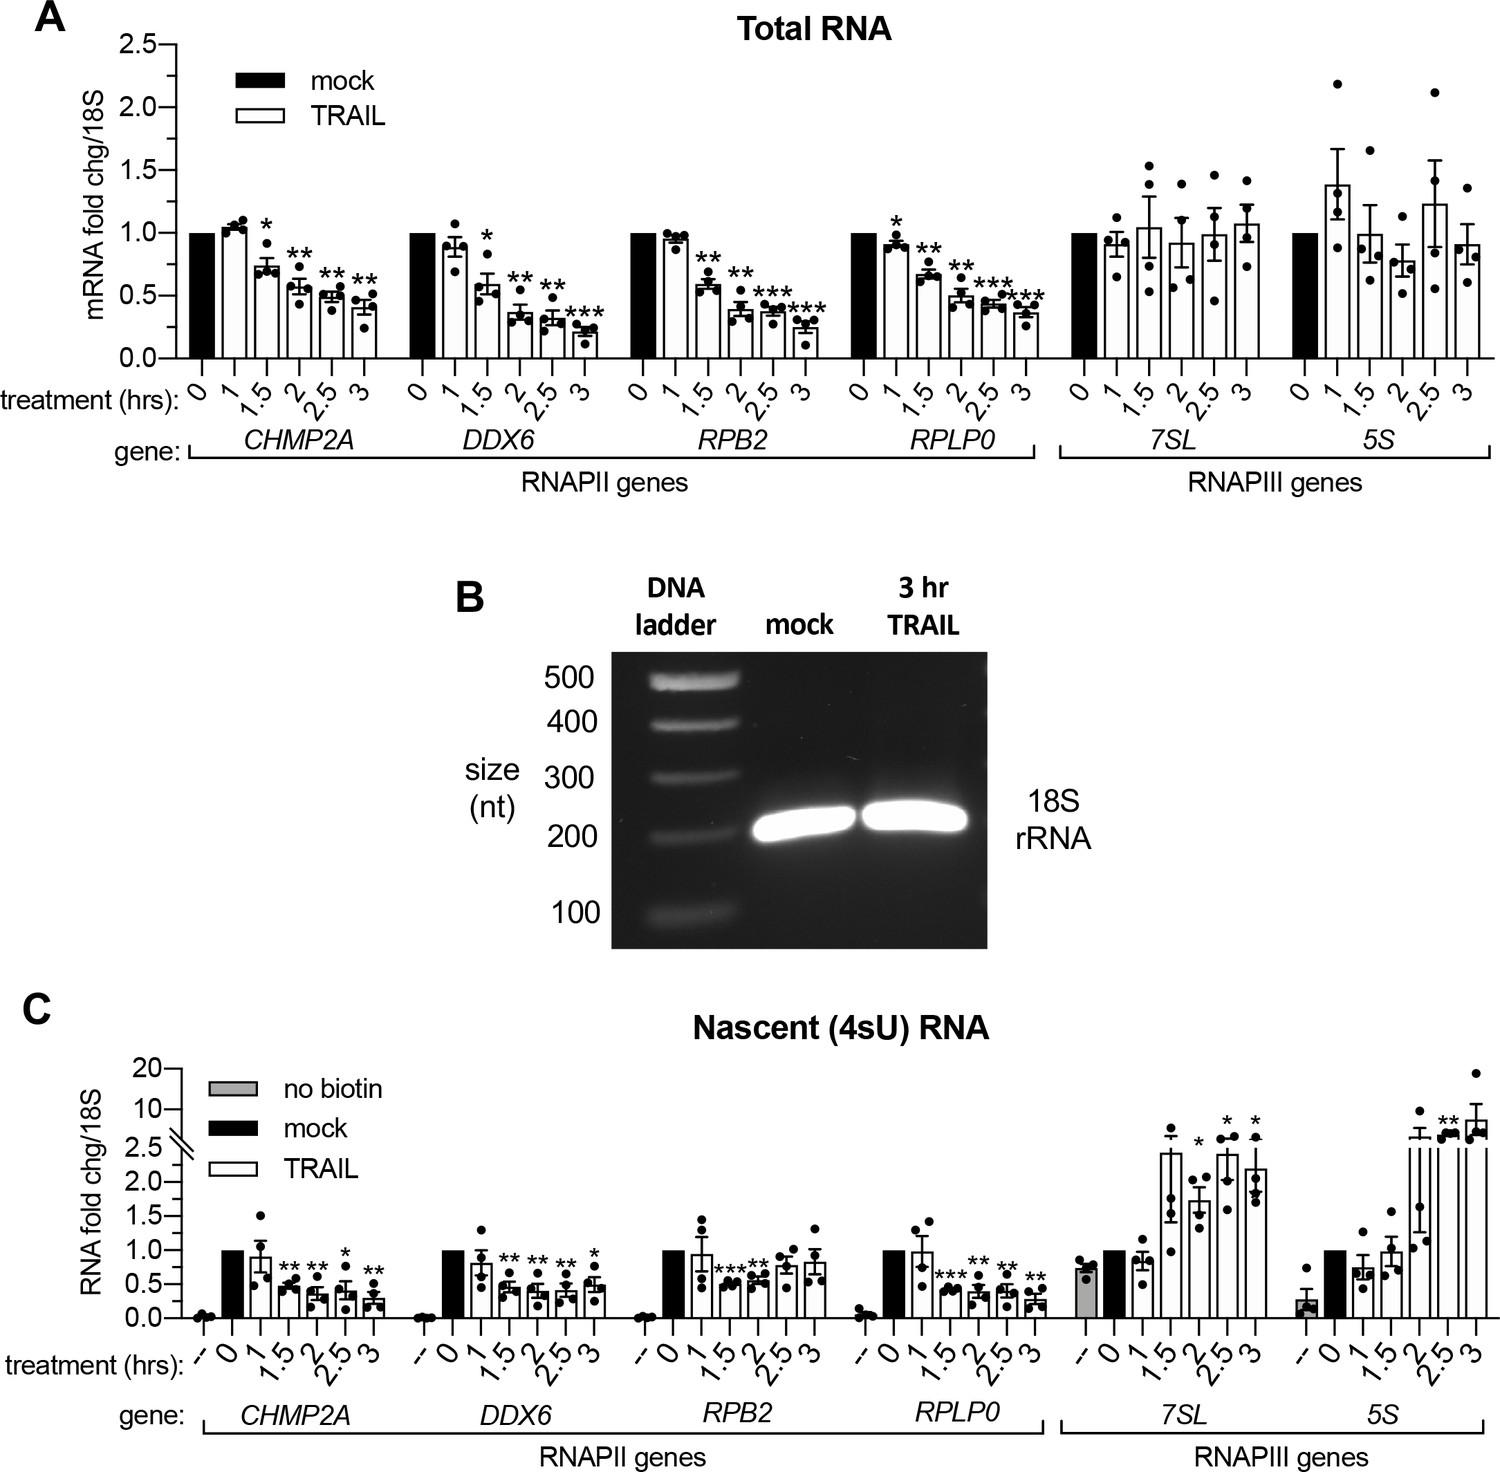
mRNA decay during early apoptosis is accompanied by reduced synthesis of RNAPII transcripts.
(A) RT-qPCR quantification of total RNA at the indicated times post 100 ng/μL TRAIL treatment of HCT116 cells (n = 4). (B) Stained agarose gel depicting a 200 nt RT-PCR product of 4sU-labeled 18S rRNA, extracted and isolated from an equal number of cells treated with 3 hr vehicle (‘mock’) or 100 ng/μL TRAIL. Gel representative of that from three biological replicates. (C) RT-qPCR quantification of 4sU-labeled RNA at the indicated times post 100 ng/μL TRAIL treatment of HCT116 cells (n = 4). Fold changes were calculated from Ct values normalized to 18S rRNA in reference to mock treated cells. Graphs display mean ± SEM with individual biological replicates represented as dots. Statistically significant deviation from a null hypothesis of 1 was determined using one sample t test; *p<0.05, **p<0.01, ***p<0.001.
Figure 2 with 1 supplement
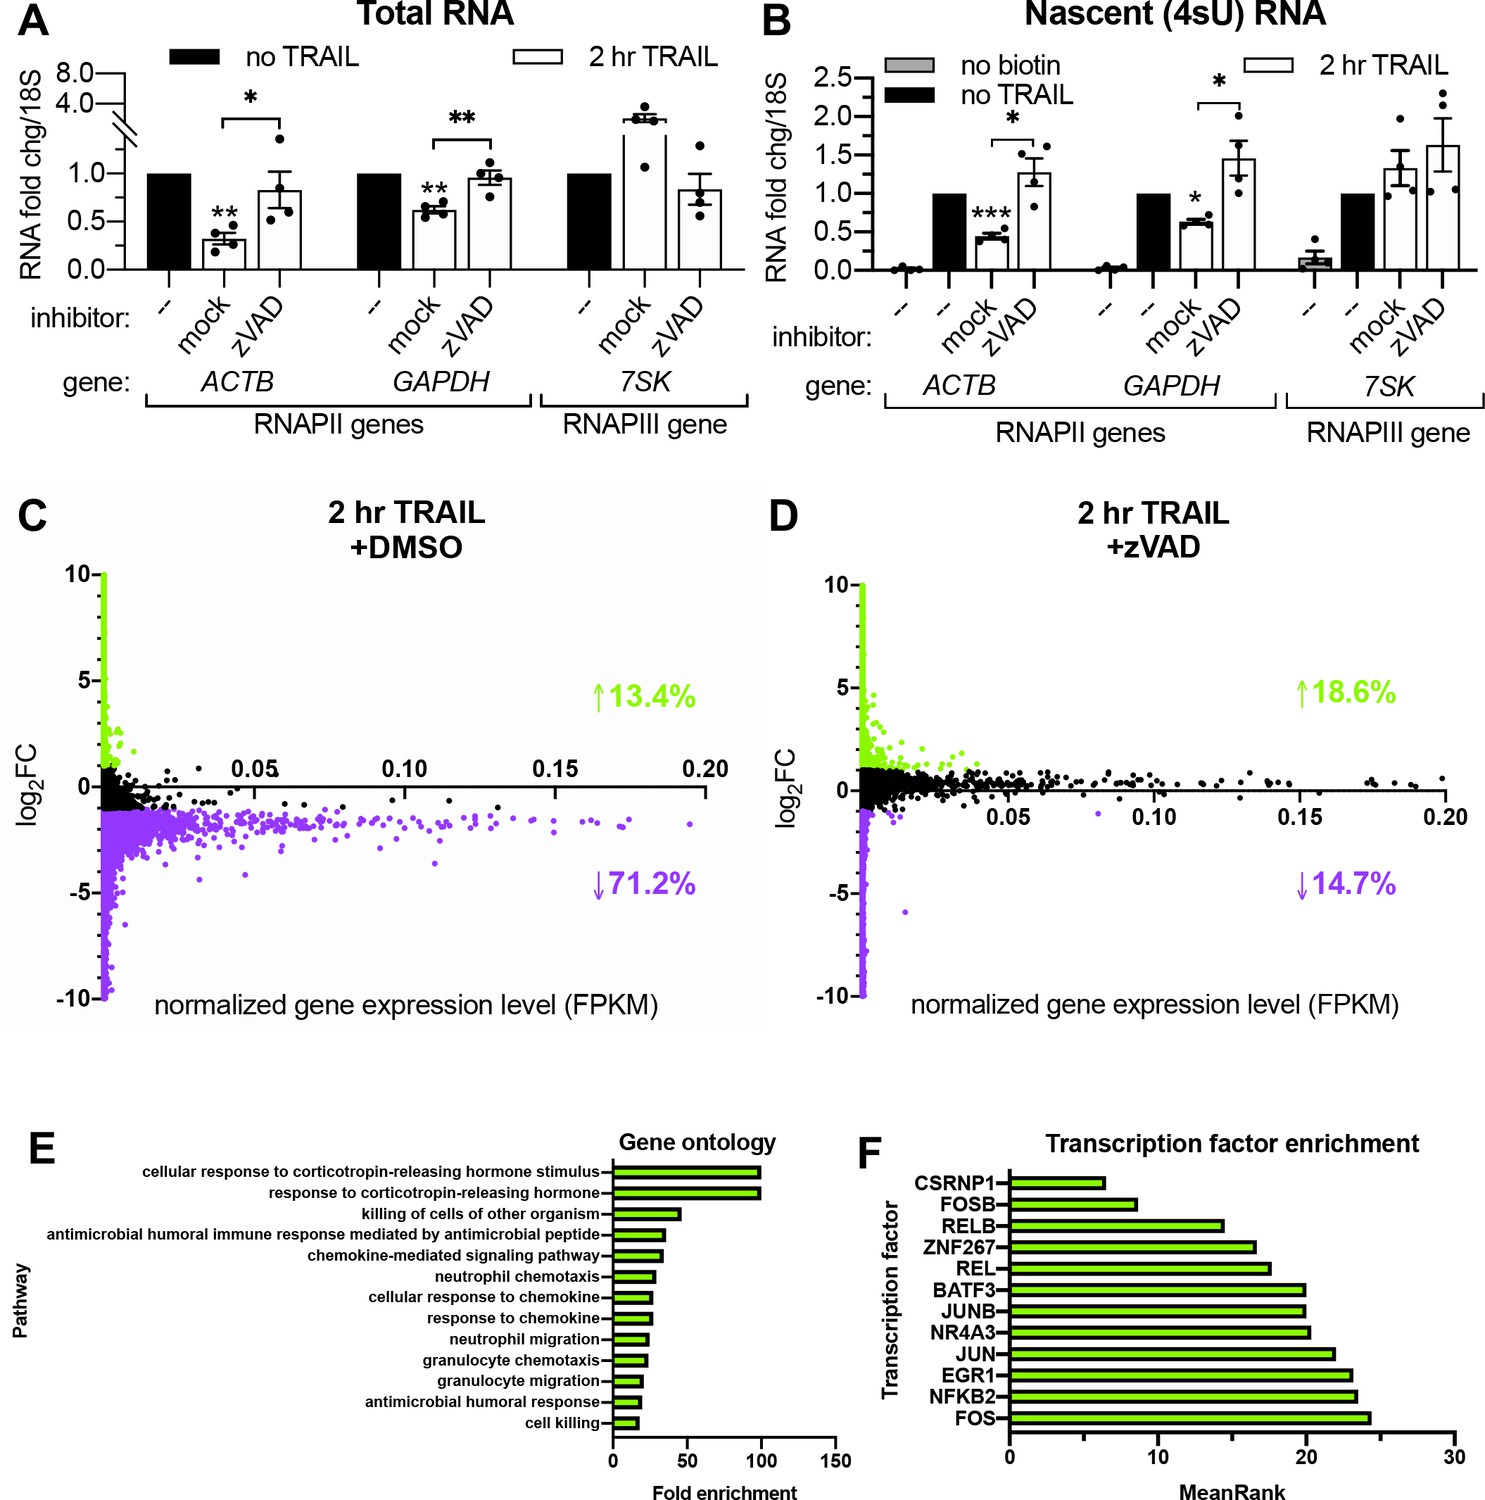
RNAPII transcription is globally repressed during early apoptosis.
(A, B) RT-qPCR measurements of total (A) and nascent 4sU-labeled (B) RNA fold changes after 2 hr TRAIL treatment of HCT116 cells, including a 1 hr pre-treatment with either 40 μM zVAD or an equal volume of DMSO (‘mock’). Also see Figure 2—figure supplement 1A. RNA fold change values were calculated in reference to 18S rRNA. Bar graphs display mean ± SEM with individual biological replicates (n = 4) represented as dots. Statistically significant deviation from a null hypothesis of 1 was determined using one sample t test and indicated with asterisks directly above bars, while student’s t tests were performed to compare mean fold change values for mock inhibitor or scramble treated cells to those treated with inhibitor or a targeting siRNA and indicated with brackets. *p<0.05, **p<0.00.1, ***p<0.001. (C, D) rRNA-depleted cDNA sequencing libraries were reverse transcribed from 4sU-labeled RNA isolated from cells under the conditions described in (A, B). Transcripts that aligned to genes in the human genome are graphed with differential log2 fold change expression values (log2FC) on the y axis and fragments per kilobase per million reads (FKPM) expression values (normalized to ERCC spike-in controls) on the x axis. All values were averaged from two biological replicates. Data points for transcripts upregulated or downregulated by twofold or greater are colored green and purple, respectively. Percentages of transcripts in each expression class are indicated with an arrow and in their corresponding colors. Also see Figure 2—figure supplement 1C–D and Figure 2—source data 1A–B. (E) Top statistically significant hits from gene ontology analysis performed for the list of transcripts that were upregulated upon TRAIL treatment with DMSO in a statistically significant manner across biological duplicates. Also see Figure 2—source data 1C. (F) Top hits from transcription factor (TF) enrichment analysis for the same list of genes as above. The lower the MeanRank value, the more statistically significant enrichment for genes regulated by the indicated TF. Also see Figure 2—source data 1D.
-
Figure 2—source data 1
4sU-seq differential gene expression and enrichment analyses.
(A) Differential 4sU-labeled transcript expression values (averaged across two replicates and normalized to ERCC spike-ins) upon 2 hr TRAIL treatment with 1 hr DMSO (vehicle) pre-treatment. Includes gene, transcript identifiers, and RefSeq annotations. (B) Differential 4sU-labeled transcript expression values (averaged across two replicates and normalized to ERCC spike-ins) upon 2 hr TRAIL treatment with 1 hr zVAD pre-treatment. Includes gene, transcript identifiers, and RefSeq annotations. (C) GO enrichment anaylsis for subset of genes represented in the transcripts upregulated >2 fold upon TRAIL treatment (with 1 hr DMSO pre-treatment). Only statistically significant (FDR < 0.05) enrichments are listed. (D) Transcription factor enrichment analysis for subset of genes represented in the transcripts upregulated >2 fold upon TRAIL treatment (with 1 hr DMSO pre-treatment).
- https://cdn.elifesciences.org/articles/58342/elife-58342-fig2-data1-v2.xlsx
Figure 2—figure supplement 1
RNAPII transcription is globally repressed during early apoptosis.
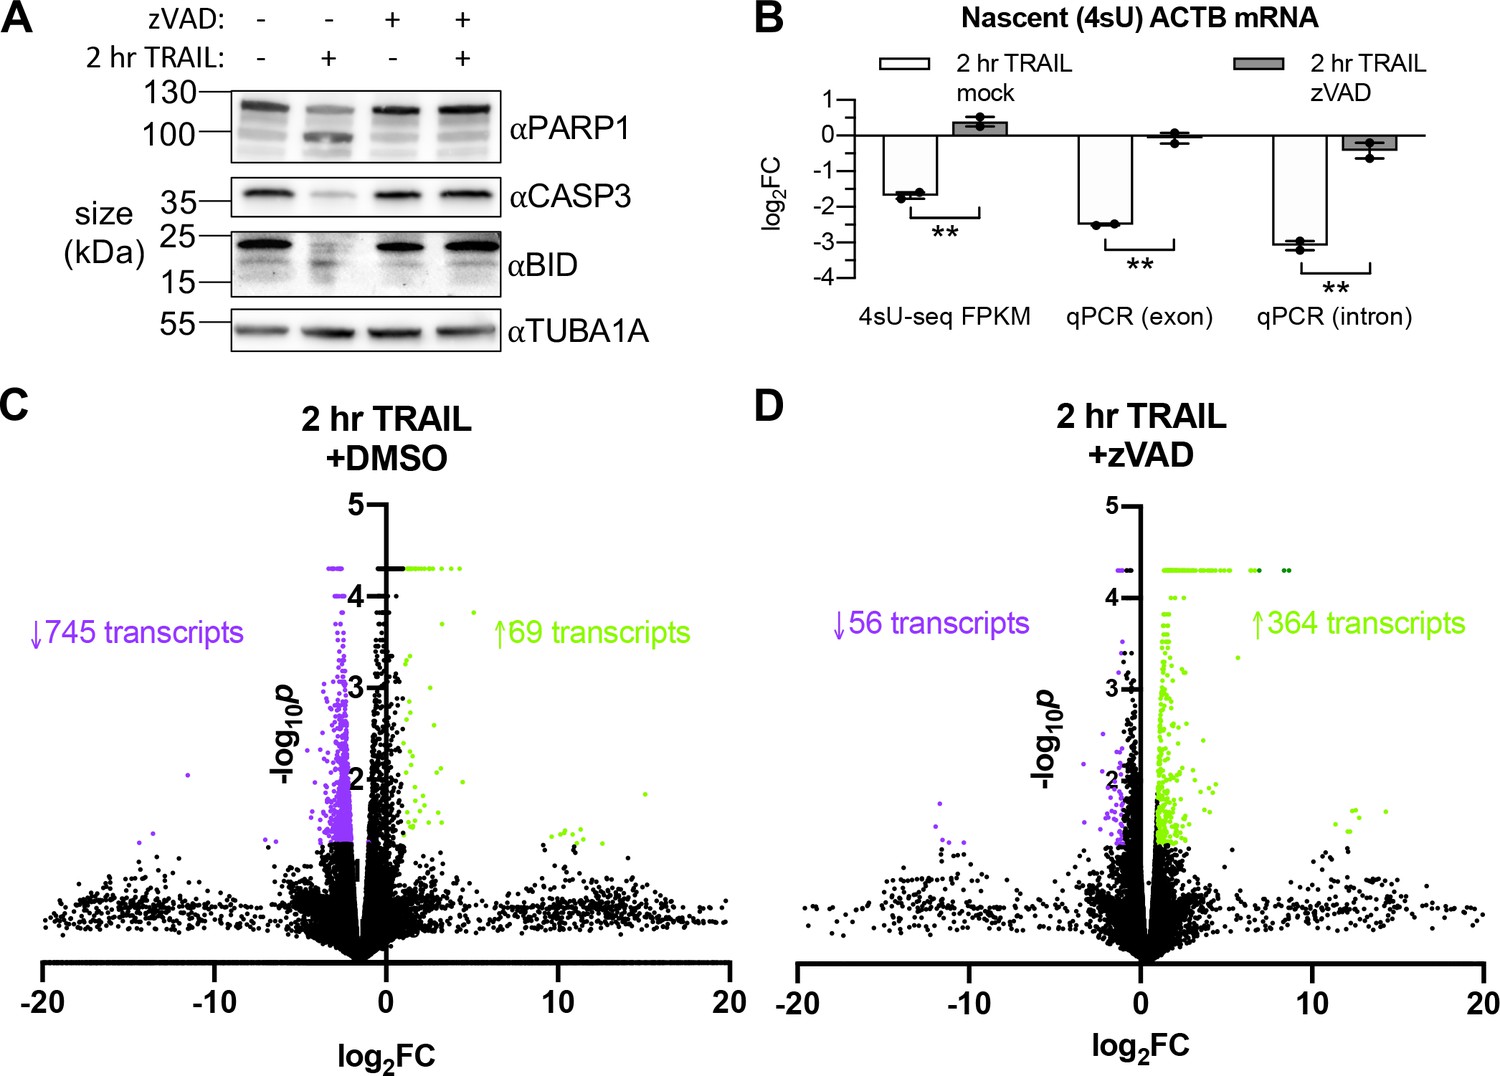
(A) Western blot of HCT116 lysates showing cleavage (or lack thereof) of the caspase 8 (CASP8) targets BID and caspase 3 (CASP3), as well as the CASP3 target PARP1 upon 2 hr 100 ng/μL TRAIL treatment in the presence or absence of 40 μM zVAD. Blot representative of that from three biological replicates. (B) Log2 fold change (log2FC) in abundance of the ACTB transcript upon 2 hr TRAIL treatment in the presence of either zVAD or DMSO vehicle (‘mock’). Fold changes from the same 4sU-labeled RNA samples were quantified by next-generation sequencing and differential expression analysis, as well as RT-qPCR normalized to 18S rRNA using both intronic and exonic gene-specific primers. Graph displays mean ± SEM with individual biological replicates (n = 2) represented as dots. Student’s t tests were performed to compare the log2FC values upon TRAIL treatment in the presence of DMSO vehicle or zVAD. **p<0.00.1 (C, D) Volcano plot depicting the –log10p values across biological duplicates for the fragment per kilobase per million read fold changes in the sequencing libraries depicted in Figure 2C,D. Each point represents a transcript mapped to the human genome. Upregulated and downregulated transcripts with |FC| > 2 and p<0.05 are colored in green and purple, respectively. Number of transcripts in each expression class are indicated with an arrow and in their corresponding colors.
Figure 3 with 1 supplement
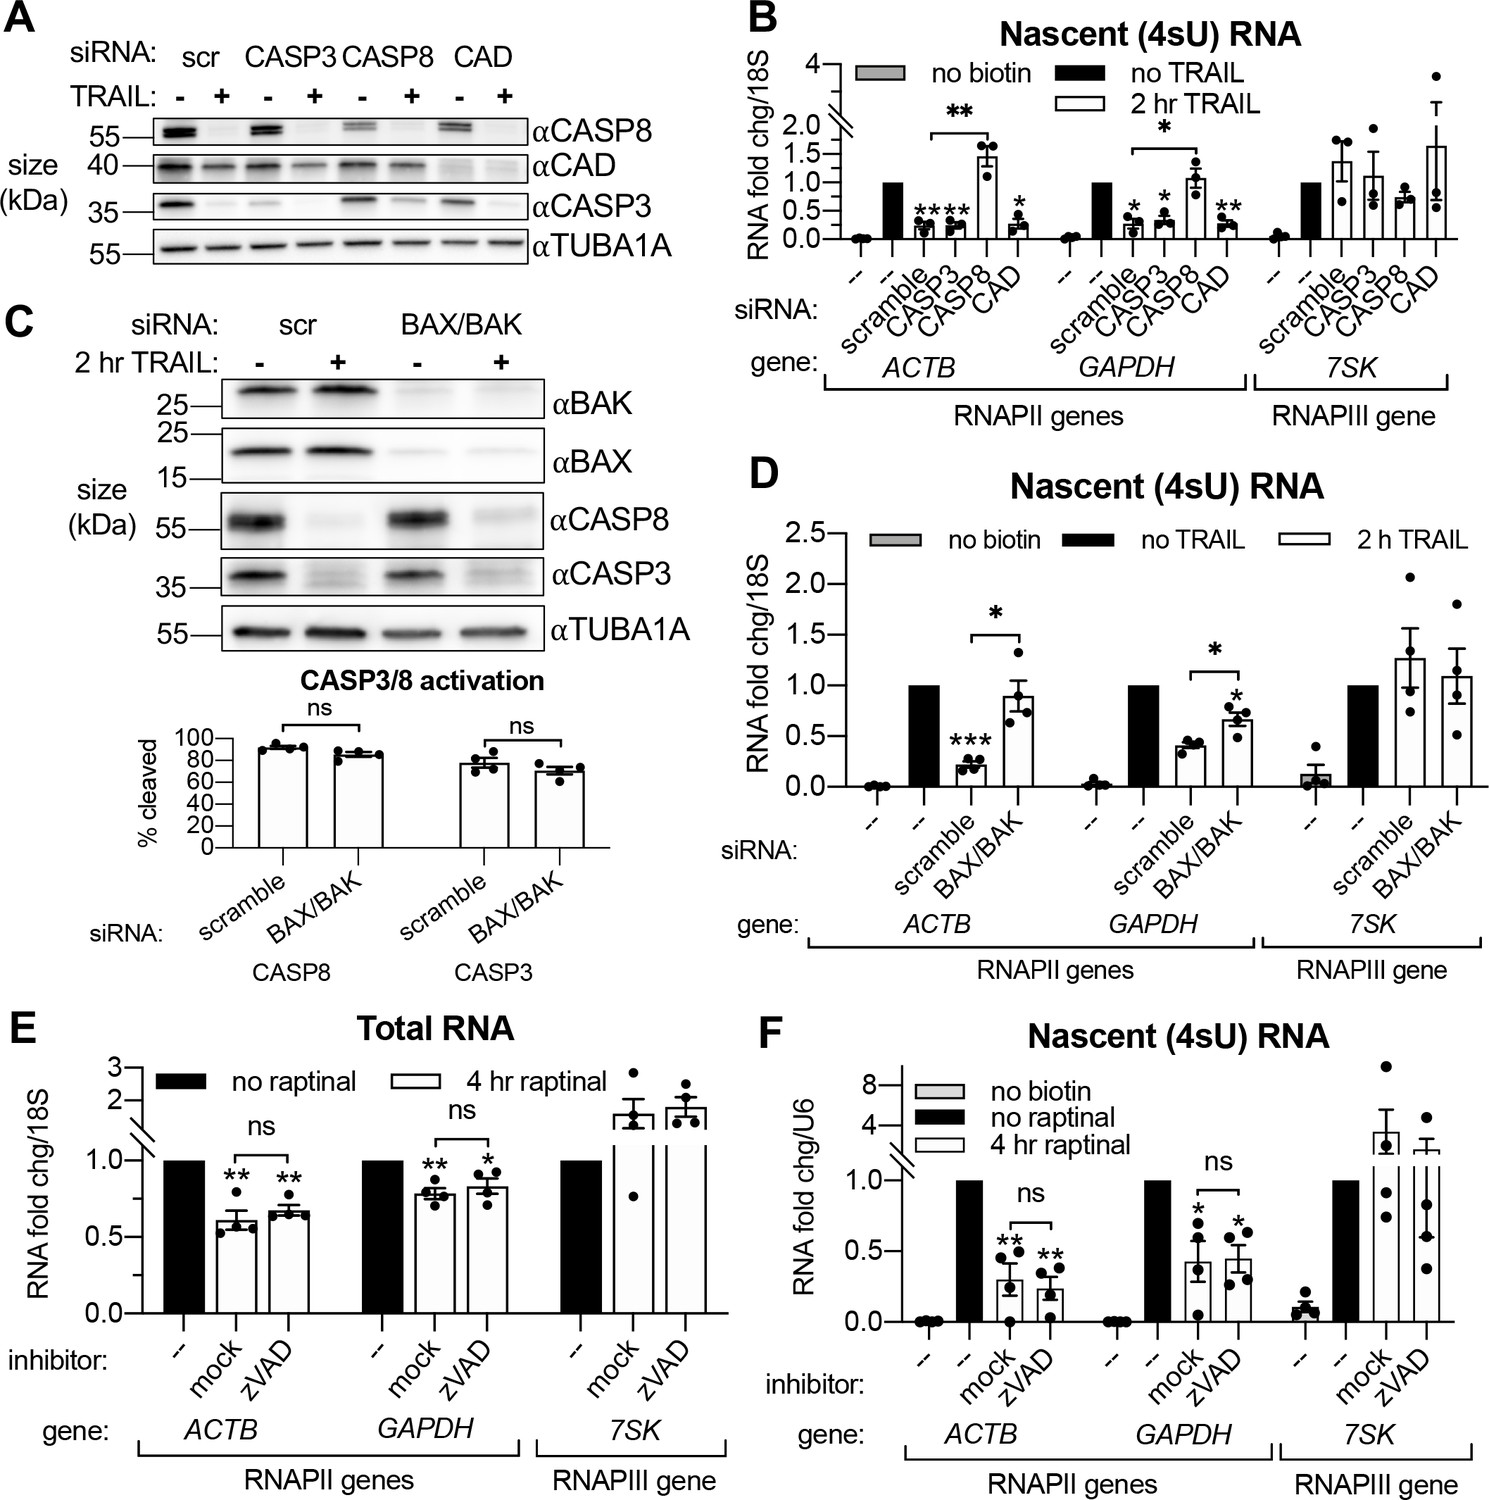
Transcriptional repression during early apoptosis requires MOMP, but not necessarily caspase activity.
(A) Western blots showing the efficacy of CASP3, CASP8, and caspase-activated DNase (CAD) protein depletion following nucleofection with the indicated siRNAs, with or without 2 hr TRAIL treatment. α-Tubulin (TUBA1A) serves as a loading control. Blot representative of those from four biological replicates. (B) RT-qPCR measurements of 4sU-labeled nascent transcripts with or without 2 hr TRAIL treatment in cells nucleofected with the indicated the siRNAs (n = 3). Also see Figure 3—figure supplement 1A–C. (C) Western blot detecting the indicated proteins in cells nucleofected with the indicated siRNA in the presence or absence of TRAIL. TUBA1A serves as a loading control. Blot representative of four biological replicates. The cleavage of CASP3 and CASP8 (as measured by the disappearance of the full-length form of each zymogen upon 2 hr TRAIL treatment, normalized to TUBA1A) is graphed below (n = 4). (D) 4sU-labeled RNA levels measured by RT-qPCR in HCT116 cells nucleofected with the indicated siRNAs, with or without 2 hr TRAIL treatment (n = 4). Also see Figure 3—figure supplement 1D. (E, F) Total (E) and 4sU-labeled (F) RNA levels measured by RT-qPCR in HeLa cells after 10 μM raptinal treatment for 4 hr, with or without a 1 hr pre-treatment of 20 μM zVAD (n = 4). Also see Figure 2—figure supplement 1E. Fold changes were calculated in reference to the U6 small nuclear RNA (snRNA) transcript since its production was more stable after 4 hr raptinal than that of 18S rRNA (see Figure 2—figure supplement 1F). All RNA fold changes were calculated from Ct values normalized to 18S or U6 RNA, then normalized to non-apoptotic cells (‘no TRAIL’) under otherwise identical conditions. Graphs display mean ± SEM with individual biological replicates represented as dots. Statistically significant deviation from a null hypothesis of 1 was determined using one sample t test and indicated with asterisks directly above bars, while student’s t tests were performed to compare mean fold change values for mock inhibitor or scramble treated cells to those treated with zVAD or a targeting siRNA and indicated with brackets. The Holm-Sidak correction for multiple comparisons was applied in the student’s t tests represented in (A, B) *p<0.05, **p<0.00.1, ***p<0.001.
Figure 3—figure supplement 1
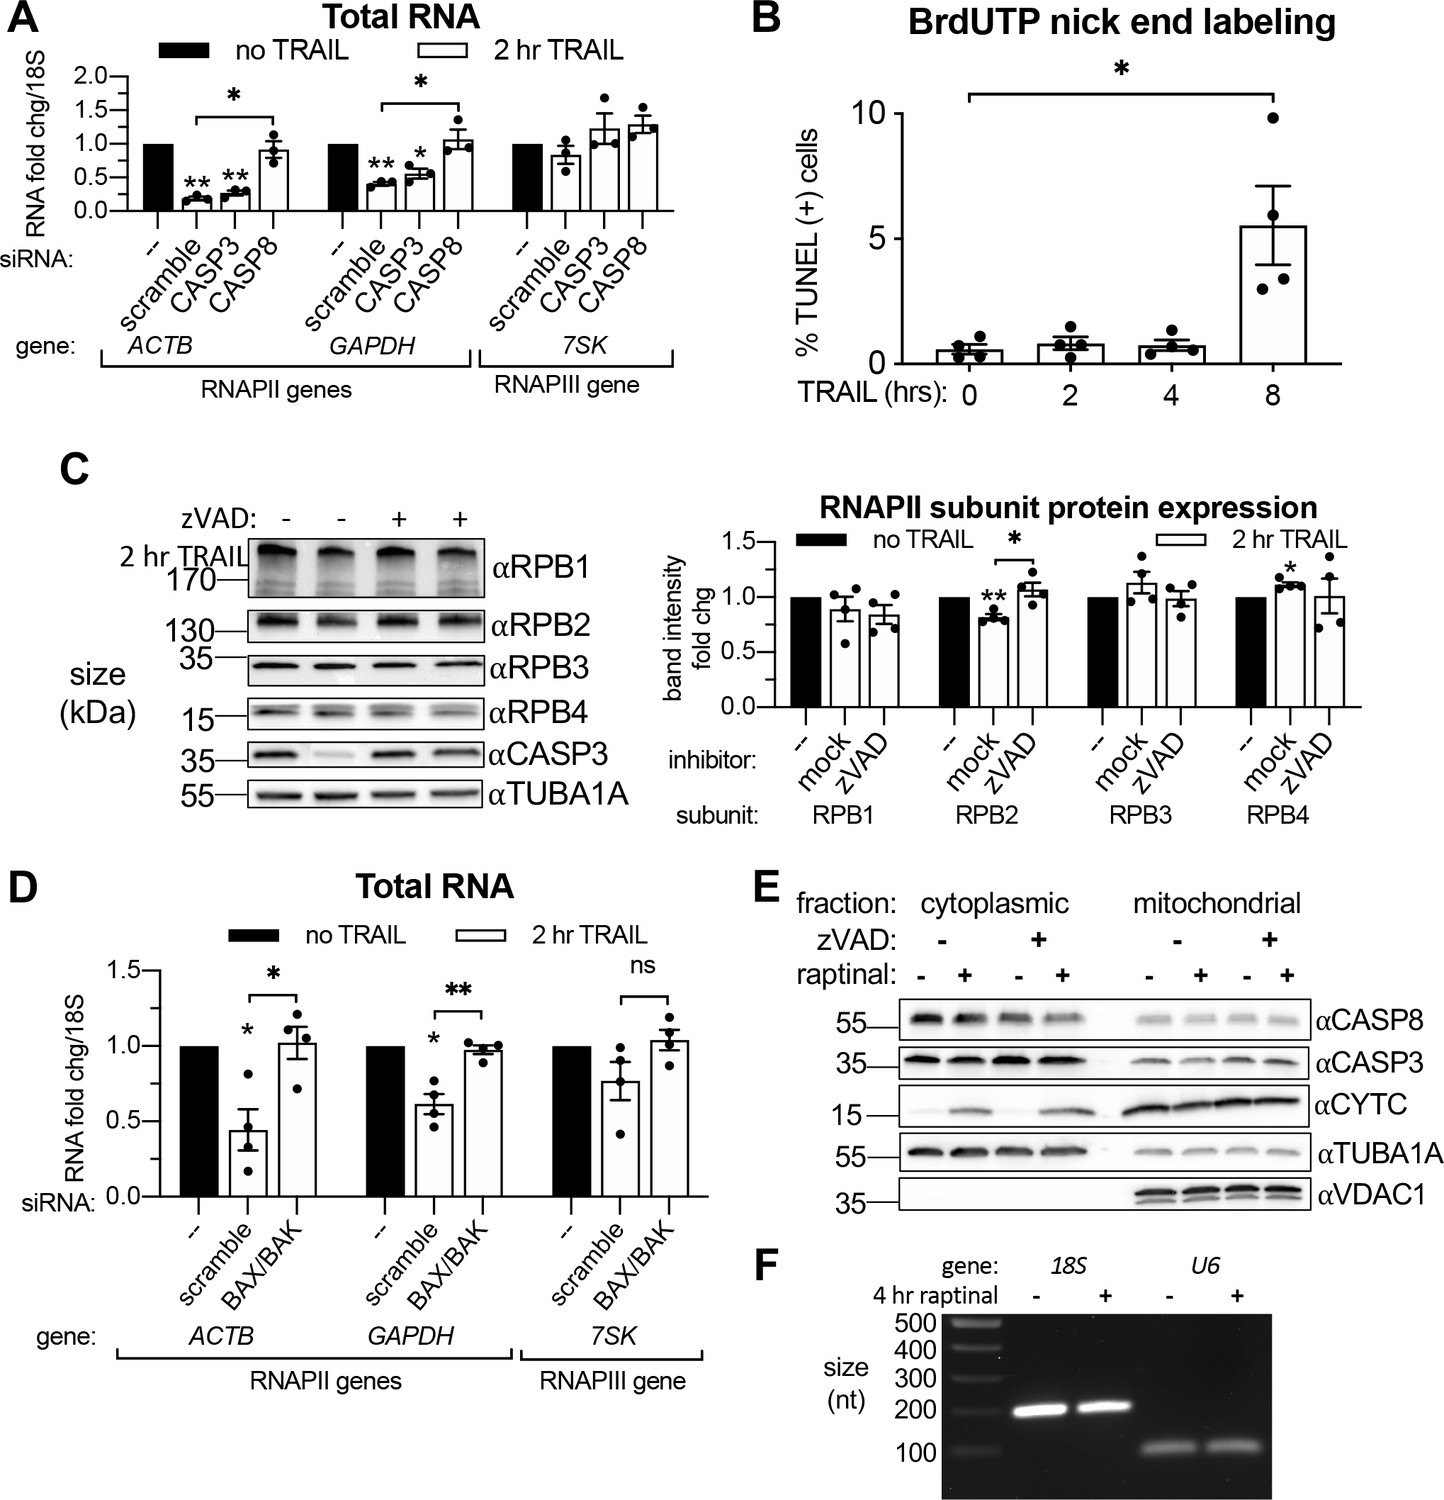
Transcriptional repression during early apoptosis requires MOMP, but not necessarily caspase activity.
(A) RT-qPCR quantification of the change in total RNA levels in HCT116 cells treated with the indicated siRNAs upon 2 hr TRAIL treatment. Fold change were calculated from Ct values normalized to 18S rRNA. (B) Quantification of BrdUTP-labeled HCT116 cells treated with TRAIL for the indicated times in a TUNEL assay (n = 4). Percent-positive cells calculated by flow cytometry using FloJo imaging software to count the number of cells with elevated FL2 fluorescence. (C) Western blot of HCT116 lysates from cells under conditions described in (A) depicting levels of the indicated RNAPII subunits and CASP3 activation. α-Tubulin (TUBA1A) serves as a loading control. Graph to the right quantifies the change in RNAPII subunit levels upon apoptosis induction by TUBA1A-normalized band density (n = 4). (D) Total RNA levels measured by RT-qPCR in HCT116 cells nucleofected with the indicated siRNAs, with or without 2 hr TRAIL treatment (n = 4). (E) Western blot of the cytoplasmic and mitochondrial fractions of HeLa cells treated with 10 μM raptinal or equal volume of DMSO, in the presence of 20 μM zVAD or additional volume of DMSO. Efficacy of raptinal treatment was demonstrated by cytochrome c (CYTC) release into the cytoplasm in the presence and absence of zVAD, which effectively blocked the cleavage and activation of CASP3. TUBA1A and VDAC1 served as cytoplasmic and mitochondrial loading controls, respectively. Blot representative of that from three biological replicates. (F) Stained agarose gel depicting a 200 nt and 101 nt RT-PCR product of 4sU-labeled 18S and U6 rRNA, respectively, extracted and isolated from an equal number of cells treated with 4 hr 10 μM raptinal or equal volume of DMSO. Gel representative of that from three biological replicates. All bar graphs display mean ± SEM with individual biological replicates represented as dots. Statistically significant deviation from a null hypothesis of 1 was determined using one sample t test and indicated with asterisks directly above bars, while student’s t tests were performed to compare mean fold change values for mock inhibitor or scramble treated cells to those treated with zVAD or a targeting siRNA and indicated with brackets. The Holm-Sidak correction for multiple comparisons was applied in the student’s t tests represented in (A, B). *p<0.05, **p<0.00.1, ***p<0.001.
Figure 4 with 1 supplement
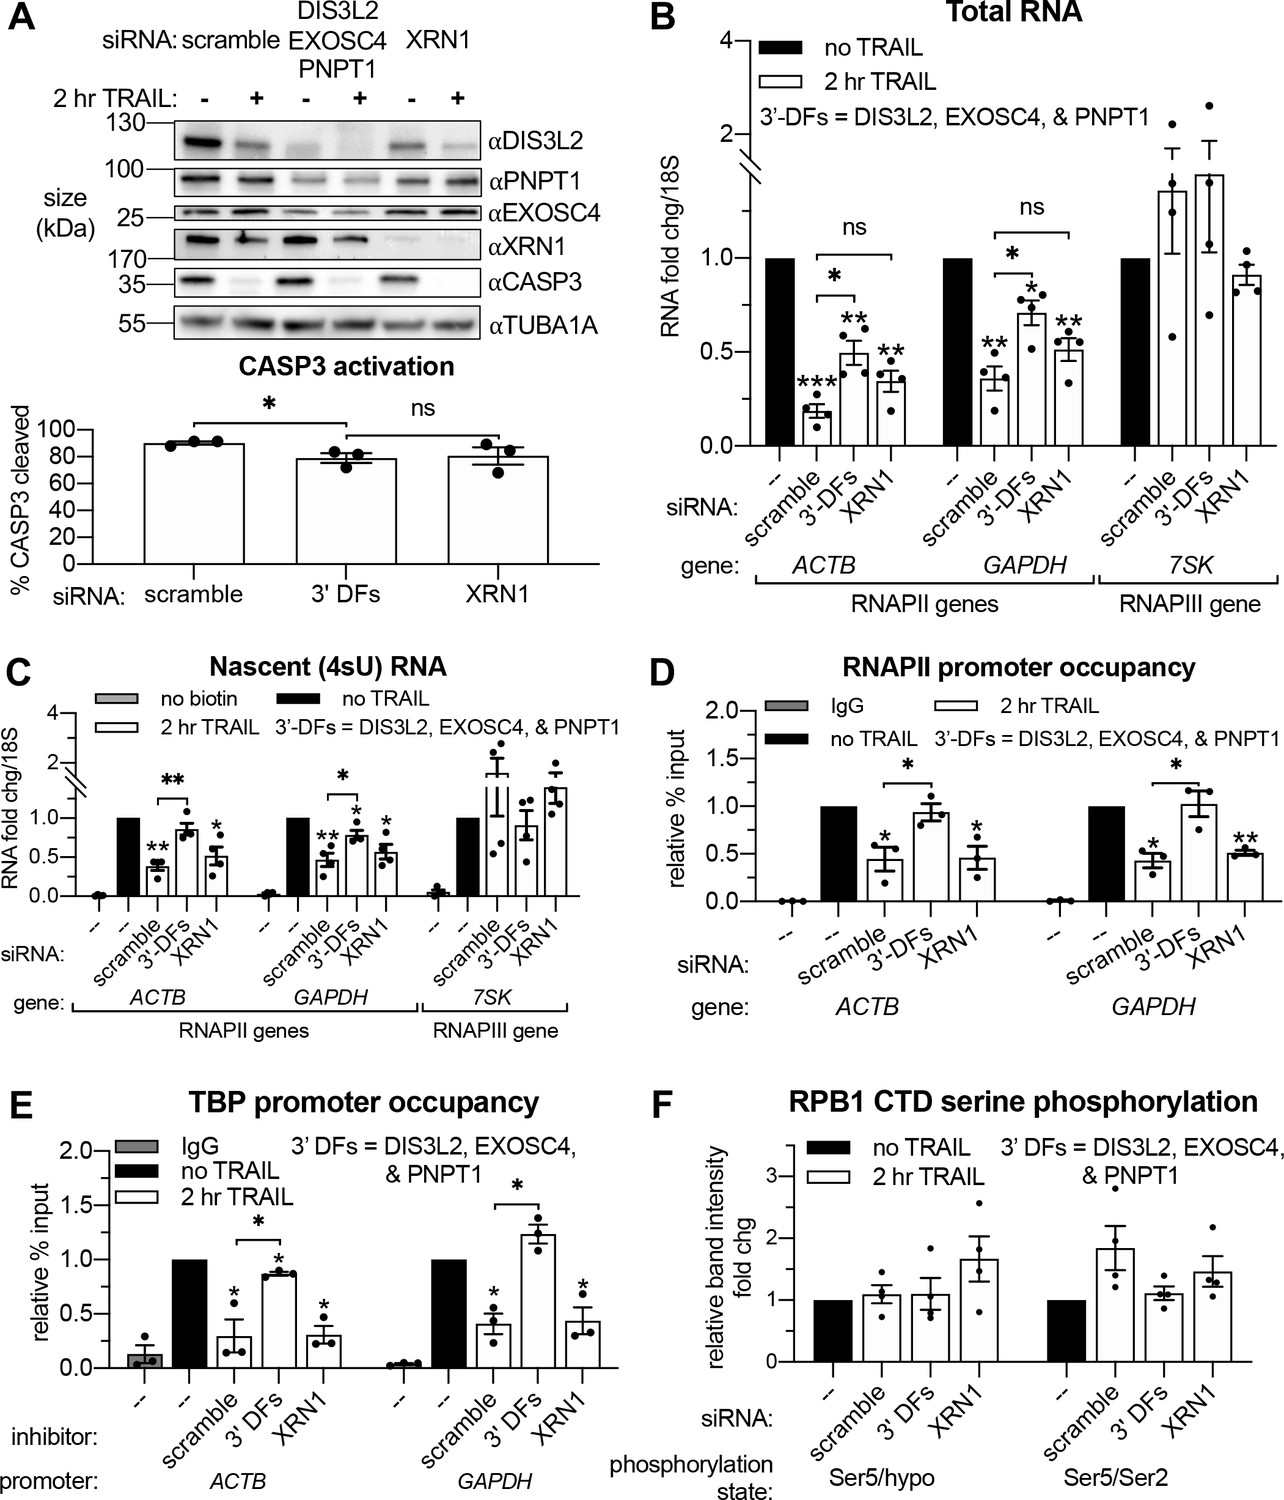
Apoptosis causes reduced RNAPII transcriptional output and promoter occupancy in an mRNA decay-dependent manner.
(A) Western blots performed with lysates from HCT116 cells depleted of the indicated decay factors with and without 2 hr TRAIL treatment. Blot representative of three biological replicates. Apoptosis induction was confirmed by disappearance of the full-length CASP3 band, quantified in the graph below by measuring band intensity normalized to an α-tubulin (TUBA1A) loading control (n = 3). (B, C) Changes in total (B) and nascent 4sU-labeled (C) RNA upon 2 hr TRAIL treatment in cells nucleofected with the indicated siRNAs were quantified by RT-qPCR (n = 4). Fold changes were calculated from Ct values normalized to 18S rRNA. Also see Figure 4—figure supplement 1A–B. (D, E) Chromatin immunoprecipitation (ChIP)-qPCR was used to measure occupancy of the indicated promoters by hypophosphorylated RNAPII (D) or TBP (E) under cellular conditions described in (A). Rabbit and mouse IgG antibodies were included in parallel immunoprecipitation reactions with chromatin from scramble siRNA-treated non-apoptotic cells in lieu of TBP and RNAPII antibodies, respectively, as a control. Also see Figure 4—figure supplement 1D–E. (F) Relative band intensity ratios from four replicates of the representative western blots depicted in Figure 4—figure supplement 1D, using primary antibodies specific to the indicated RPB1 CTD phosphorylation state under cellular conditions described in (A). Band intensity values were first normalized to a vinculin (VCL) loading control in each blot. All bar graphs display mean ± SEM with individual biological replicates represented as dots. Statistically significant deviation from a null hypothesis of 1 was determined using one sample t test and indicated with asterisks directly above bars, while student’s t tests with the Holm-Sidak correction for multiple comparisons were performed to compare mean values between groups indicated with brackets. *p<0.05, **p<0.00.1, ***p<0.001.
Figure 4—figure supplement 1
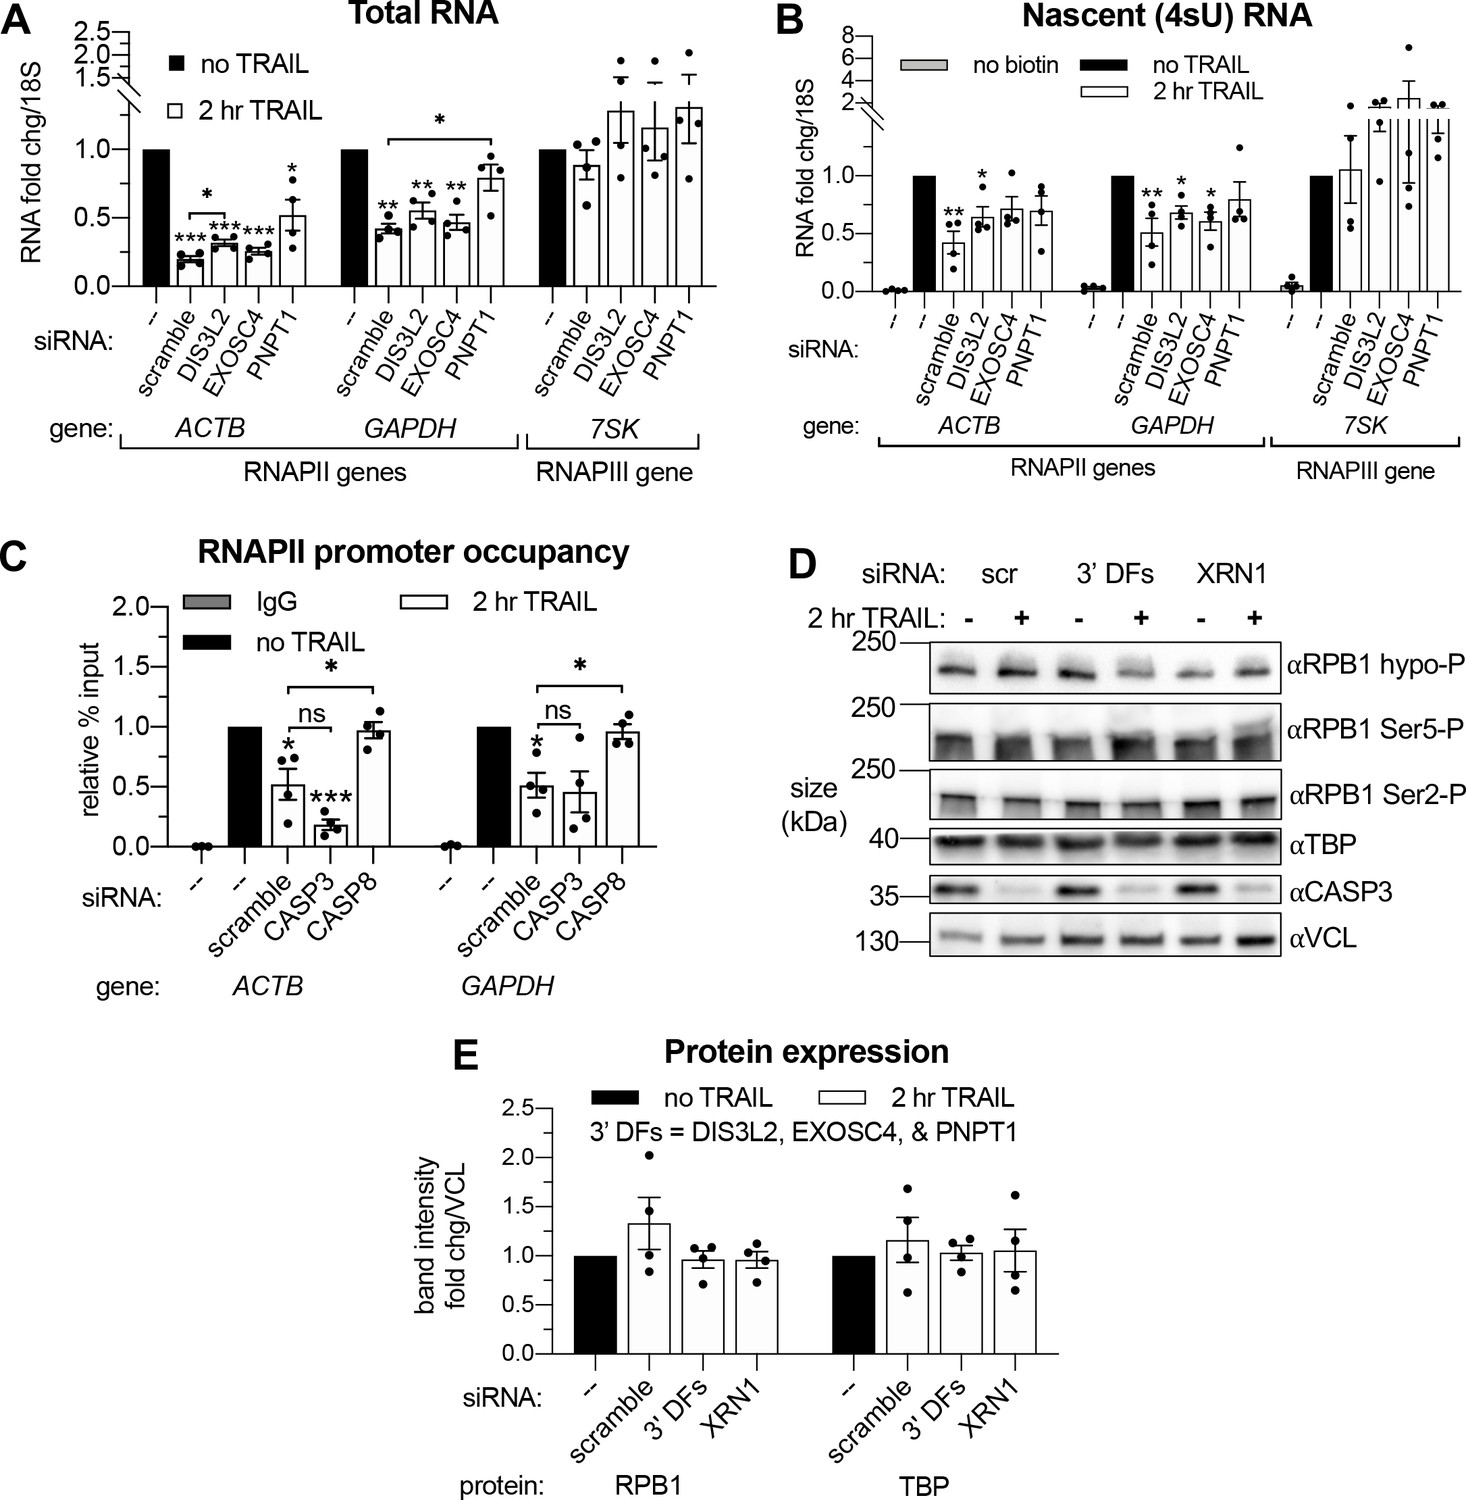
Apoptosis causes reduced RNAPII transcriptional output and promoter occupancy in an mRNA decay-dependent manner.
(A, B) RT-qPCR quantification of the change in total (A) and 4sU-labeled (B) RNA levels in HCT116 cells treated with the indicated siRNAs upon 2 hr TRAIL treatment (n = 4). Fold changes were calculated from Ct values normalized to 18S rRNA. (C) Chromatin immunoprecipitation (ChIP)-qPCR was used to measure the change in hypophosorylated RNAPII occupancy at the indicated promoters in cells nucleofected with the indicated siRNAs (n = 4). Mouse IgG antibody was included in parallel immunoprecipitation reactions with chromatin from scramble siRNA-treated non-apoptotic cells in lieu of RNAPII antibody as a control. (D) Representative western blots on lysates of HCT116 cells depleted of either 3’ DFs (DIS3L2, EXOSC4, and PNPT1) or XRN1 before and after 2 hr TRAIL treatment, probing for the indicated protein or RPB1 C-terminal domain (CTD) phosphorylation state. Apoptosis induction was confirmed by observing CASP3 cleavage. A vinculin (VCL) loading control was imaged for the blots of each phosphorylation state, but a single representative panel is shown. Quantification of RPB1 phosphorylation states from four replicates displayed in Figure 4F. (E) Band intensity fold changes of hypophosphorylated RPB1 and TBP derived from four biological replicates of the experiment described in (D). Bar graph displays mean ± SEM with individual biological replicates represented as dots. Statistically significant deviation from a null hypothesis of 1 was determined using one sample t test and indicated with asterisks directly above bars, while student’s t tests with the Holm-Sidak correction for multiple comparisons were performed to compare mean values between groups indicated with brackets. *p<0.05, **p<0.00.1, ***p<0.001.
Figure 5 with 1 supplement

Importin α/β transport links mRNA decay and transcription.
(A) Western blots showing the indicated proteins in the nuclear and cytoplasmic fractions of apoptotic and non-apoptotic HCT116 cells nucleofected with the indicated siRNAs. The nuclear and cytoplasmic fractions of PABPC1 were imaged on the same membrane section but cropped and edited separately to visualize the low nuclear expression of this canonically cytoplasmic protein. Protein expression (right) was calculated by band intensity in reference to lamin B1 (LMNB1) or α-tubulin (TUBA1A) loading controls, for the nuclear and cytoplasmic fractions, respectively (n = 3). (B) Nuclear and cytoplasmic expression of the indicated proteins in apoptotic and non-apoptotic cells with a 1 hr pre-treatment with 25 μM ivermectin or an equal volume of EtOH (‘mock’). Nuclear levels of the importin α/β substrate nucleolin (NCL) were quantified by band intensity in reference to a LMNB1 loading control, while disappearance of full-length CASP3 was quantified in the cytoplasm in reference to TUBA1A (n = 3). Also see Figure 5—figure supplement 1A (C) Levels of nascent 4sU-labeled RNA (n = 3) were quantified by RT-qPCR under the cellular conditions described in (B). Also see Figure 5—figure supplement 1B–C. (D) RT-qPCR quantification of total RNA levels in HEK293T cells stably expressing a doxycycline (dox)-inducible form of muSOX endonuclease, cultured with or without 1 μg/mL dox for 24 hr. Cells were treated with 25 μM ivermectin or an equal volume of EtOH 2 hr before harvesting (n = 4). (E) RNAPII promoter occupancy at the ACTB and GAPDH promoters (n = 4) was determined by ChIP-qPCR under cellular conditions described in (D). Also see Figure 5—figure supplement 1D–F. RNA fold changes were calculated from Ct values normalized to 18S rRNA. All bar graphs display mean ± SEM with individual biological replicates represented as dots. Statistically significant deviation from a null hypothesis of 1 was determined using one sample t test and indicated with asterisks directly above bars, while student’s t tests were performed to compare mean fold change values for mock inhibitor or scramble treated cells to those treated with ivermectin or a targeting siRNA and indicated with brackets. The Holm-Sidak correction for multiple comparisons was applied in the student’s t tests represented in (A). *p<0.05, **p<0.00.1, ***p<0.001.
Figure 5—figure supplement 1
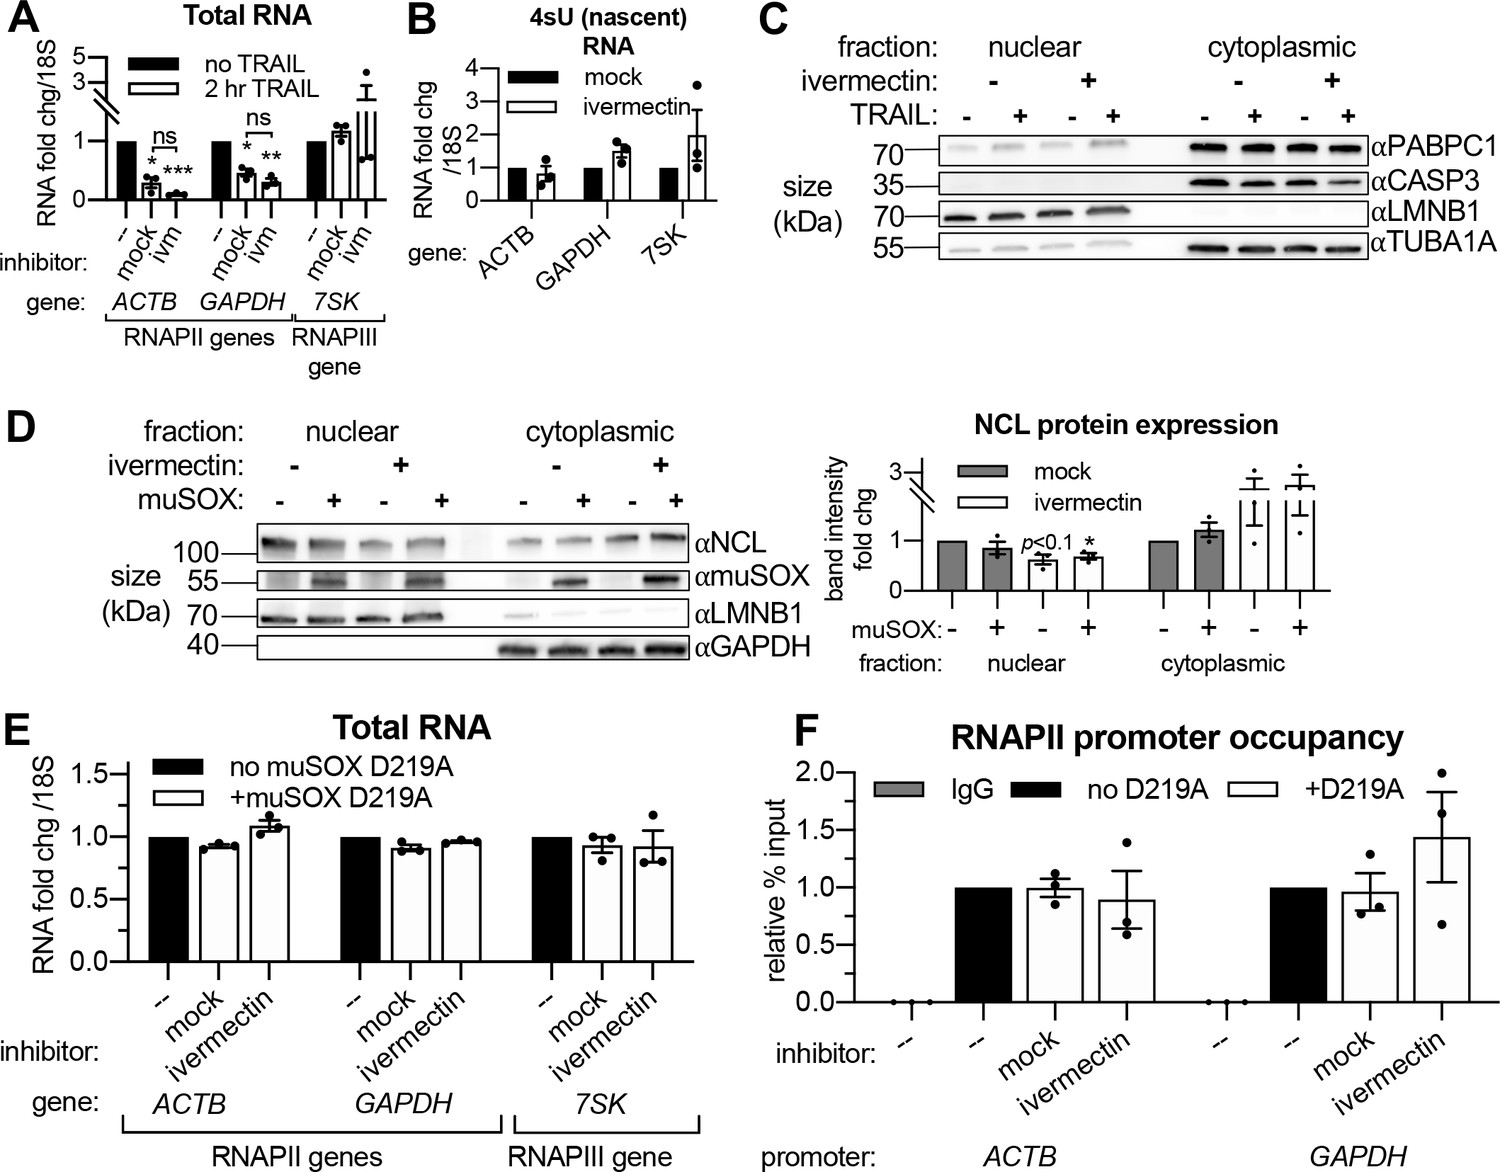
Importin α/β transport links mRNA decay and transcription.
(A) Western blot showing the indicated proteins in the nuclear and cytoplasmic fractions of HCT116 cells with or without 2 hr TRAIL treatment and/or 3 hr ivermectin. Lamin B1 (LMNB1) and TUBA1A served as nuclear and cytoplasmic loading controls, repectively. Blot representative of that from three biological replicates. (B) Changes in total RNA levels after 2 hr TRAIL treatment in HCT116 cells pretreated with either 25 μM ivermectin or an equal volume of ethanol (‘mock’) for 1 hr (n = 3). (C) Alternative analysis of data presented in Figure 5C, instead quantifying the fold change in nascent transcription in non-apoptotic cells in the presence or absence of 25 μM ivermectin (n = 3). (D) Western blot showing nuclear and cytoplasmic expression of the indicated proteins in HEK293T expressing the viral endonuclease muSOX with a 3 hr treatment of 25 μM ivermectin or equal volume of ethanol. Nuclear and cytoplasmic levels (right) of nucleolin (NCL) were quantified by band intensity in reference to a lamin B1 (LMNB1) or glyceraldehyde 3-phosphate dehydrogenase (GAPDH) loading control, respectively. (E) RT-qPCR quantification of the change in total RNA levels upon dox-inducible expression of the catalytically dead D219A mutant of muSOX with a 3 hr treatment of 25 μM ivermectin or equal volume of ethanol (n = 3). (F) RNAPII occupancy at the ACTB and GAPDH promoters (n = 3) under cellular conditions described in (E). RNA fold change values were calculated in reference to 18S rRNA. All bar graphs display mean ± SEM with individual biological replicates represented as dots. Statistically significant deviation from a null hypothesis of 1 was determined using one sample t test and indicated with asterisks directly above bars, while student’s t tests were performed to compare mean fold change values for mock inhibitor or scramble treated cells to those treated with inhibitor or a targeting siRNA and indicated with brackets. *p<0.05, **p<0.00.1, ***p<0.001.
Figure 6
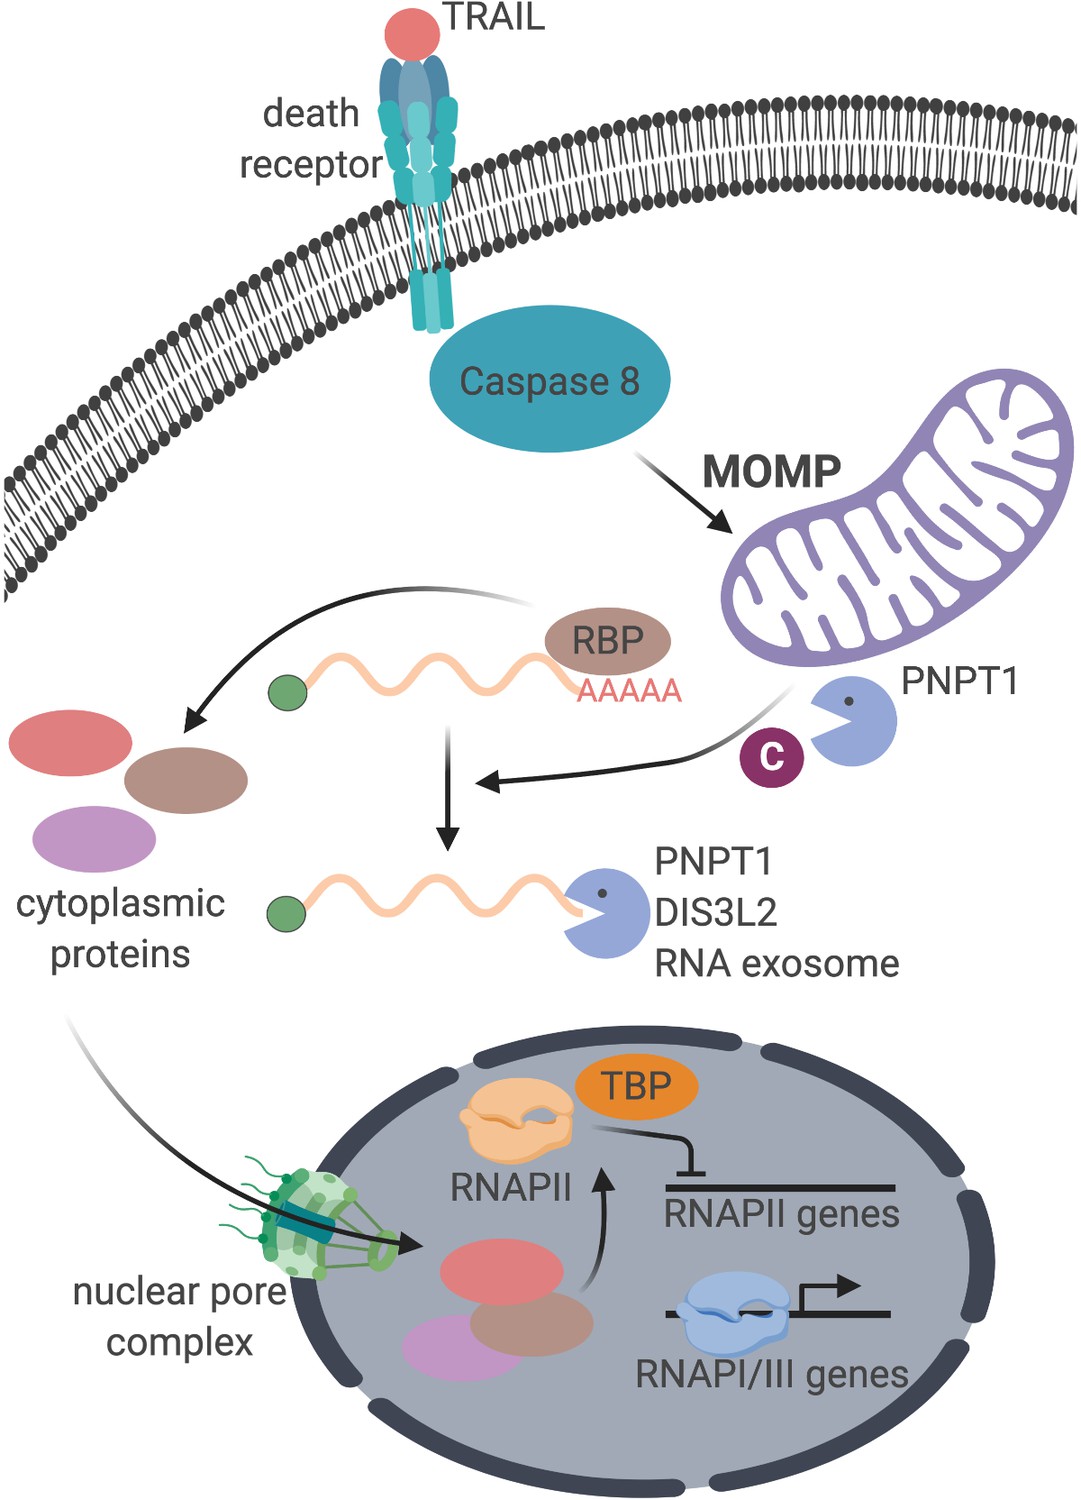
Schematic representation of the cellular events connecting apoptosis induction with mRNA decay and RNAPII transcription.
Tables
Appendix 1—key resources table
| Reagent type (species) or resource | Designation | Source or reference | Identifiers | Additional information |
|---|---|---|---|---|
| Antibody | Anti-RNA polymerase II CTD repeat YSPTSPS (mouse monoclonal) | Abcam | Cat#ab817 | WB: (1:500) ChIP: (1:200) |
| Antibody | Anti-RNA polymerase II CTD repeat YSPTSPS (phospho S2) (rabbit polyclonal) | Abcam | Cat#ab5095: RRID:AB_304749 | WB: (1:1000) |
| Antibody | Anti-RNA polymerase II CTD repeat YSPTSPS (phospho S5) (rabbit polyclonal) | Abcam | Cat#ab5131; RRID:AB_449369 | WB: (1:1000) |
| Antibody | Anti-alpha Tubulin (mouse monoclonal) | Abcam | Cat#ab7291; RRID:AB_2241126 | WB: (1:500) |
| Antibody | Anti-POLR2B (RPB2) (mouse monoclonal) | Santa Cruz Biotechnology | Cat#sc-166803; RRID:AB_2167499 | WB: (1:500) |
| Antibody | Anti-RPB3 (rabbit monoclonal) | Abcam | Cat#ab182150 | WB: (1:10000) |
| Antibody | Anti-POLR2D (RPB4) (rabbit polyclonal) | ThermoFisher Scientific | Cat#PA5-35954; RRID:AB_2553264 | WB: (1:1000) |
| Antibody | Anti-Vinculin (rabbit polyclonal) | Abcam | Cat#ab91459; RRID:AB_2050446 | WB: (1:1000) |
| Antibody | Anti-PNPT1 (rabbit polyclonal) | Abcam | Cat#ab96176; RRID:AB_10680559 | WB: (1:1000) |
| Antibody | Anti-RRP41 (EXOSC4) (rabbit polyclonal) | Abcam | Cat#ab137250 | WB: (1:1000) |
| Antibody | Anti-DIS3L2 (rabbit polyclonal) | Novus Biologicals | Cat#NBP184740; RRID:AB_11038956 | WB: (1:1000) |
| Antibody | Anti-Lamin B1 (rabbit monoclonal) | Abcam | Cat#ab133741; RRID:AB_2616597 | WB: (1:10000) |
| Antibody | Anti-GAPDH (mouse monoclonal) | Abcam | Cat#ab8245; RRID:AB_2107448 | WB: (1:5000) |
| Antibody | Anti-Caspase-8 (rabbit monoclonal) | Cell Signaling Technology | Cat#4790; RRID:AB_10545768 | WB: (1:1000) |
| Antibody | Anti-Caspase-3 (rabbit polyclonal) | Cell Signaling Technology | Cat#9662; RRID:AB_331439 | WB: (1:1000) |
| Antibody | Anti-Bak (rabbit polyclonal) | Cell Signaling Technology | Cat#3814S; RRID:AB_2290287 | WB: (1:1000) |
| Antibody | Anti-Bax Antibody | Cell Signaling Technology | Cat#2772S; RRID:AB_10695870 | WB: (1:1000) |
| Antibody | Anti-XRN1 (rabbit polyclonal) | Bethyl Laboratories | Cat#A300-433A; RRID:AB_2219047 | WB: (1:1000) |
| Antibody | Anti-DFFB (rabbit polyclonal) | Abcam | Cat#ab69438; RRID:AB_2040661 | WB: (1:1000) |
| Antibody | Anti-PABP1 (rabbit polyclonal) | Cell Signaling Technology | Cat#4992; RRID:AB_10693595 | WB: (1:1000) |
| Antibody | Anti-C23 (NCL) (mouse monoclonal) | Santa Cruz Biotechnology | Cat#sc-8031; RRID:AB_672071 | WB: (1:1000) |
| Antibody | Anti-PARP (rabbit polyclonal) | Cell Signaling Technology | Cat#9542; RRID:AB_2160739 | WB: (1:1000) |
| Antibody | Anti-BID (mouse monoclonal) | Santa Cruz Biotechnology | Cat#sc-56025; RRID:AB_781628 | WB: (1:1000) |
| Antibody | Anti-TATA binding protein TBP (mouse monoclonal) | Abcam | Cat#ab51841; RRID:AB_945758 | WB: (1:1000) ChIP: (1:125) |
| Antibody | Anti-Cytochrome c (CYTC) (rabbit monoclonal) | Cell Signaling Technology | Cat#11940: RRID:AB_2637071 | WB: (1:500) |
| Antibody | Anti-VDAC1/Porin (rabbit polyclonal) | Abcam | Cat#ab15895; RRID:AB_2214787 | WB: (1:1000) |
| Antibody | Anti-muSOX (rabbit polyclonal) | This paper | N/A | WB: (1:1000) |
| Other | TrizolTM Reagent | ThermoFisher Scientific | Cat#15596026 | |
| Other | TrizolTM LS Reagent | ThermoFisher Scientific | Cat#10296028 | |
| Peptide, recombinant protein | TURBO DNase | ThermoFisher Scientific | Cat#AM2238 | |
| Peptide, recombinant protein | Avian Myeloblastosis Virus Reverse Transcriptase | Promega Corporation | Cat#M5108 | |
| Other | iTaq Universal SYBR Master Mix | Bio-Rad Laboratories | Cat#1725122 | |
| Other | Dynabeads Protein G | ThermoFisher Scientific | Cat#10003D | |
| Other | Dynabeads Protein A | ThermoFisher Scientific | Cat#10002D | |
| Other | Dynabeads MyOne Streptavidin C1 | ThermoFisher Scientific | Cat# | |
| Peptide, recombinant protein | EZ-link HPDP-biotin | ThermoFisher Scientific | Cat#21341 | |
| Peptide, recombinant protein | SuperKillerTRAIL | Enzo Life Sciences | Cat# ALX-201-115-3010 | |
| Other | KillerTRAIL Storage and Dilution Buffer | Enzo Life Sciences | Cat# ALX-505–005 R500 | |
| Chemical compound, drug | Caspase Inhibitor Z-VAD-FMK | Promega Corporation | Cat#G7231 | |
| Chemical compound, drug | Ivermectin | Millipore Sigma | Cat#I8898 | |
| Chemical compound, drug | Raptinal | Millipore Sigma | Cat#SML1745 | |
| Other | Dulbecco’s Modified Eagle Medium | ThermoFisher Scientific | Cat#12800082 | |
| Other | McCoy’s (modified) 5A medium | ThermoFisher Scientific | Cat#16600082 | |
| Other | Fetal Bovine Serum | VWR | Cat#89510–186 | |
| Other | Trypsin-EDTA (0.05%), phenol red | ThermoFisher Scientific | Cat# 25300120 | |
| Other | PageRuler Prestained Protein Ladder | ThermoFisher Scientific | Cat#26616 | |
| Other | PageRuler Plus Prestained Protein Ladder | ThermoFisher Scientific | Cat#26620 | |
| Other | Quick-Load Purple 1 kb Plus DNA Ladder | New England BioLabs | Cat#N0550S | |
| Other | Clarity Western ECL Substrate | Bio-Rad Laboratories | Cat#1705061 | |
| Other | 4x Laemmli Sample Buffer | Bio-Rad Laboratories | Cat#1610747 | |
| Other | Gel Loading Dye, Purple (6X) | New England BioLabs | B7025S | no SDS |
| Commercial assay, kit | TUNEL Assay Kit - BrdU-Red | Abcam | Cat#ab66110 | |
| Commercial assay, kit | OneStep RT-PCR Kit | QIAGEN | Cat#210210 | |
| Commercial assay, kit | Cell Fractionation Kit | Abcam | Cat#ab109719 | |
| Commercial assay, kit | Bio-Rad Protein Assay Kit II | Bio-Rad Laboratories | Cat#5000002 | |
| Commercial assay, kit | Oligo Clean and Concentrator Kit | Zymo Research | Cat#D4060 | |
| Commercial assay, kit | In-Fusion HD Cloning Kit | Takara Bio USA | Cat#639650 | |
| Commercial assay, kit | Lenti-X Tet-On 3G Inducible Expression System | Takara Bio USA | Cat#631187 | |
| Commercial assay, kit | Neon Transfection System | ThermoFisher Scientific | Cat#MPK5000 | |
| Commercial assay, kit | KAPA Stranded RNA-Seq Kit with RiboErase (HMR) | Roche | Cat#KK8484 | |
| Sequence-based reagent | ERCC RNA Spike-In Mix | ThermoFisher Scientific | Cat#4456740 | |
| Cell line (Homo sapiens) | HCT116 cells | ATCC | Cat#CCL-247; RRID:CVCL_0291 | |
| Cell line (Homo sapiens) | 293T/17 cells | ATCC | Cat#CRL-11268; RRID:CVCL_1926 | |
| Cell line (Homo sapiens) | HeLa Cells | ATCC | Cat#CCL-2; RRID:CVCL_0030 | |
| Sequence-based reagent | muSOX F | This paper | TCCCGTATACACCGGTATGTGGAGCCACCCC | |
| Sequence-based reagent | muSOX R | This paper | ATCCGCCGGCACCGGTTTAGGGGGTTATGGG | |
| Sequence-based reagent | ON-TARGETplus Non-targeting Control Pool | Horizon Discovery Group | Cat#D-001810–10 | |
| Sequence-based reagent | SMARTpool: ON-TARGETplus DIS3L2 siRNA | Horizon Discovery Group | Cat#L-018715–01 | |
| Sequence-based reagent | SMARTpool: ON-TARGETplus Human EXOSC4 siRNA | Horizon Discovery Group | Cat#L-013760–00 | |
| Sequence-based reagent | SMARTpool: ON-TARGETplus Human PNPT1 siRNA | Horizon Discovery Group | Cat#L-019454–01 | |
| Sequence-based reagent | SMARTpool: ON-TARGETplus XRN1 siRNA | Horizon Discovery Group | Cat#L-013754–01 | |
| Sequence-based reagent | SMARTpool: ON-TARGETplus CASP3 siRNA | Horizon Discovery Group | Cat#L-004307–00 | |
| Sequence-based reagent | SMARTpool: ON-TARGETplus CASP8 siRNA | Horizon Discovery Group | Cat#L-003466–00 | |
| Sequence-based reagent | ON-TARGETplus DFFB siRNA SMARTpool | Horizon Discovery Group | Cat#L-004425–00 | |
| Sequence-based reagent | SMARTpool: ON-TARGETplus Human BAX siRNA | Horizon Discovery Group | Cat# L-003308–01 | |
| Sequence-based reagent | SMARTpool: ON-TARGETplus Human BAK1 siRNA | Horizon Discovery Group | Cat# L-003305–00 | |
| Sequence-based reagent | See Supplementary file 1 for RT-(q)PCR primers | |||
| Software, algorithm | Prism 8 | GraphPad | RRID:SCR_002798 | https://www.graphpad.com/scientific-software/prism/ |
| Software, algorithm | FlowJo | BD | RRID:SCR_008520 | https://www.flowjo.com/solutions/flowjo |
| Software, algorithm | Image Lab Software | Bio-Rad Laboratories | Cat#1709690; RRID:SCR_014210 | |
| Software, algorithm | FastQC | Babraham Bioinformatics | RRID:SCR_014583 | http://www.bioinformatics.babraham.ac.uk/projects/fastqc |
| Software, algorithm | Sickle version 1.33 | N/A | RRID:SCR_006800 | https://github.com/najoshi/sickle |
| Software, algorithm | STAR | Dobin et al., 2013 | RRID:SCR_004463 | https://doi.org/10.1093/bioinformatics/bts635 |
| Software, algorithm | Cuffdiff 2 | Trapnell et al., 2013 | RRID:SCR_001647 | https://doi.org/10.1038/nbt.2450 |
| Software, algorithm | PANTHER GO-slim | Mi et al., 2019 | RRID:SCR_002811 | http://geneontology.org/ |
| Software, algorithm | ChEA3 | Keenan et al., 2019 | N/A | https://maayanlab.cloud/chea3/ |
Additional files
-
Supplementary file 1
Statistical tests and PCR primers.
(A) p values calculated by statistical tests employed in this study. (B) RT-(q)PCR primer sequences
- https://cdn.elifesciences.org/articles/58342/elife-58342-supp1-v2.xlsx
-
Supplementary file 2
GO enrichment anaylsis for subset of genes represented in the transcripts downregulated >2 fold upon TRAIL treatment (with 1 hr DMSO pre-treatment).
No statistically significant (FDR < 0.05) enrichments were identified.
- https://cdn.elifesciences.org/articles/58342/elife-58342-supp2-v2.xlsx
-
Transparent reporting form
- https://cdn.elifesciences.org/articles/58342/elife-58342-transrepform-v2.docx
Download links
A two-part list of links to download the article, or parts of the article, in various formats.
Downloads (link to download the article as PDF)
Open citations (links to open the citations from this article in various online reference manager services)
Cite this article (links to download the citations from this article in formats compatible with various reference manager tools)
Cytoplasmic mRNA decay represses RNA polymerase II transcription during early apoptosis
eLife 10:e58342.
https://doi.org/10.7554/eLife.58342


