Gene regulation gravitates toward either addition or multiplication when combining the effects of two signals
- Genomics and Computational Biology Graduate Group, Perelman School of Medicine, University of Pennsylvania, United States
- Department of Bioengineering, School of Engineering and Applied Sciences, University of Pennsylvania, United States
- Department of Genetics, Perelman School of Medicine, University of Pennsylvania, United States
Figures
Figure 1 with 5 supplements
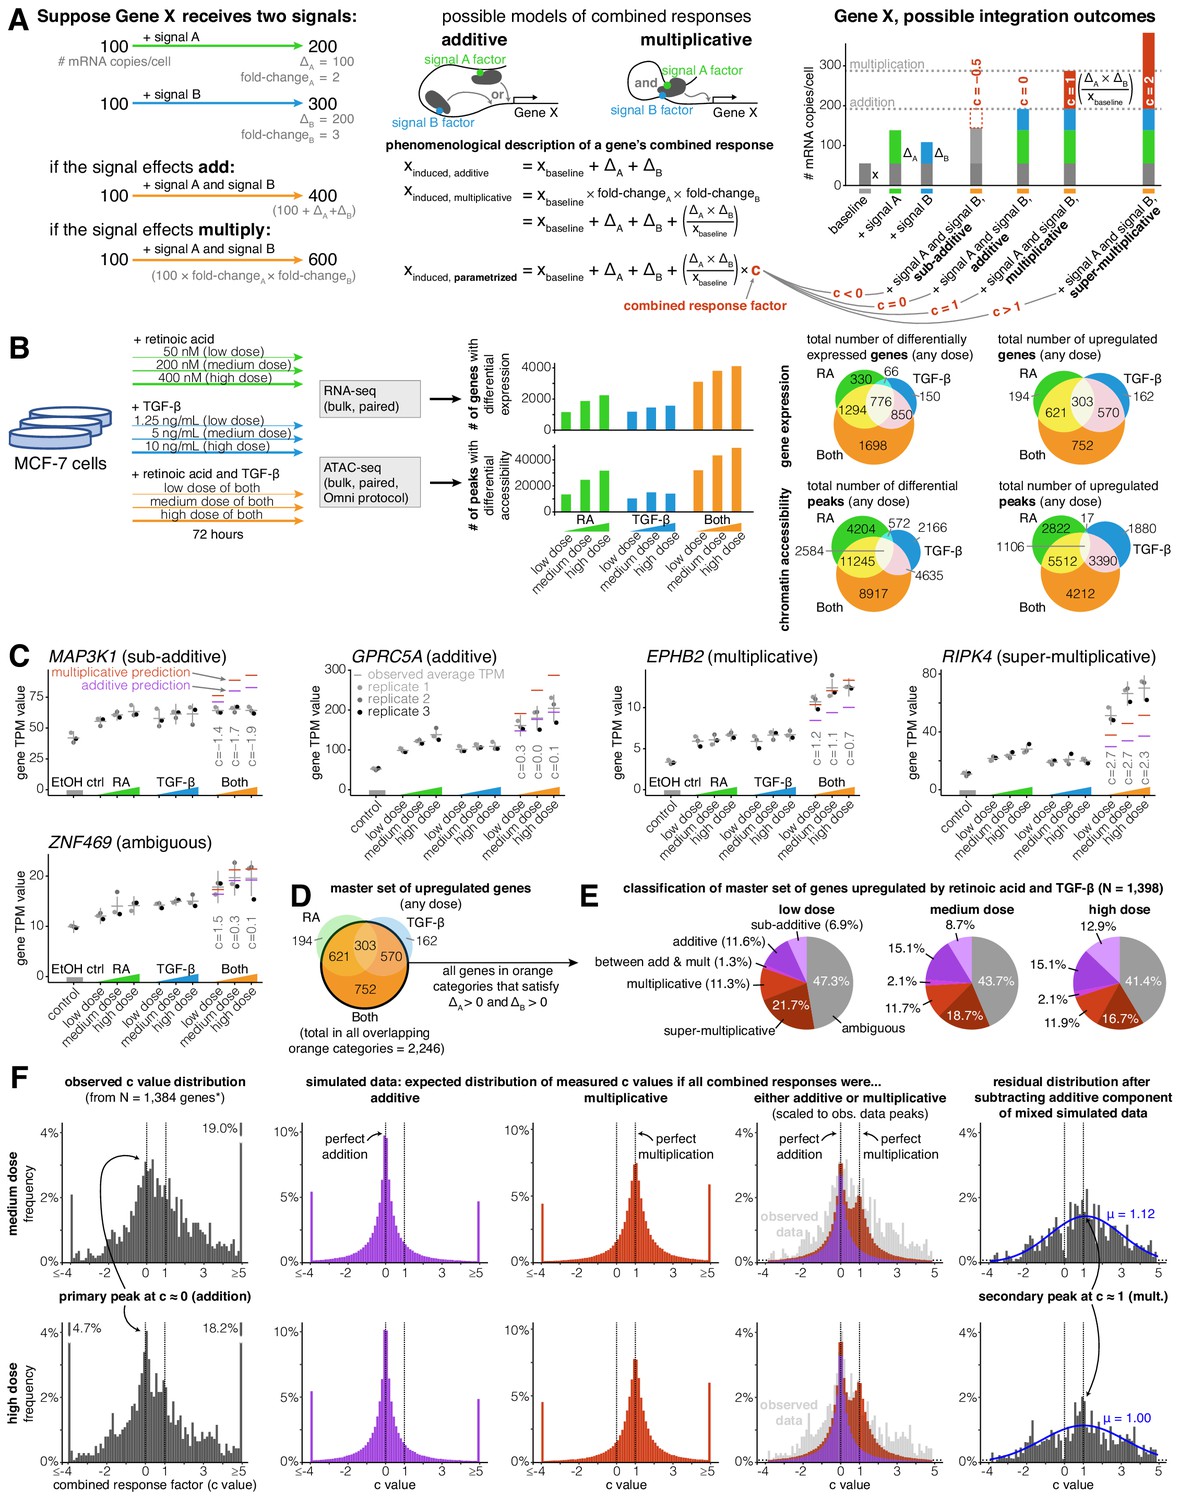
Addition and multiplication are enriched modes of signal integration in upregulated genes.
(A) Example of additive vs. multiplicative effects on expression of hypothetical gene X, mathematical formulation of the combined response factor, and illustration of how the value of the combined response factor (c value) reflects whether a combined gene expression response is sub-additive, additive, multiplicative, or super-multiplicative. (B) Schematic of signal response experiments in MCF-7 cells. Briefly, we treated MCF-7 cells with three different dosages of retinoic acid, TGF-β, or both signals for 72 hr, then performed bulk RNA-seq and ATAC-seq at the endpoint. We show the number of differentially expressed genes and peaks for each dose of each condition as well as the overlap between the sets of differentially expressed genes and differential peaks. (C) Five example genes representing sub-additive to super-multiplicative combined transcriptional responses, where we show each gene’s transcripts per million (TPM) value for each replicate after single or combined signal treatments. Horizontal gray bars show the average TPM value, and error bars represent the 80% confidence interval of the estimated underlying Gaussian distribution of each dosage and condition (see Materials and methods for parameter estimation details). (D) Illustrated definition of master set of upregulated genes. (E) Frequency of each type of combined response behavior for each dosage in the master set of genes. (F) Simulated, observed, and residual histograms of c value distributions for the medium and high doses. In the simulated mixture model, we randomly simulated combined responses to be either additive or multiplicative based on the relative frequency of additive vs. multiplicative combined transcriptional responses that we observed at each dose in 1E. Annotated percentages at broken bars represent the fraction of c values in the tail beyond the limits of the x axis of the graph. *For all c value analyses, 14 genes with a control TPM of zero were removed from the master set of genes, as they end up misleadingly having c values of exactly 0 regardless of the effects of retinoic acid and TGF-β.
Figure 1—figure supplement 1

Explanatory schematics for model of gene expression variation, classification of combined responses, and simulating new additive or multiplicative combined responses.
(A) Schematic illustrating how we estimate the 80% confidence interval of a Gaussian distribution underlying our gene expression measurements. (B) Illustration of how we use the 80% confidence interval to classify combined responses in Figure 1E as sub-additive, additive, multiplicative, super-multiplicative, or ambiguous. (C) Diagram showing how we simulate new observations by using the Gaussian distributions we estimated to underlie each condition and dose’s gene expression measurements. (D) Schematic showing how we combine many simulated combined responses from each gene in our master set (*less any gene with a control TPM measurement of 0) to create a new distribution of simulated c values. (E) Example genes illustrating how the variance of a gene expression measurement often depends on the signal(s) given. (F) Correlation matrix showing the Pearson correlation between coefficient of variation (CV) estimates between each condition, with black boxes outlining correlations between different doses of the same signal(s).
Figure 1—figure supplement 2

TGF-β, and not retinoic acid, leads to an increase in nuclear pSMAD2 levels in MCF-7 cells.
(A) Schematic describing immunofluorescence experiment design. (B) Example images of pSMAD2 immunofluorescence for the medium dose of TGF-β, retinoic acid, or control cells at each time point. (C) Computational analysis workflow schematic, which describes how we use the cellpose segmentation algorithm in the DAPI channel to identify nuclear boundaries for measuring average nuclear signal intensity in the pSMAD2 immunofluorescence channel. (D) Summary statistics of normalized pSMAD2 nuclear intensity, where each point represents the average immunofluorescence signal intensity of one nucleus. Black horizontal bars used to define a ‘pSMAD2 high’ threshold are 1000 au above the median nuclear intensity value across all conditions in the same time point. (E) Fraction of cells that are pSMAD2-high across time for each condition, separated by replicate. *0 hr time point is a pseudo-time point that we generated from additional images taken in the control condition at the 40 min (replicate 1) or 2 hr time point (replicate 2).
Figure 1—figure supplement 3
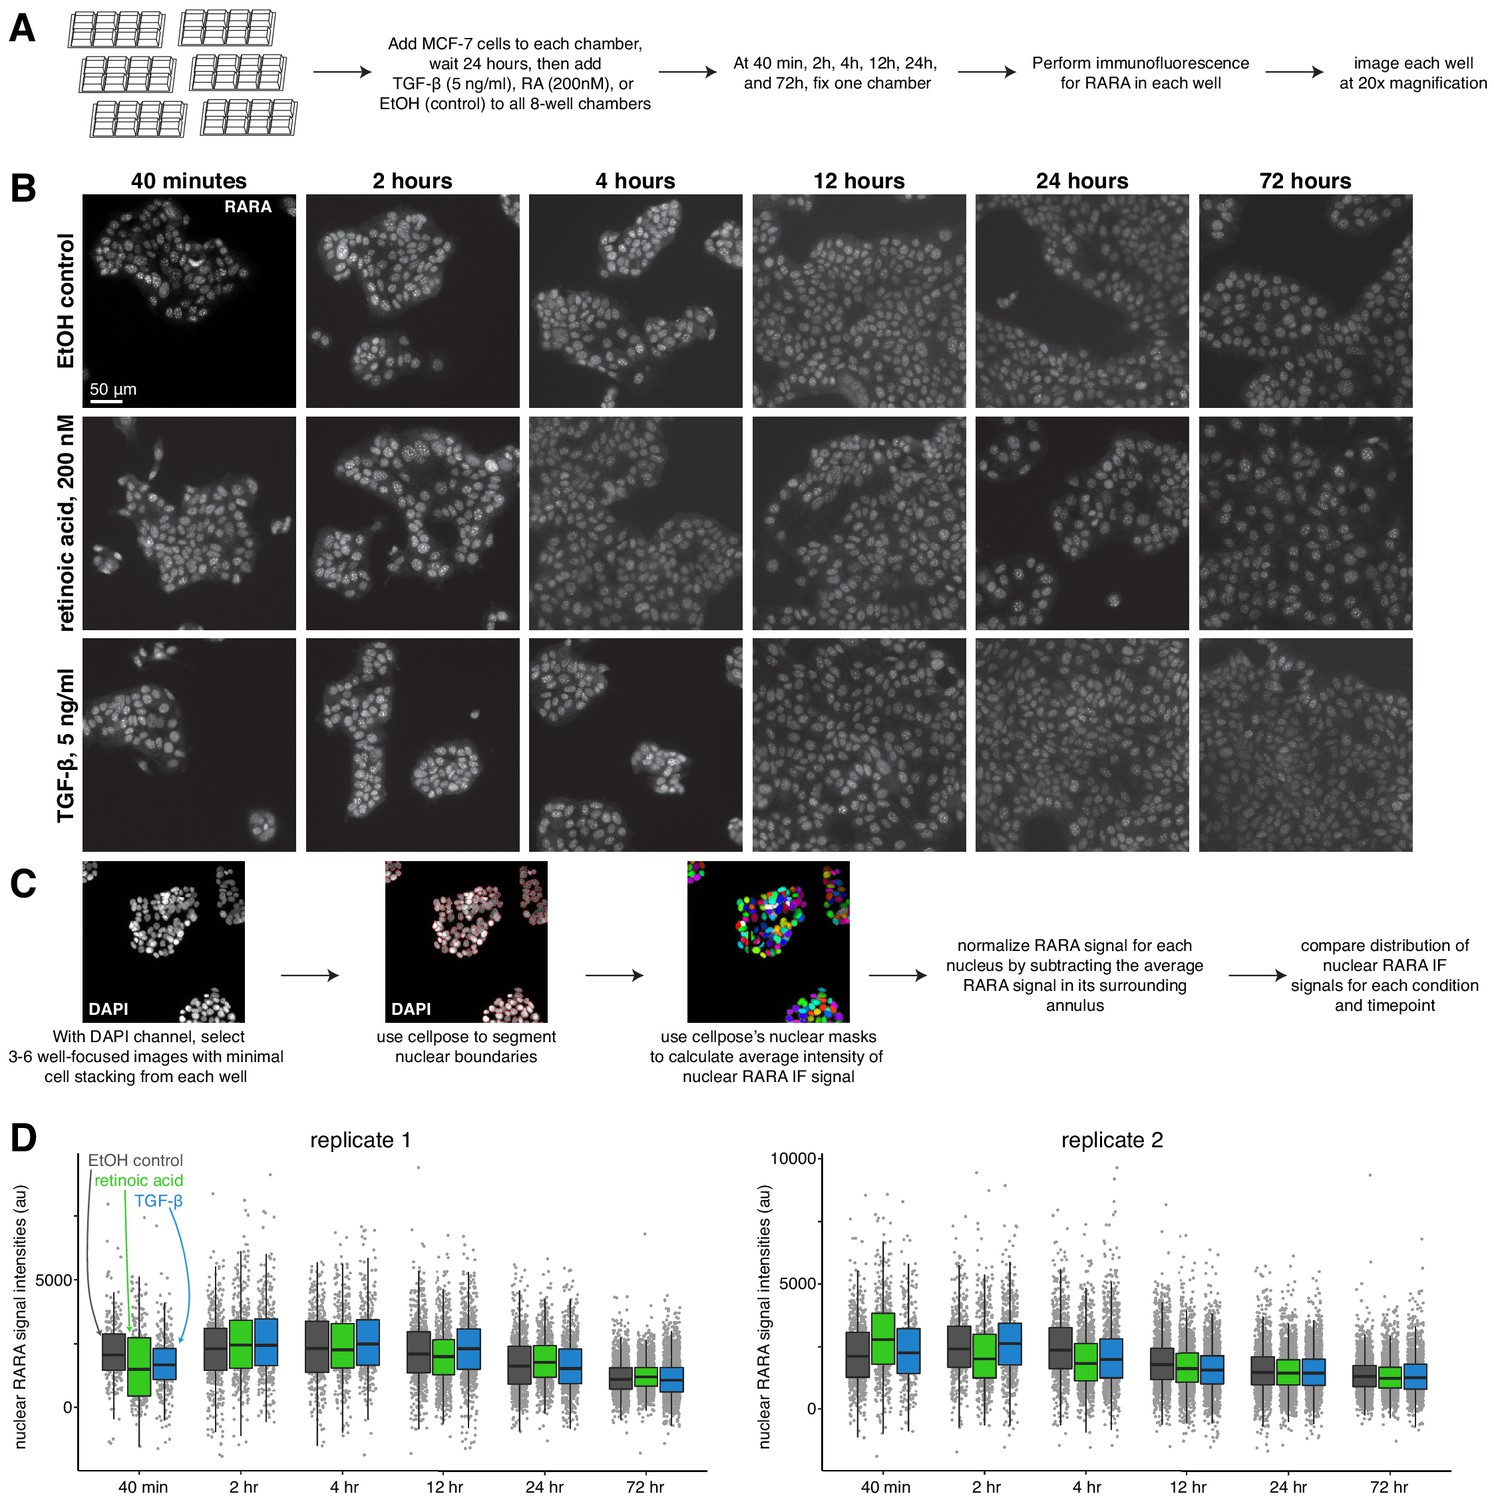
Nuclear retinoic acid receptor alpha levels are stable across treatment conditions.
(A) Schematic describing immunofluorescence experiment design. (B) Example images of RARA immunofluorescence for each condition (medium dose of retinoic acid, TGF-β, or control) at each time point. (C) Computational analysis workflow schematic, which describes how we use the cellpose segmentation algorithm in the DAPI channel to identify nuclear boundaries for measuring average nuclear signal intensity in the RARA immunofluorescence channel. (D) Summary statistics of normalized RARA nuclear intensity, where each point represents the average immunofluorescence signal intensity of one nucleus.
Figure 1—figure supplement 4
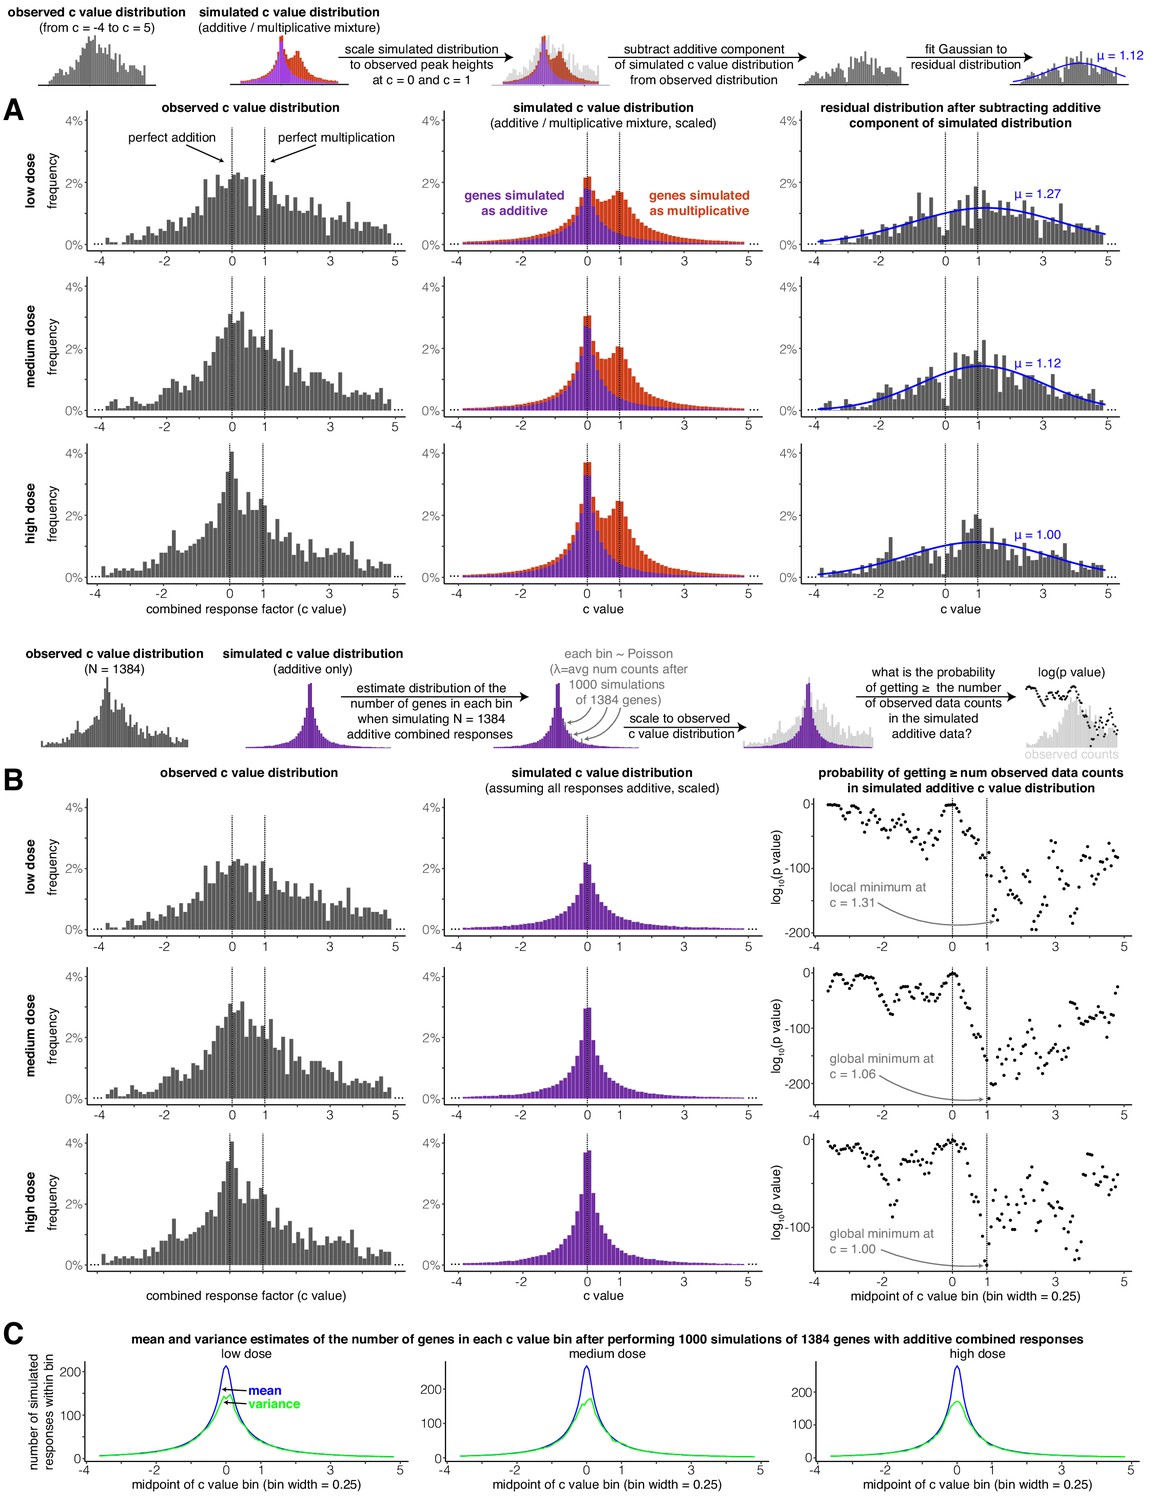
A secondary peak occurs at or near perfectly multiplicative combined transcriptional responses (c = 1) after subtracting a distribution of simulated additive responses from the observed distribution of c values.
(A) For each dose, the observed c value distribution (in the range from c = −4 to c = 5), simulated c value distribution when transcriptional responses are assumed to be either additive or multiplicative, and residual distributions after the additive component of the simulated data is subtracted. Blue lines illustrate the best-fit Gaussian to the residual distribution (see Materials and methods for details). (B) At each dose, a c value distribution generated by simulated additive responses is matched to the height of the peak at c = 0 in the observed data. Then, the probability of witnessing the number of combined responses in each of the bins in the observed histogram is estimated under the null model that all combined responses are additive. Due to the limits of computational power and the extremely low probabilities of witnessing the number of observations as the bins move further away from c = 0, we assumed Poisson distribution was descriptive of the number of simulated observations that lied in a given c value bin (this assumption is justified by panel C, where the mean and variance of the number of simulated responses in each bin are nearly identical outside the narrow range of −0.3 < c < 0.3). (C) At each dose, the mean and variance of the number of simulated additive c values found in each c value bin.
Figure 1—figure supplement 5
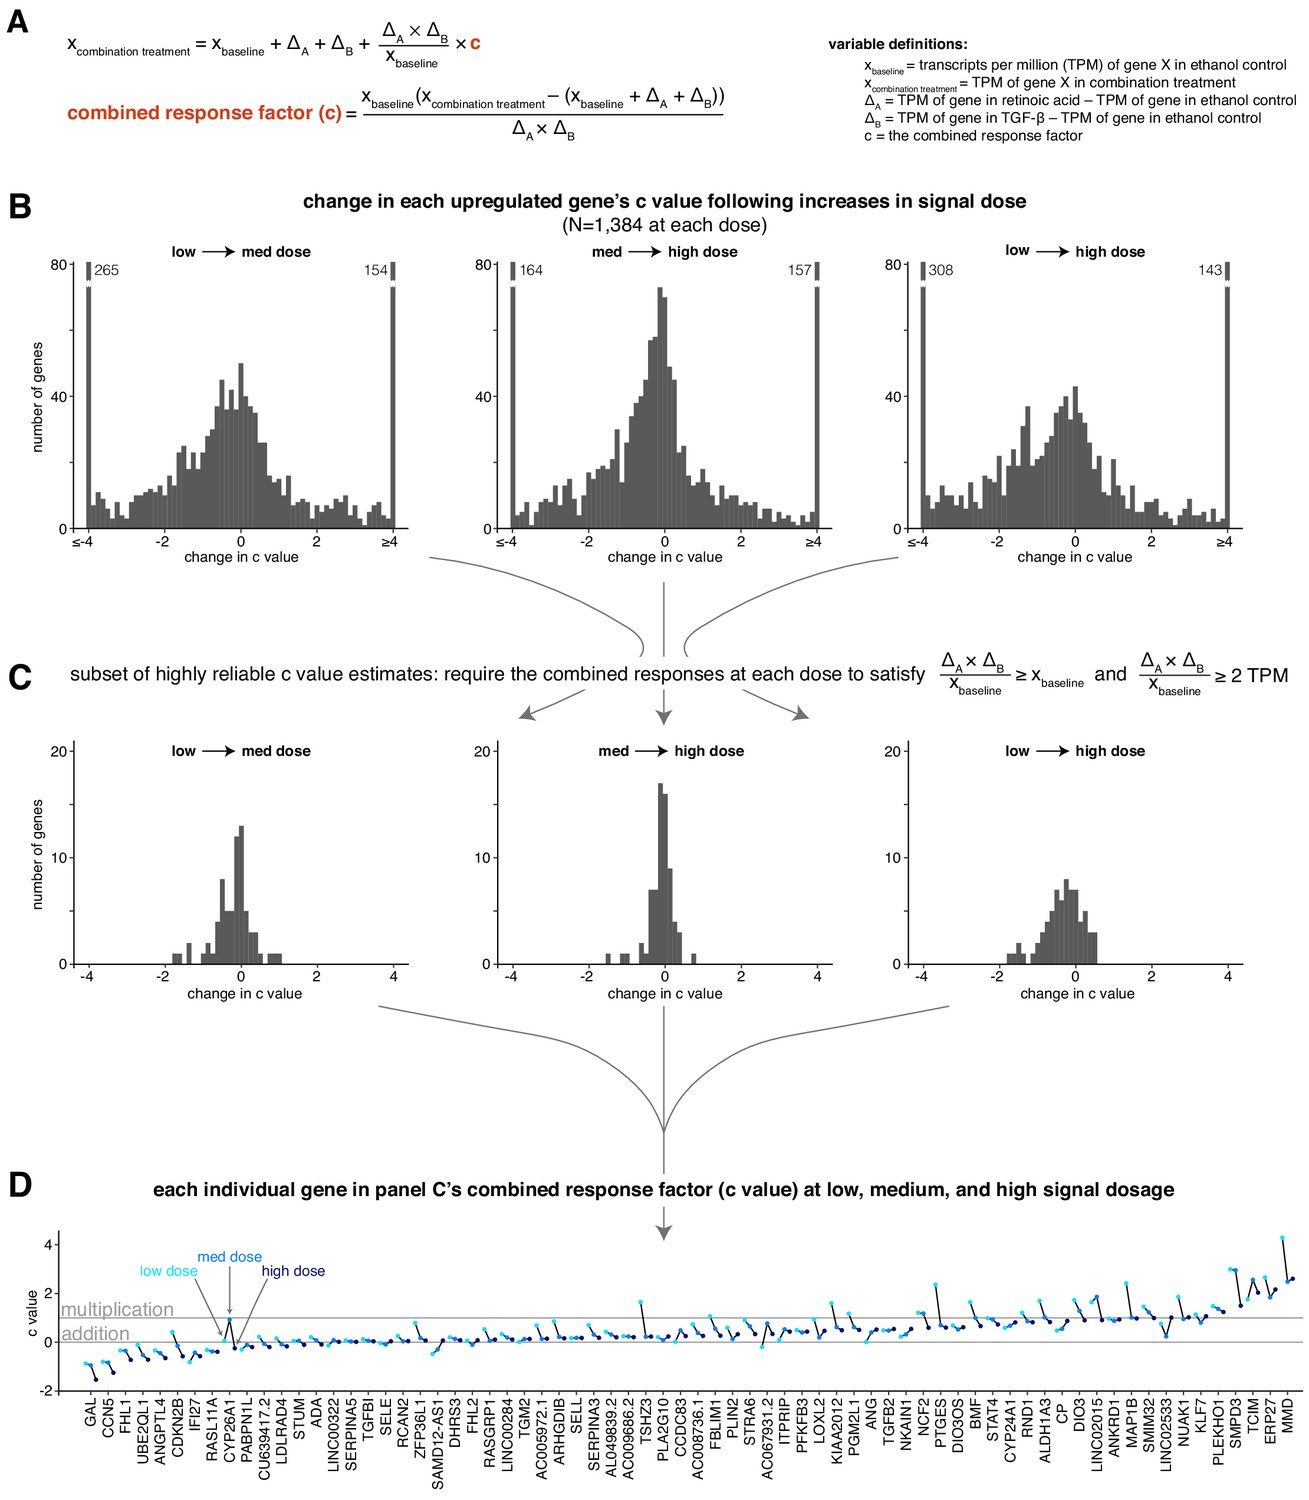
The combined response factor tends to remain stable or decrease with increasing signal dosage.
(A) Mathematical expression showing how we determine the value of the combined response factor (c value) for a given gene and signal dosage. TPM = transcripts per million. (B) Histograms illustrating the distribution of c value changes as dosage increases. (C) Same histograms as in B, focusing on a subset of genes with stable c value estimates. (D) Sparklines showing the c value at low, medium, and high dosage for each gene in the subset of genes outlined in panel C.
Figure 2 with 1 supplement
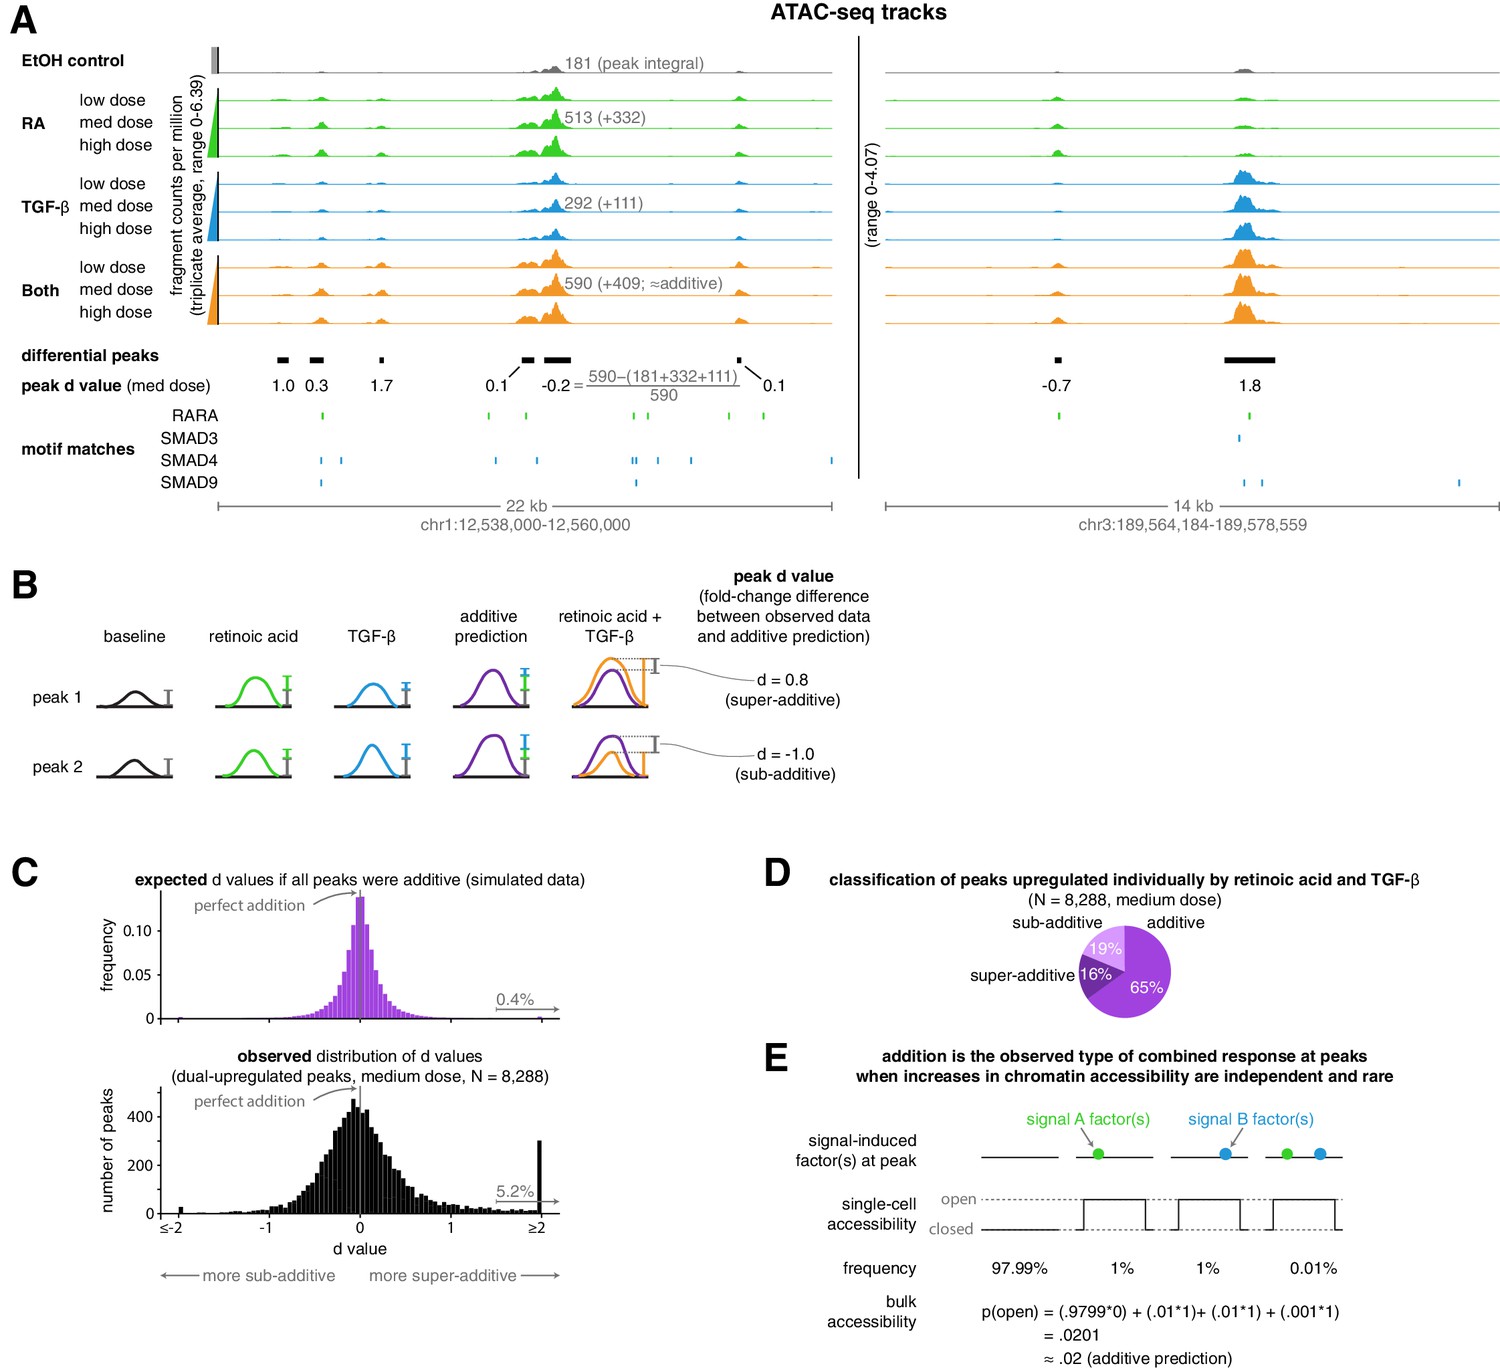
Addition is the default operation at upregulated differential peaks.
(A) Example tracks of ATAC-seq data. Tracks illustrate the ATAC-seq fragment counts per million, with each value representing the average number of fragment ends per million within 75 bp of a given genomic coordinate. Annotated peak values represent the peak integral (the total number of normalized fragment counts measured within the peak), which we use to calculate the peak’s d value. (B) Schematic illustrating examples of two peak’s d values, where each d value represents the fold-change difference between the measured number of ATAC-seq counts in the combination treatment and the predicted number of ATAC-seq fragment counts when using an additive model. (C) Expected vs. observed distributions of the fold-change difference from an additive prediction for each peak. We generated the expected distribution by simulating 10 new observations for each peak from the distributions we estimated our original upregulated peaks to have come from, setting the mean of the combined treatment to a perfectly additive prediction (Materials and methods). (D) Classification of ATAC-seq peaks that were upregulated individually by retinoic acid and TGF-β. We considered a given peak to be additive when the additive model prediction lied within the 80% confidence interval of our estimated distribution of the given peak’s normalized fragment counts in the combined treatment condition. (E) Schematic illustrating how combined binding responses may be additive when transcription factor binding is independent and rare.
Figure 2—figure supplement 1
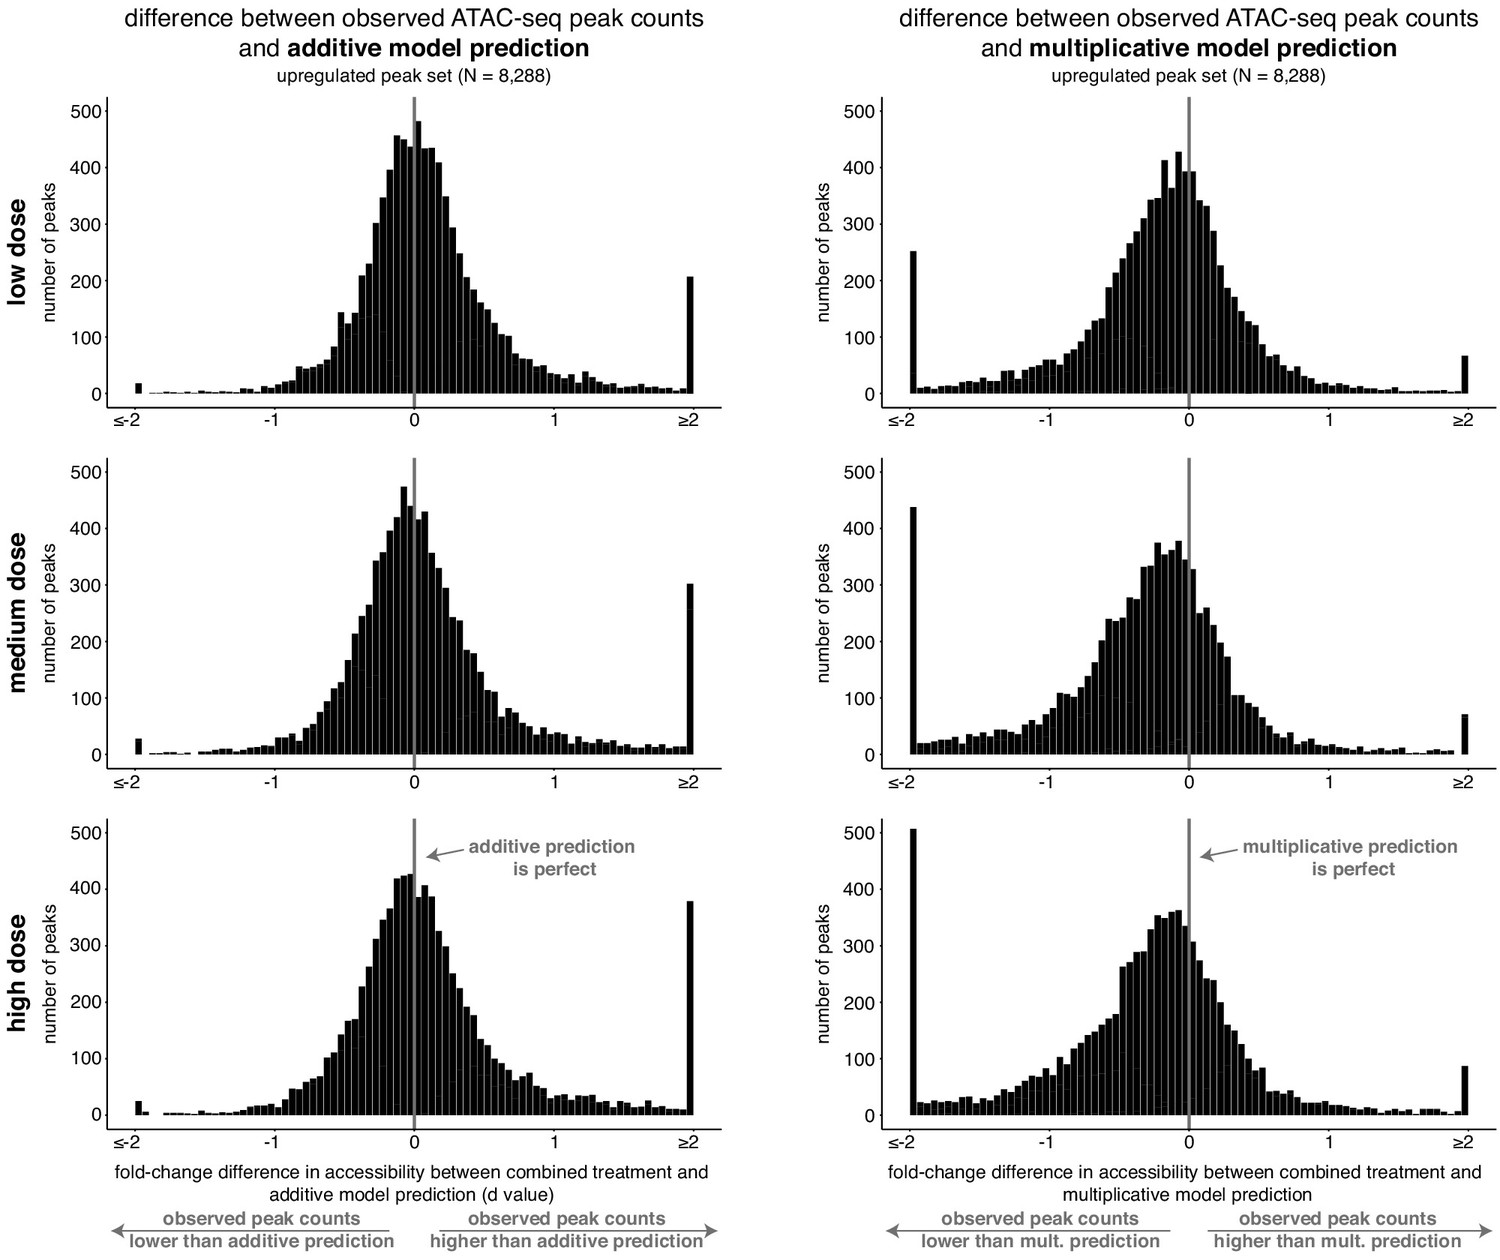
The combined response of peaks upregulated individually by retinoic acid and TGF-β is more consistent with an additive model than a multiplicative model.
For each dose, histograms of the difference between the observed normalized fragment counts at each upregulated peak and their respective additive or multiplicative predictions. The observed differences are centered at zero for the main probability mass for the additive model but not for the multiplicative model.
Figure 3
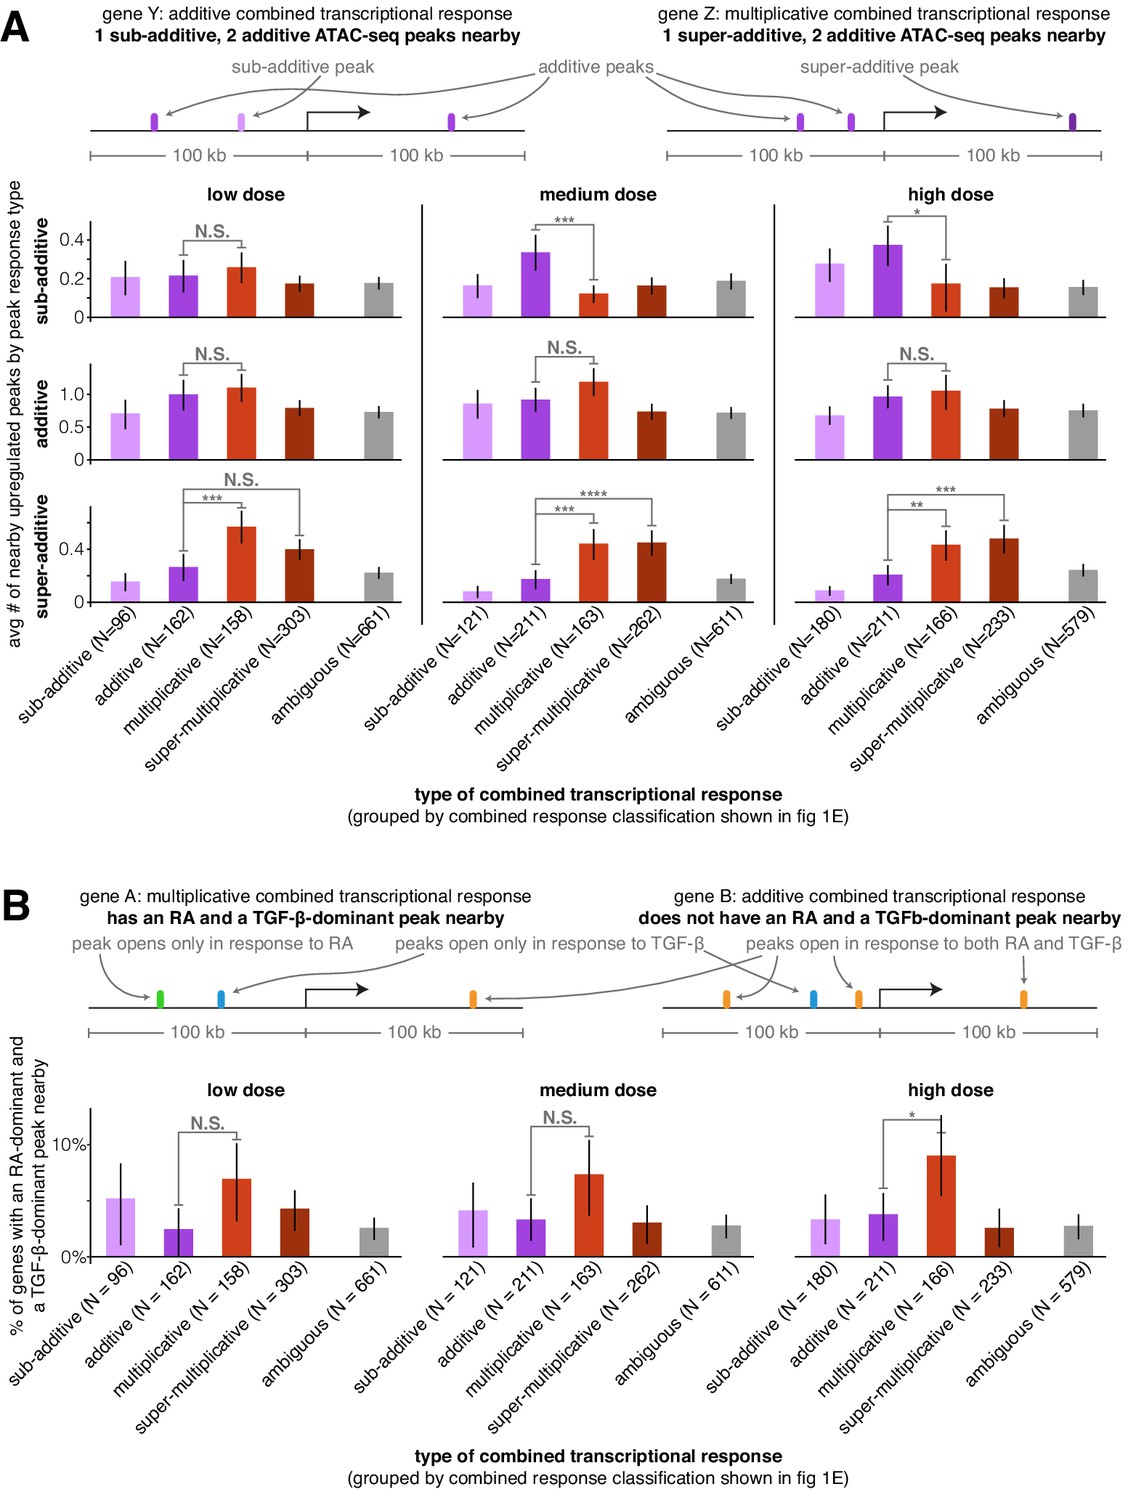
Super-additive ATAC-seq peaks are enriched near genes with multiplicative and super-multiplicative combined transcriptional responses.
(A) For each type of combined gene expression response, we show the average number of upregulated sub-additive, additive, and super-additive ATAC-seq peaks within 100 kb of the gene’s transcription start site. (B) For each combined transcriptional response behavior, we show the percentage of genes that have at least one peak that responds exclusively to retinoic acid and at least one peak that responds exclusively to TGF-β (where both peaks must lie within 100 kb of the gene’s transcription start site). For an upregulated peak to be considered a mutually exclusive response, the change in ATAC-seq fragment counts in the individual treatment condition must be at least 9x larger in the major signal effect than the minor signal effect. *p<0.05; **p<0.01; ***p<0.002; ****p<0.0002. All p values were calculated using Student's t-test. All error bars represent the 90% confidence interval estimated using 10,000 empirical bootstrap samples of the peak sets used in each analysis.
Figure 4 with 1 supplement
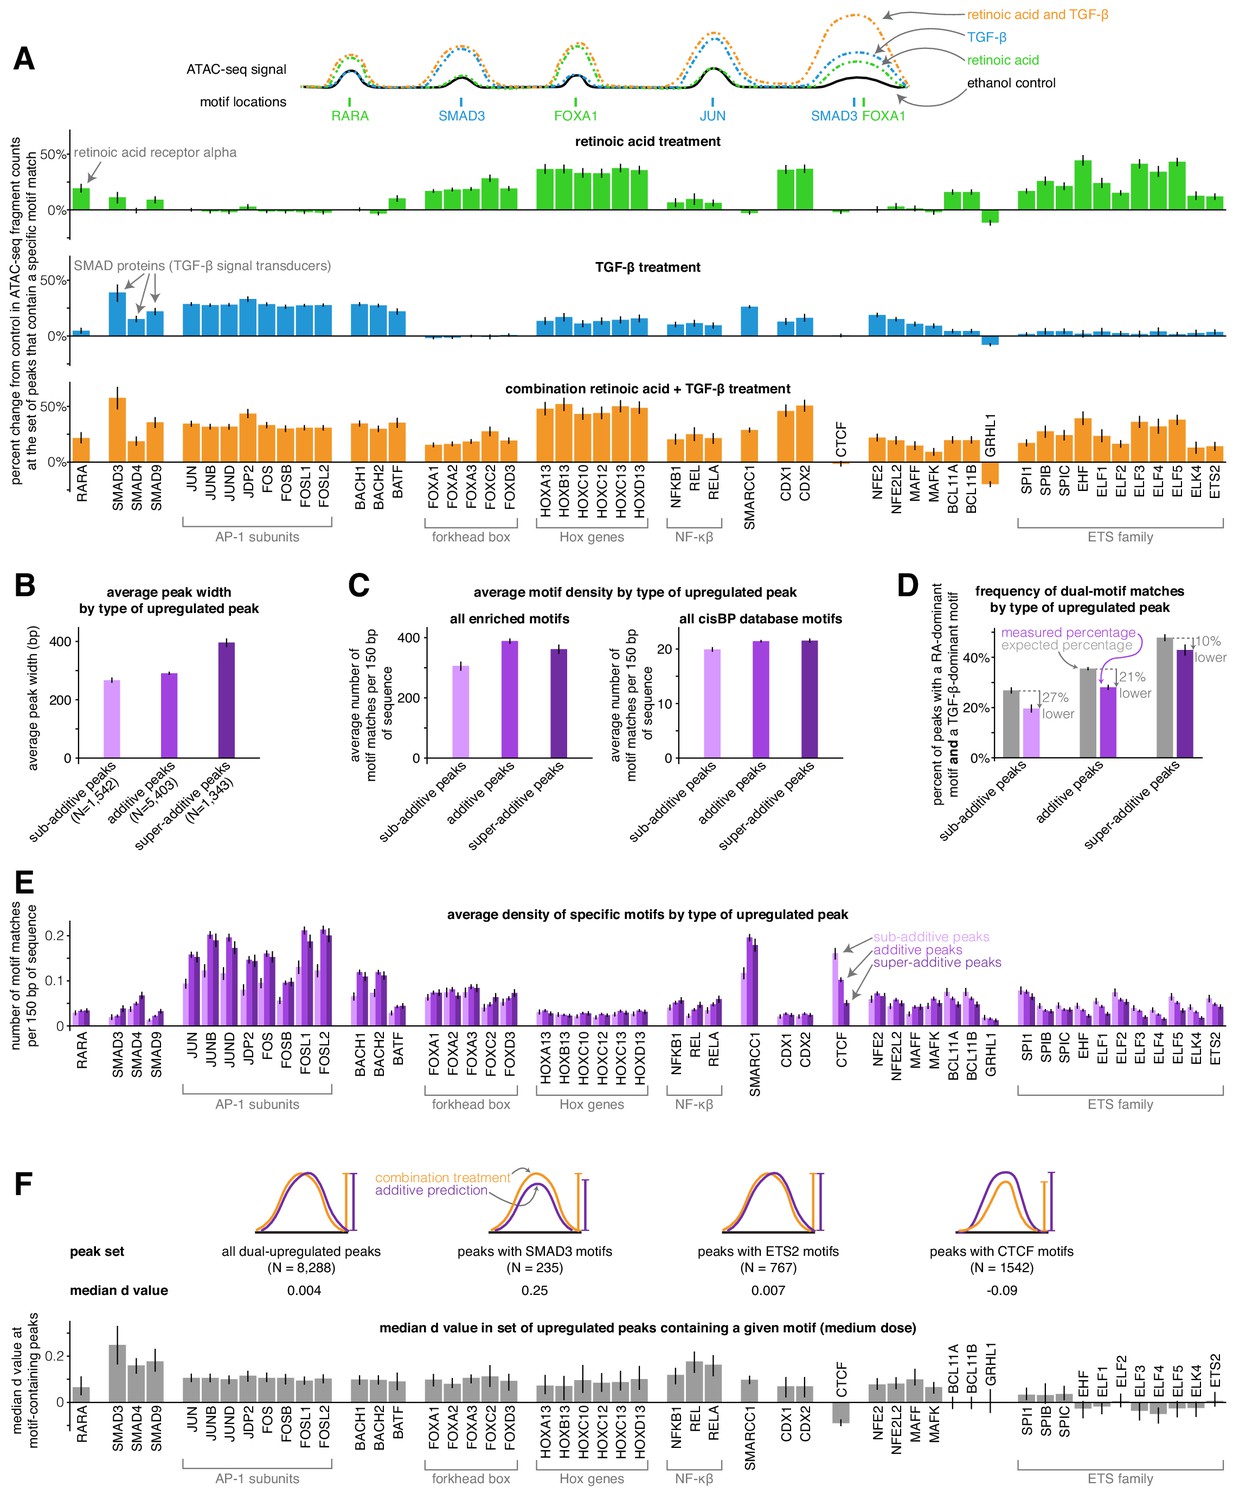
Sub-additive peaks are depleted for AP-1 motifs, enriched for CTCF motifs, while super-additive peaks are enriched for SMAD motifs.
(A) Motif enrichment analysis in each condition for the top 50 most variable transcription factor motifs identified by chromVAR. (CTCF was manually added to this set, making the total 51). Y-axis represents the percentage change in ATAC-seq signal at motif-containing peaks compared to ethanol control samples. For each condition, we pooled together the replicates for each of the three dosages, resulting in nine replicates each for retinoic acid, TGF-β, and combination treatment. (B) Average peak width of peaks upregulated individually by retinoic acid and TGF-β by type of combined response. (C) Average motif density in each type of peak upregulated individually by retinoic acid and TGF-β, using the enriched motif set and the full cisBP database. (D) Expected vs. measured percentage of dual-motif matches (one retinoic-acid-dominant motif and one TGF-β dominant motif) for each type of upregulated peak. We calculated the expected percentage by randomly shuffling motif matches within each peak set (see methods for details). Error bars represent the 5th and 95th percentile of the null distribution for expected percentages and the 90% bootstrapped confidence interval for measured percentages. (E) Motif density by type of upregulated peak for each motif in our enriched set. (F) For a given enriched motif, the median d value at medium dose for all upregulated peaks that contain the motif (higher d values indicate more super-additivity in peaks containing a given motif; the median d value for all upregulated peaks was 0.004). All error bars (except for the error bars for expected percentages in D) represent the 90% confidence interval estimated using 1000 empirical bootstrap samples of the peak sets used in each analysis.
Figure 4—figure supplement 1
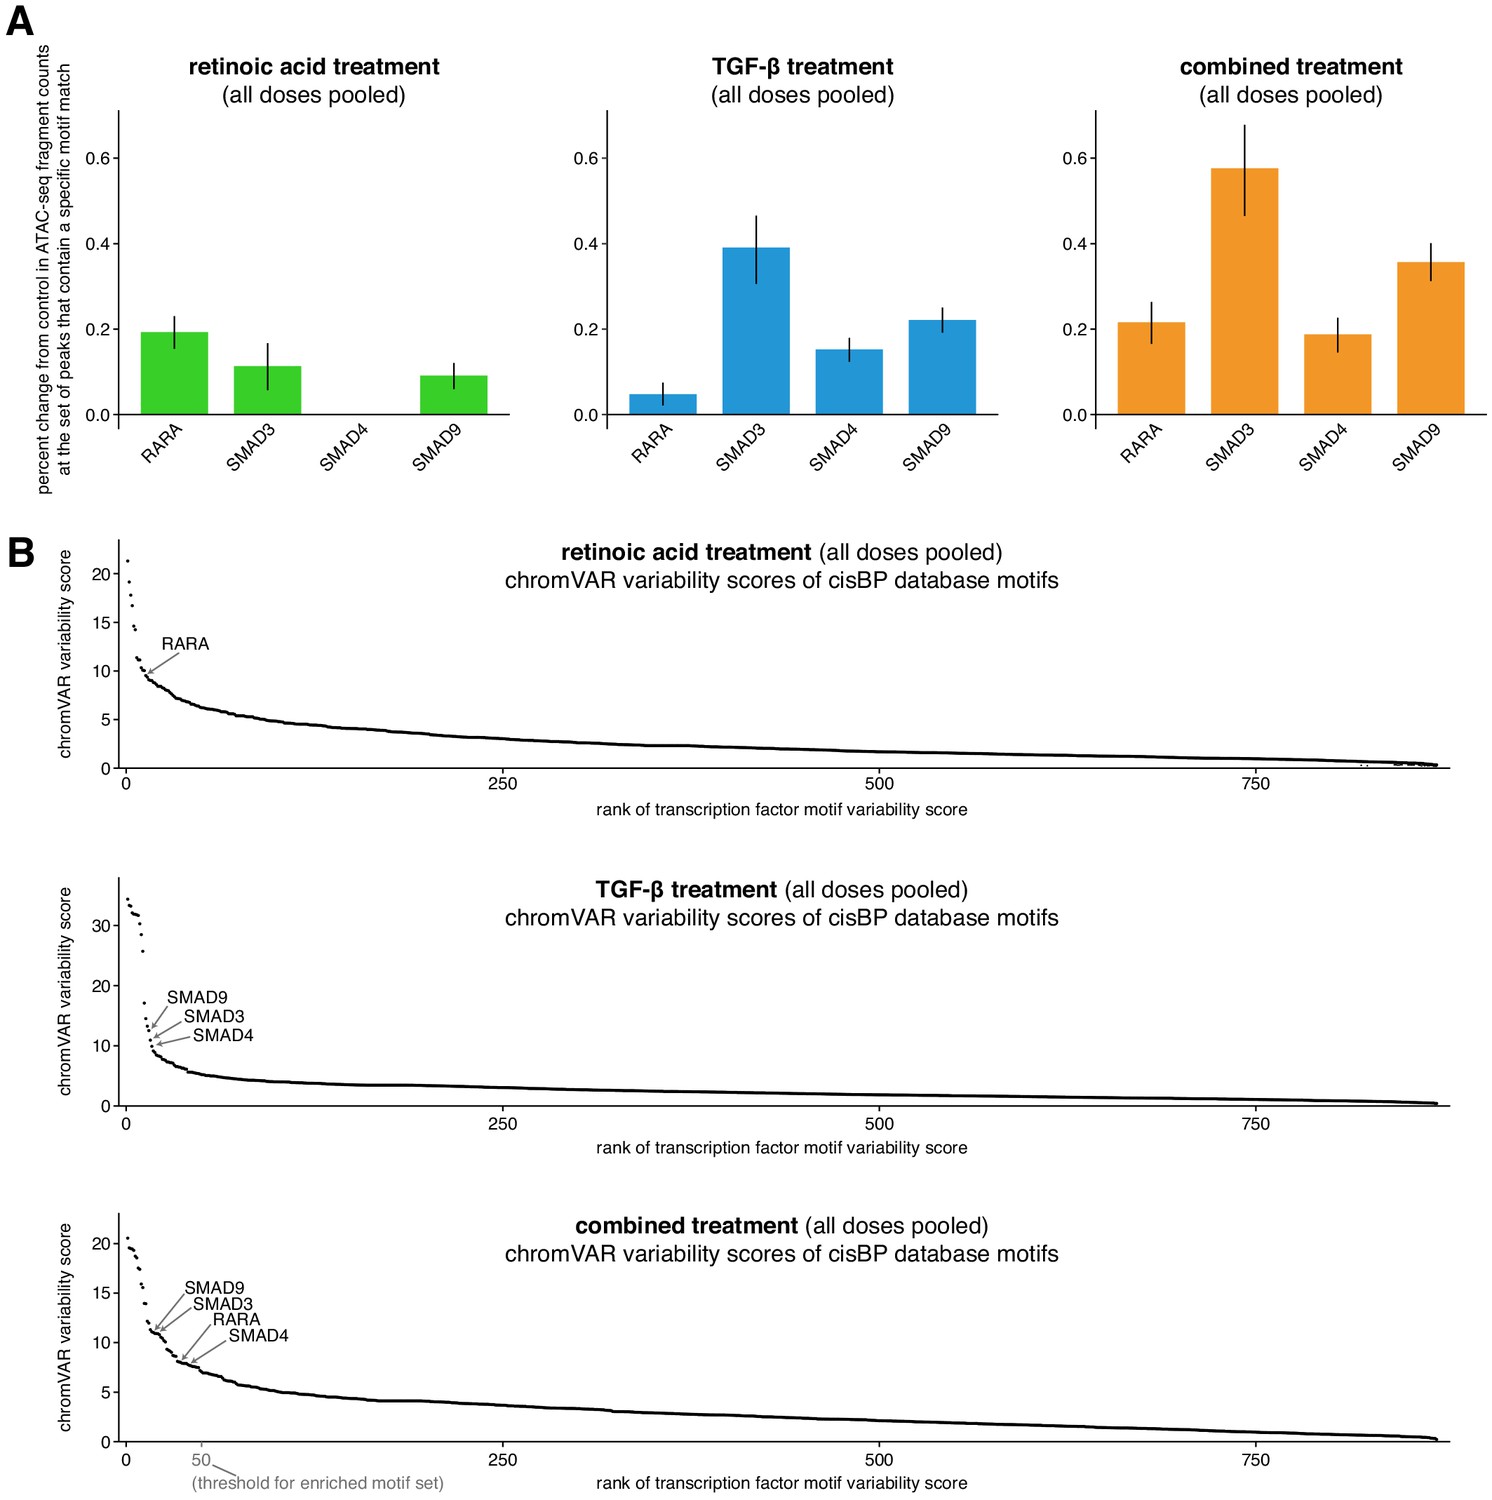
Canonical retinoic acid and TGF-β signaling motifs (RARA, SMAD3, SMAD4, SMAD9) are enriched in their respective signal treatment conditions.
(A) Motif enrichment scores for canonical retinoic acid and TGF-β effectors. The score reflects the average percent change in ATAC-seq fragment counts compared to ethanol control when a peak contains the given motif. (B) chromVAR variability scores (Schep et al., 2017) for all 870 motifs in the curated cisBP motif database for each experimental condition (Weirauch et al., 2014). RARA had the 13th highest variability in the retinoic acid condition and SMAD3, SMAD4, and SMAD9 had 17th, 16th, and 14th highest chromVAR variability scores, respectively, in the TGF-β condition. For both panels A and B, we included all nine ethanol controls (including low and high cell density controls) and all nine replicates of each experimental condition (pooling together low, medium, and high doses) when calculating these scores.
Tables
Key resources table
| Reagent type (species) or resource | Designation | Source or reference | Identifiers | Additional information |
|---|---|---|---|---|
| Cell line (Homo sapiens) | MCF-7 (breast carcinoma) | ATCC | ATCC HTB-22, (lot 64125078), RRID:CVCL_0031 | |
| Peptide, recombinant protein | TGF-β | Sigma | Cat# T7039 | |
| Chemical compound, drug | All trans retinoic acid | Sigma | Cat # R2625 | |
| Other | Charcoal- stripped FBS | Gemini | Cat # 100–119 | |
| Commercial assay or kit | miRNeasy RNA extraction kit | Qiagen | Cat # 217004 | |
| Commercial assay or kit | NEBNext Poly(A) mRNA Magnetic Isolation Module | New England Biolabs | Cat # E7490 | |
| Commercial assay or kit | NEBNext Ultra II RNA Library Prep Kit for Illumina | New England Biolabs | Cat # E7770 | |
| Sequence-based reagent | NEBNext Multiplex Oligos for Illumina | New England Biolabs | Cat # E7600 | |
| Commercial assay or kit | Tagment DNA Enzyme and Buffer | Illumina | Cat # 20034197 | |
| Sequence-based reagent | ATAC-seq indices (custom oligos) | Integrated DNA Technologies | See (Buenrostro et al., 2013) for custom index sequences | |
| Antibody | Anti-RARA (Rabbit polyclonal) | Sigma | Cat # HPA058282, RRID:AB_2683666 | 1:200 dilution |
| Antibody | Anti- pSMAD2 (Rabbit monoclonal) | Cell Signaling Technology | Cat # 18338T, RRID:AB_2798798 | 1:800 dilution |
| Antibody | Anti-rabbit IgG, Alexa Fluor 647 (Goat polyclonal) | Thermo Fisher Scientific | Cat # A-21244, RRID:AB_2535812 | 1:1000 dilution |
Additional files
-
Supplementary file 1
Post-sequencing ATAC-seq metrics for each sample.
- https://cdn.elifesciences.org/articles/59388/elife-59388-supp1-v2.docx
-
Transparent reporting form
- https://cdn.elifesciences.org/articles/59388/elife-59388-transrepform-v2.docx
Download links
A two-part list of links to download the article, or parts of the article, in various formats.
Downloads (link to download the article as PDF)
Open citations (links to open the citations from this article in various online reference manager services)
Cite this article (links to download the citations from this article in formats compatible with various reference manager tools)
Gene regulation gravitates toward either addition or multiplication when combining the effects of two signals
eLife 9:e59388.
https://doi.org/10.7554/eLife.59388


