Sex-based differences in clearance of chronic Plasmodium falciparum infection
- Department of Medicine, University of California San Francisco, United States
- Infectious Diseases Research Collaboration, Uganda
- Department of Medicine, Makerere University College of Health Sciences, Uganda
- Department of Medicine, Stanford University, United States
- Department of Clinical Research, London School of Hygiene and Tropical Medicine, United Kingdom
- Department of Medical Microbiology, Radboud University Nijmegen Medical Centre, Netherlands
- Department of Immunology and Infection, London School of Hygiene and Tropical Medicine, United Kingdom
- Chan-Zuckerberg Biohub, United States
- Department of Medicine, University of Massachusetts, United States
- Institute for Health Metrics & Evaluation, University of Washington, United States
Figures
Figure 1
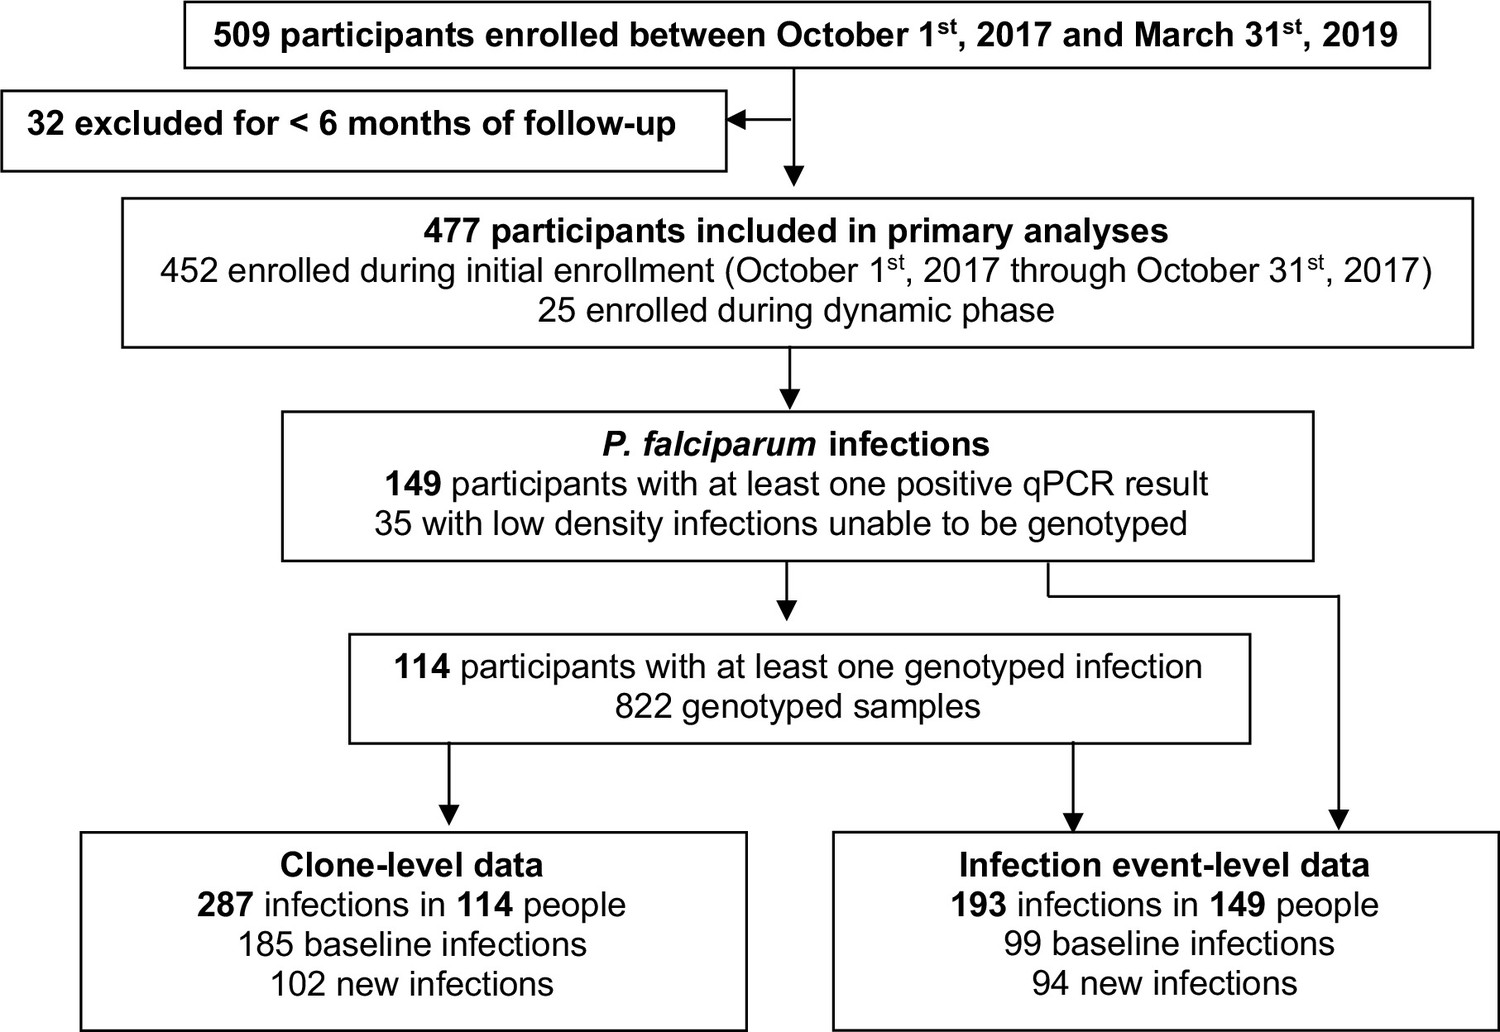
Study design.
Figure 2
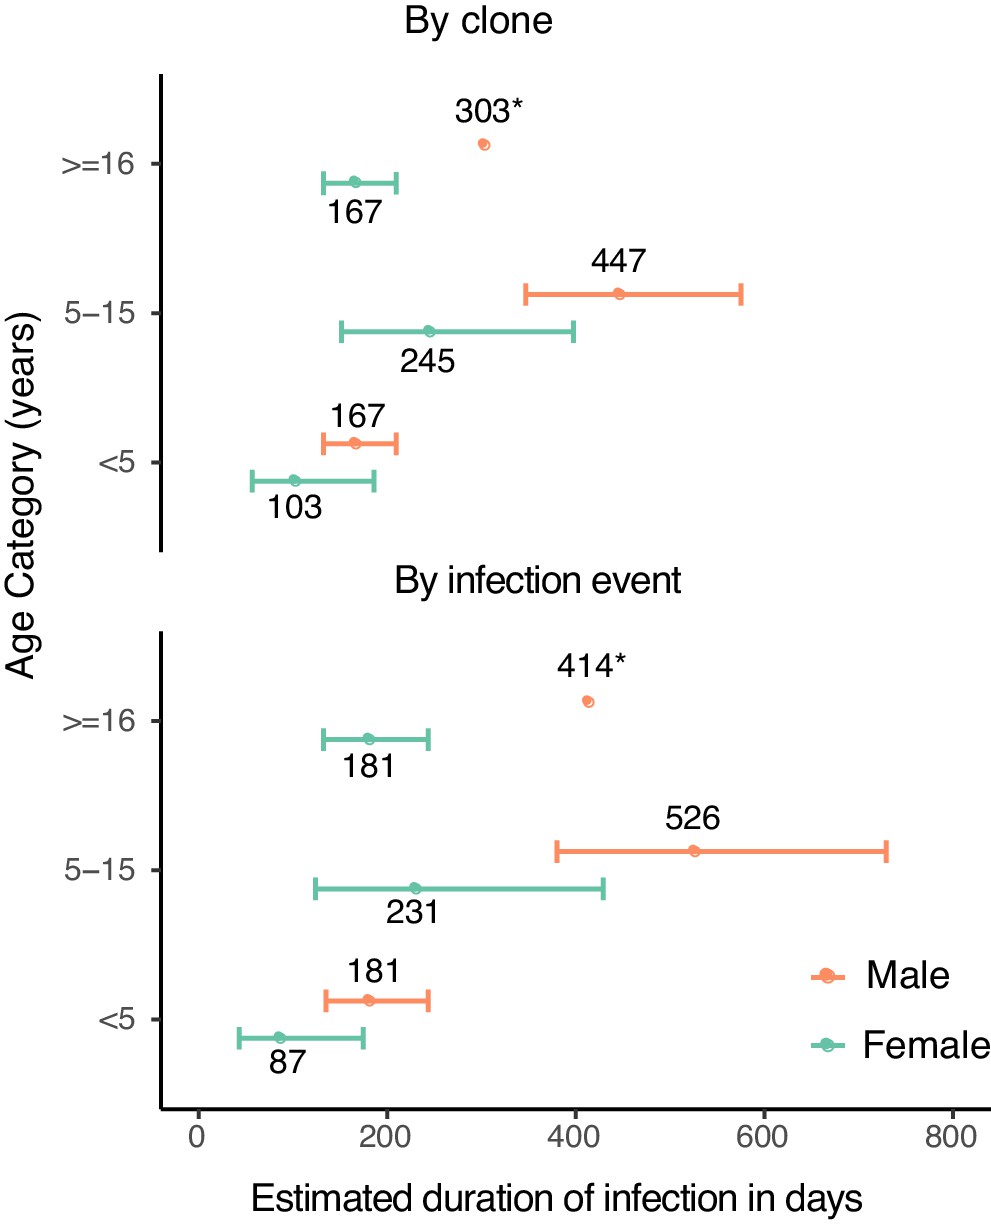
Estimates of duration of infection from sex- and age-adjusted model.
Estimated duration of infection in days, calculated by adjusting the point estimate of the baseline hazard by the coefficients of the sex- and age-adjusted model. Error bars represent standard errors of duration obtained from variance in the model coefficients. Point estimates of duration are labeled (*).
Tables
Table 1
Behavioral risk factors for malaria infection and measures of malaria burden in study population, stratified by age and sex.
| Metric | Age and gender categories | |||||||
|---|---|---|---|---|---|---|---|---|
| All | <5 years old | 5–15 years old | 16 years and older | |||||
| Male | Female | Male | Female | Male | Female | Male | Female | |
| Number of participants, n | 233 | 244 | 73 | 84 | 101 | 71 | 59 | 89 |
| Median days of follow-up per participant | 530.0 | 530.0 | 525.0 | 524.5 | 530.0 | 531.0 | 530.0 | 530.0 |
| Slept under LLIN the previous night | 53.6% | 56.3% | 54.1% | 56.3% | 47.9% | 47.8% | 63.7% | 64.3% |
| Person-years of follow-up | 324.2 | 345.4 | 87.3 | 96.7 | 152.6 | 118.5 | 84.22 | 130.1 |
| Number of overnight trips | 44 | 107 | 21 | 19 | 9 | 10 | 14 | 78 |
| Incidence of overnight trips*, (95% CI) | 0.14 (0.09–0.20) | 0.31 (0.20–0.49) | 0.24 (0.14–0.42) | 0.20 (0.09–0.42) | 0.06 (0.03–0.13) | 0.08 (0.03–0.24) | 0.17 (0.09–0.31) | 0.60 (0.30–1.18) |
| Episodes of malaria* | 11 | 13 | 5 | 2 | 5 | 9 | 1 | 2 |
| Incidence of malaria**, (95% CI) | 0.03 (0.02–0.06) | 0.04 (0.02–0.09) | 0.06 (0.02—0.16) | 0.02 (0.00–0.11) | 0.03 (0.01–0.08) | 0.08 (0.03–0.23) | 0.01 (0.00–0.08) | 0.02 (0.00–0.17) |
| Number of routine visits, n | 4316 | 4583 | 1164 | 1293 | 2034 | 1568 | 1118 | 1722 |
| Prevalence of microscopic parasitemia*** | 2.9% | 1.4% | 1.8% | 1.1% | 4.4% | 2.7% | 1.3% | 0.5% |
| Prevalence of parasitemia by qPCR | 14.4% | 9.2% | 5.8% | 3.7% | 17.0% | 15.3% | 18.5% | 7.7% |
| Geometric mean parasite density**** | 3.41 | 3.06 | 4.86 | 13.06 | 6.31 | 4.20 | 1.09 | 1.02 |
| Median complexity of infection, (IQR) | 3 (1–7) | 2 (1–2) | 1 (1–2.5) | 2 (1–2.3) | 4 (2–9) | 2 (1–2) | 1 (1–2) | 1 (1–2) |
-
*Malaria includes one episode (female,<5 years old), due to non-falciparum species (P. malariae).
**per person-year.
-
***Parasitemia by light microscopy includes one episode (female, 5–15 years old) due to non-falciparum species (P. ovale).
****Geometric mean parasite density in parasites/µL of all qPCR-positive routine visits.
Table 2
Molecular force of infection (FOI) by clone and by infection event, stratified by age and sex.
| Molecular force of infection (FOI) | Sex | Age category | |||
|---|---|---|---|---|---|
| All | <5 years | 5–15 years | 16 years or older | ||
| By clone, ppy* (95% CI) | All | 0.18 (0.13–0.24) | 0.14 (0.07–0.28) | 0.19 (0.08–0.43) | 0.20 (0.08–0.46) |
| Male | 0.19 (0.12–0.30) | 0.16 (0.07–0.39) | 0.19 (0.10–0.37) | 0.22 (0.09–0.54) | |
| Female | 0.17 (0.09–0.31) | 0.12 (0.03–0.49) | 0.19 (0.08–0.45) | 0.18 (0.06–0.54) | |
| By event, ppy* (95% CI) | All | 0.14 (0.11–0.18) | 0.09 (0.06–0.16) | 0.16 (0.09–0.30) | 0.16 (0.08–0.32) |
| Male | 0.16 (0.11–0.22) | 0.13 (0.07–0.27) | 0.18 (0.11–0.28) | 0.15 (0.07–0.29) | |
| Female | 0.13 (0.08–0.21) | 0.06 (0.02–0.18) | 0.14 (0.07–0.27) | 0.17 (0.07–0.41) | |
-
*per person-year.
Table 3
Hazard ratios for rates of clearance of infection, by clone and by infection event.
| Predictors | Categories | Hazard ratio by clone (95% CI) | Hazard ratio by infection event (95% CI) | ||
|---|---|---|---|---|---|
| Unadjusted | Adjusted | Unadjusted | Adjusted | ||
| Sex | Male | ref | ref | ref | ref |
| Female | 1.92 (1.19–3.11) | 1.82 (1.20–2.75) | 2.30 (1.20–4.42) | 2.07 (1.24–3.47) | |
| Age | 16 years or greater | ref | ref | ref | ref |
| 5–15 years | 0.66 (0.39–1.10) | 0.81 (0.49–1.36) | 0.82 (0.39–1.74) | 1.27 (0.72–2.25) | |
| <5 years | 1.64 (0.79–3.41) | 1.55 (0.76–3.17) | 2.01 (0.80–5.00) | 1.75 (0.87–3.53) | |
| Complexity of infection (COI) | Polyclonal (COI > 1) | ref | -- | ref | -- |
| Monoclonal (COI = 1) | 1.63 (1.03–2.57) | -- | 0.95 (0.38–2.34) | -- | |
| Infection status | Present at baseline | ref | ref | ref | ref |
| New infection | 1.94 (1.22–3.07) | 1.75 (1.05–2.94) | 4.66 (2.58–8.42) | 4.32 (2.59–7.20) | |
| Parasite density * | 0.85 (0.69–1.06) | 0.81 (0.65–1.00) | 0.41 (0.32–0.51) | 0.44 (0.35–0.54) | |
-
*Increasing parasite density (log10) in parasites/microliter, as measured by qPCR.
Additional files
-
Supplementary file 1
(a) AMA-1 hemi-nested PCR protocol for amplicon deep-sequencing. (b) Bioinformatics workflow. (c) Declining qPCR density over time in the cohort. (d) Detailed explanation of skip rule criteria. (e) Haplotype sequences and frequencies. (f) Sensitivity analysis of molecular force of infection: Table 2 replicated using 2 skips or 1 skip. (g) Sensitivity analysis of duration of infection: Table 3 replicated using 2 skips or 1 skip.
- https://cdn.elifesciences.org/articles/59872/elife-59872-supp1-v1.docx
-
Transparent reporting form
- https://cdn.elifesciences.org/articles/59872/elife-59872-transrepform-v1.docx
Download links
A two-part list of links to download the article, or parts of the article, in various formats.
Downloads (link to download the article as PDF)
Open citations (links to open the citations from this article in various online reference manager services)
Cite this article (links to download the citations from this article in formats compatible with various reference manager tools)
Sex-based differences in clearance of chronic Plasmodium falciparum infection
eLife 9:e59872.
https://doi.org/10.7554/eLife.59872


