The final step of 40S ribosomal subunit maturation is controlled by a dual key lock
- Molecular, Cellular and Developmental Biology department (MCD), Centre de Biologie Integrative (CBI), University of Toulouse, CNRS, UPS, France
- Institut für Biochemie, ETH Zürich, Switzerland
- Institut de Pharmacologie et Biologie Structurale, Université de Toulouse, CNRS, UPS, France
Figures
Figure 1 with 2 supplements
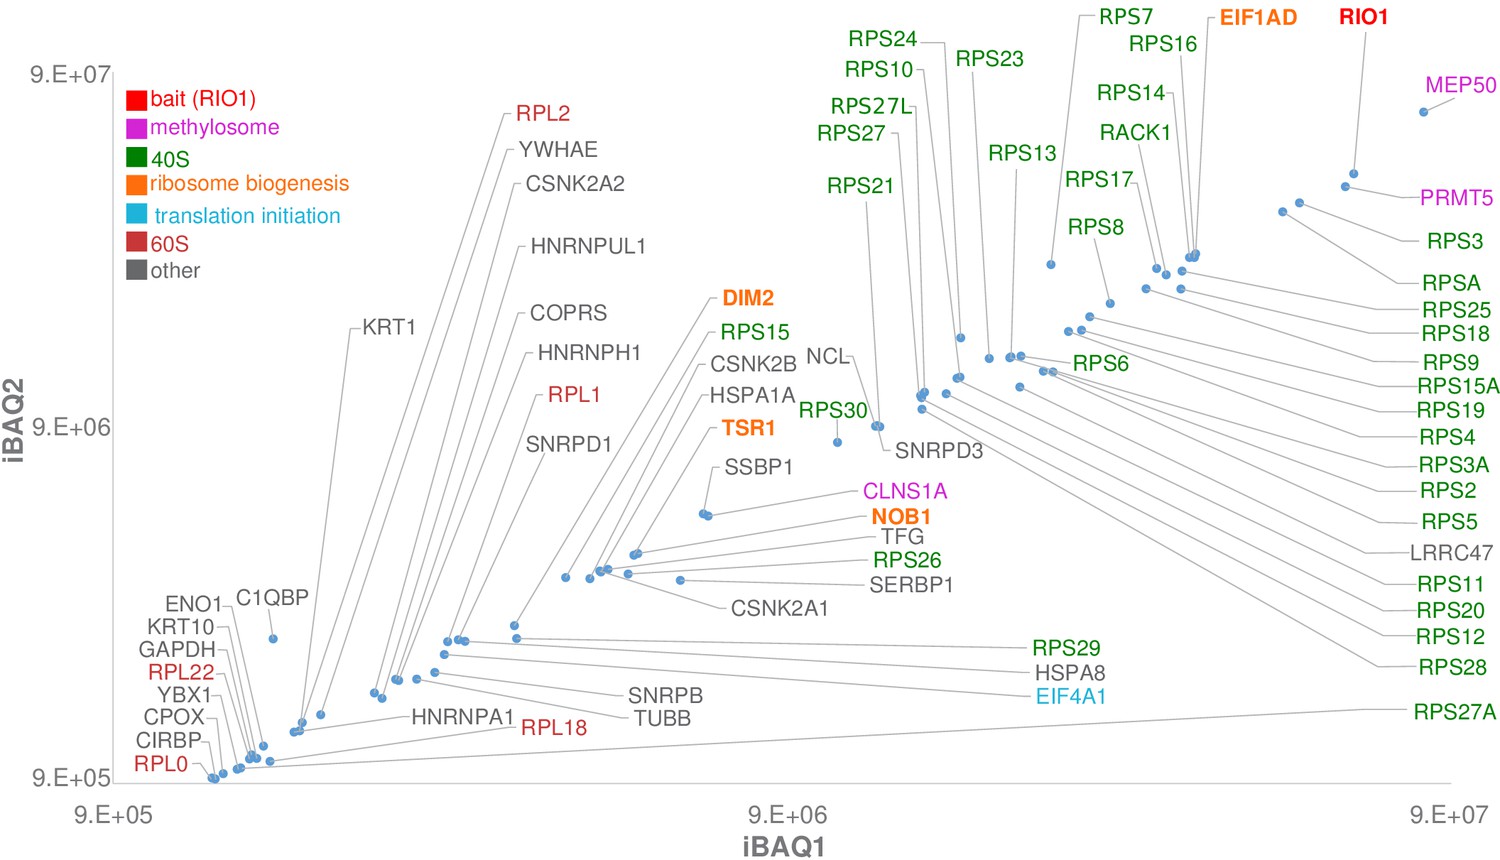
Label-free bottom-up proteomic analysis of RIO1(kd)-StHA co-purified proteins.
The most intense proteins (first two logs) with an observed/observable peptide ratio > 30% are displayed and color coded as indicated on the graph. Three independent experimental replicates were performed. This plot represents iBAQs (intensity-based absolute quantification) of experimental replicate 1 (iBAQ1) against experimental replicate 2 (iBAQ2). The iBAQ value is obtained by dividing protein intensities by the number of theoretically observable tryptic peptides (Schwanhäusser et al., 2011). Other plots are displayed in Figure 1—figure supplement 2. Of note, USP16, which was recently identified as a key player in both ribosome biogenesis and translation (Montellese et al., 2020), was also identified among RIO1(kd)-StHA proteic partners. It ranked at the 62th position when quantifying proteins based on their normalized abundances and at the 98th position when quantifying proteins based on their iBAQs (see the PRIDE repository [Perez-Riverol et al., 2019]; dataset identifier: PXD019270).
Figure 1—figure supplement 1

Purification of RIO1(kd)-StHA-containing particles.
(a) RIO1(kd)-StHA purification products analyzed by SDS–PAGE followed by silver staining. (b) Northern blot analysis of the RNA content of the RIO1(kd)-StHA pre-40S particles (right lanes) compared to fibroblast total RNA (left lanes), revealed with 5’ITS1, ITS1-5.8S, ITS2, and 18S + 28S probes (0.2 µg/lane).
Figure 1—figure supplement 2

Label-free bottom-up proteomic analyses of RIO1(kd)-StHA co-purified proteins.
All plotted proteins harbor an observed/observable peptide ratio > 30%; names of proteins with the 75 highest ratios are displayed, with color codes as indicated on Figure 1. (a) iBAQs of experimental replicate 1 (iBAQ1) against experimental replicate 3 (iBAQ3). (b) iBAQs of experimental replicate 2 (iBAQ2) against experimental replicate 3 (iBAQ3).
Figure 2 with 2 supplements
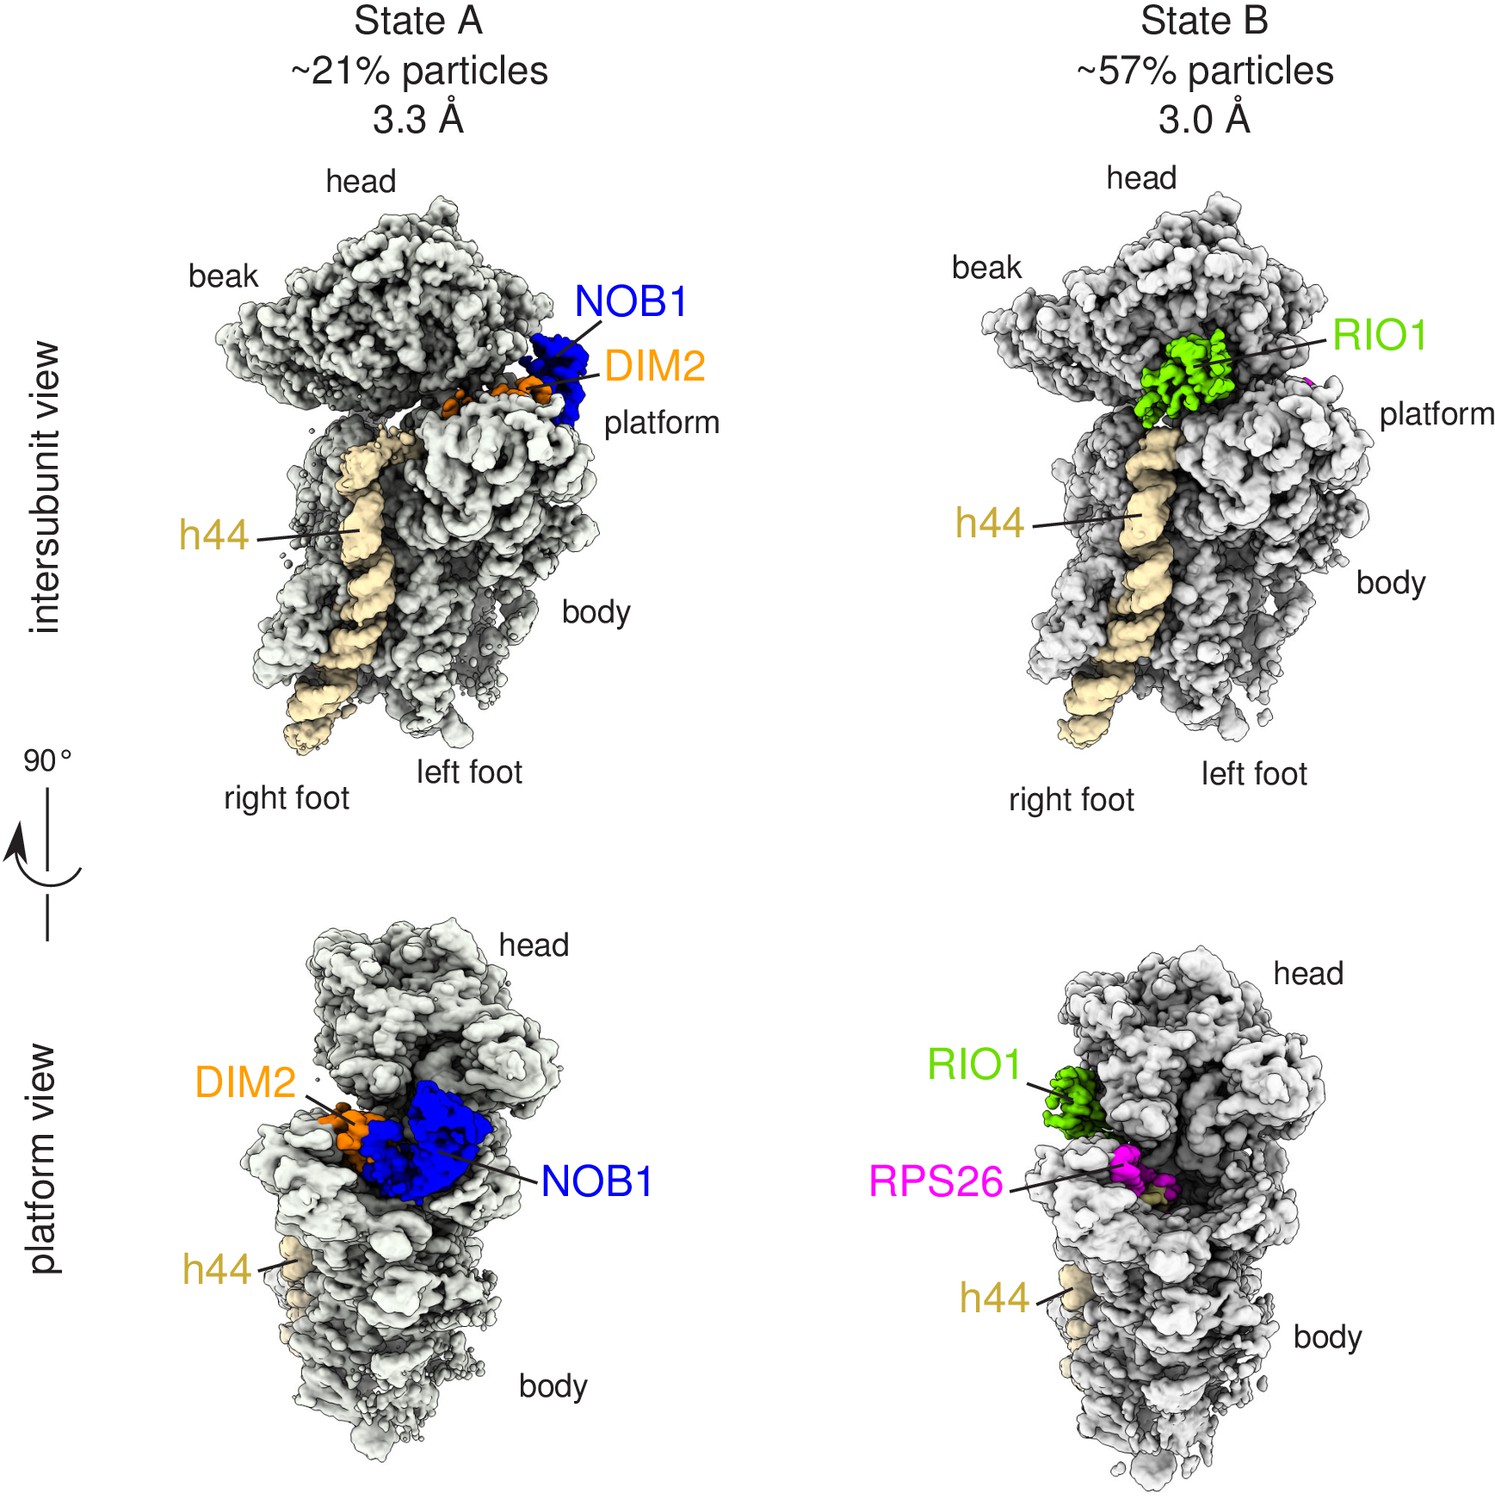
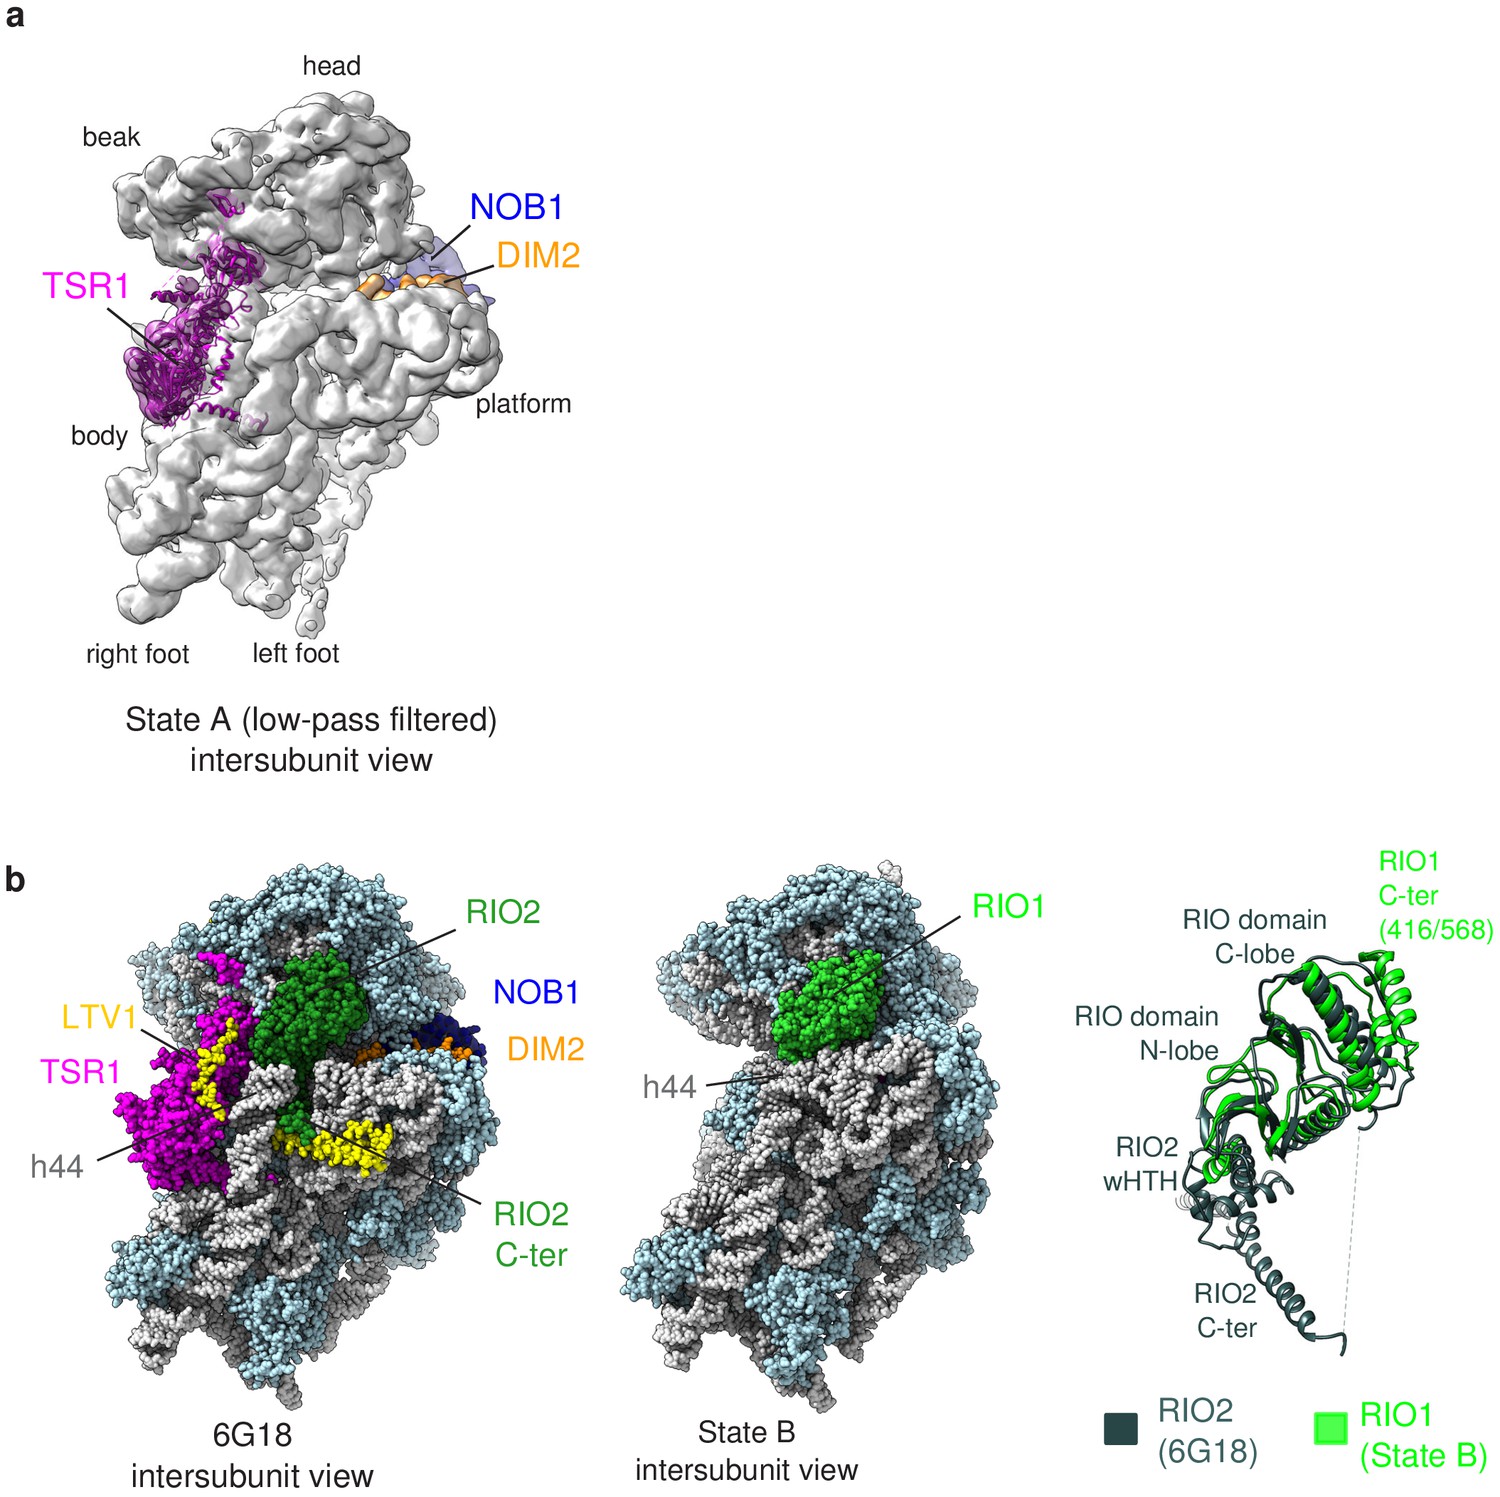
Cryo-EM and single-particle analysis reveal two distinct structural states, pre- (state A) and post- (state B) 18S-E rRNA cleavage.
Surface views of cryo-EM maps of RIO1(kd)-StHA pre-40S particles in structural state A (left) and state B (right). Ribosomal proteins, rRNA segments, and RBFs of interest have been segmented and colored as indicated on the figure. Image processing details are shown in Figure 2—figure supplements 1 and 2.
Figure 2—figure supplement 1

Cryo-EM image processing scheme.
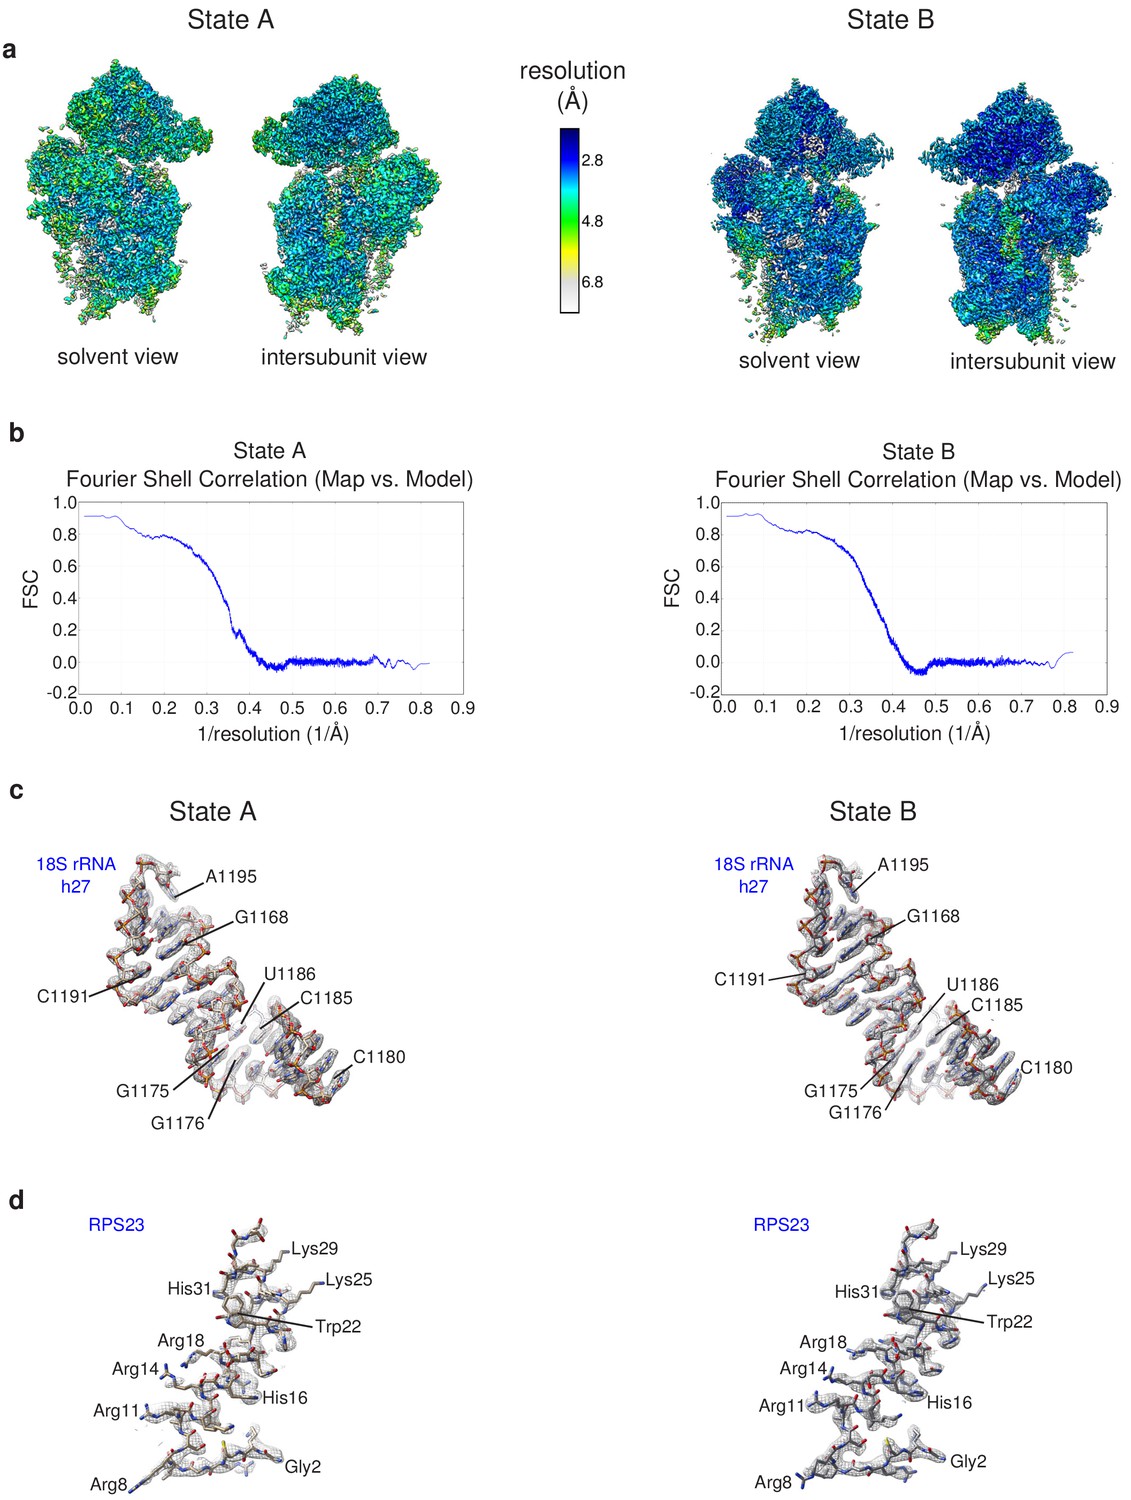
(a) Single-particle analysis strategy applied for obtaining the states A and B RIO1(kd)-StHA structures. (b) States A (left) and B (right) cryo-EM maps and Euler angle distribution as seen along the interface side. (c) Gold-standard FSC curves for the various cryo-EM maps obtained for states A (left) and B (right).
Figure 2—figure supplement 2
Details of the cryo-EM structures/model validation.
(a) Composite post-processed maps of state A (left) and state B (right) colored according to local resolution estimations calculated by the Resmap program (Kucukelbir et al., 2014). (b) Validation of the atomic models derived from the cryo-EM maps of hRIO1(kd)-StHA pre-40S particles: model to map Fourier Shell Correlation estimation calculated by Molprobity for state A (left) and state B cryo-EM data. (c, d) Details of the atomic models of state A (left) and state B pre-40S particles showing 18S rRNA helix 27 (c) and N-terminal domain of RPS23 (d); cryo-EM map density is represented by a gray mesh.
Figure 3 with 2 supplements
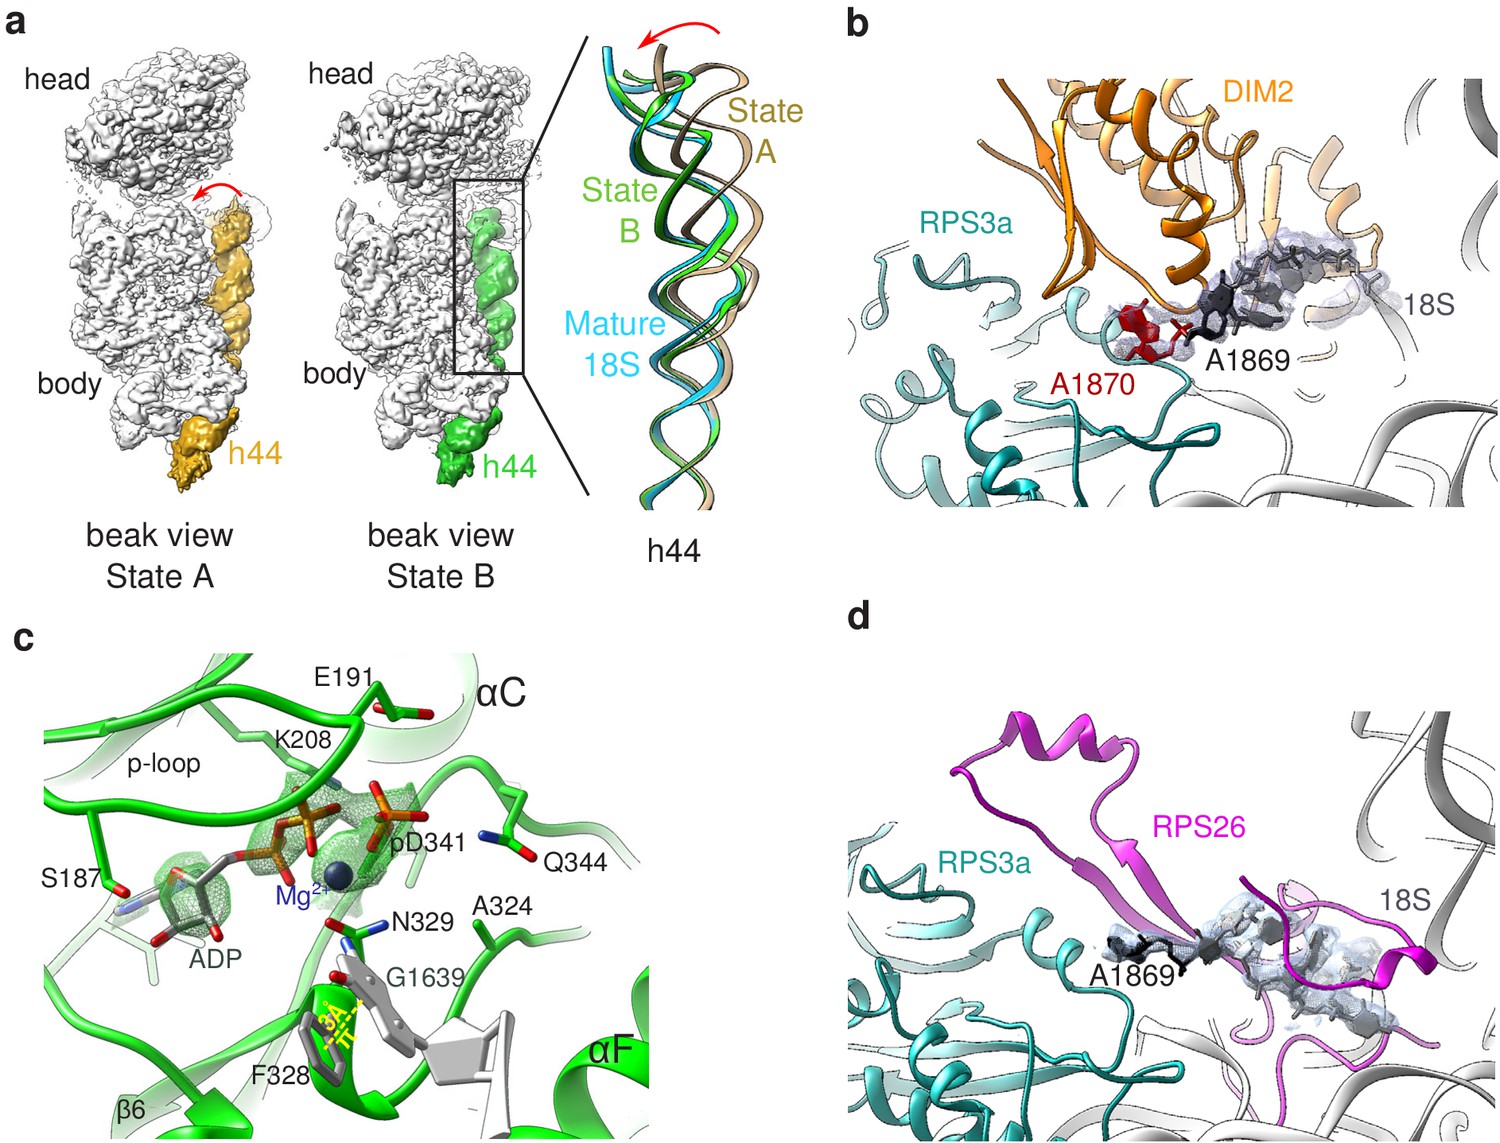
Structural details of RIO(kd)-StHA pre-40S particles.
(a) The upper part of 18S rRNA helix h44 is in an immature position in structural state A. The cryo-EM density map corresponding to this helix has been segmented (beige density); the atomic model of rRNA h44 in structural state A is represented in golden; superimposed 18S rRNA h44 as found in structural state B and in the mature 40S subunit (PDB 6EK0 Natchiar et al., 2018) are in green and blue, respectively. (b) Close-up on the platform domain of structural state A. Segmented cryo-EM density corresponding to 18S-E pre-rRNA is shown as a grey mesh. The 3′-end of the mature 18S rRNA (nucleotides 1865–1869) is shown in black, while A1870 in the ITS1 is in red. The 18S rRNA is otherwise shown as a gray ribbon. DIM2 is in orange; RPS3a is in turquoise. NOB1 was removed from this representation for the sake of clarity. (c) The catalytic pocket of RIO1 is in an ‘active’ state within structural state B pre-40S particles, and carries an ADP and a phospho-aspartate (pD341). The cryo-EM density corresponding to ADP, p-Asp, and magnesium is shown as a green mesh. RIO1 is shown in green; ADP in dark gray, Mg2+ in dark violet, and 18S rRNA G1639 closing RIO1 catalytic domain by a pi-stacking interaction (yellow dashed line) with RIO1 Phe 328 in light gray. (d) Close-up on the platform domain of structural state B. Segmented cryo-EM density corresponding to 18S rRNA 3′-end is shown as a light gray mesh. 18S rRNA 3′-end (nucleotides 1865–1869) is shown in black, while otherwise as gray ribbon. RPS26 is in magenta and RPS3a in turquoise.
Figure 3—figure supplement 1
Details of the structural analysis of hRIO1(kd)-StHA pre-40S particles.
(a) Low-pass filtered cryo-EM map of state A reveals a density on the intersubunit side under the beak (colored in magenta), which can unambiguously accommodate the atomic structure of TSR1 (ribbons colored in magenta; atomic model from Ameismeier et al., 2018, PDB-ID 6G18). (b) RIO1 replaces RIO2 on the back of the head of pre-40S particles. (Left) Atomic model of intermediate cytoplasmic pre-40S particle (state C of Ameismeier et al., 2018, PDB-ID 6G18) featuring RIO2, displayed in dark green. The upper part of rRNA helix h44 is lifted from the rest of the body, allowing the C-terminal domain of RIO2 as well as a domain of LTV1 (yellow) to be deeply inserted within the pre-40S particle. (Middle) Atomic model of state B of hRIO1(kd)-StHA pre-40S particles. RIO1 is shown in light green. The upper part of rRNA helix h44 is close to the rest of the particle, preventing the C-terminal domain of RIO1 to occupy this region. (Right) Superimposition of RIO2 (dark green) and RIO1 as found on the two pre-40S particles herein presented.
Figure 3—figure supplement 2
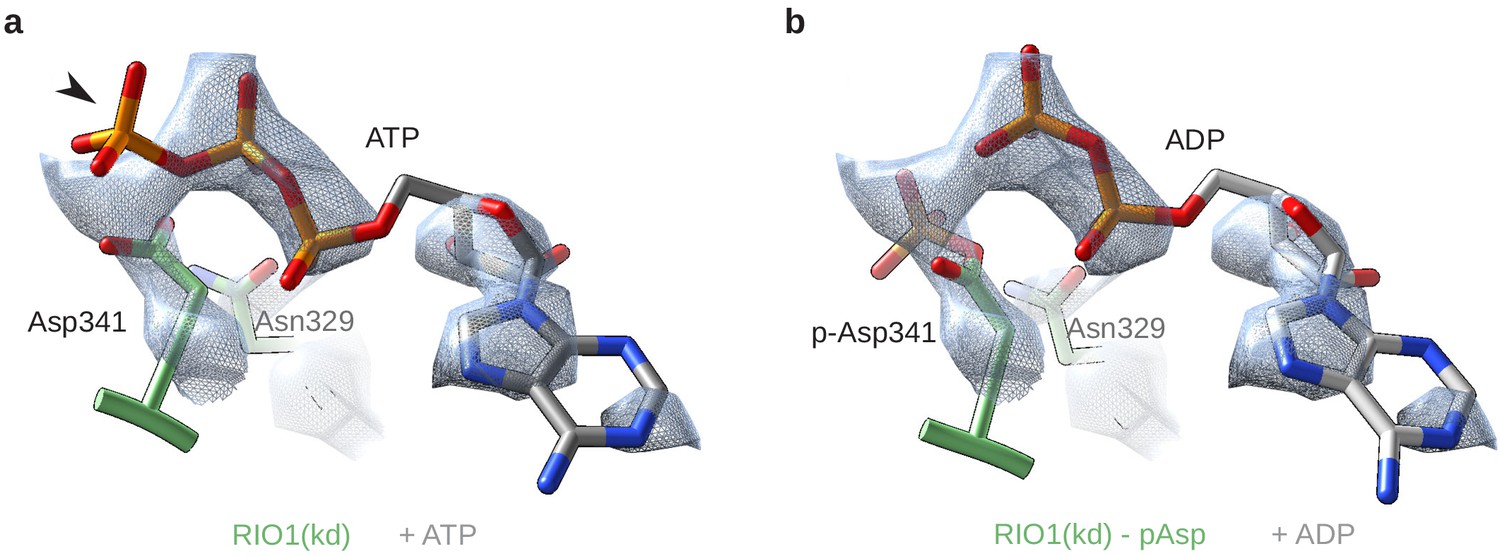
RIO1(kd) carries an hydrolyzed ATP in its catalytic site.
(a) Cryo-EM density map (blue-gray mesh) of the catalytic site of RIO1 (green) fitted with an ATP molecule (gray/orange). The arrowhead shows the y-phosphate moiety sticking out of the EM density. (b) Same area of the cryo-EM map, this time fitted with an ADP (gray/orange) and a phospho-aspartate (p-Asp 341) carried by RIO1.
Figure 4 with 1 supplement
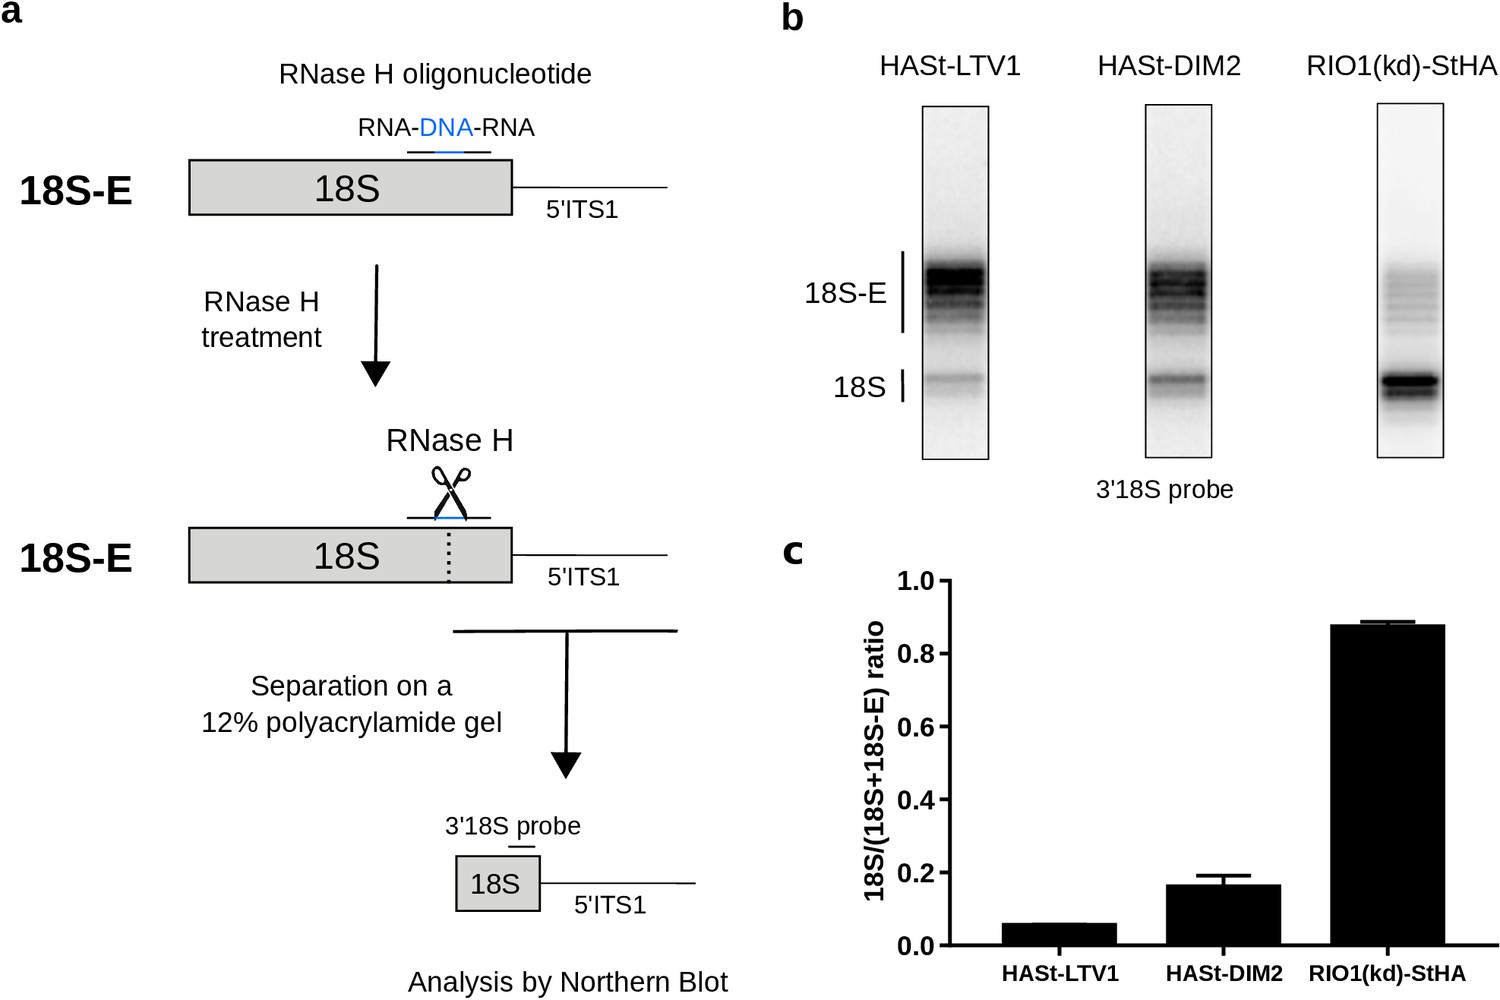
Late RIO1(kd)StHA pre-40S particles contain a high proportion of mature 18S rRNA.
(a) Diagram representing steps of the pre-40S rRNA digestion by RNase H. (b) RNase H assays were performed on RNAs extracted from pre-40S particles purified with the mentioned StHA-tagged bait and separated on a 12% polyacrylamide gel. The 18S rRNA and its precursors were revealed by the 3′18S radiolabeled probe. Bands are separated with single nucleotide resolution, as shown in Figure 4—figure supplement 1. (c) Signals corresponding to the 18S-E and 18S rRNAs were quantified by phosphorimaging and represented by the 18S/(18S + 18S-E) ratio for the different purified pre-40S particles. The average of three independent experiments is shown, with the standard deviation indicated on top of the histogram.
Figure 4—figure supplement 1
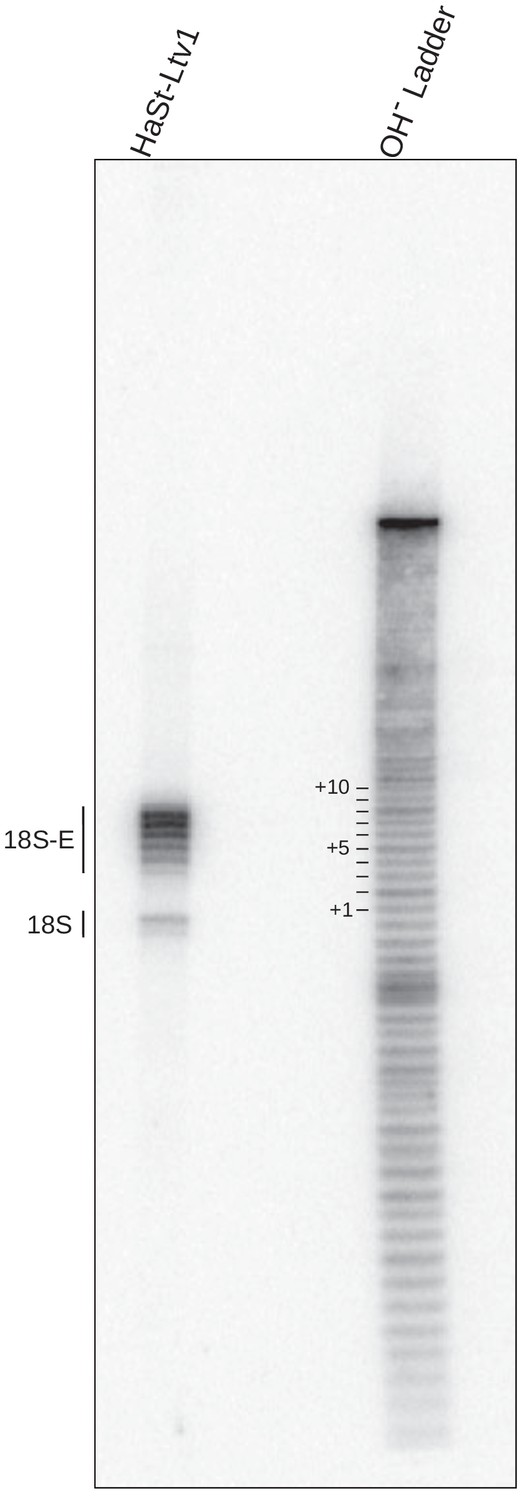
Assessment of the size of the ITS1 in purified pre-40S particles.
Comparison of RNAse H digestion and alkaline hydrolysis assays shows nucleotide resolution between bands. (Left) RNase H digestion of rRNAs from pre-40S particles purified using a HASt-tagged version of LTV1 as bait (HASt-LTV1). (Right) Alkaline hydrolysis (OH− ladder) of an RNA molecule containing the 18S-ITS1 sequence recognized by the 3′18S probe at its 5′ end (see Supplementary file 1). The samples were fractionated on a 12% polyacrylamide gel, and northern blot was probed with the 3′18S probe.
Figure 5 with 2 supplements
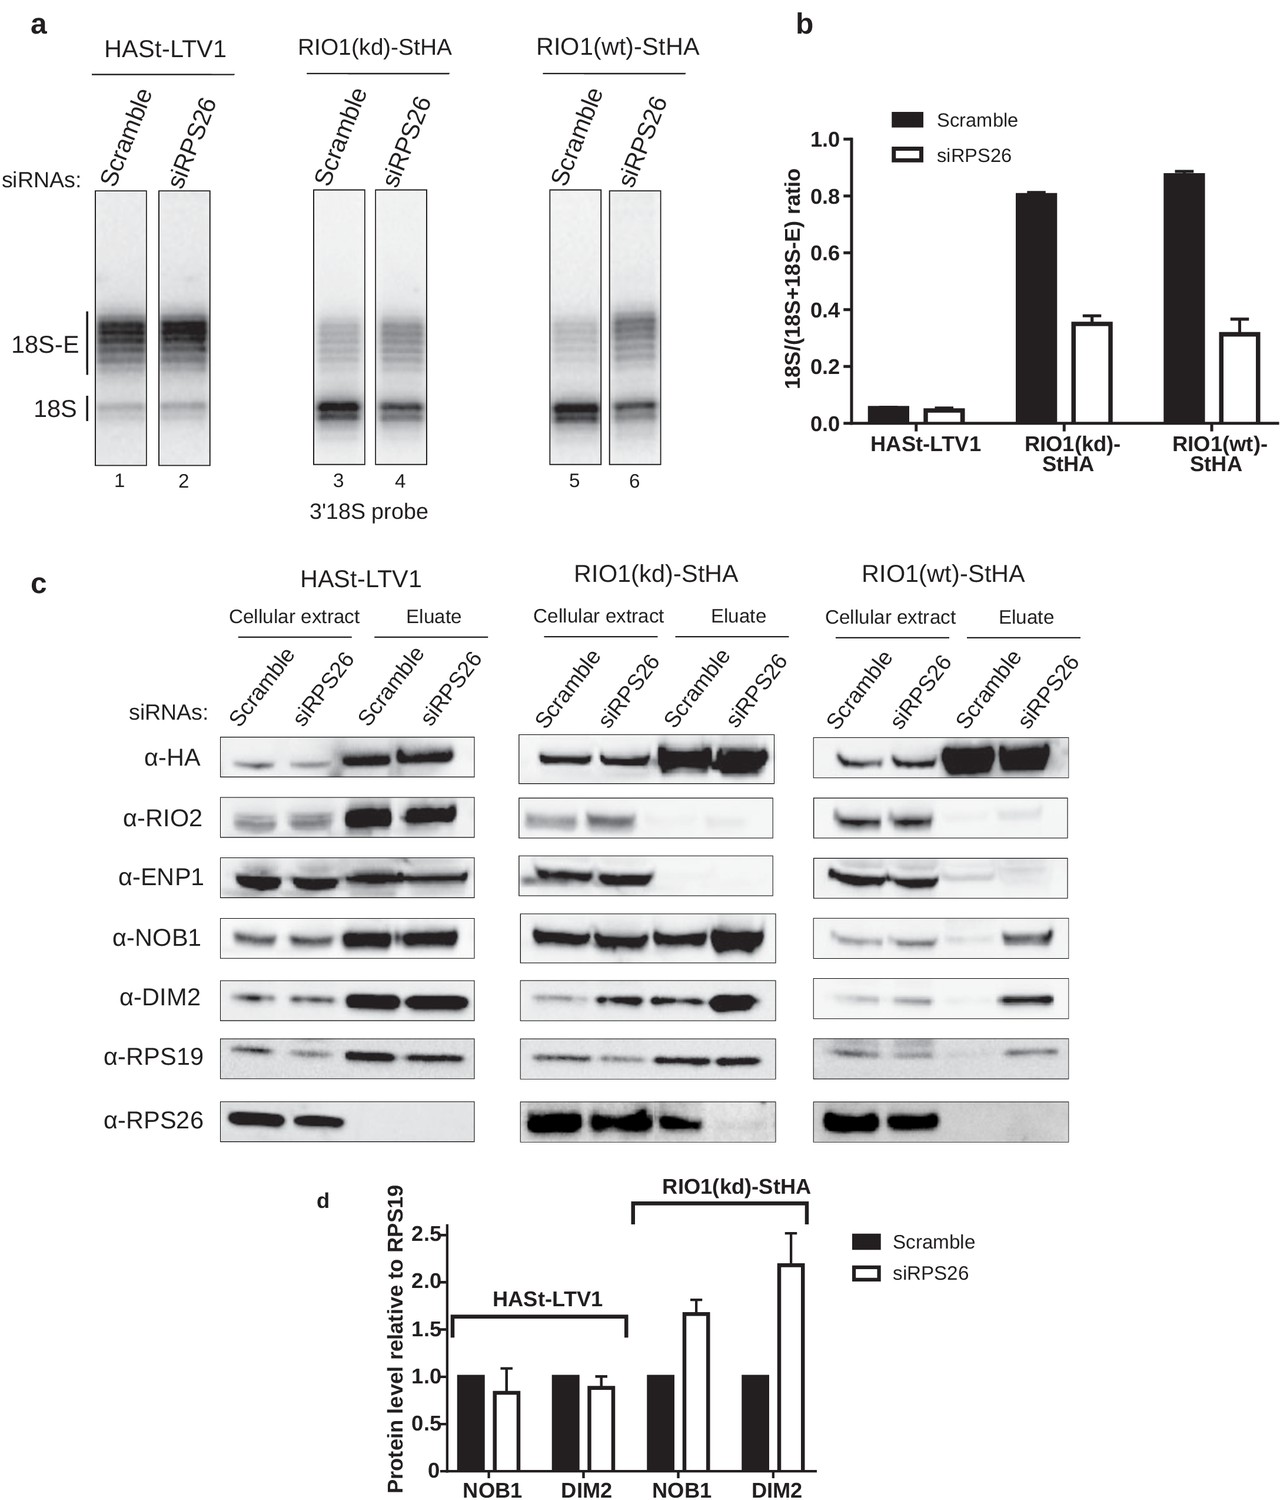
RPS26 is required for rRNA cleavage at site 3 as well as NOB1 and DIM2 release.
HEK cell lines expressing tagged version of LTV1, the catalytically inactive RIO1-D324A (RIO1 (kd)) or wild-type RIO1 (RIO1(wt)) were treated with scramble or RPS26 siRNAs for 48 hr. (a) RNase H assays were conducted as in Figure 4 on rRNAs of pre-40S particles purified with the mentioned StHA-tagged bait, either from RPS26-depleted or from control cells (scramble siRNA). (b) Signals corresponding to the 18S-E and 18S rRNA detected in (a) were quantified and represented as the 18S/(18S + 18S-E) ratio for the different pre-40S particles. Error bars, s.d. (n = 3) (c) Cell extracts and purified particles were analyzed by western blot using the indicated antibodies. (d) Bands corresponding to DIM2 and NOB1 (in the eluates) were quantified, corrected for pre-40S particle loading (using RPS19) and normalized to the control condition (set to 1). Error bars, s.d. (n = 3).
Figure 5—figure supplement 1

Comparative proteomics of RIO1(kd)-StHA particles composition upon RPS26 depletion.
The Volcano plot shows in abscissa the fold change of protein abundance (siRPS26/control pre-40S particles), and in ordinate the statistical significance of the differential expression of a given protein (p-value of a t-test). The diameters of the dots are proportional to the mean IBAQ value calculated for each protein. Upper left (blue lining) and right (magenta lining) quadrants of the plots reveal proteins that are significantly up- or down-regulated within RIO1(kd)-StHA purified particles upon RPS26 depletion, respectively.
Figure 5—figure supplement 2
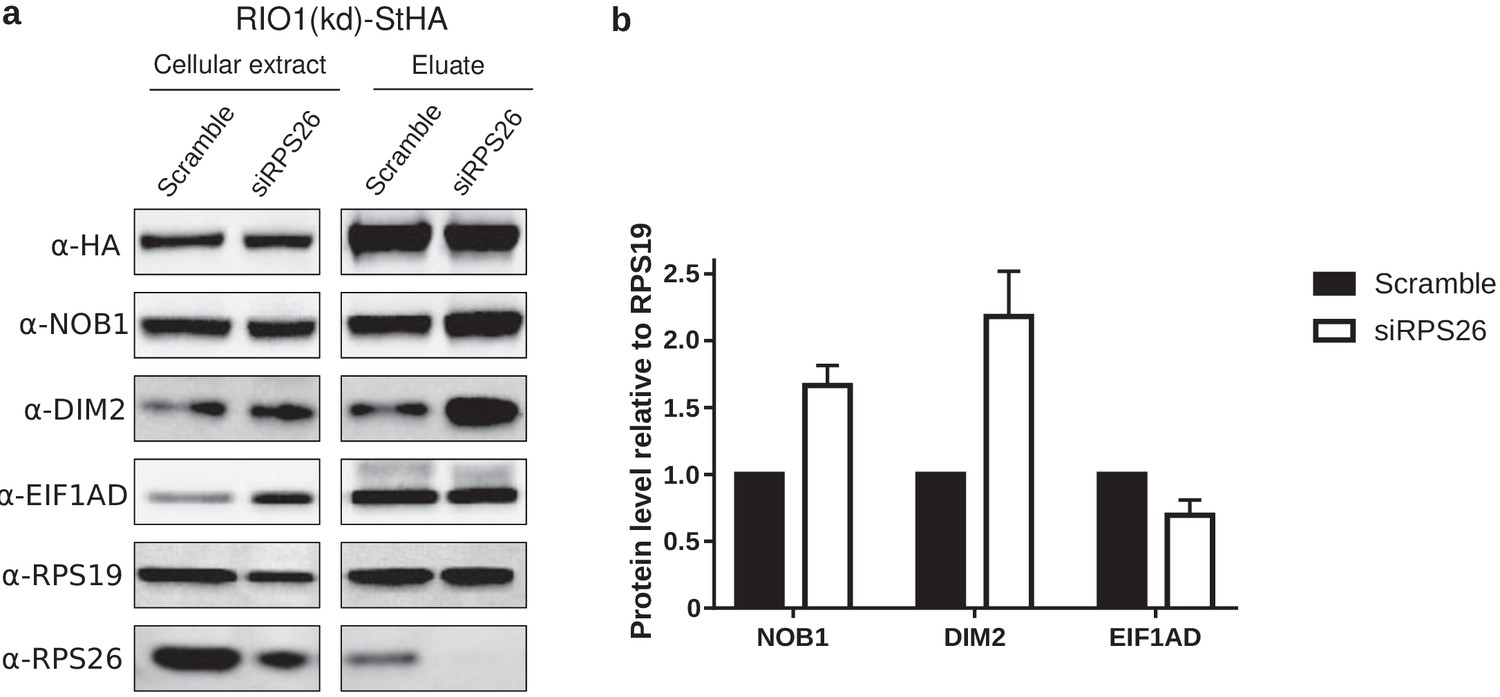
Western blot analysis of EIF1AD association to pre-40S particles upon depletion of RPS26.
(a) Cell extracts and purified particles were analyzed by western blot using the indicated antibodies. (b) Bands corresponding to NOB1, DIM2, and EIF1AD (in the eluates) were quantified, corrected for pre-40S particle loading (using RPS19), and normalized to the control condition (set to 1). Error bars, s.d. (n = 3).
Figure 6 with 2 supplements
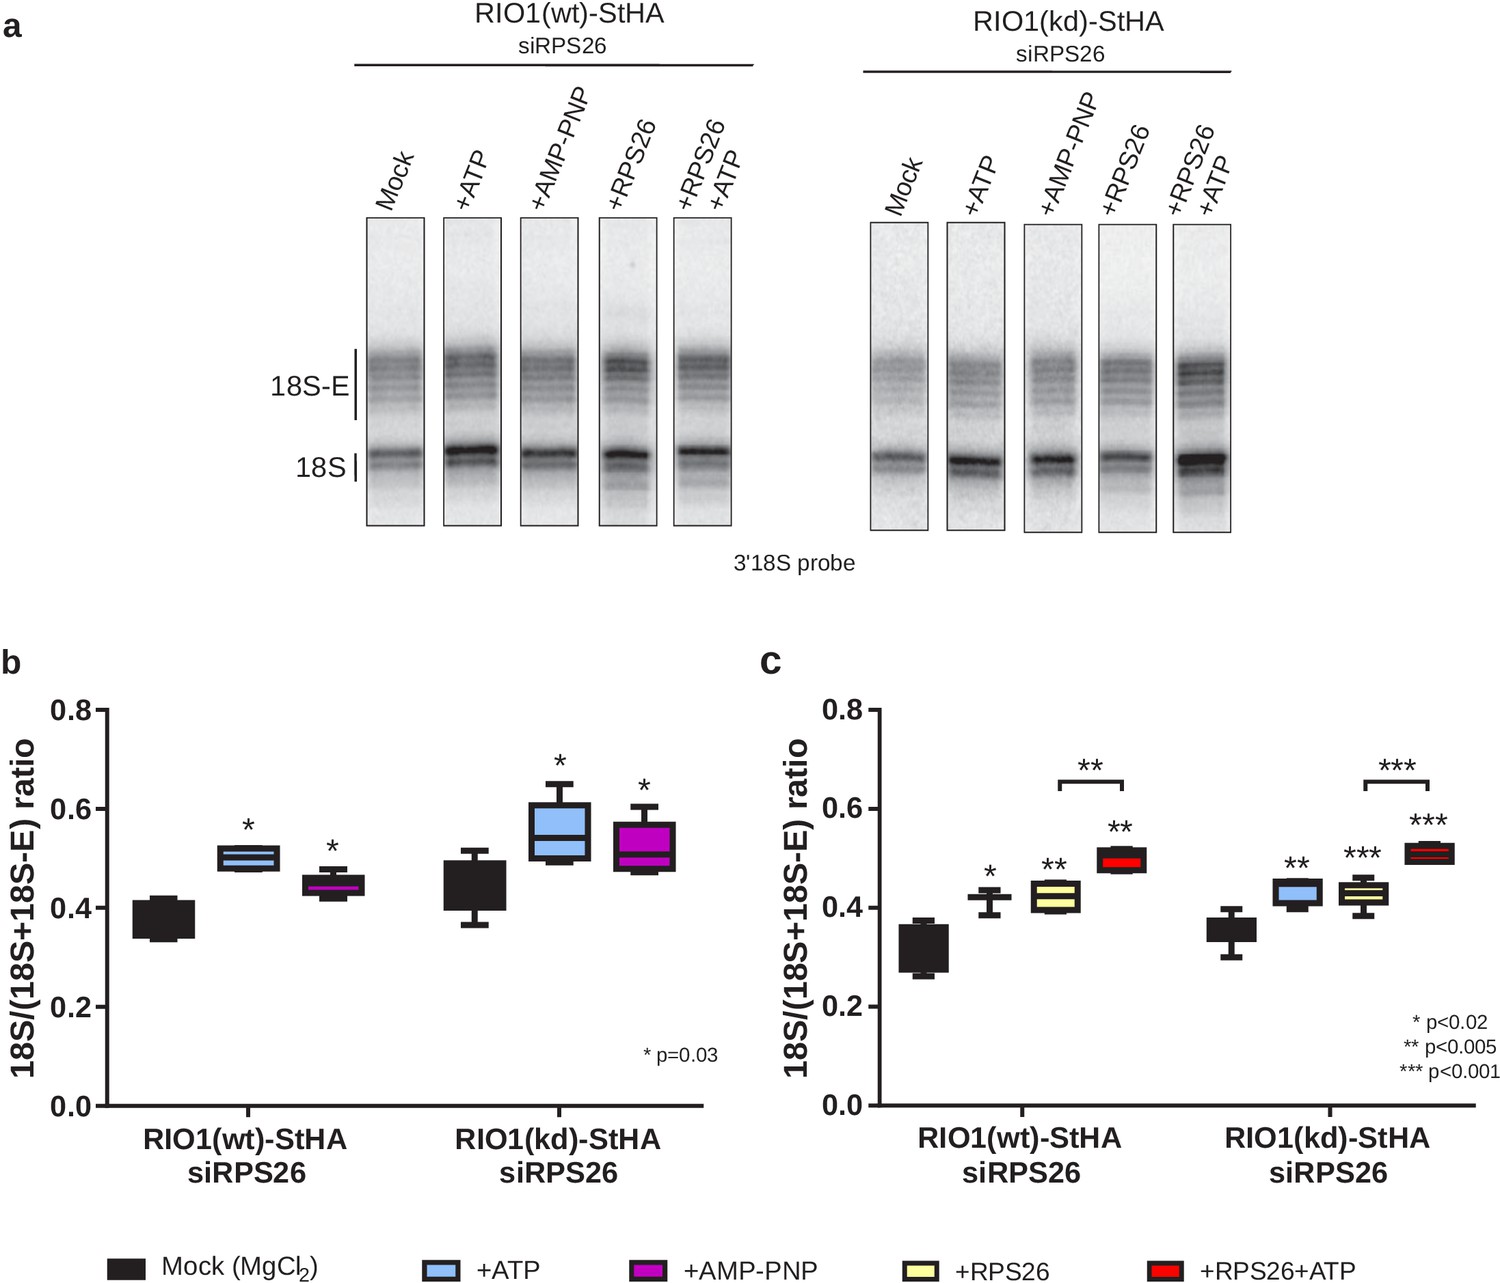
In vitro cleavage of the 18S-E pre-rRNA within pre-40S particles is stimulated by ATP addition.
HEK cell lines expressing tagged versions of wild-type RIO1 ‘RIO1(wt)’ or of the catalytically inactive ‘RIO1(kd)’ were treated with RPS26 siRNAs for 48 hr to enrich particles in state A. Pre-40S particles were purified and incubated for 1 hr in buffer alone (mock condition) or in the presence of either 1 mM ATP, 1 mM AMP-PNP, 2 µg of RPS26, or 2 µg of RPS26 plus 1 mM ATP. (a) RNAse H assays were performed on the RNAs extracted from the particles. (b) The variation of cleavage efficiency upon addition of ATP or AMP-PNP is indicated by the 18S/(18S + 18S-E) ratio. The data correspond to five independent experiments. Statistical analysis was performed with a unilateral paired Wilcoxon test (‘sample greater than mock’) indicating p-values of 0.031 for all samples. (c) The variation of cleavage efficiency upon addition of ATP and/or RPS26 is indicated by the 18S/(18S + 18S-E) ratio. The data correspond to three to six independent measurements for each point. Statistical analysis was performed with a unilateral unpaired Wilcoxon test (‘sample greater than mock’ or ‘+RPS26+ATP greater than +RPS26’).
Figure 6—figure supplement 1

Superimposition of atomic models of states A and B reveals overlapping distances (gray lines) between atoms of Proline 351 from RIO1 (green) and of Arginine 247 from DIM2 (orange).
RPS5, which seems to be repositioned upon association of RIO1/dissociation of DIM2 from the pre-40S particle, is shown in violet (state A) or white (state B).
Figure 6—figure supplement 2
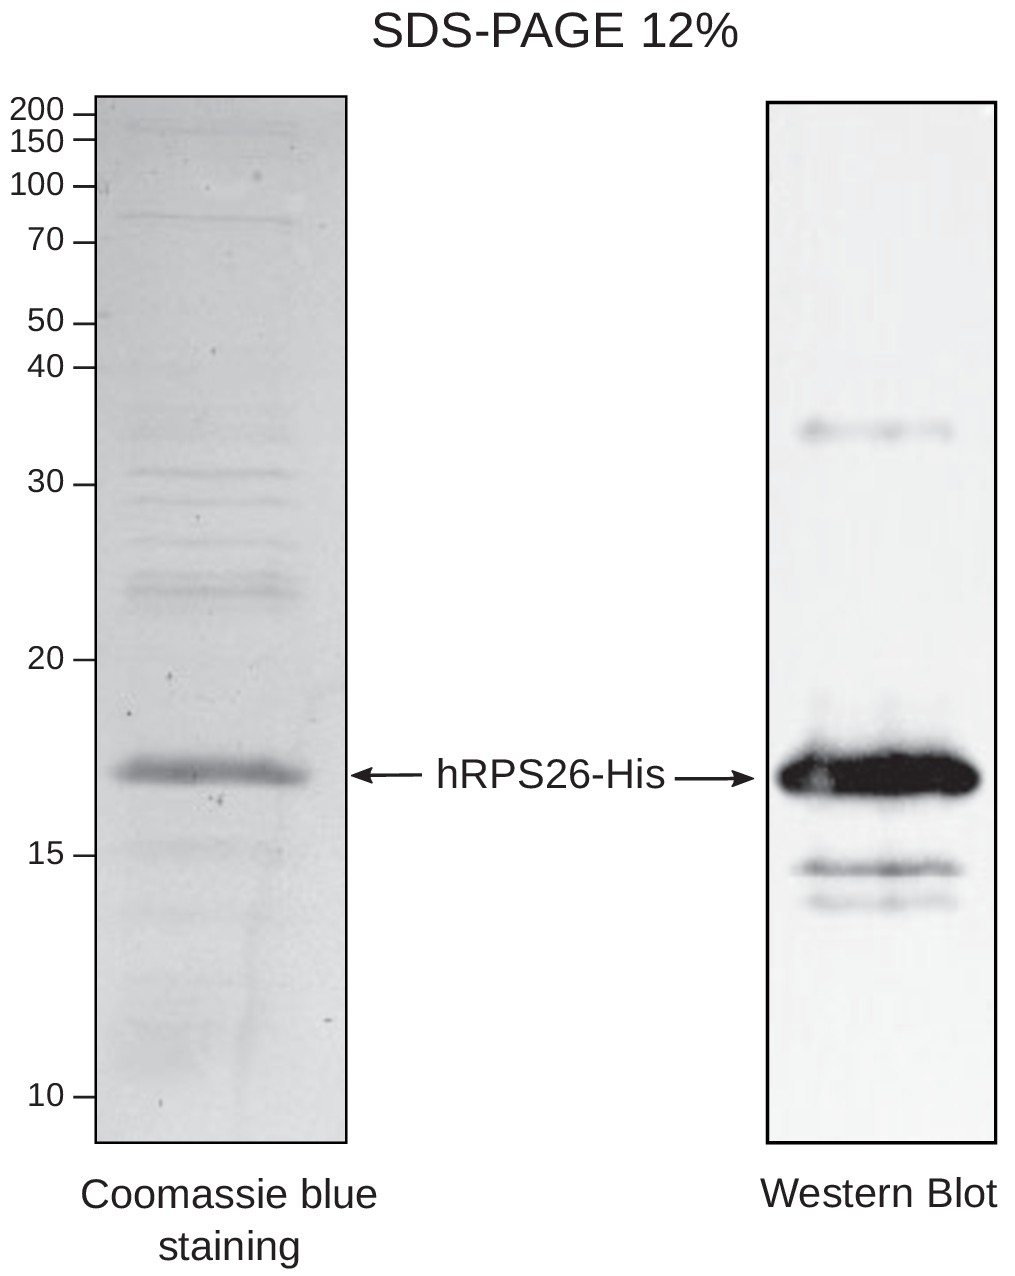
Purification of recombinant hRPS26-His.
hRPS26-His purification analyzed by SDS–PAGE followed by Coomassie blue staining or western blot.
Figure 7
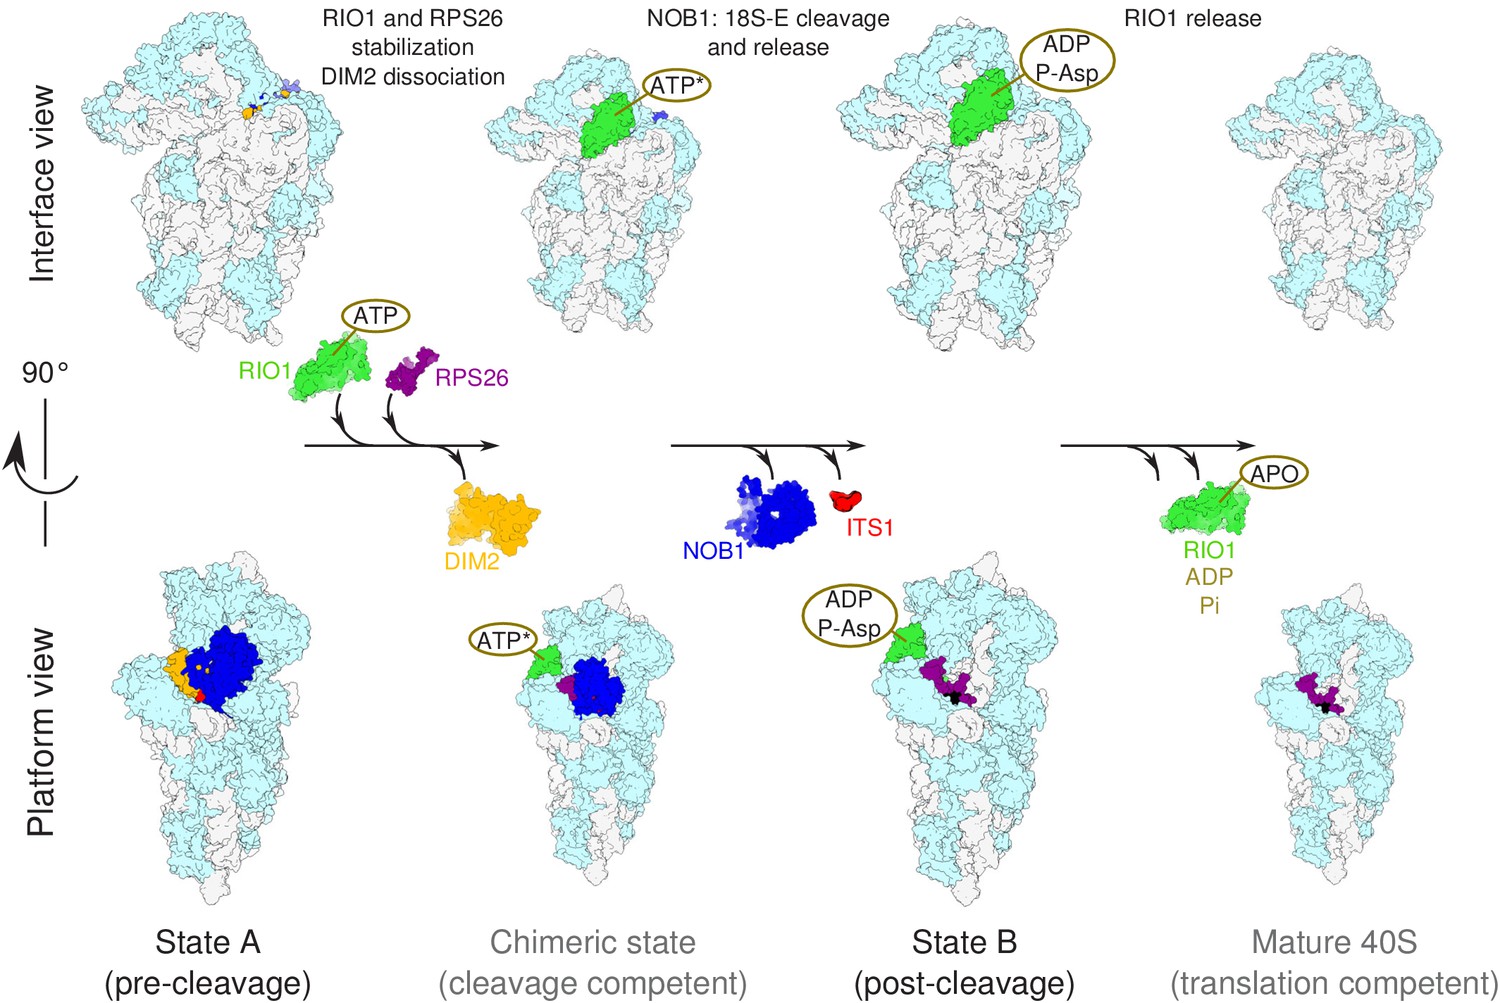
Model of the pre-40S last maturation steps triggered by RIO1 and RPS26.
Upper and lower panels represent interface and platform views of the small ribosomal subunit, respectively. A putative ITS1 cleavage-competent state is shown to illustrate the transition between the pre-cleavage (state A) and post-cleavage (state B) structures that were resolved in this study. Status of ATP hydrolysis within RIO1 for this maturation state is not known, and thus marked as ‘ATP*’.
Tables
Key resources table
| Reagent type (species) or resource | Designation | Source or reference | Identifiers | Additional information |
|---|---|---|---|---|
| Cell line (Homo sapiens) | HEK293 FlpIn T-REx HASt-DIM2 | (Wyler et al., 2011) DOI: 10.1261/rna.2325911 | ||
| Cell line (Homo sapiens) | HEK293 FlpIn T-REx HASt-LTV1 | (Wyler et al., 2011) DOI: 10.1261/rna.2325911 | ||
| Cell line (Homo sapiens) | HEK293 FlpIn T-REx RIOK1-StHA | (Widmann et al., 2012) DOI: 10.1091/mbc.E11-07-0639 | ||
| Cell line (Homo sapiens) | HEK293 FlpIn T-REx RIOK1(D324A)-StHA | (Widmann et al., 2012) DOI: 10.1091/mbc.E11-07-0639 | ||
| Transfected construct (human) | si-RPS26 | Eurogentec | 5′-GGACAAGGCCAUUAAGAAA dTdT-3′ | |
| Transfected construct (human) | si-EIF1AD | Eurogentec | 5′-ACCGCAGACAGUAUCAUGAGA-3′ | |
| Transfected construct (human) | si-control | Eurogentec | SR-CL000-005 | |
| Antibody | Anti-DIM2 (rabbit polyclonal) | (Zemp et al., 2009) DOI: 10.1083/jcb.200904048 | WB(1:2000) | |
| Antibody | Anti-ENP1 (rabbit polyclonal) | (Zemp et al., 2009) DOI: 10.1083/jcb.200904048 | WB(1:5000) | |
| Antibody | Anti-HA-HRP (rabbit polyclonal) | Sigma-Roche Applied Science | Cat# MMS-101P RRID:AB_2314672 | WB(1:1000) |
| Antibody | Anti-NOB1 (rabbit polyclonal) | (Zemp et al., 2009) DOI: 10.1083/jcb.200904048 | WB(1:5000) | |
| Antibody | Anti-RIOK2 (rabbit polyclonal) | (Zemp et al., 2009) DOI: 10.1083/jcb.200904048 | WB(1:5000) | |
| Antibody | Anti-RPS26 (rabbit polyclonal) | Genetex | GTX131193-S | WB(1:1000) |
| Antibody | Anti-RPS19 (rabbit polyclonal) | (This article) | WB(1:5000) | |
| Antibody | Anti-EIF1AD (rabbit polyclonal) | Proteintech | 20528–1-AP | WB(1:2000) |
| Sequence-based reagent | 3′18S probe | (Larburu et al., 2016) DOI: 10.1093/nar/gkw714 | Northern blot probe, 5′-GATCCTTCCGCAGGTTCACCTACG-3′ | |
| Sequence-based reagent | RNase H_3_Hyb1 (RNA/DNA/RNA) | Eurogentec | 5′-UGUUACGACUUUUACTTCCUCUAGAUAGUCAAGUUC-3′ | |
| Sequence-based reagent | Lad_S oligo | Eurogentec | 5′-TAATACGACTCACTATAGGCGTAGGTGAACCTGCGGAAGGATCATTAACGGAGCCCGGAGGGCGAGGGATGAAGATGATGAGCTCGGCAGGTCCTGAGGAGTGATGA-3′ | |
| Sequence-based reagent | Lad_AS oligo | Eurogentec | 5′- AAGGTGAATCAGCACTCAAGATCCTCATCACTCCTCAGGACC-3′ | |
| Sequence-based reagent | Ladder sequence | This article | 5′-UAAUACGACUCACUAUAGGCGUAGGUGAACCUGCGGAAGGAUCAUUAACGGAGCCCGGAGGGCGAGGGAUGAAGAUGAUGAGCUCGGCAGGUCCUGAGGAGUGAUGAGGAUCUUGAGUGCUGAUUCACCUU-3′ |
Additional files
-
Supplementary file 1
Cryo-EM data collection, atomic models refinement, and validation statistics.
- https://cdn.elifesciences.org/articles/61254/elife-61254-supp1-v2.docx
-
Transparent reporting form
- https://cdn.elifesciences.org/articles/61254/elife-61254-transrepform-v2.docx
Download links
A two-part list of links to download the article, or parts of the article, in various formats.
Downloads (link to download the article as PDF)
Open citations (links to open the citations from this article in various online reference manager services)
Cite this article (links to download the citations from this article in formats compatible with various reference manager tools)
The final step of 40S ribosomal subunit maturation is controlled by a dual key lock
eLife 10:e61254.
https://doi.org/10.7554/eLife.61254


