Structural basis for PRC2 decoding of active histone methylation marks H3K36me2/3
- Max Planck Institute of Biochemistry, Laboratory of Chromatin Biology, Germany
- California Institute for Quantitative Biology (QB3), University of California, California Institute for Quantitative Biology (QB3), Molecular Biophysics and Integrative Bio-Imaging Division, Lawrence Berkeley National Laboratory, United States
- University of Cologne, Center for Molecular Medicine Cologne (CMMC), Faculty of Medicine and University Hospital Cologne, Germany
- Cologne Excellence Cluster for Cellular Stress Responses in Ageing-Associated Diseases (CECAD), University of Cologne, Germany
- Max Planck Institute of Biochemistry, Department of Structural Cell Biology, Germany
- Max Planck Institute of Biochemistry, cryoEM Facility, Germany
Figures
Figure 1 with 5 supplements
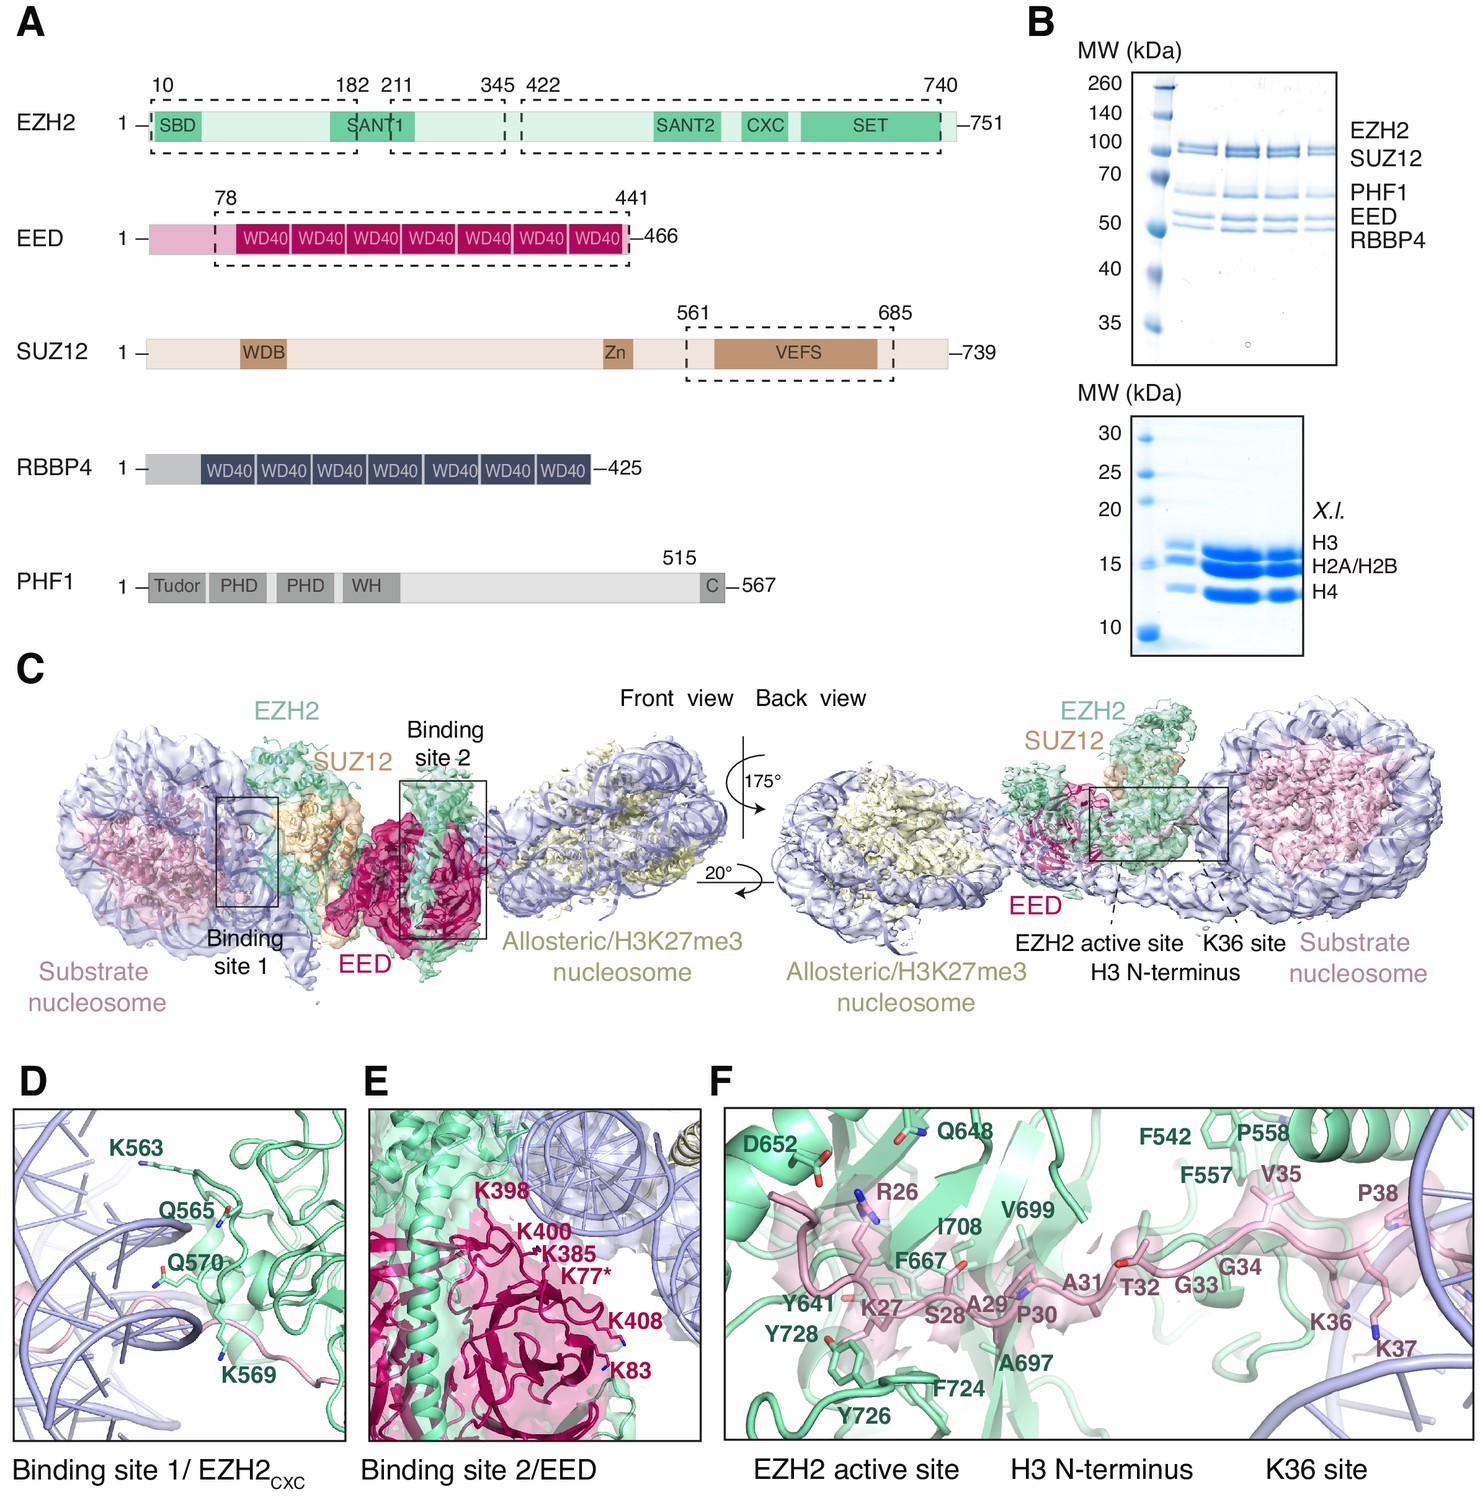
Interaction of the PRC2 catalytic lobe with nucleosomal DNA orients the H3 N-terminus for H3K27 binding to the active site.
(A) Domain organization in the five subunits of PHF1-PRC2. Dashed boxes indicate protein portions visible in the PHF1-PRC2:di-Nuc cryo-EM reconstruction and fitted in the structural model. In PHF1, C corresponds to the short C-terminal fragment used in PHF1C-PRC2. (B) Coomassie-stained SDS PAGE analysis of representative PHF1-PRC2 (upper panel) and Xenopus laevis (X.l.) octamer preparations (lower panel) after size-exclusion chromatography (SEC) purification. Pooled fractions of PHF1-PRC2, incubated with heterodimeric dinucleosomes generated by DNA ligation of a reconstituted unmodified and a H3Kc27me3-modified mononucleosome as described in Poepsel et al., 2018 were used as input material for cryo-EM analysis. (C) Cryo-EM reconstruction of PHF1-PRC2:di-Nuc in two orientations with fitted crystal structures of human PRC2 catalytic lobe (PDB: 5HYN, Justin et al., 2016) and nucleosomes (1AOI, Luger et al., 1997) in a di-Nuc model with 35 bp linker DNA (see also Figure 1—figure supplements 1–4, Supplementary file 1, Figure 1—video 1, Source code 1). Density is colored as in (A) to show PRC2 subunits, DNA (blue) and octamers of substrate (pink) and allosteric (yellow) nucleosomes. Boxes indicate regions shown in (D), (E) and (F), respectively. (D) Interaction of EZH2CXC residues with the DNA gyres of the substrate nucleosome; residues mutated in PRC2CXC>A are indicated. For the H3 N-terminus (pink), only the peptide backbone is shown in this view (see F). (E) Interface formed by EED and the EZH2 SBD domain with DNA gyres on the allosteric nucleosome; residues mutated in PRC2EED>A are indicated. Asterisk indicates the approximate location of a residue, which is not built in the model. (F) The H3 N-terminus (pink), shown as a pseudoatomic model fitted into the 4.4 Å density map, is recognized by EZH2 through an extensive interaction network (see text). Note the well-defined side-chain density of H3K36 (see also Figure 1—figure supplement 3D and Figure 1—figure supplement 4C–E).
Figure 1—figure supplement 1
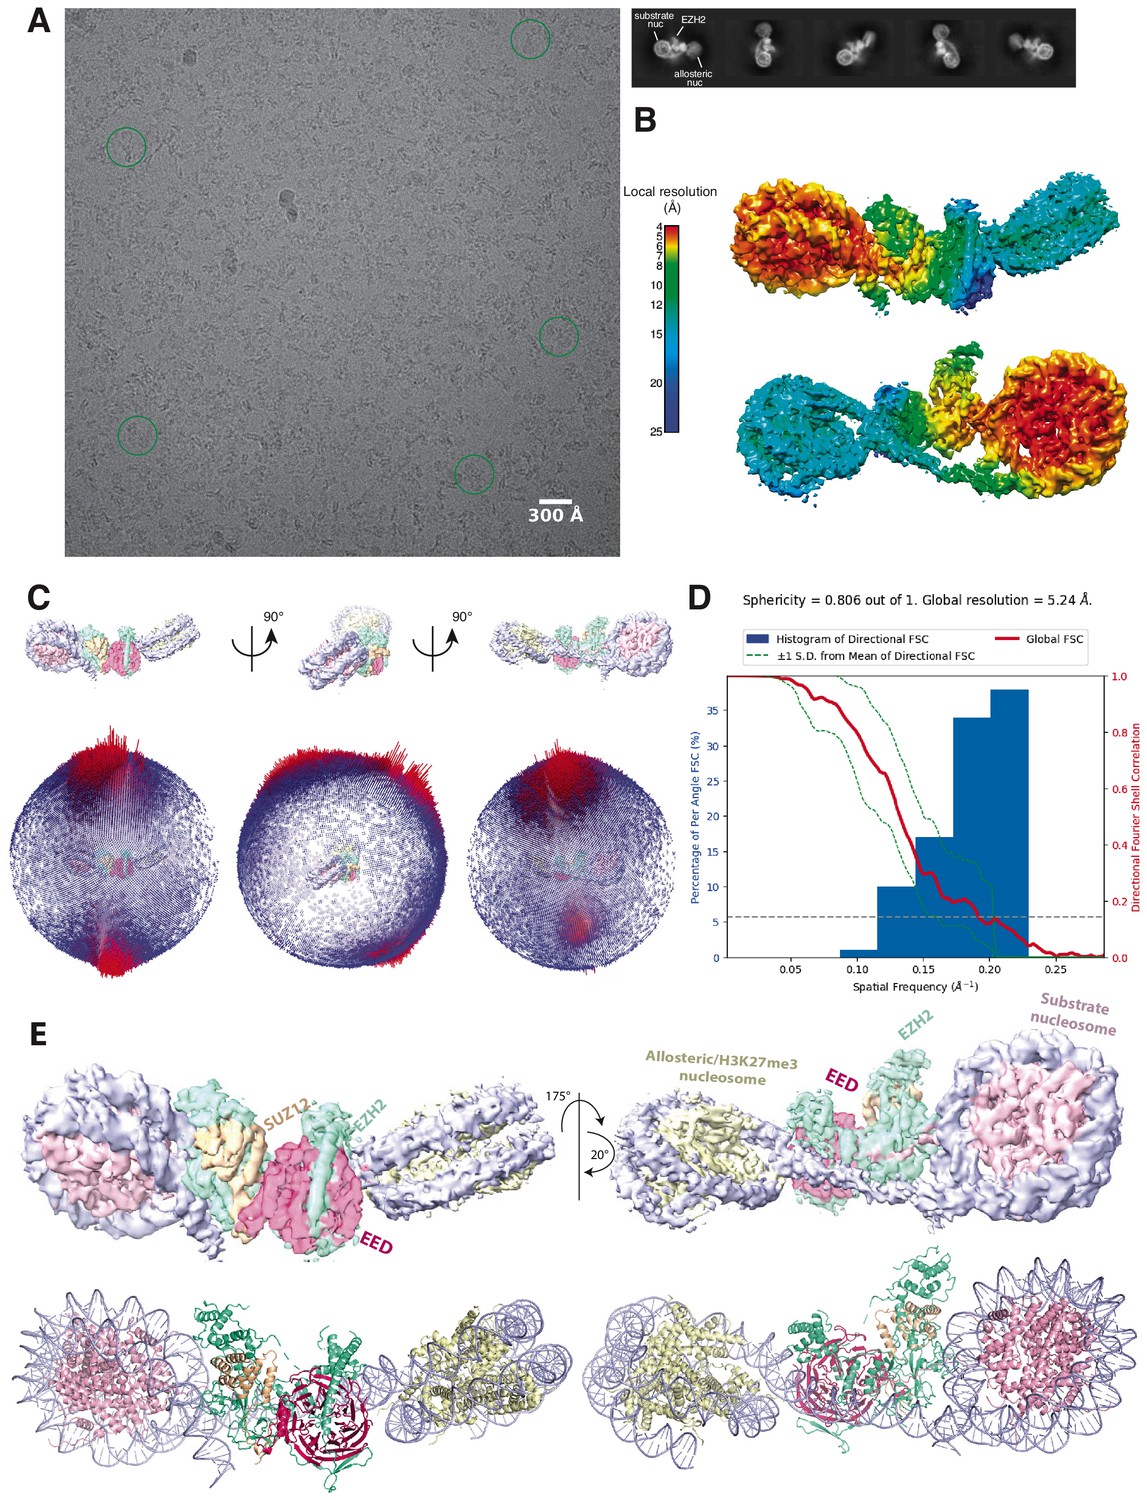
Initial Cryo-EM analysis of the PHF1-PRC2:di-Nuc complex (related to Figure 1).
(A) Representative micrograph of the cryo-EM dataset (left) and reference-free 2D classes from particles picked without templates (right) (performed to ensure that no bias was introduced through templates picking and references in 3D classification). Circles indicate particles, which were picked with templates and directly subjected to 3D analysis (see Figure 1—figure supplement 2). (B) Local resolution estimation of the 5.2 Å overall PHF1-PRC2:di-Nuc map. The substrate nucleosome and the adjacent part of EZH2 are well resolved (colors red to yellow). (C) Spherical angular distribution of particles included in the final reconstruction of PHF1-PRC2:di-Nuc. (D) Output from the 3DFSC Processing Server (https://3dfsc.salk.edu/ Tan et al., 2017) showing the Fourier Shell Correlation (FSC) as a function of spatial frequency, generated from masked independent half maps of PRC2:diNuc: global FSC (red), directional FSC (blue histogram) and deviation from mean (spread, green dotted line). The nominal overall resolution of 5.24 Å was estimated according to the gold standard FSC cutoff of 0.143 (gray dotted line) (Rosenthal and Henderson, 2003). Sphericity is an indication for anisotropy and amounts to 0.806 in this data. The minor directional anisotropy of the data can be explained by the slightly preferred orientation and missing views as seen in (C). (E) Top: Refined and postprocessed cryo-EM density map of overall PHF1-PRC2:di-Nuc colored according to the subunit organization. Bottom: pseudoatomic model of fitted crystal structure of the human PRC2 catalytic lobe (PDB: 5HYN; Justin et al., 2016) and a di-Nuc model with 35 bp linker DNA (Poepsel et al., 2018), including PDB 1AOI (Luger et al., 1997).
Figure 1—figure supplement 2
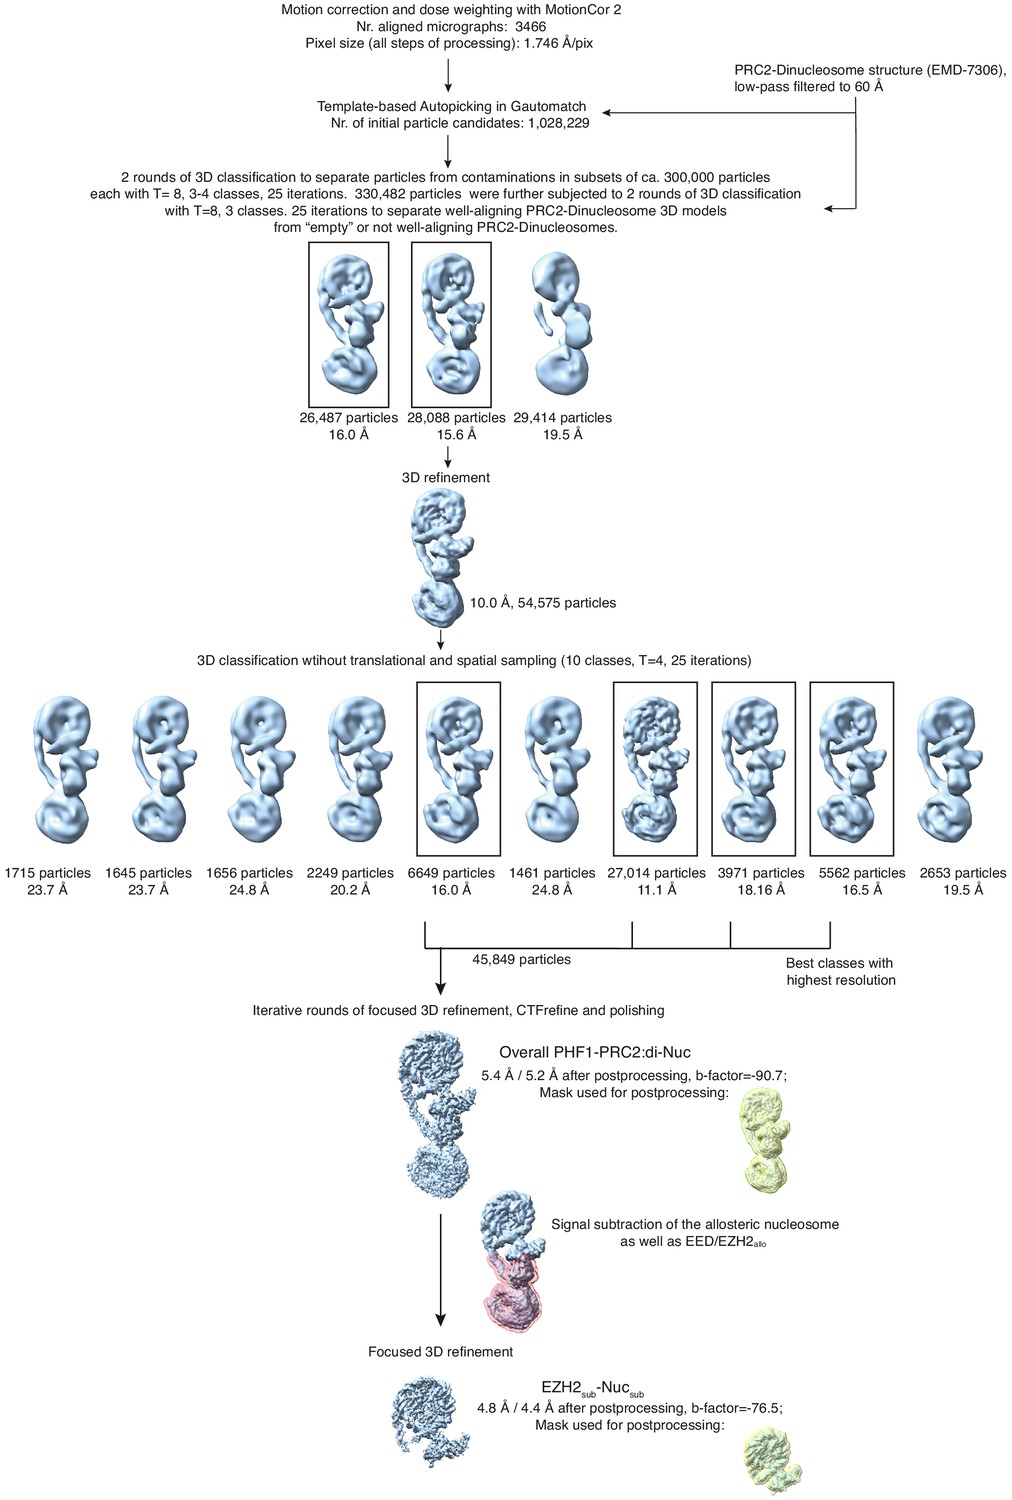
Overview of the cryo-EM Data-Processing and Particle Sorting Scheme (related to Figure 1).
Processing and particle sorting scheme, also described in Methods. Squares indicate 3D classes (and corresponding particles) chosen for further processing steps based on their nominal global resolution values, translational and rotational accuracy and the presence of detailed structural information. Two final reconstructions were obtained in this study: Overall PHF1-PRC2:di-Nuc, and EZH2sub-Nucsub after performing signal subtraction (mask indicated in pink) and focused refinement. Masks used for postprocessing are shown in yellow.
Figure 1—figure supplement 3

Cryo-EM analysis of the focused EZH2sub-Nucsub map (related to Figure 1).
(A) Local resolution estimation of the focused 4.4 Å EZH2sub:Nucsub reconstruction. Regions in the nucleosome core as well as the adjacent regions including parts of the H3 N-terminus close to the exit side of the nucleosome are well resolved (4.0–5.5 Å). Regions close to the mask, especially the nucleosomal DNA and parts of EZH2, are less well resolved (colors green to blue). (B) Global FSC generated from masked independent half maps of EZH2sub-Nucsub (Focused, blue line) and the overall PHF1-PRC2:di-Nuc (Overall, violet line) were plotted against spatial frequency. The resolution of 4.4 Å for EZH2sub-Nucsub map and 5.2 Å for the overall PHF1-PRC2:di-Nuc map were estimated according to the gold standard FSC cutoff of 0.143 (brown dotted line) (Rosenthal and Henderson, 2003) (C) FSC between the atomic model and the masked (applied in Phenix) map of EZH2sub-Nucsub after real-space refinement (Afonine et al., 2018). Green line represents the cut-off at 0.5 (4.6 Å) and blue line represents the cut-off at 0.143 (4.3 Å) (see also Supplementary file 1; Rosenthal and Henderson, 2003; Henderson et al., 2012; Rosenthal and Rubinstein, 2015). (D) Selected regions within EZH2sub-Nucsub showing side-chain density, e.g. K36 (red arrow). A red asterisk indicates the last residue of the H3 tail visible in known crystal structures (usually P38 or H39). The quality of the map around K36 is shown as a separate zoom-out below and in three different views to demonstrate the lack of anisotropy present in the density.
Figure 1—figure supplement 4
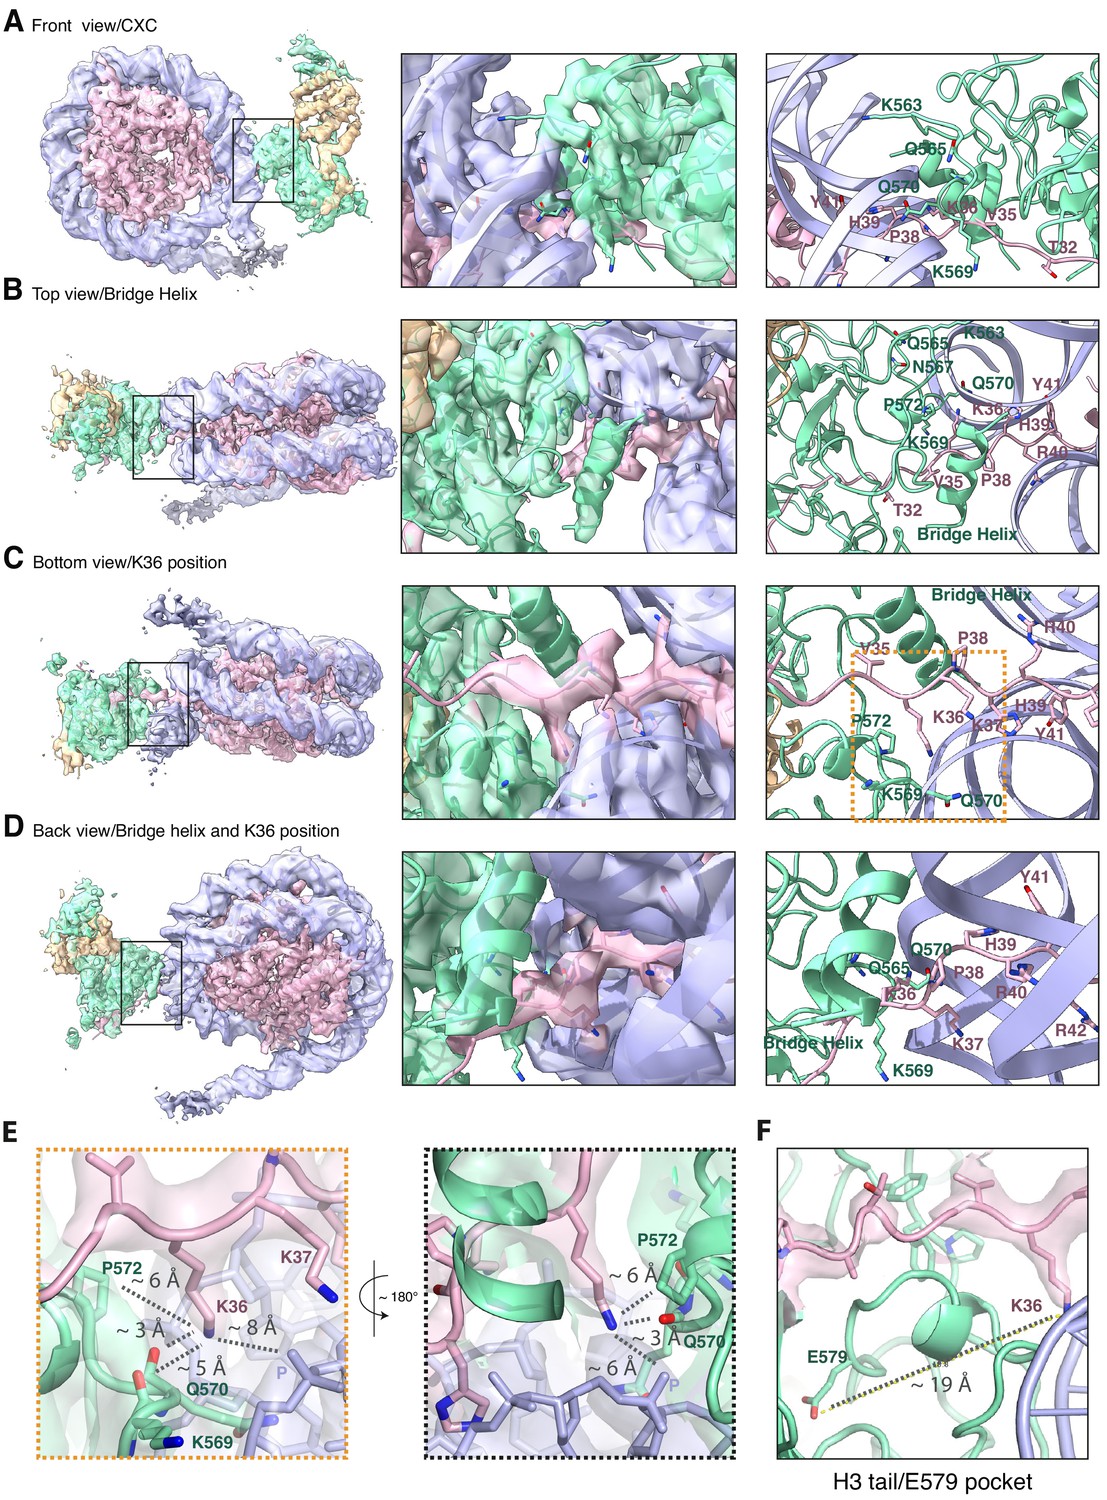
The improved map of the interaction between EZH2 and the substrate nucleosome after focused refinement reveals location of H3K36 and its environment (related to Figure 1).
(A) The front view of EZH2sub-Nucsub cryo-EM density and model shows details of the EZH2CXC interaction with nucleosomal DNA. (B) The top view of EZH2sub-Nucsub cryo-EM shows a tubular density into which based on recent findings of the Nogales lab ( Kasinath et al., 2020 ) an α-helix was built. The "bridge helix" (Kasinath et al., 2020) which based on this study is likely constituted of the EZH2 residues 497–511, is located above V35 of the H3 tail. As can be seen when observing the density-modified map (Terwilliger et al., 2020) of EZH2sub-Nucsub at lower threshold, it presumably engages in interactions with the nucleosomal DNA, the H3 tail and EZH2, as described in greater detail in Kasinath et al., 2020. (C) The bottom view of EZH2sub-Nucsub cryo-EM density and model shows details of the vicinity of K36 with the corresponding density for the H3 tail, EZH2 and nucleosomal DNA. The orange square indicates the region shown as a zoom-in in (E). (D) The back view of EZH2sub-Nucsub cryo-EM density and model shows details of the location of K36 and the "bridge helix" (Kasinath et al., 2020 ). (E) Zoom-in views of H3K36 and its chemical environment. Approximate distances of the epsilon-amino group of H3K36 to the nearest residues are indicated with a dotted gray line. (F) Location of the Glu-579 pocket (Jani et al., 2019) in the EZH2sub:Nucsub reconstruction and its distance to H3K36 (app. 19 Å). The described mechanism by Jani et al., 2019 involving recognition of H3K36 by Glu-579 is incompatible with the presented structural data as the location differs significantly and major rearrangements as the relocation of the helix-loop region between residues 564–576 would be necessary to avoid the given steric and geometric hindrance and allow for potential interaction.
Figure 1—video 1
Cryo-EM structure of the PHF1-PRC2:di-Nuc complex (related to Figure 1).
Movie of the cryo-EM structure of PHF1:PRC2 on a heterodimeric dinucleosome. The rotation of the structure elucidates the recognition of the nucleosomes by the catalytic lobe of PRC2 (Justin et al., 2016). A zoom-in on the H3 tail shows how the tail is thread into the active site of EZH2.
Figure 2 with 1 supplement

The EZH2CXC-DNA interaction interface is critical for H3K27 methylation on nucleosomes.
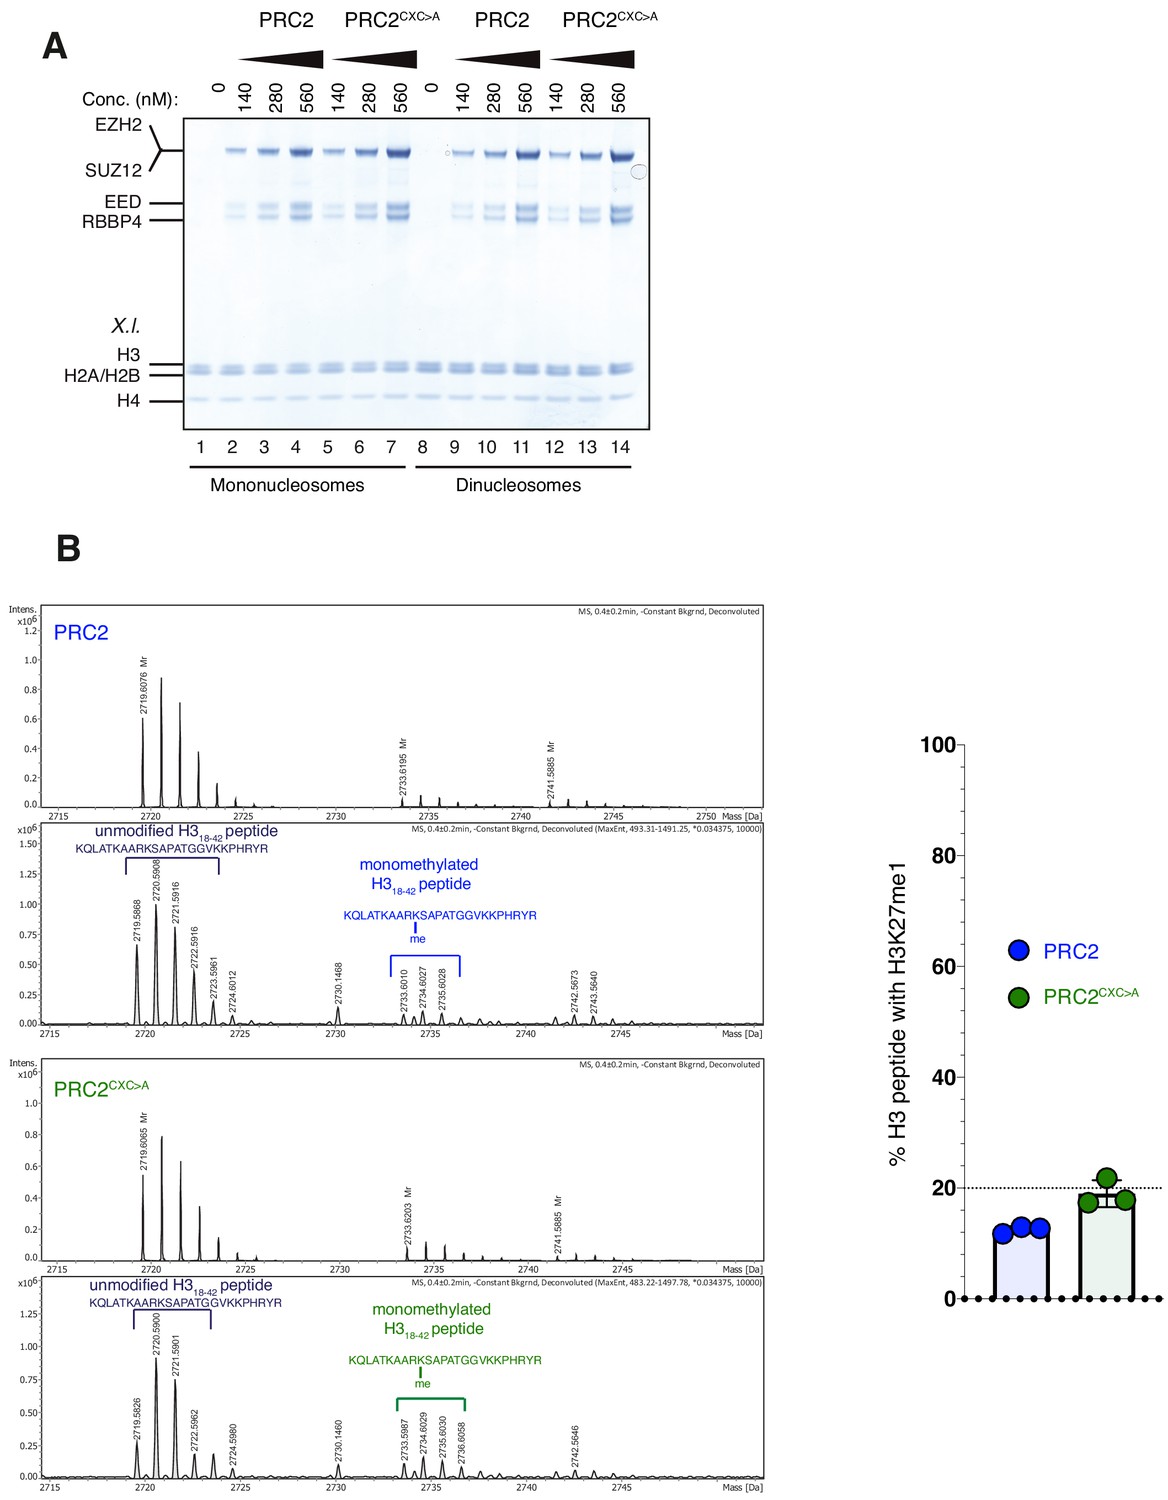
(A) Binding reactions with indicated concentrations of PRC2 (lanes 1–10), PRC2CXC>A (lanes 11–20), PRC2CXC>A/EED>A (lanes 21–30), or PRC2EED>A (lanes 31–40) and 45 nM 6-carboxyfluorescein-labeled mononucleosomes, analyzed by EMSA on 1.2% agarose gels. The EMSA with PRC2EED>A was run on a separate gel. (B) Quantitative analysis of EMSA data in A by densitometry of 6-carboxyfluorescein signals from independent experiments (n = 3); error bars, SEM. (C) Western Blot (WB) analysis of H3K27me1 and H3K27me3 formation in HMTase reactions with indicated concentrations of PRC2 and PRC2CXC>A on 446 nM mononucleosomes (lanes 1–7) or 223 nM dinucleosomes (lanes 8–14). Note that these concentrations result in equal numbers of nucleosomes and therefore equal numbers of H3 substrate molecules in the reactions on mono- and dinucleosomes, as can be seen from the Coomassie-stained gel of the reactions in Figure 2—figure supplement 1B. H4 WB signal served as control for western blot processing.
Figure 2—figure supplement 1
The EZH2CXC-DNA interaction interface is critical for H3K27 methylation on nucleosomes (related to Figure 2).
(A) Coomassie-stained 4–12% SDS-PAGE of the HMTase reactions shown in Figure 2C. Xenopus laevis (X.l.) nucleosomes were used for these experiments. The short 5 kDa PHFC fragment is not visible on this gel. (B) Left: Mass spectrometry-based HMTase assays monitoring H3K27me1 formation by PRC2 (blue; upper two panels) and PRC2CXC>A (green; lower two panels) on H318-42 peptides. Representative full ESI MS Spectra (top part) and deconvoluted spectra (lower part) are shown for the individual runs. For both runs, peaks indicated by the brackets were used for quantification of H3K27me1 formation. Right: Symbols represent percentages of peptides carrying H3K27me1 in technical triplicate experiments; error bars show SD.
Figure 3 with 1 supplement
The unmodified H3K36 side chain in the EZH2CXC-DNA interaction interface is critical for H3K27 methylation on nucleosomes.
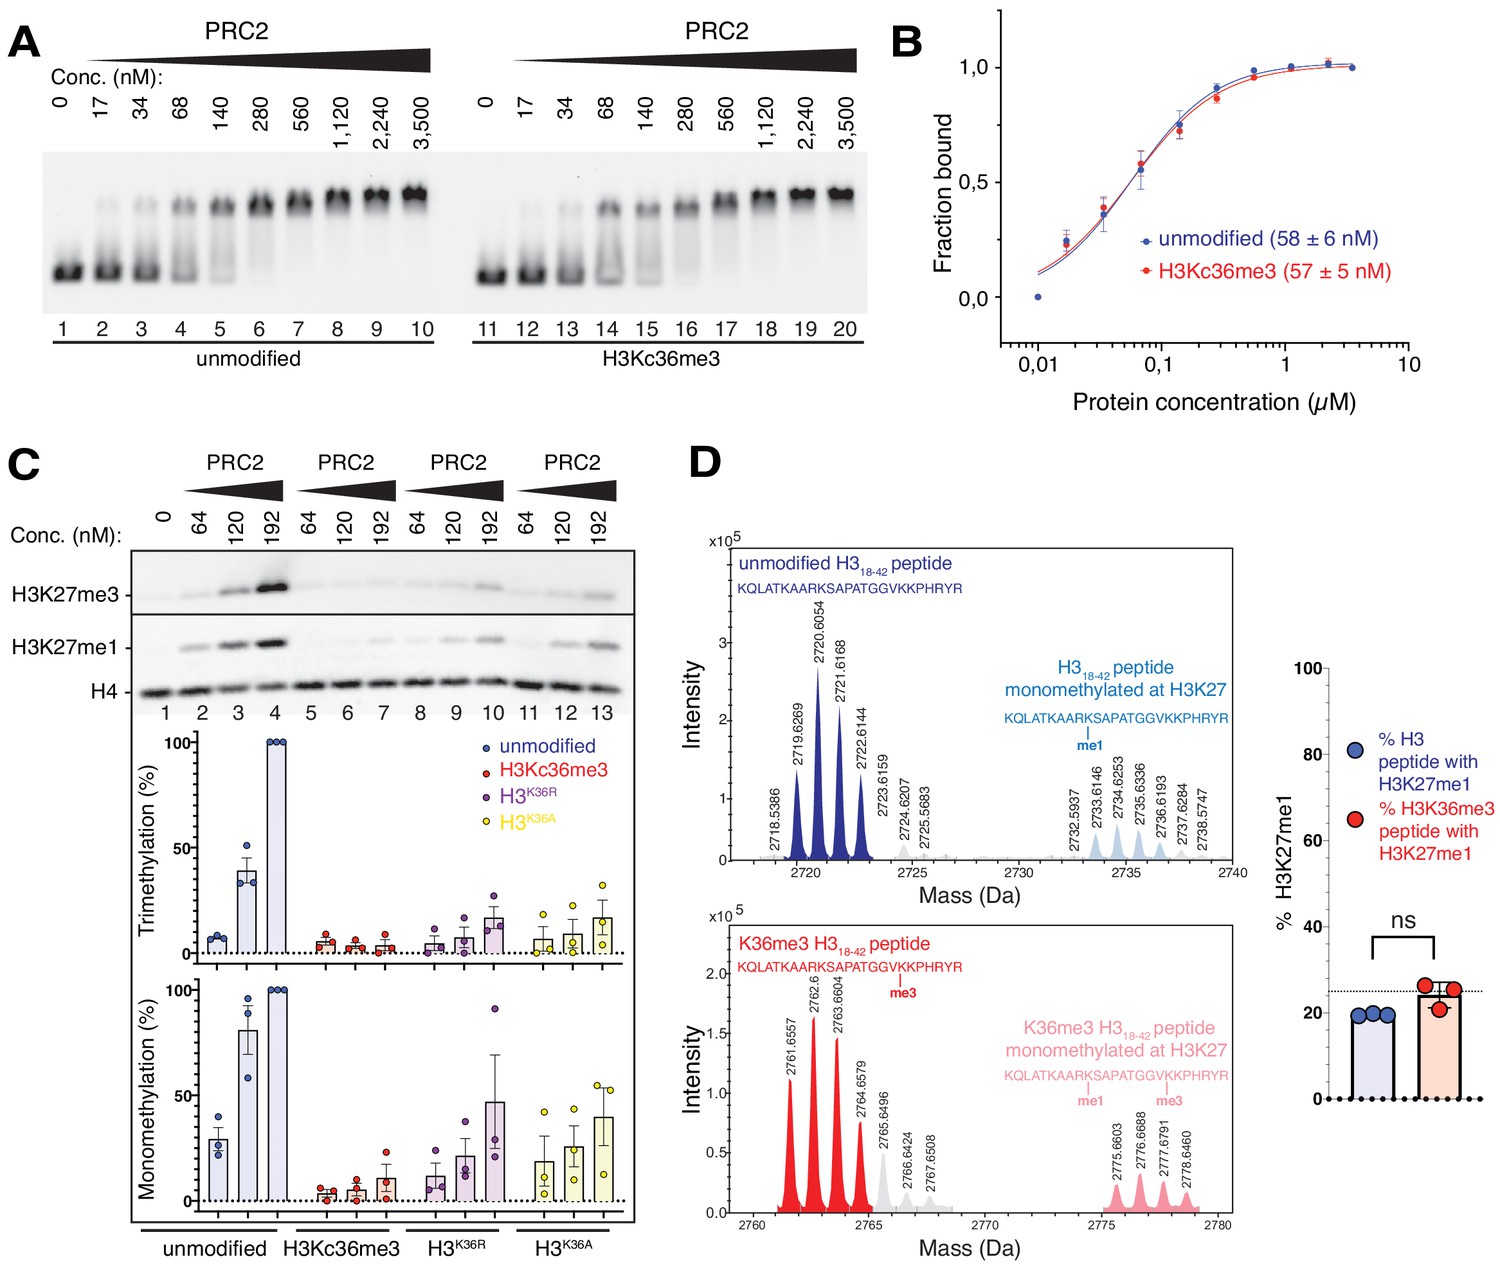
(A, B) EMSA analysis and quantification as in Figure 2A and B, using PRC2 and mononucleosomes that were unmodified (lanes 1–10) or contained a trimethyllysine analog at H3K36 (H3Kc36me3, lanes 11–20) (Simon et al., 2007). (C) Western blot (WB) analysis of HMTase reactions with PRC2 as in Figure 2C on unmodified (lanes 1–4), H3Kc36me3 (lanes 5–7), H3K36R (lanes 8–10) or H3K36A (lanes 11–13) mononucleosomes (446 nM). Coomassie-stained gel of reactions is shown in Figure 3—figure supplement 1A. Bottom: quantification of H3K27me3 and H3K27me1 chemiluminescence signals, respectively, by densiometry analysis from three independent experiments. In each experiment, the methylation signal in lane four was defined as 100% and used to quantify the corresponding H3K27 methylation signals in the other lanes on the same membrane. Circles show individual data points and error bars SEM. (D) HMTase reactions monitoring H3K27me1 formation by PRC2 on H318-42 peptides that were unmodified (top) or contained K36me3 (bottom). Left: Deconvoluted ESI-MS spectra from data shown in Figure 3—figure supplement 1B. On both substrates, areas of the four colored peaks of H3K27me1-modified and unmodified substrate peptides were used for quantification of H3K27me1 formation. Right: Symbols represent percentages of peptides carrying H3K27me1 in technical triplicate experiments, error bars show SD; Welch’s t-test showed no significant (ns) difference between H3K27 monomethylation on the two peptide substrates.
Figure 3—figure supplement 1
Accommodation of unmodified H3K36 in the EZH2CXC-DNA interaction interface is essential for H3K27 methylation on nucleosomes and PHF1-PRC2 (related to Figure 3).
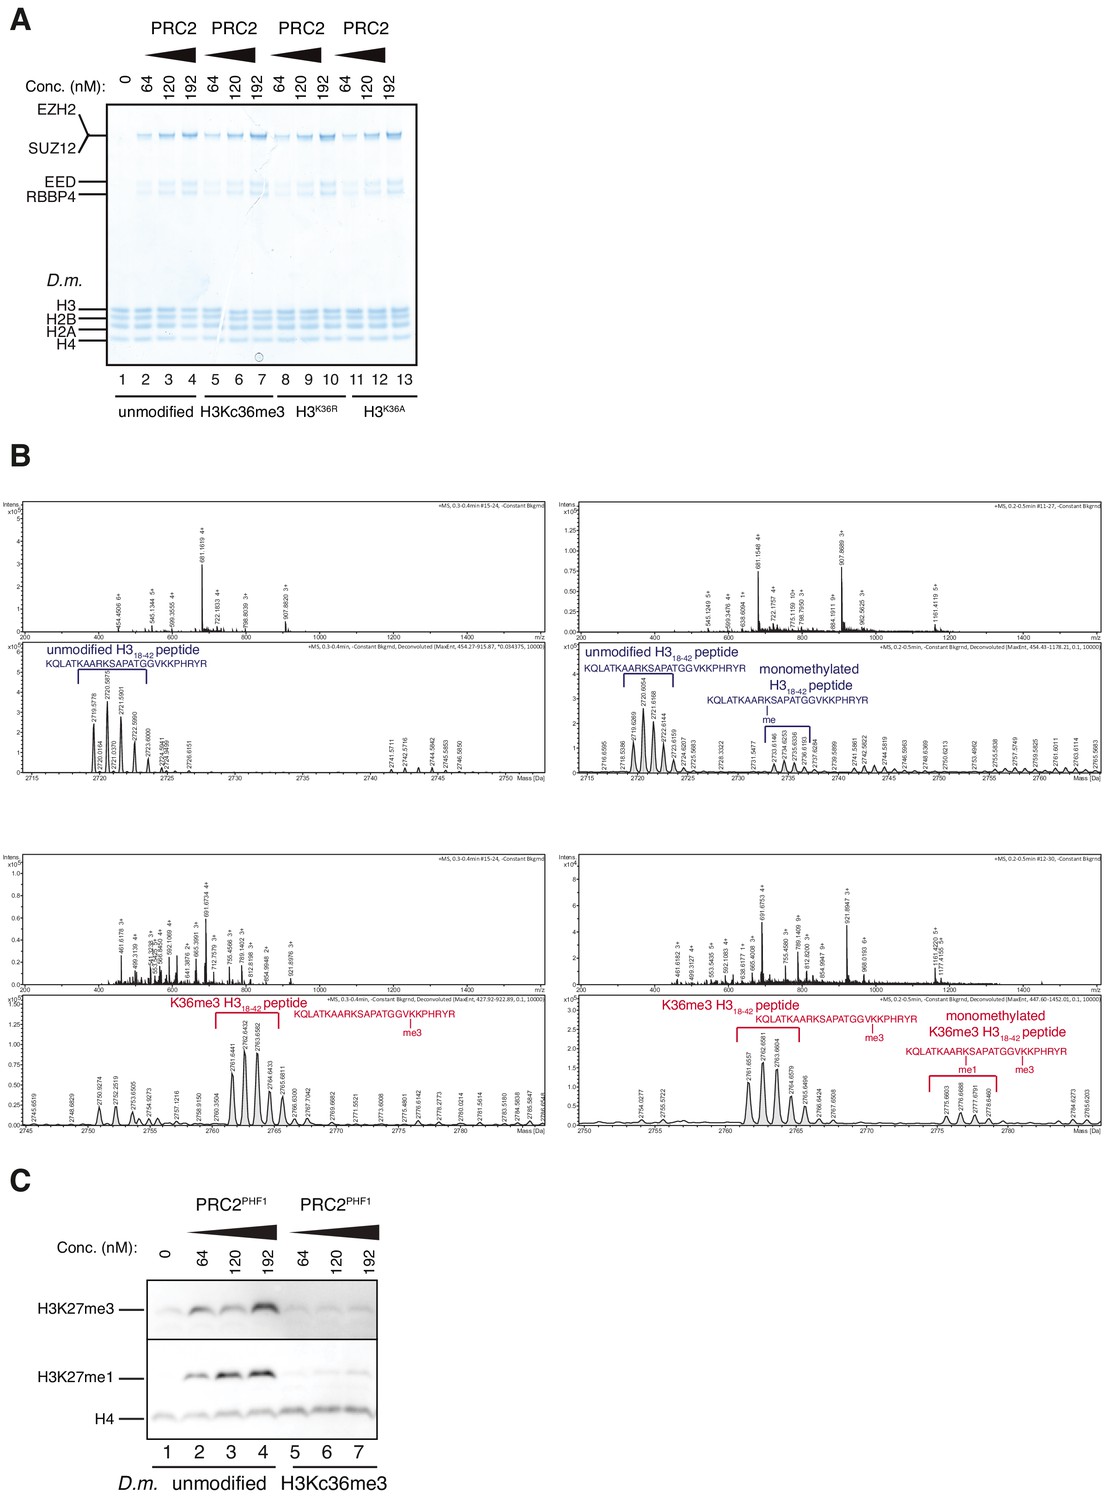
(A) Coomassie-stained 4–12% SDS-PAGE of the HMTase reactions shown in Figure 3C. Drosophila melanogaster (D.m.) nucleosomes were used for these experiments. The short 5 kDa PHFC fragment is not visible on this gel. (B) Full ESI MS spectra (upper part) and full deconvoluted MS spectra (lower part) shown for input peptides without PRC2 as a control (left) and with PRC2 (right) to ensure no overlapping between possible adduct peaks and monomethylation peaks. (C) Western blot (WB) analysis of HMTase reactions with full-length PHF1-PRC2 on unmodified (lanes 1–4) or H3Kc36me3 (lanes 5–7) mononucleosomes (446 nM).
Figure 4

Drosophila with H3K36R or H3K36A mutant chromatin arrest development after completion of embryogenesis.
(A) Ventral views of cuticles from wildtype (wt), H3K36R, or H3K36A mutant embryos. Note that the cuticle pattern of the mutant animals is indistinguishable from that of the wt embryo. Below: for each genotype, the fraction of embryos that developed into larvae, pupae, pharate adults or viable adults is listed. The fraction was determined by monitoring the development of collected hatched 1st instar larvae (wt: n = 300, H3K36R (Matera strain): n = 2000) or unhatched embryos (H3K36R (strain generated in this study): n = 200; H3K36A: n = 200). The GFP marker on the Balancer chromosomes was used for identifying H3K36R and H3K36A mutants. See Materials and methods for further information and discussion. (B) Dorsal views of the posterior portion of the thorax and of the abdomen. From 2000 hatched H3K36R mutant 1st instar larvae, a total of 18 pharate adults was recovered. Most H3K36R mutant pharate adults showed a relatively normal overall body patterning apart from the homeotic transformations illustrated below. (C) Frontal view of adult heads illustrating the antenna-to-leg transformation in H3K36R mutant pharate adults. The antenna-to-leg transformation in H3K36R mutant animals ranged from mild (arrows) to more extensive transformations with formation of leg-like structures such as in this extreme case (arrowheads). (D) The sex comb in males is normally only present on the protoracic (L1) legs (arrowheads). Among the H3K36R mutant pharate adult males recovered (n = 13), five showed one or several extra sex comb teeth (arrow) on the meso- (L2) or meta-thoracic (L3) legs. Extra sex comb teeth in adults are a hallmark phenotype of polycomb mutants.
Figure 5 with 1 supplement
H3K36A and H3K36R mutants show reduced levels of H3K27me3.
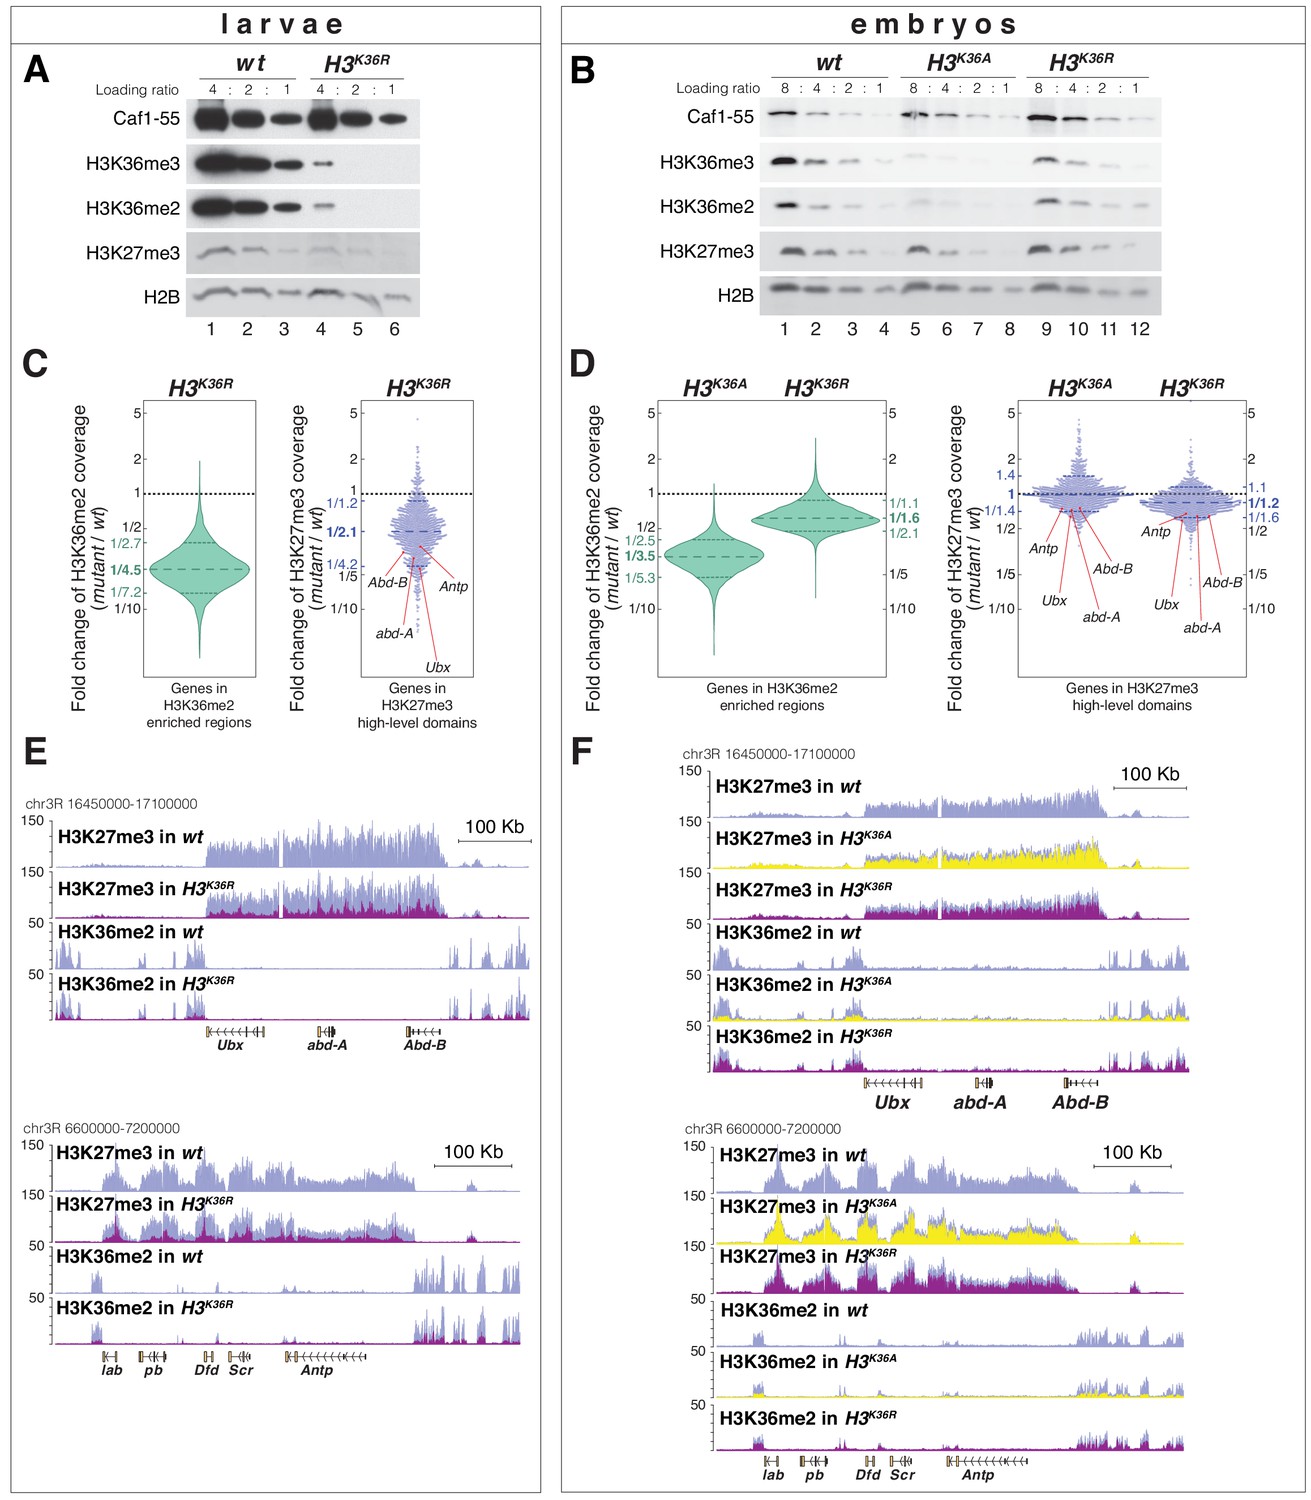
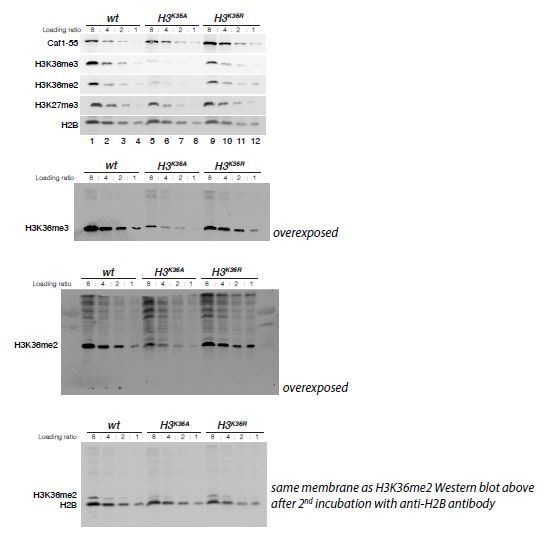
(A) Western blot analysis on serial dilutions (4:2:1) of total cell extracts from wing, haltere and 3rd leg imaginal disc tissues dissected from wildtype (wt, lanes 1–3) and H3K36R mutant (lanes 4–6) third instar larvae. Blots were probed with antibodies against H3K36me3, H3K36me2, or H3K27me3; in each case, probing of the same membranes with antibodies against Caf1-55 and H2B served as controls for loading and western blot processing. Note the reduced levels of H3K36me3 and H3K36me2 but also of H3K27me3 in H3K36R mutants compared to wildtype (wt) (see text). See Materials and Methods for details of all genotypes. (B) Western blot analysis on serial dilutions (8:4:2:1) of total nuclear extracts from 21 to 24 hr old wt (lanes 1–4), H3K36A mutant (lanes 5–8) and H3K36R mutant (lanes 9–12) embryos, probed with antibodies against H3K36me3, H3K36me2 or H3K27me3; and with antibodies against Caf1-55 and H2B as controls. Note that H3K36me3 and H3K36me2 levels are reduced in H3K36A mutants but not in H3K36R mutants where they are comparable to wt. Also note that H3K27me3 levels appear undiminished in either mutant (see text). (C) Left, violin plot showing the fold-change of H3K36me2 coverage in H3K36R mutant larvae relative to wt at genes that in wildtype larval CNS and imaginal disc tissues are decorated with H3K36me2 (see Materials and Methods). The dashed line marks the median reduction (4.5-fold), the dotted lines indicate the interval comprising 80% of regions. Right, Bee plot showing the fold-change of H3K27me3 coverage in H3K36R mutant larvae relative to wt at genes that in wildtype larval CNS and imaginal disc tissues are associated with high-level H3K27me3 regions (see Materials and Methods). The dashed line marks the median reduction (2.1-fold), the dotted lines indicate the interval comprising 80% of regions. Note that H3K27me3 coverage at the HOX genes abd-A, Abd-B, Ubx and Antp is between 3- and 4-fold reduced. (D) Analysis and representation as in (C) but showing fold-changes in H3K36me2 and H3K27me3 coverage in H3K36A and H3K36R mutant late-stage embryos relative to wt at genes that in wildtype embryos are decorated with H3K36me2 and H3K27me3, respectively. Note that H3K27me3 coverage at the HOX genes abd-A, Abd-B, Ubx and Antp is about 1.5-fold reduced. See also Figure 5—figure supplement 1. (E) H3K27me3 and H3K36me2 ChIP-seq profiles in larval CNS and imaginal disc tissues from wt (blue) and H3K36R mutant (purple) third instar larvae; in the tracks showing the profiles in the H3K36R mutant, the wt profile is superimposed as reference (see Supplementary file 2 and Materials and Methods for information about normalization). Top: genomic interval containing the Bithorax-Complex harboring the HOX genes Ubx, abd-A and Abd-B; bottom: genomic interval containing the Antennapedia-Complex with the HOX genes lab, pb, Dfd, Scr, and Antp. Note the 3- to 4-fold reduction of H3K27me3 levels across the Bithorax and Antennapedia loci in H3K36R mutants. Also note that for every HOX gene, the analyzed tissues (CNS, thoracic imaginal discs and eye-antenna discs) represent a mixed population of cells with a fraction of cells in which the gene is inactive, decorated with H3K27me3 and repressed by PcG and fraction of cells in which the gene is transcriptionally active and carrying the H3K36me2 modification. (F) H3K27me3 and H3K36me2 ChIP-seq profiles at the Bithorax and Antennapedia loci as in (E) but from wt (blue), H3K36A mutant (yellow) and H3K36R mutant (purple) late-stage embryos with the wt profile superimposed in the tracks showing the profiles in the H3K36A and H3K36R mutants. H3K27me3 levels across the Bithorax and Antennapedia loci in H3K36A and H3K36R mutants are only about 1.5-fold reduced compared to wt.
Figure 5—figure supplement 1

H3K36R and H3K36A mutants show altered H3K36me2 and H3K27me3 profiles (related to Figure 5).
(A) Top, scatter plots showing H3K36me2 coverage in relation to H3K27me3 coverage in wt larvae. Green dots represent 9200 gene bodies overlapping with genomic intervals showing H3K36me2 enrichment, blue dots represent 1030 gene bodies overlapping with genomic intervals defined as high-level H3K27me3 domains (Bonnet et al., 2019), and gray dots represent 6300 gene bodies showing no enrichment for either methylation mark in larvae (see Materials and Methods). Bottom, scatter plot showing the H3K36me2 read coverage in relation to H3K27me3 read coverage in H3K36R mutant larvae. (B) As in (A) but showing H3K36me2 coverage in relation to H3K27me3 coverage in wt embryos (top), in H3K36A mutant embryos (middle) and in H3K36R mutant embryos (bottom). Green dots represent 10800 gene bodies overlapping with genomic intervals showing H3K36me2 enrichment, blue dots represent 1030 gene bodies overlapping with genomic intervals defined as high-level H3K27me3 domains (Bonnet et al., 2019), and gray dots represent 5400 gene bodies showing no enrichment for either methylation mark in embryos (see Materials and methods).
Figure 6 with 1 supplement
Drosophila with H3K36R or H3K36A chromatin show defective Polycomb repression at HOX genes.
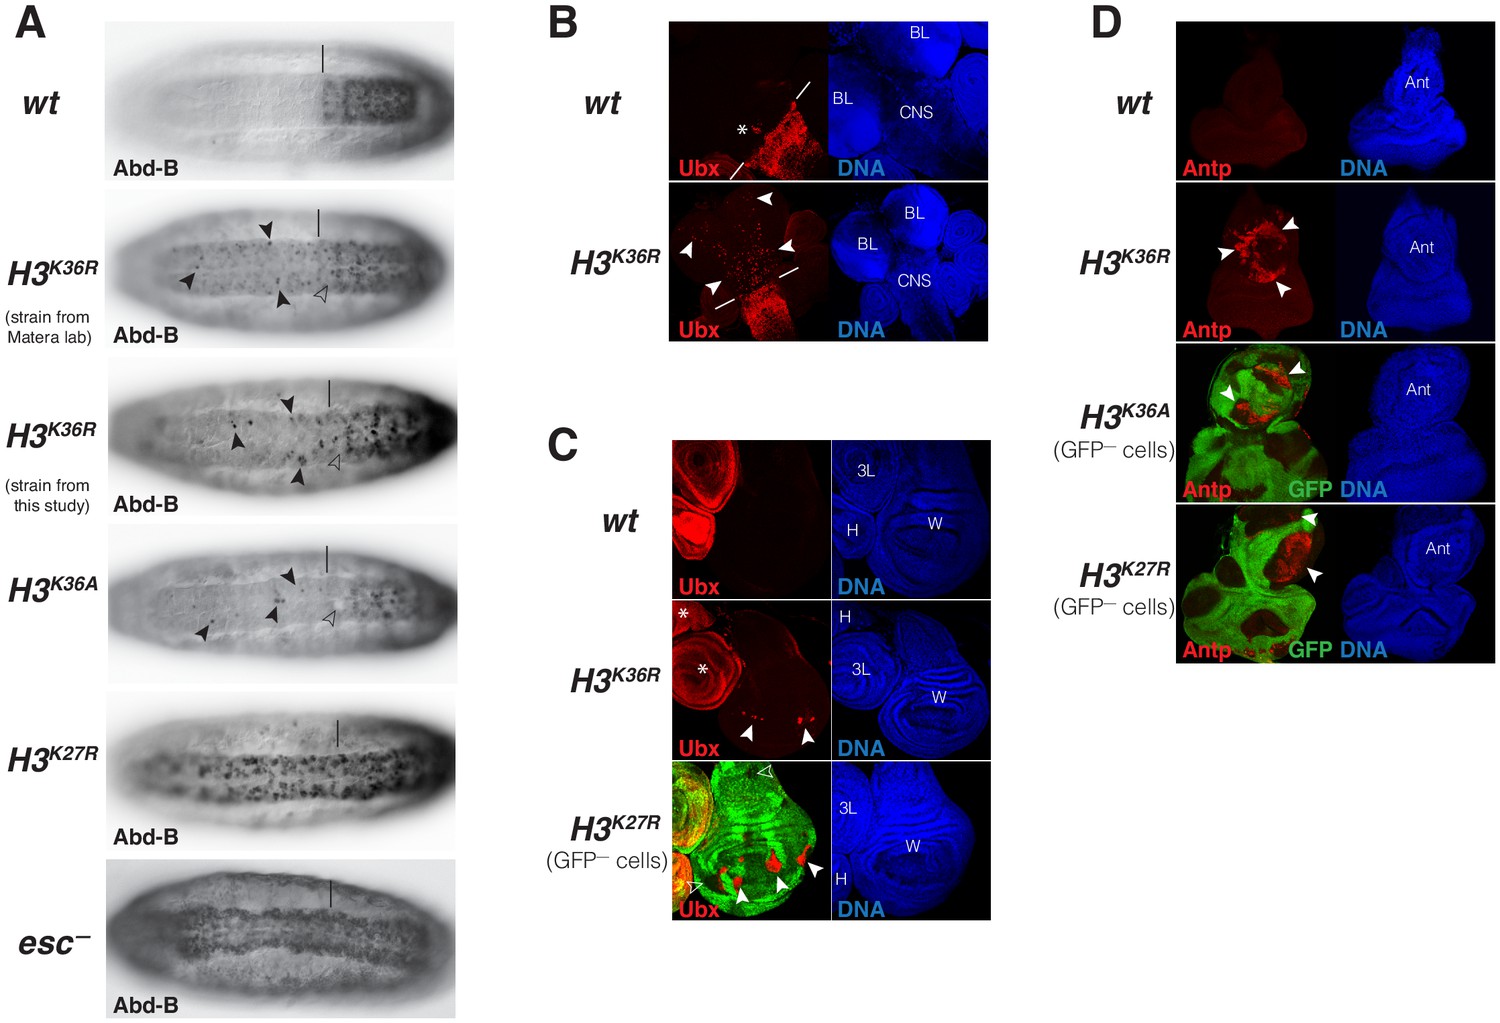
(A) Ventral views of stage 16 wildtype (wt), H3K36A, H3K36R, H3K27R, or esc (esc–) mutant embryos, stained with antibody against Abd-B protein; the esc mutant embryo lacked both maternal and zygotic expression of esc (see Materials and Methods for details of all genotypes). The vertical bar marks the anterior boundary of Abd-B expression in parasegment (ps) 10 in wt embryos. Note the stochastic misexpression of Abd-B protein in single cells or pairs of cells anterior to ps10 in H3K36R and H3K36A mutant embryos (arrowheads). H3K27R and esc mutant embryos show widespread misexpression of Abd-B protein in the head-to-tail pattern characteristic of PcG mutants. For reasons that are not well understood, H3K36A and H3K36R mutants also show partial loss of Abd-B expression in cells in ps10 (empty arrowheads). (B) Larval CNS and brain lobe tissues from wildtype (wt) or H3K36R mutant third instar larvae, stained with antibody against Ubx protein (red) and Hoechst (DNA) to label all nuclei; location of CNS and brain lobes (BL) are indicated in the right panel. The white bars mark the anterior boundary of Ubx expression in ps5 in wt embryos, the asterisk marks the Ubx-expressing cells in the central midline of ps4 that are part of the wild-type Ubx pattern. Note the stochastic misexpression of Ubx protein in many single cells anterior to ps5 in the CNS and in the brain lobes (arrowheads). (C) Imaginal wing (W), haltere (H) and 3rd leg (3L) discs from wildtype (wt) or H3K36R mutant third instar larvae and, as reference, discs from a larvae with clones of H3K27R mutant cells that are marked by the absence of GFP. In all cases, discs were stained with antibody against Ubx protein (red) and Hoechst (DNA) to label all nuclei. In wt animals, Ubx is expressed in the haltere and 3rd leg disc but not in the wing disc where it is repressed by the PcG machinery. Note that in H3K36R mutants, Ubx is misexpressed in small clusters of cells in the wing blade primordium of the wing disc (arrowheads) but remains repressed in the rest of the wing disc. Such misexpression was detected in 50% of wing discs (n = 28). As reference, a wing discs with H3K27R mutant clones is shown, where all cells in the clones in the wing blade primordium (arrowheads) show misexpression of Ubx whereas cells in the notum and hinge primordium show no misexpression (empty arrowheads) (cf. Pengelly et al., 2013). Also note that in H3K36R mutants (n > 30 mutant animals analyzed), Ubx expression in haltere and leg discs appears unperturbed (asterisks). (D) Eye-antennal imaginal discs from wildtype (wt) or H3K36R mutant larvae and below discs from larvae with clones of H3K36A or H3K27R mutant cells that are marked by the absence of GFP. All animals were stained with antibody against Antp protein (red) and Hoechst (DNA) to label all nuclei. Antp is not expressed in the eye-antennal disc of wt animals. Note that in H3K36R mutant discs, Antp is misexpressed in large clusters of cells (arrowheads) in the antenna primordium (Ant). Note that Antp is also misexpressed in H3K36A or H3K27R mutant cell clones in the antenna primordium (arrowheads) and that in these cases misexpression also only occurs in a subset of the mutant cells and not in all clones.
Figure 6—figure supplement 1

H3K27me3 levels are uniformly reduced in imaginal disc tissues from H3K36R mutant larvae (related to Figure 6).
Imaginal wing discs from wildtype (wt) or H3K36R mutant third instar larvae and, as reference, from a larva with clones of H3K27R mutant cells that are marked by the absence of GFP. In all cases discs were stained with antibody against H3K27me3 (red), and with Hoechst (DNA) to label all nuclei. The discs from wt larvae, marked by GFP in all nuclei, and H3K36R mutant larvae, marked by the absence of GFP signal, come from preparations where larvae of the two genotypes were formaldehyde-fixed and antibody-labeled in the same vial, mounted on the same slide and photographed by confocal microscopy with identical exposure settings. Note that the H3K27me3 immunofluorescence signal appears uniformly reduced across the tissue. These are a single confocal section across a disc and not all nuclei are in exactly the same focal plane, accounting for some differences in signal intensity across the images. The wing disc with clones of H3K27R mutant cells, marked by the absence of GFP, is shown as reference for the specificity of the H3K27me3 antibody signal.
Author response image 1
Tables
Key resources table
| Reagent type (species) or resource | Designation | Source or reference | Identifiers | Additional information |
|---|---|---|---|---|
| Strain, strain background D. melanogaster | Oregon-R | Flybase | ||
| Strain, strain background D. melanogaster | w; Df(2L)HisC FRT40A/Df(2L)HisCFRT40A; 12xHisGUwt/12 xHisGUwt | McKay et al., 2015 | ||
| Strain, strain background D. melanogaster | w; Df(2L)HisC FRT40A/CyO ubi-GFP; 12xHisGUH3K36R/TM6B | McKay et al., 2015 | ||
| Strain, strain background D. melanogaster | w; Df(2L)HisC FRT40A/CyO twi:Gal4 UAS:GFP; 3xHisGUH3K36A(VK33) 3xHisGUH3K36A(86Fb)/3xHisGUH3K36A(VK33) 3xHisGUH3K36A(86Fb) | This study | Available on request | |
| Strain, strain background D. melanogaster | w; Df(2L)HisC FRT40A/CyO twi:Gal4 UAS:GFP; 3xHisGUH3K36R(VK33) 3xHisGUH3K36R(86Fb)/3xHisGUH3K36R(VK33) 3xHisGUH3K36R(86Fb) | This study | Available on request | |
| Strain, strain background D. melanogaster | w; Df(2L)HisC FRT40A/CyO ubi:GFP; 3xHisGUH3K27R(68E) 3xHisGUH3K27R (86Fb)/3xHisGUH3K27R (68E) 3xHisGUH3K27R (86Fb) | Pengelly et al., 2013 | ||
| Strain, strain background D. melanogaster | w hs-flp; w; hs-nGFP FRT40A/hs nGFP FRT40; 3xHisGUH3K27R(68E) 3xHisGUH3K27R(86Fb)/3xHisGUH3K27R(68E) 3xHisGUH3K27R (86Fb) | Pengelly et al., 2013 | ||
| Strain, strain background D. melanogaster | w hs-flp; M(2)25A ubi-GFP FRT40A/CyO | Müller lab stocks | Available on request | |
| Strain, strain background D. melanogaster | yw; esc6 b pr/CyO, P[esc+] | Struhl laboratory Struhl, 1981 | ||
| Strain, strain background D. melanogaster | In(2LR) Gla/CyO, esc2 | Struhl laboratory Struhl, 1981 | ||
| Strain, strain background D. melanogaster | w hs-flp; hs-nGFP FRT2A/hs nGFP FRT2A | Beuchle et al., 2001 | ||
| Strain, strain background (Escherichia coli) | BL21(DE3) | Sigma-Aldrich | CMC0016 | Electrocompetent cells |
| Cell line (Trichoplusia ni) | HighFive cell line for expression | Invitrogen | Product nr.: B85502 BTI-Tn-5B1-4 (RRID:CVCL_C190) | Protein expression |
| Cell line (Spodoptera frugiperda) | Sf21 cell line for Baculovirus production | Invitrogen | Product nr.: 1149701 (RRID:CVCL_0518) | Baculovirus production for protein expression |
| Antibody | H3K27me3 Rabbit monoclonal antibody | Cell Signaling Technology | Cell Signaling Technology #9733 | IF (1:50) WB (1:2000) ChIP (1:500) |
| Antibody | H3K27me3 Rabbit polyclonal antibody | Millipore | Millipore #07–449 | WB (1:1000) |
| Antibody | H3K27me1 Rabbit polyclonal antibody | Millipore | Millipore #07–448 | WB (1:6000) |
| Antibody | H3K36me3 Rabbit monoclonal antibody | Cell Signaling Technology | Cell Signaling Technology #4909 | WB (1:750) |
| Antibody | H3K36me2 Rabbit monoclonal antibody | Cell Signaling Technology | Cell Signaling Technology #2901 | WB (1:250) |
| Antibody | H3K36me2 Rabbit monoclonal antibody | Abcam | #9049 | ChIP (1:300) |
| Antibody | H2B Rabbit polyclonal antibody | This study | Raised against full-length recombinant Drosophila H2B | WB (1:10000) Available on request |
| Antibody | H4 Rabbit polyclonal antibody | Abcam | Abcam #10158 | WB (1:200000) |
| Antibody | Caf1 Rabbit polyclonal antibody | Gambetta et al., 2009 | Müller lab | WB (1:10000) |
| Antibody | Abd-B Mouse monoclonal antibody | DHSB | DSHB (1A2E9) | IF (1:300) |
| Antibody | Antp Mouse monoclonal antibody | DHSB | DSHB (8C11) | IF (1: 100) |
| Recombinant DNA reagent | pfC31-attB-3xHisGU.H3K36A | This study | See Materials and Methods Available on request | |
| Recombinant DNA reagent | pfC31-attB-3xHisGU.H3K36R | This study | See Materials and Methods Available on request | |
| Recombinant DNA reagent | nucleosome-positioning sequence 601 (147 bp + linker version) | Lowary and Widom, 1998, Nekrasov et al., 2005 | ||
| Recombinant DNA reagent | pFB-EZH2 | Choi et al., 2017 | N-terminal 6xHis-tag | |
| Recombinant DNA reagent | pFB-EZH2CXC>A | This study | N-terminal 6xHis-tag See Materials and Methods Available on request | |
| Recombinant DNA reagent | pFB-EED | Choi et al., 2017 | N-terminal 6xHis-tag | |
| Recombinant DNA reagent | pFB-EEDEED>A | This study | N-terminal 6xHis-tag See Materials and Methods Available on request | |
| Recombinant DNA reagent | pFB-SUZ12 | Choi et al., 2017 | N-terminal 6xHis-tag | |
| Recombinant DNA reagent | pFB-RBBP4 | Choi et al., 2017 | N-terminal 6xHis-tag | |
| Recombinant DNA reagent | pFB-PHF1 | Choi et al., 2017 | N-terminal twin-strep and 6xHis-tag (SHT) | |
| Recombinant DNA reagent | pFB-PHF1C (PHF1515-567) | Choi et al., 2017 | N-terminal twin-strep and 6xHis-tag (SHT) | |
| Peptide, recombinant protein | H318-42 peptide | MPIB core facilty | ||
| Peptide, recombinant protein | H318-42K36me3 peptide | MPIB core facilty |
Additional files
-
Source code 1
PDB model of PHF1-PRC2:di-Nuc complex (related to Figure 1) with the corresponding description text file.
A pseudoatomic pdb model of the overall PHF1-PRC2:di-Nuc structure. Available crystal structures were fitted into the final map: for PRC2, the crystal structure of the catalytic lobe of human PRC2 (PDB: 5HYN, Justin et al., 2016) was fitted. A model of a dinucleosome with linker DNA (Supplementary dataset one in Poepsel et al., 2018), including crystal structures of nucleosomes, (PDB 3LZ1, Vasudevan et al., 2010 , also PDB 1AOI, Luger et al., 1997, and PDB 6T9L, Wang et al., 2020) was used. We caution the reader that this model did not undergo real-space-refinement. PRC2: Chain A: EZH2 Chain B: EED Chain C: SUZ12 Chain D – Chain K = substrate nucleosome histones Chain D: Histone H3 #1 Chain E: Histone H4 #1 Chain F = Histone H2A #1 Chain G = Histone H2B #1 Chain H: Histone H3 #2 Chain I: Histone H4 #2 Chain J = Histone H2A #2 Chain K = Histone H2B #2 Chain L – Chain S = allosteric nucleosome histones Chain L: Histone H3 #1 Chain M: Histone H4 #1 Chain N = Histone H2A #1 Chain O = Histone H2B #1 Chain P: Histone H3 #2 Chain Q: Histone H4 #2 Chain R = Histone H2A #2 Chain S = Histone H2B #2 Chain T and chain U = nucleosomal DNA Widom601+linker DNA
- https://cdn.elifesciences.org/articles/61964/elife-61964-code1-v3.pdb.zip
-
Supplementary file 1
Cryo-electron microscopy data collection summary, processing statistics and model.
- https://cdn.elifesciences.org/articles/61964/elife-61964-supp1-v3.docx
-
Supplementary file 2
Number of aligned reads to the D. melanogaster and D. pseudoobscura genomes from ChIP and input datasets and normalization process (related to Figure 5 and Figure 5—figure supplement 1).
- https://cdn.elifesciences.org/articles/61964/elife-61964-supp2-v3.xlsx
-
Transparent reporting form
- https://cdn.elifesciences.org/articles/61964/elife-61964-transrepform-v3.docx
Download links
A two-part list of links to download the article, or parts of the article, in various formats.
Downloads (link to download the article as PDF)
Open citations (links to open the citations from this article in various online reference manager services)
Cite this article (links to download the citations from this article in formats compatible with various reference manager tools)
Structural basis for PRC2 decoding of active histone methylation marks H3K36me2/3
eLife 9:e61964.
https://doi.org/10.7554/eLife.61964


