Single-cell multiomic profiling of human lungs reveals cell-type-specific and age-dynamic control of SARS-CoV2 host genes
- Center for Epigenomics & Department of Cellular & Molecular Medicine, University of California, San Diego, United States
- Biomedical Sciences Graduate Program, University of California San Diego, United States
- Department of Pediatrics, University of California-San Diego, United States
- Division of Neonatology, Perinatal and Pulmonary Biology, Cincinnati Children's Hospital Medical Center, United States
- Divisions of Pulmonary Biology and Biomedical Informatics, University of Cincinnati College of Medicine, United States
- Vertex Pharmaceuticals, United States
- Ludwig Institute for Cancer Research, United States
- Laboratory of Genetics, Department of Medical Genetics, University of Wisconsin-Madison, United States
- Department of Pediatrics and Clinical & Translational Science Institute, University of Rochester Medical Center, United States
- Department of Biological Sciences, University of California-San Diego, United States
- NIH, United States
Figures
Figure 1 with 2 supplements
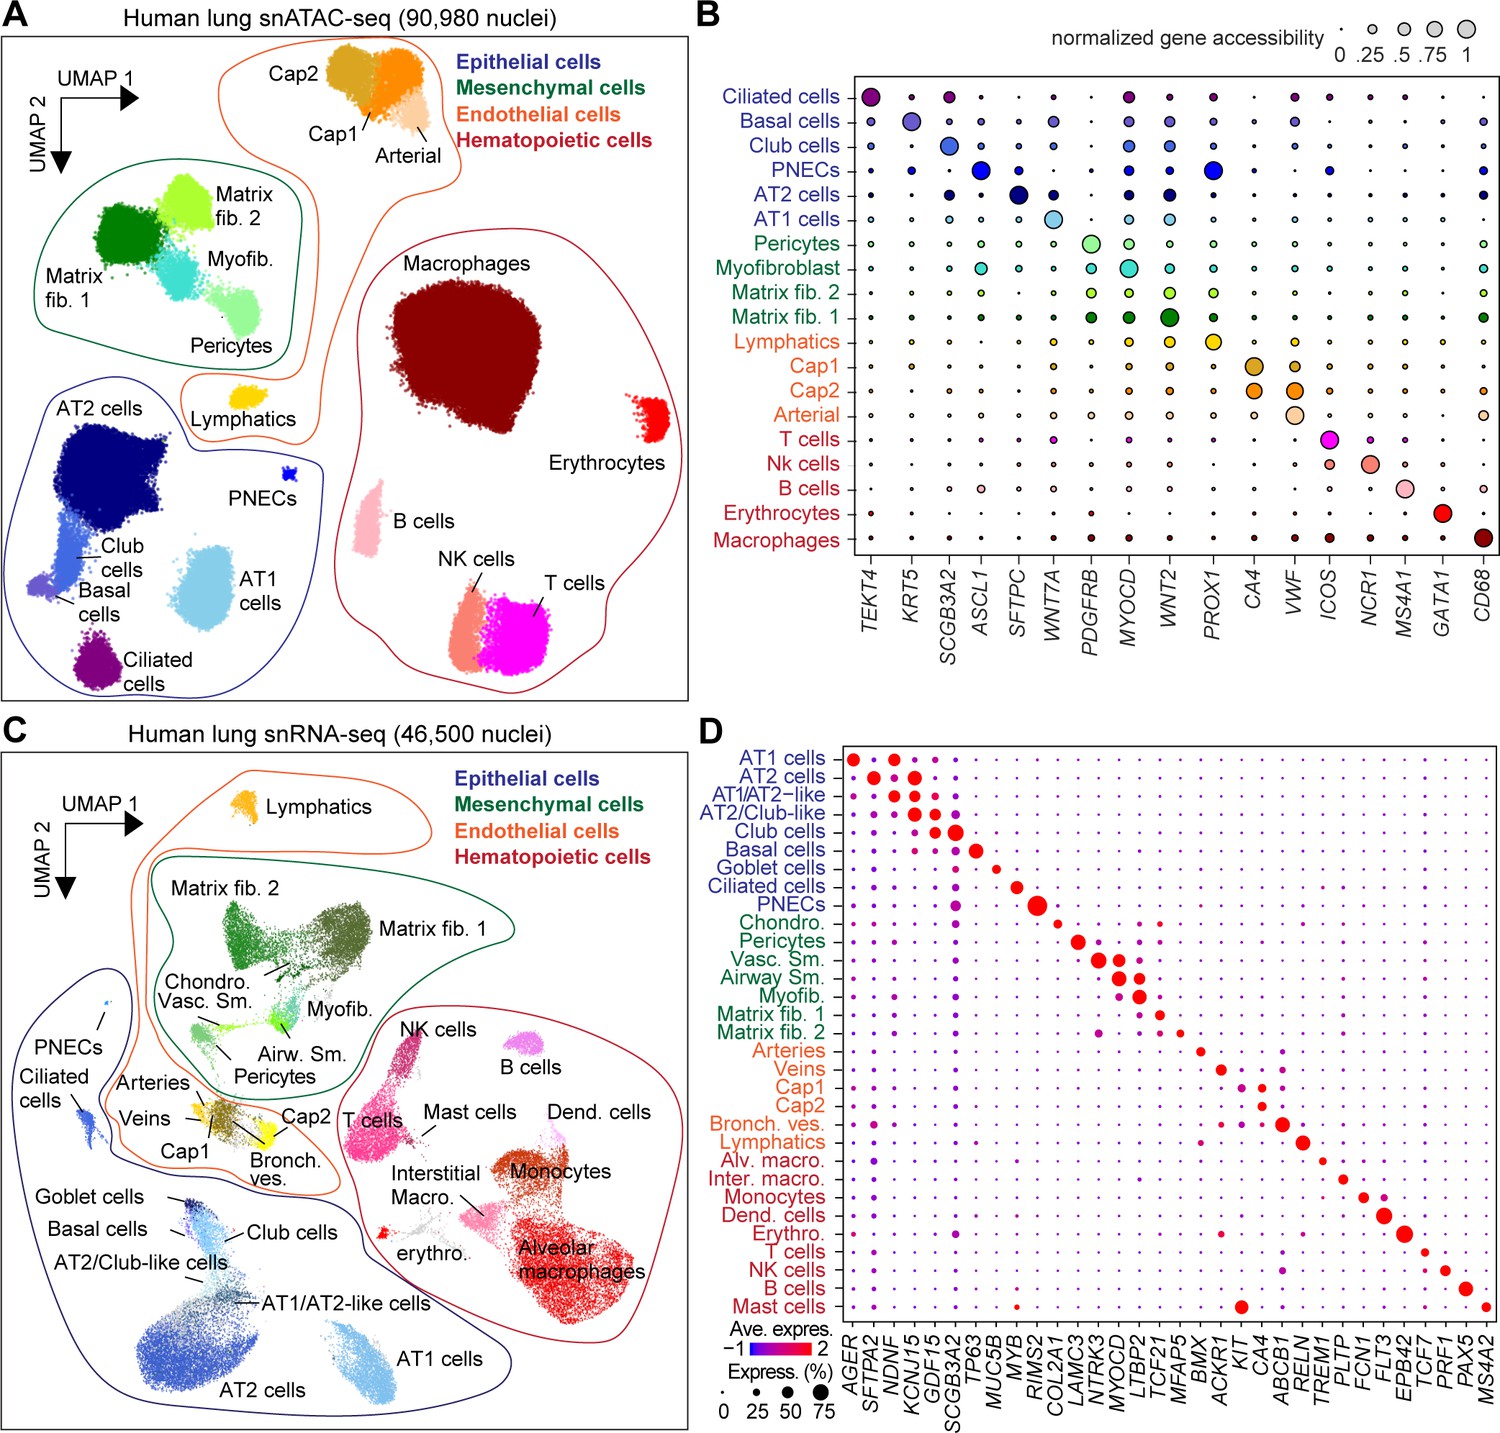
Single-nucleus atlas of chromatin accessibility and transcriptomes in the human lungs.
(A) UMAP (Uniform Manifold Approximation and Projection) embedding (McInnes et al., 2018) and clustering results of snATAC-seq data from 90,980 single-nucleus chromatin profiles from ten donors: premature born (30 weekGA for gestational age, n = 3), 4-month-old (n = 1), three yo (n = 3) and 30 yo (n = 3). For library quality control see Figure 1—figure supplement 1A–D. (B) Dot plot of marker genes from snRNA-seq used for cluster annotation. For additional genes see Figure 1—figure supplement 2A. (C) UMAP embedding (McInnes et al., 2018) and clustering result of 46,500 snRNA-seq data from nine donors: premature born (30 weekGA), three yo, 30 yo, n = 3 per time point, identifies 31 clusters. Each dot represents a nucleus. Spread-out gray dots correspond to nuclei of unclassified cells. For library quality control see Figure 1—figure supplement 1E–H. (D) Dot plot of marker genes from snRNA-seq used for cluster annotation. For additional genes see Figure 1—figure supplement 2B.
Figure 1—figure supplement 1

Quality control of snATAC-seq and snRNA-seq datasets.
(A) Nuclei with less than 1000 uniquely mapped reads were filtered from snATAC-seq datasets. (B) Number of nuclei selected for snATAC-seq libraries after quality control and removing potential doublets. (C) Average number of reads per nucleus. (D) Fraction of reads in peak regions per dataset. (E) Representative UMI barcode distribution output from CellRanger pipeline (10x Genomics) for snRNA-seq libraries from human lungs. (F) Sequencing saturation of snRNA-seq libraries. (G) Number of nuclei selected for snRNA-seq libraries after quality control and removing potential doublets. (H) Genes detected per nucleus. All data are represented as mean ± SD.
Figure 1—figure supplement 2
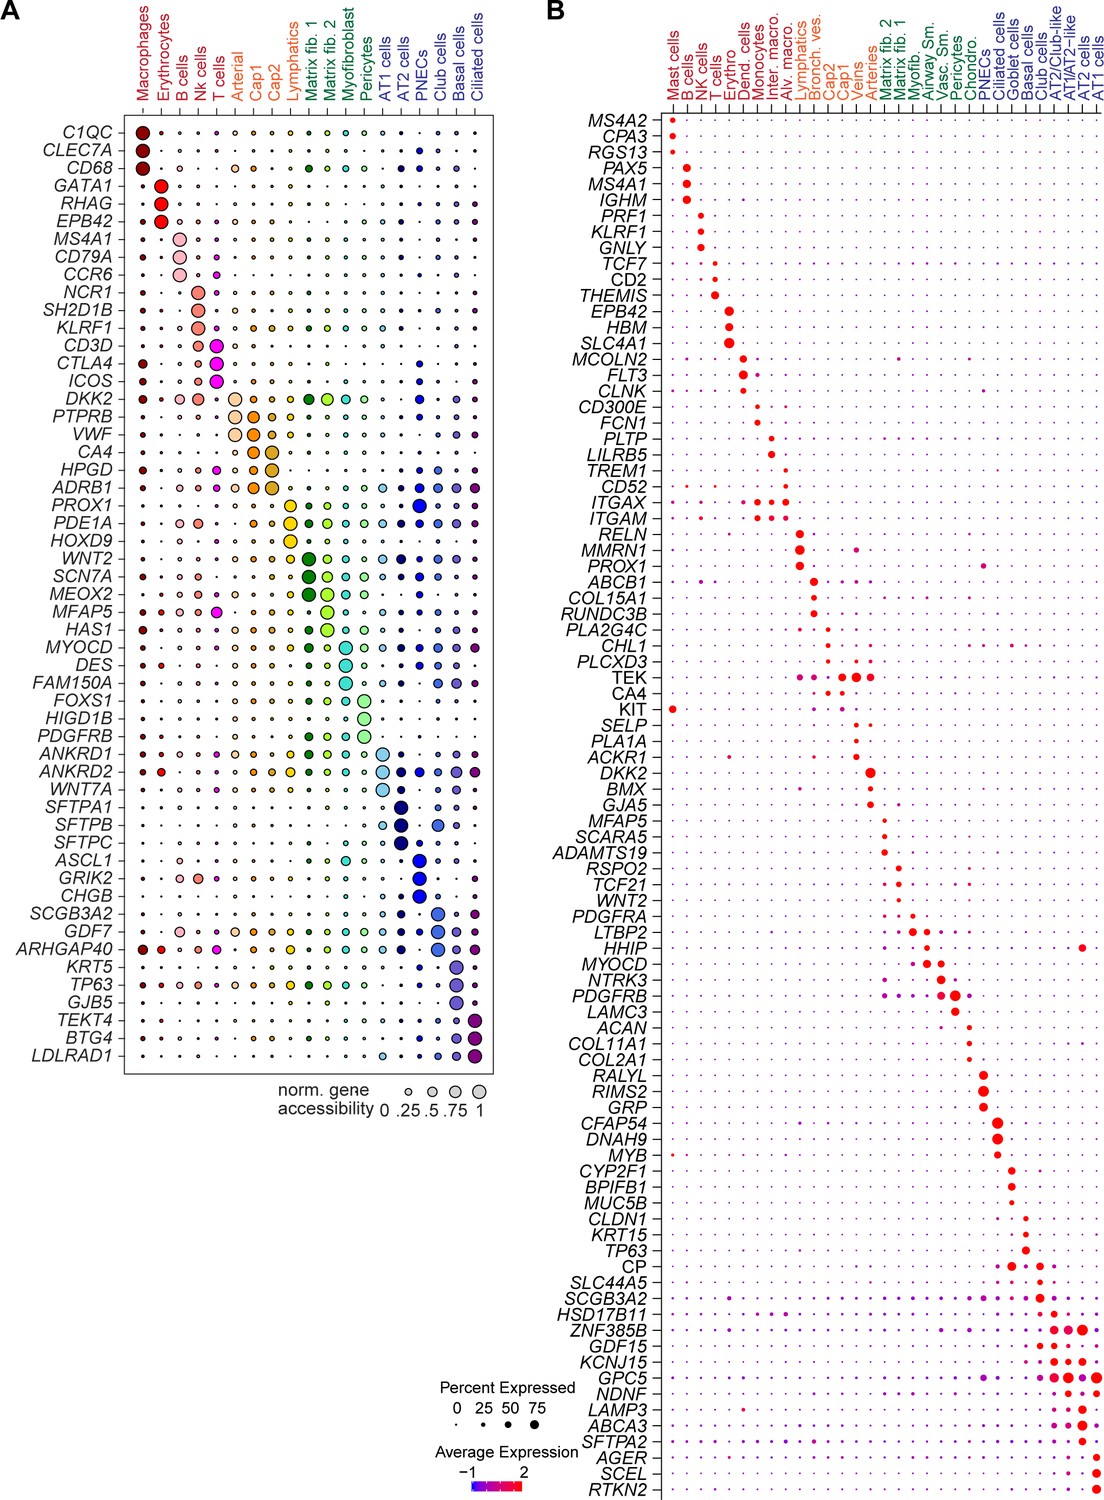
Expression and chromatin accessibility at marker gene loci used for annotation.
Figure 2 with 1 supplement

snATAC-seq analysis of human lungs reveals candidate cis-regulatory elements for ACE2 and TMPRSS2.
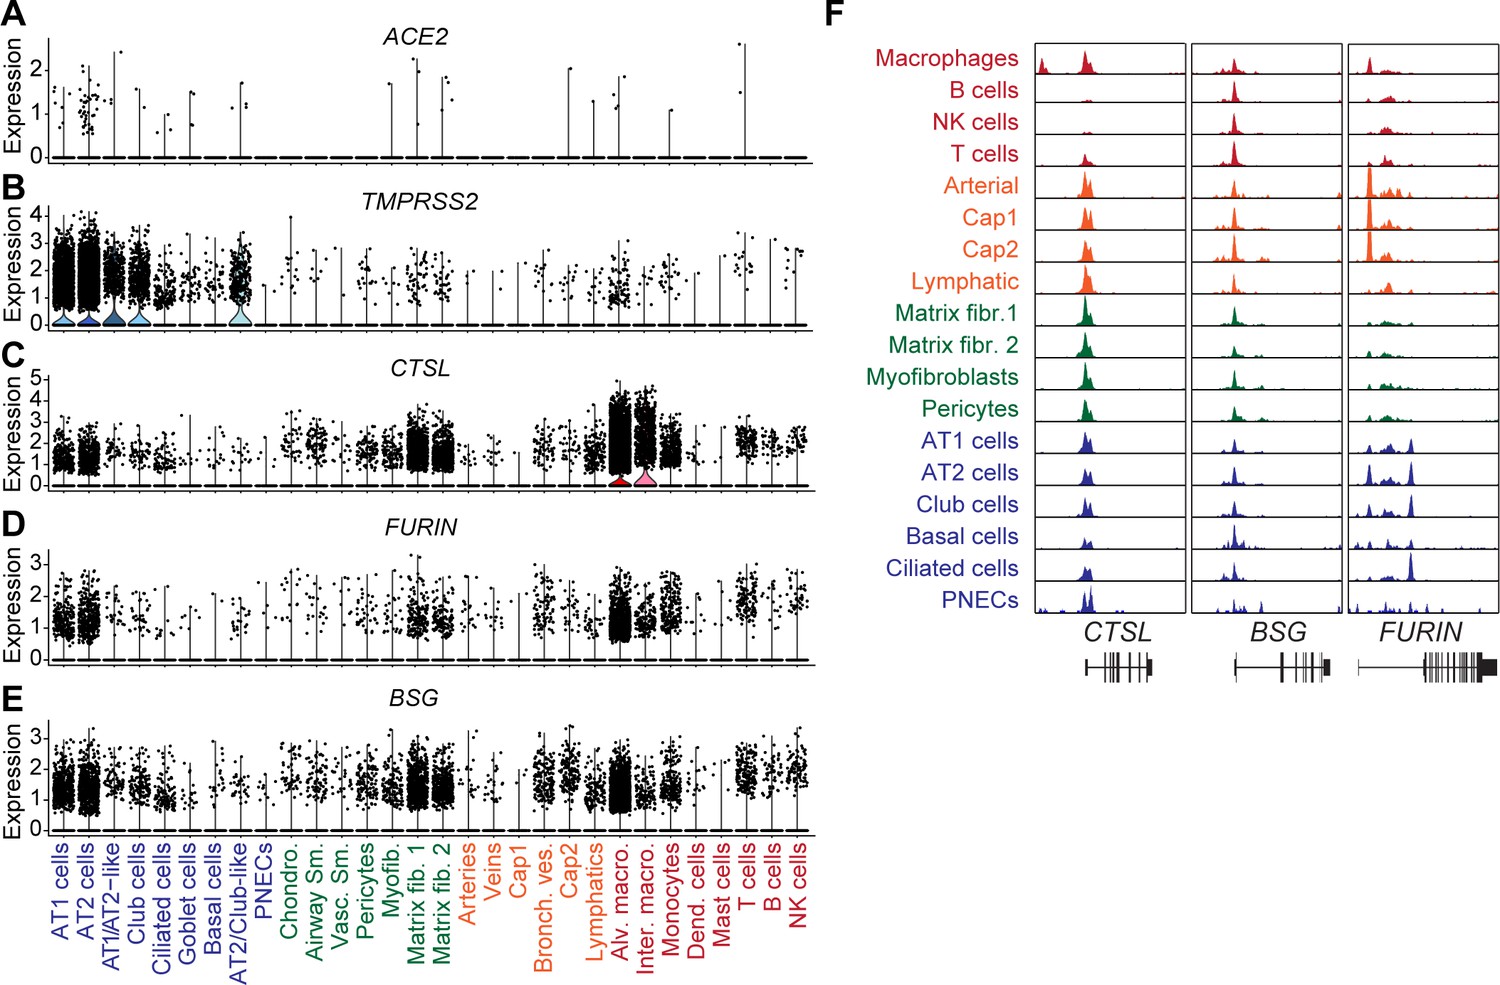
(A) Dot plot illustrating cluster-specific gene expression of candidate SARS-CoV-2 cell entry genes. For violin plots illustrating cluster-specific gene expression please see Figure 2—figure supplement 1A–E. (B) Dot plot illustrating cluster-specific gene body chromatin accessibility of candidate SARS-CoV-2 cell entry genes. (C) Union set of peaks (vertical lines) identified in all clusters surrounding ACE2 and 15 peaks that showed co-accessibility with the ACE2 promoter (red lines, co-accessibility score >0.05) via Cicero (Cusanovich et al., 2018). (D) Zoom into ACE2 locus and genome browser tracks of snATAC-seq signal (Robinson et al., 2011). ACE2 promoter region highlighted by red box. (E) Union set of peaks (vertical lines) identified in all clusters surrounding TMPRSS2 and 73 peaks that showed co-accessibility with the TMPRSS2 promoter (red lines, co-accessibility score >0.05) via Cicero (Cusanovich et al., 2018). (F) Zoom into TMPRSS2 locus and genome browser tracks of snATAC-seq signal (Robinson et al., 2011). TMPRSS2 promoter region highlighted by red box. For genome browser tracks of BSG, FURIN, CTSL please see Figure 2—figure supplement 1F.
Figure 2—figure supplement 1
Gene expression and chromatin accessibility for SARS-COV-2 cell entry genes.
(A-E) Cluster-specific violin plots of gene expression of (A) ACE2, (B) TMPRSS2, (C) CTSL, (D) FURIN and (E) BSG. (F) Genome browser (Robinson et al., 2011) representation of snATAC-seq signal at SARS-COV-2 cell entry gene loci CTSL, BSG, FURIN.
Figure 3 with 1 supplement
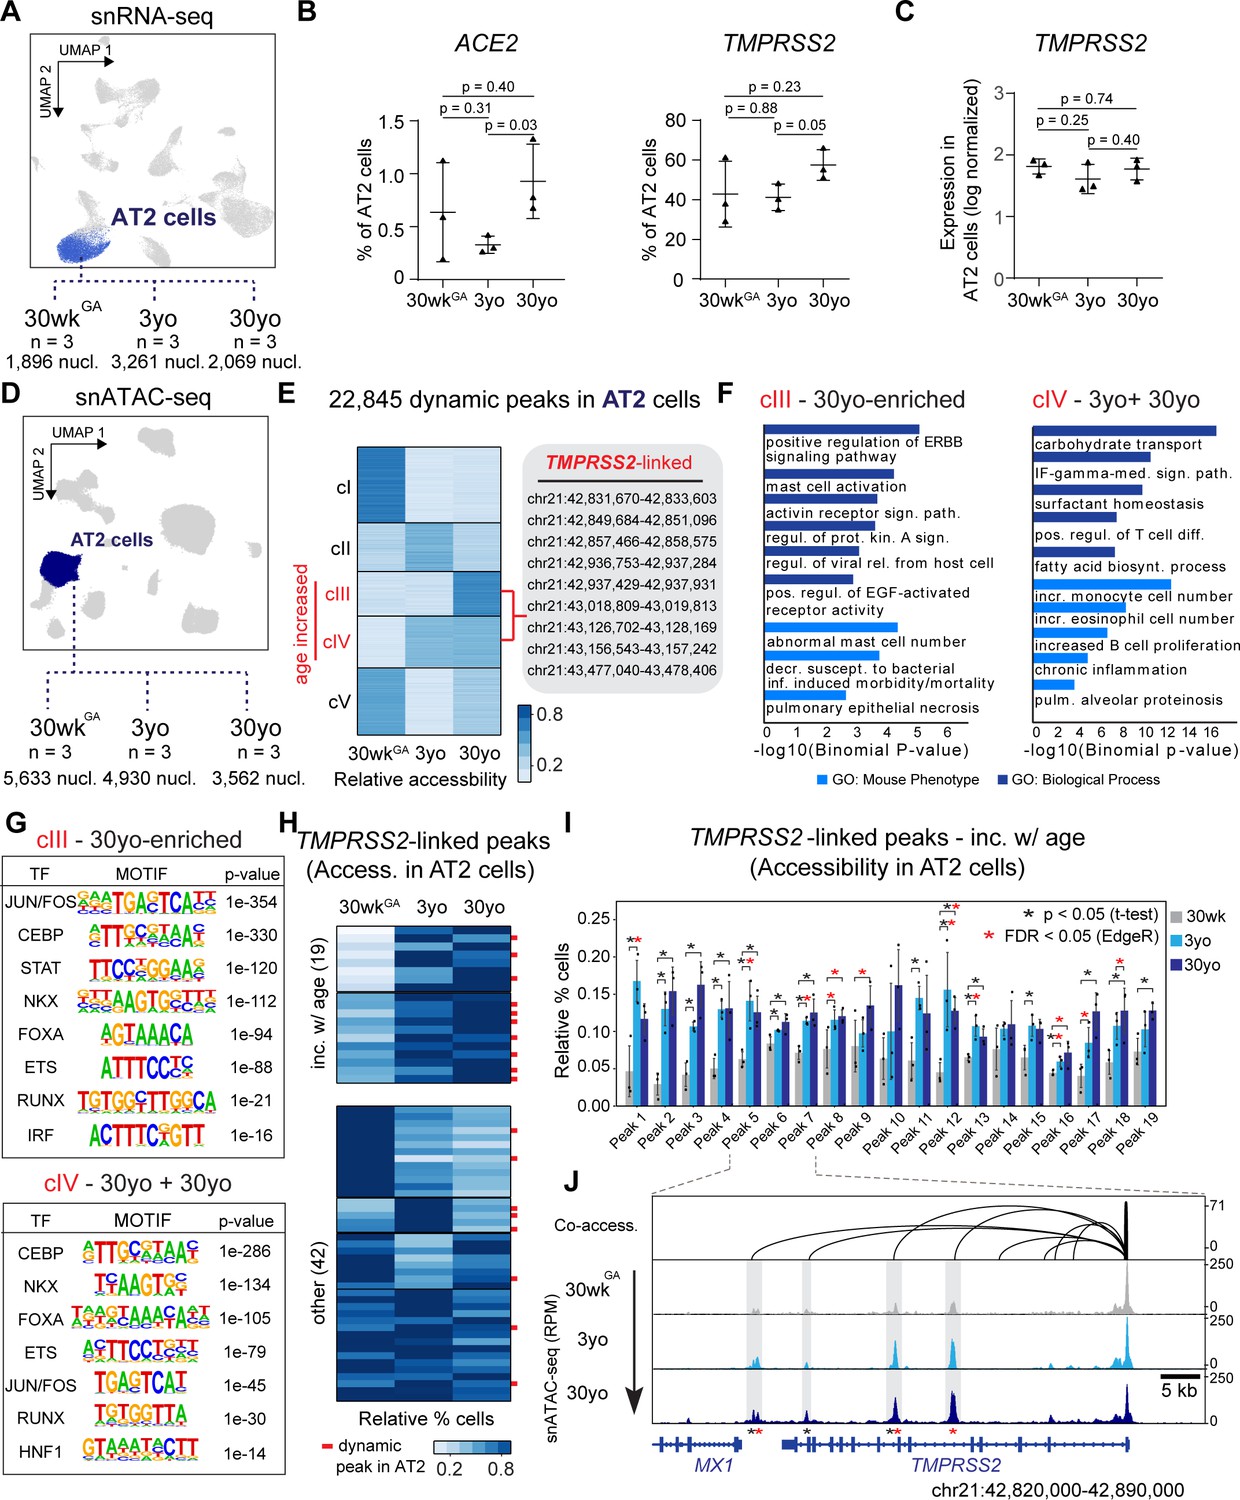
Age-increasing gene expression and accessible chromatin in AT2 cells exhibits signatures of immune regulation and harbors TMPRSS2-linked sites of chromatin accessibility.
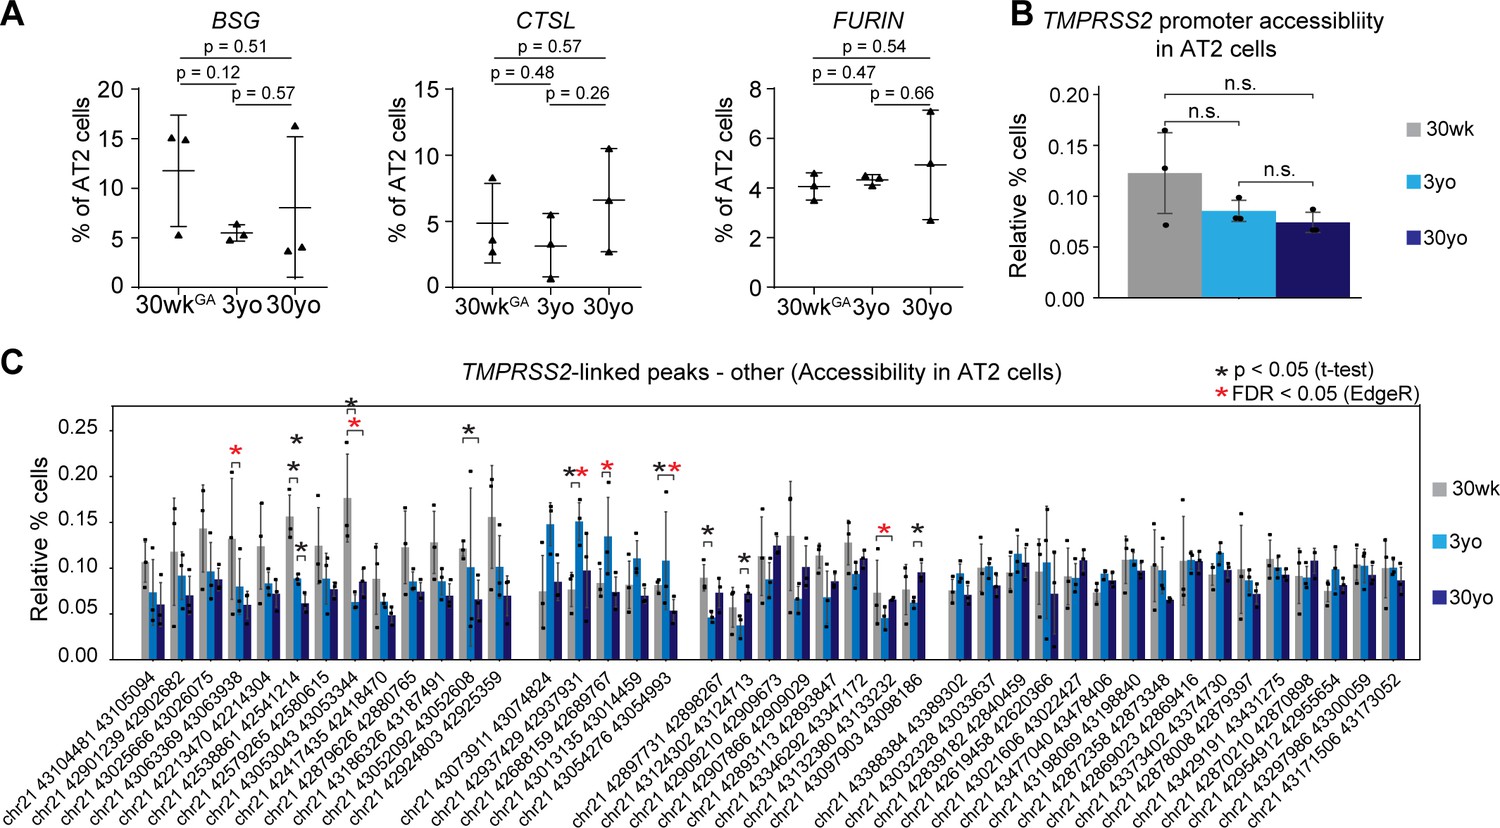
(A) Differential analysis was performed on AT2 cells between three ages with replicates (n = 3 per stage). (B) Fraction of AT2 cells with expression of ACE2 (left) and TMPRSS2 (right) in 30wkGA, 3yo and 30yo human lung samples. All data are represented as mean ± SD. p values derived from unpaired, two-tailed t-tests. For expression data of BSG, CTSL, FURIN please see Figure 3—figure supplement 1A. (C) Log normalized expression of TMPRSS2 in AT2 cells. Displayed are median expression values for AT2 cells in individual samples with at least 1 UMI (unique molecular identifier). (D) Differential analysis was performed on AT2 cells using pairwise comparisons between three ages with replicates (n = 3 per stage). (E) K-means cluster analysis (K = 5) of relative accessibility scores (see Materials and methods) for 22,845 age-dynamic peaks (FDR < 0.05, EdgeR) (Robinson et al., 2010) in AT2 cells. Clusters III and IV show increasing accessibility with age and contain nine TMPRSS2-co-accessible sites. (F) GREAT (McLean et al., 2010) analysis of elements in group cIII (left panel) and cIV (right panel) shows enrichment of immune-related gene ontology terms. (G) Transcription factor motif enrichment analysis of elements in cIII and cIV. (H) K-means cluster analysis (K = 6) of TMPRSS2-co-accessible sites based on the relative percentage of AT2 cells with at least one fragment overlapping each peak. Red bars indicate dynamic peaks identified from pair-wise differential analysis (FDR < 0.05, EdgeR) (Robinson et al., 2010). (I) Locus restricted differential analysis of TMPRSS2-linked peaks with increased accessibility in AT2 with age (top panel in 3H). Data are represented as mean ± SD. Black asterisk, p<0.05 (independent t-test); Red asterisk, FDR < 0.05 (EdgeR) (Robinson et al., 2010) from dynamic peak analysis. For additional sites and promoter accessibility of TMPRSS2 please see Figure 3—figure supplement 1B,C. (J) Genome browser representation of four TMPRSS2-linked peaks across age groups (Robinson et al., 2011).
-
Figure 3—source data 1
Normalized expression values for TMPRSS2 in AT2 cells.
- https://cdn.elifesciences.org/articles/62522/elife-62522-fig3-data1-v2.xlsx
Figure 3—figure supplement 1
Gene expression of additional SARS-COV-2 cell entry genes and chrmatin accessibility of peak linked to TMPRSS2 during aging.
(A) Fraction of AT2 cells with expression of BSG, CTSL and FURIN in 30wkGA,3yo and 30yo human lung samples. All data are represented as mean ± SD. (B) Promoter accessibility of TMPRSS2 in AT2 cells in 30wkGA, 3yo, and 30yo human lung samples. (C) Fraction of cells with accessibility at peaks co-accessible with TMPRSS2, which did not show increase with age. Data are represented as mean ± SD. Red asterisks denote FDR < 0.05 (EdgeR) and black asterisks denote p<0.05 via independent t-test.
Figure 4
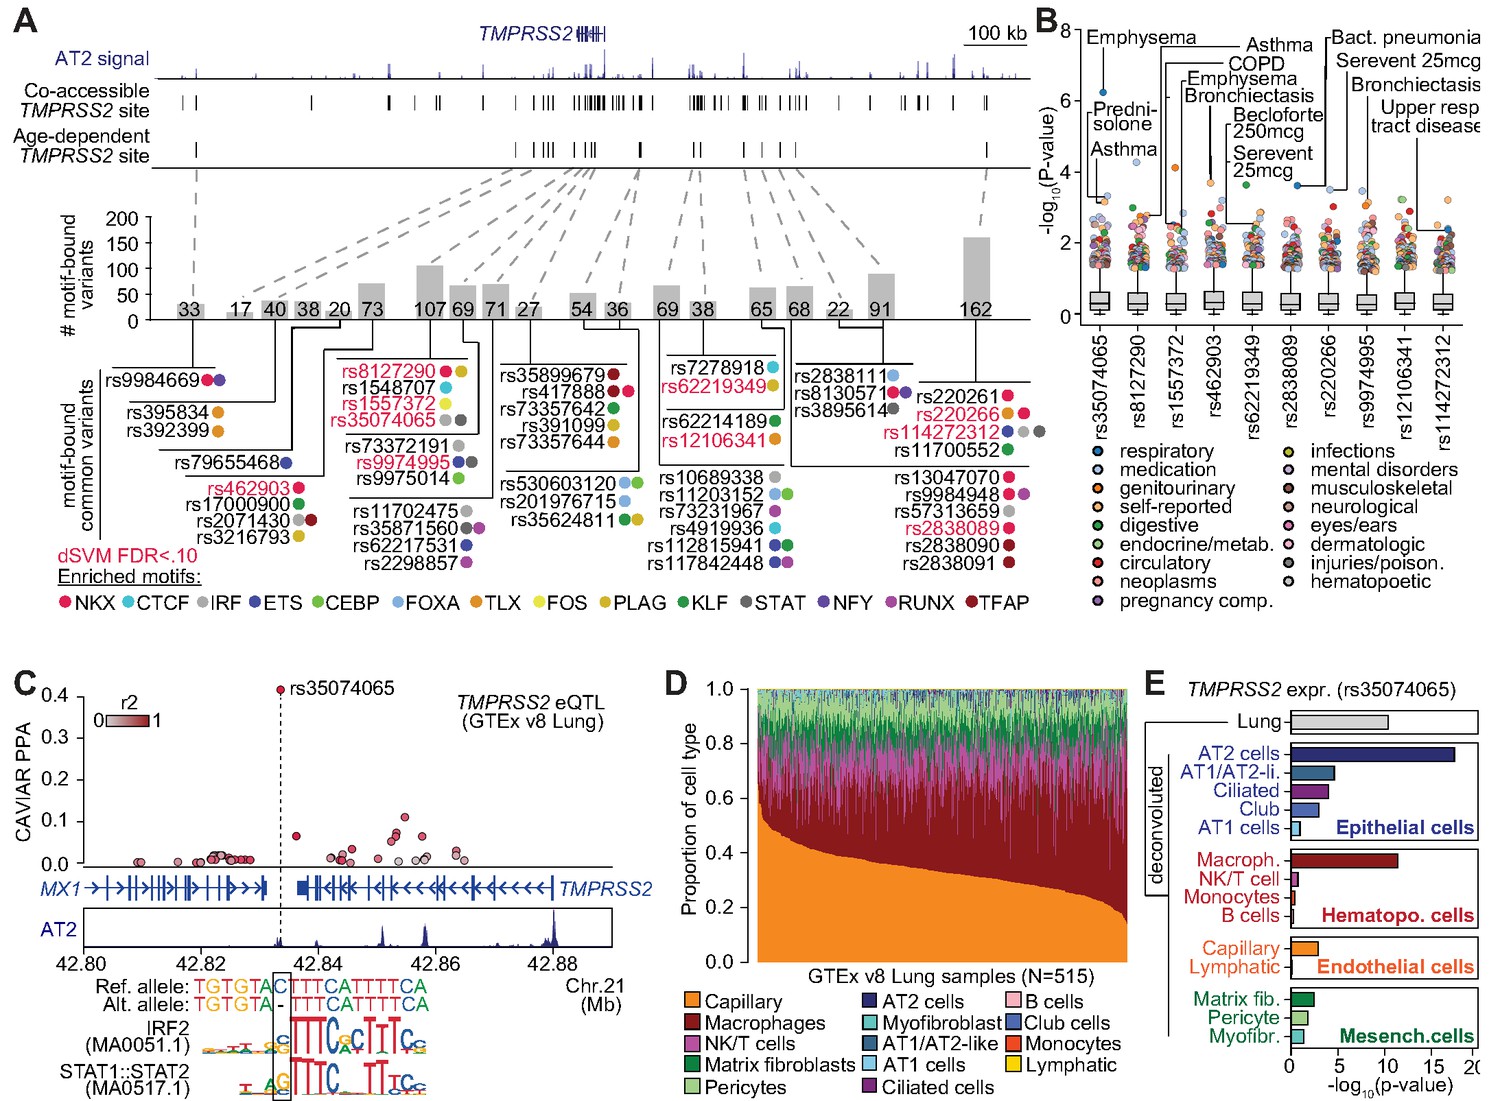
Genetic variants predicted to affect age-increasing AT2 accessible chromatin are associated with respiratory phenotypes and TMPRSS2 expression.
(A) Top: genome browser view of AT2 sites linked to TMPRSS2 activity and those with age-dependent increase in accessibility. Middle: Number of non-singleton genetic variants in gnomAD v3 mapping (Karczewski et al., 2019) in each age-dependent site predicted to disrupt binding of AT2-enriched TF motifs. Bottom: Common variants (minor allele frequency >0.05 in at least one population) predicted to bind AT2-enriched TF motifs, color-coded by TF family. Motif-bound variants that also have predicted effects (FDR < 0.10) on AT2 accessible chromatin in deltaSVM models (Lee et al., 2015) highlighted in red. (B) Association of common variants with predicted AT2 effects (motif-disrupting+deltaSVM) with human phenotypes in the UK Biobank (Lab, 2020). The majority of tested variants show at least nominal evidence (p<0.005) for association with phenotypes related to respiratory disease, infection and/or medication. (C) Fine-mapping probabilities for an TMPRSS2 expression QTL in human lung samples from the GTEx project release v8 (GTEx Consortium, 2020). The variant rs35074065 has the highest casual probability (PPA = 0.42) for the eQTL, maps in an age-dynamic AT2 site and is predicted to disrupt binding of IRF and STAT TFs. Variants are colored based on r2 with rs35074065 in 1000 Genomes Project data using all populations (Auton et al., 2015). (D) Estimated cell type proportions for 515 human lung samples from GTEx derived using cell-type-specific expression profiles for cell types with more than 500 cells from snRNA-seq data generated in this study. (E) Association p-values between rs35074065 genotype and TMPRSS2 lung expression after including an interaction term between genotype and estimated cell-type proportions for each sample. We observed stronger eQTL association when including an interaction with AT2 cell proportion as well as macrophage proportion.
Figure 5 with 1 supplement

Fine-mapped risk variants at the 3p21.31 locus associated with respiratory failure in SARS-CoV-2 overlap lung cell-type chromatin sites.
(A) Genome browser view (Robinson et al., 2011) showing posterior probability (PPA) of variants in the fine-mapping credible set at the 3p21.31 association signal and lung cell-type-specific accessible chromatin profiles. Credible set variants that directly overlap lung cell-type chromatin sites are highlighted. Read depth values represent counts per million (CPM). (B) Variant rs17713054 overlaps a site active in AT2 and other epithelial cells and bound by CEBPB among other TFs, and the minor allele A is predicted to bind a CEBP motif. For in-depth analysis of rs76374459 see Figure 5—figure supplement 1. Read depth values represent counts per million (CPM). (C) Co-accessible links between the site harboring rs17713054 (blue box) and other chromatin sites, including the promoter regions of four genes SLC6A20, LIMD1, SACM1L and CCRL2 (gray box). The height of each link represents the strength of co-accessibility (Cusanovich et al., 2018). (D) Expression of SLC6A20 across lung cell types, where each dot represents a nucleus. The highest expression observed was in AT2 cells. (E) Association p-values between rs17713054 genotype and SLC6A20 lung expression after including an interaction term between genotype and estimated cell-type proportions for each sample. We observed strongest eQTL association when including an interaction with AT1/AT2-like and AT2 cell proportion.
Figure 5—figure supplement 1
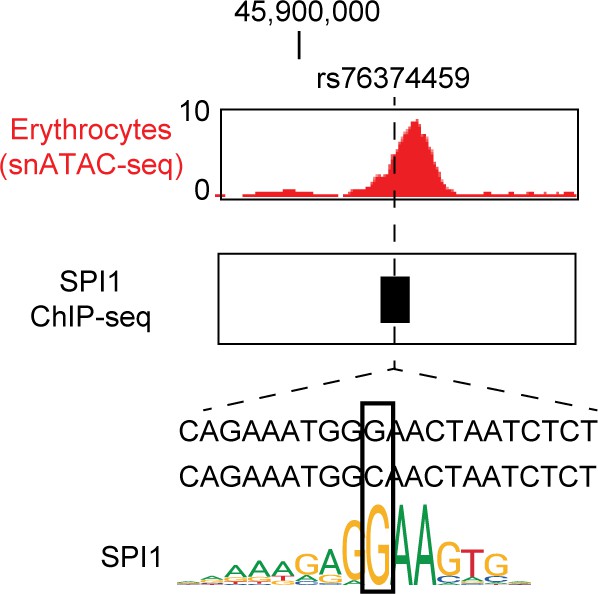
Molecular characterization of variant rs76374456.
Variant rs76374456 overlaps a cCRE accessible in erythrocytes which is bound by SPI1 among other TFs, and the minor allele C is predicted to disrupt a SPI1 motif. Read depth values represent counts per million (CPM).
Tables
Key resources table
| Reagent type (species) or resource | Designation | Source or reference | Identifiers | Additional information |
|---|---|---|---|---|
| Peptide, recombinant protein | Tn5 | doi: https://doi.org/10.1101/615179 | ||
| Chemical compound, drug | NEBNext High-Fidelity 2 × PCR Master Mix | NEB | Cat# M0541L | |
| Chemical compound, drug | RNasin Ribonuclease Inhibitor | Promega | Cat# N211B | |
| Chemical compound, drug | DRAQ7 | Cell Signaling | Cat# 7406 | |
| Commercial assay or kit | Chromium Single Cell 3′ Library Construction Kit v3 | 10x Genomics | Cat# 1000075 | |
| Commercial assay or kit | Chromium Single-Cell B Chip Kit | 10x Genomics | Cat# 1000153 | |
| Commercial assay or kit | Chromium i7 Multiplex Kit, 96 rxns | 10x Genomics | Cat# 120262 | |
| Chemical compound, drug | SPRISelect reagent | Beckman Coulter | Cat# B23319 | |
| Software, algorithm | Cell Ranger software package v3.0.2 | 10x Genomics (https://support.10xgenomics.com/single-cell-gene-expression/software/downloads/latest) | Software | |
| Software, algorithm | Seurat v3.1.4 | https://satijalab.org/seurat/ doi:10.1016/j.cell.2019.05.031 | RRID:SCR_016341 | |
| Software, algorithm | DoubletFinder | https://github.com/chris-mcginnis-ucsf/DoubletFinder doi:10.1016/j.cels.2019.03.003 | RRID:SCR_018771 | |
| Software, algorithm | GraphPad Prism version 8.0.0 | www.graphpad.com | RRID:SCR_002798 | |
| Software, algorithm | Trim galore (v.0.4.4) | https://www.bioinformatics.babraham.ac.uk/projects/trim_galore/ | RRID:SCR_011847 | |
| Software, algorithm | BWA (v.0.7.1) | http://bio-bwa.sourceforge.net/ doi:10.1093/bioinformatics/btp324 | RRID:SCR_010910 | Software |
| Software, algorithm | Samtools (v. 1.10) | http://www.htslib.org/ doi:10.1093/bioinformatics/btp352 | RRID:SCR_002105 | Software |
| Software, algorithm | Picard | http://broadinstitute.github.io/picard/ | RRID:SCR_006525 | Software |
| Software, algorithm | scanpy (v.1.4.4.post1) | https://github.com/theislab/scanpy | RRID:SCR_018139 | Software |
| Software, algorithm | Harmony (v. 0.1.0) | https://github.com/immunogenomics/harmony doi:10.1038/s41592-019-0619-0 | Software | |
| Software, algorithm | Cicero (v. 1.4.4) | https://github.com/cole-trapnell-lab/cicero-release doi:10.1016/j.molcel.2018.06.044 | Software | |
| Software, algorithm | liftOver | https://genome.ucsc.edu/cgi-bin/hgLiftOver | RRID:SCR_018160 | Software |
| Other | gnomAD v3 | http://gnomad.broadinstitute.org/ doi:10.1038/s41586-020-2308-7 | RRID:SCR_014964 | Database |
| Other | JASPAR 2020 | http://jaspar.genereg.net doi:10.1093/nar/gkz1001 | RRID:SCR_003030 | Database |
| Software, algorithm | FIMO (v. 4.12.0) | http://meme-suite.org/ doi:10.1093/bioinformatics/btr064 | RRID:SCR_001783 | Software |
| Software, algorithm | deltaSVM | http://www.beerlab.org/deltasvm/ doi:10.1038/ng.3331 | ||
| Software, algorithm | MuSiC (v.0.1.1) | https://github.com/xuranw/MuSiC doi:10.1038/s41467-018-08023-x | ||
| Software, algorithm | Python | https://www.python.org/ | RRID:SCR_008394 | |
| Software, algorithm | R (v.3.5.1) | https://www.r-project.org/ | RRID:SCR_001905 | |
| Software, algorithm | Go (v. 1.12.1) | https://golang.org/ | RRID:SCR_017096 | |
| Software, algorithm | NumPy (v.1.16.1) | https://numpy.org/ | RRID:SCR_008633 | python library |
| Software, algorithm | Scikit-learn (v. 0.20.1) | https://scikit-learn.org/stable/ | RRID:SCR_002577 | python library |
| Software, algorithm | seaborn (v. 0.9.0) | https://seaborn.pydata.org/api.html | RRID:SCR_018132 | python library |
| Software, algorithm | MatPlotLib (v.0.9.0) | http://matplotlib.sourceforge.net | RRID:SCR_008624 | python library |
| Software, algorithm | ATACdemultiplex (v. 0.46.12) | https://gitlab.com/Grouumf/ATACdemultiplex/ | suite of softwares written in GO for snATAC analysis | |
| Software, algorithm | edgeR (v. 3.22.5) | http://bioconductor.org/packages/release/bioc/html/edgeR.html doi:10.1093/bioinformatics/btp616 | RRID:SCR_012802 | R library |
| Software, algorithm | Matrix (v.1.2–15) | https://cran.r-project.org/web/packages/Matrix/index.html | R library | |
| Software, algorithm | Stringr (v. 1.4.0) | https://www.rdocumentation.org/packages/stringr/versions/1.4.0 | R library | |
| Software, algorithm | Cicero (v. 1.0.14) | https://www.bioconductor.org/packages/release/bioc/html/cicero.html doi:10.1016/j.molcel.2018.06.044 | R library | |
| Software, algorithm | HOMER (v4.11.1) | http://homer.ucsd.edu/homer/download.html doi:10.1016/j.molcel.2010.05.004 | RRID:SCR_010881 | Perl package |
| Software, algorithm | rGREAT (v. 1.20) | https://www.bioconductor.org/packages/release/bioc/html/rGREAT.html for GREAT: doi:10.1038/nbt.1630 | for GREAT: RRID:SCR_005807 | R library |
Additional files
-
Supplementary file 1
Donor metadata tables.
Sheet 1: 30wkGA - 30yo: Donor ID, age, sex, race, clinical pathology diagnosis (clinPathDx), gestational age, overall quality of the lung tissue assessment, type of death and cause of death were listed. Not shown are data on body weight, body height, total lung weight and radial alveolar count assessment of alveolarization. All were all within normal limits for age. Abbreviations: DCD: donor after cardiac death; DBD: donor after brain death; GA: gestational age; RDS: respiratory distress syndrome.
- https://cdn.elifesciences.org/articles/62522/elife-62522-supp1-v2.xlsx
-
Supplementary file 2
Summary statistics for sequencing libraries.
- https://cdn.elifesciences.org/articles/62522/elife-62522-supp2-v2.xlsx
-
Supplementary file 3
Cluster composition and number and fraction of nuclei expressing candidate for SARS-CoV2 cell entry.
- https://cdn.elifesciences.org/articles/62522/elife-62522-supp3-v2.xlsx
-
Supplementary file 4
Annotation of peaks co-accessible with candidate genes for SARS-CoV2 cell entry and age-associated changes of chromatin accessibility of peaks co-accessible with TMPRSS2 promoter.
- https://cdn.elifesciences.org/articles/62522/elife-62522-supp4-v2.xlsx
-
Supplementary file 5
GREAT analysis of peaks increasing with age in AT2 cells (groups cIII and cIV in Figure 3F).
- https://cdn.elifesciences.org/articles/62522/elife-62522-supp5-v2.xlsx
-
Supplementary file 6
De novo motif enrichment analysis of peaks increasing with age in AT2 cells (groups cIII and cIV in Figure 3F).
- https://cdn.elifesciences.org/articles/62522/elife-62522-supp6-v2.xlsx
-
Supplementary file 7
Genetic variants with predicted functional effects on sites linked to TMPRSS2.
- https://cdn.elifesciences.org/articles/62522/elife-62522-supp7-v2.xlsx
-
Supplementary file 8
Indexes and primer sequences for snATAC-seq libraries.
- https://cdn.elifesciences.org/articles/62522/elife-62522-supp8-v2.xlsx
-
Transparent reporting form
- https://cdn.elifesciences.org/articles/62522/elife-62522-transrepform-v2.docx
Download links
A two-part list of links to download the article, or parts of the article, in various formats.
Downloads (link to download the article as PDF)
Open citations (links to open the citations from this article in various online reference manager services)
Cite this article (links to download the citations from this article in formats compatible with various reference manager tools)
Single-cell multiomic profiling of human lungs reveals cell-type-specific and age-dynamic control of SARS-CoV2 host genes
eLife 9:e62522.
https://doi.org/10.7554/eLife.62522


