Enhanced C/EBPβ function promotes hypertrophic versus hyperplastic fat tissue growth and prevents steatosis in response to high-fat diet feeding
- European Research Institute for the Biology of Ageing, University Medical Center Groningen, University of Groningen, Netherlands
- Leibniz Institute on Aging - Fritz Lipmann Institute, Germany
- Division Molecular Genetics, Department of Pediatrics, University Medical Center Groningen, University of Groningen, Netherlands
Figures
Figure 1 with 1 supplement
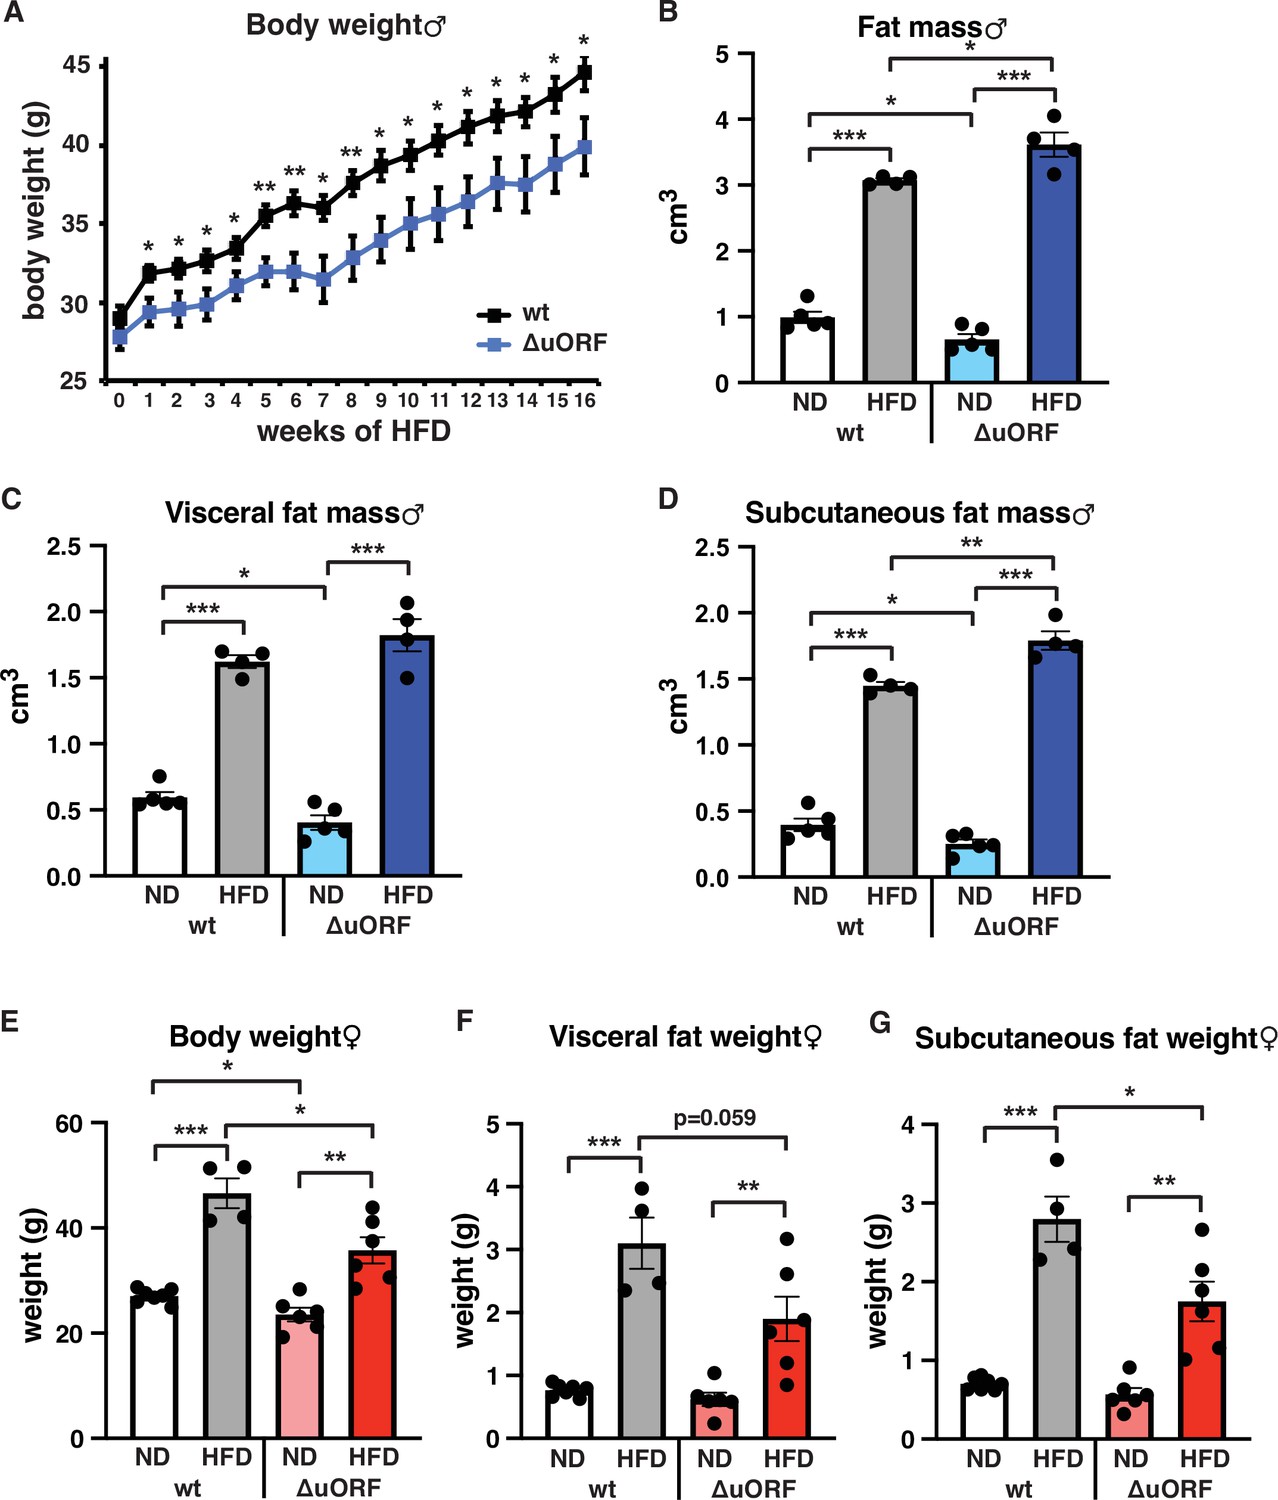
CebpbΔuORF mice on high-fat diet (HFD).
(A) Growth curves of wt and CebpbΔuORF (ΔuORF) male mice on HFD (wt, n = 10; CebpbΔuORF, n = 8). (B) Volume of total fat mass as measured by abdominal CT analyses (males,19 weeks; ND, n = 5; HFD, n = 4). (C) Volume of visceral fat mass as measured by abdominal CT analyses (males,19 weeks; ND, n = 5; HFD, n = 4) (D) Volume of subcutaneous fat mass as measured by abdominal CT analyses (males, 19 weeks; ND, n = 5; HFD, n = 4). (E) Female body weight (week 19; ND wt, n = 7; HFD wt, n = 4; ND and HFD ΔuORF, n = 6). (F) Visceral fat weight (females, week 19; ND wt, n = 7; HFD wt, n = 4; ND and HFD ΔuORF, n = 6). (G) Subcutaneous fat weight (females, week 19; ND wt, n = 7; HFD wt, n = 4; ND and HFD ΔuORF, n = 6). All values are mean ± SEM. p-Values were determined with Student’s t-test, *p < 0.05; **p < 0.01; ***p < 0.001.
-
Figure 1—source data 1
Raw data related to Figure 1A–G.
- https://cdn.elifesciences.org/articles/62625/elife-62625-fig1-data1-v2.xlsx
Figure 1—figure supplement 1
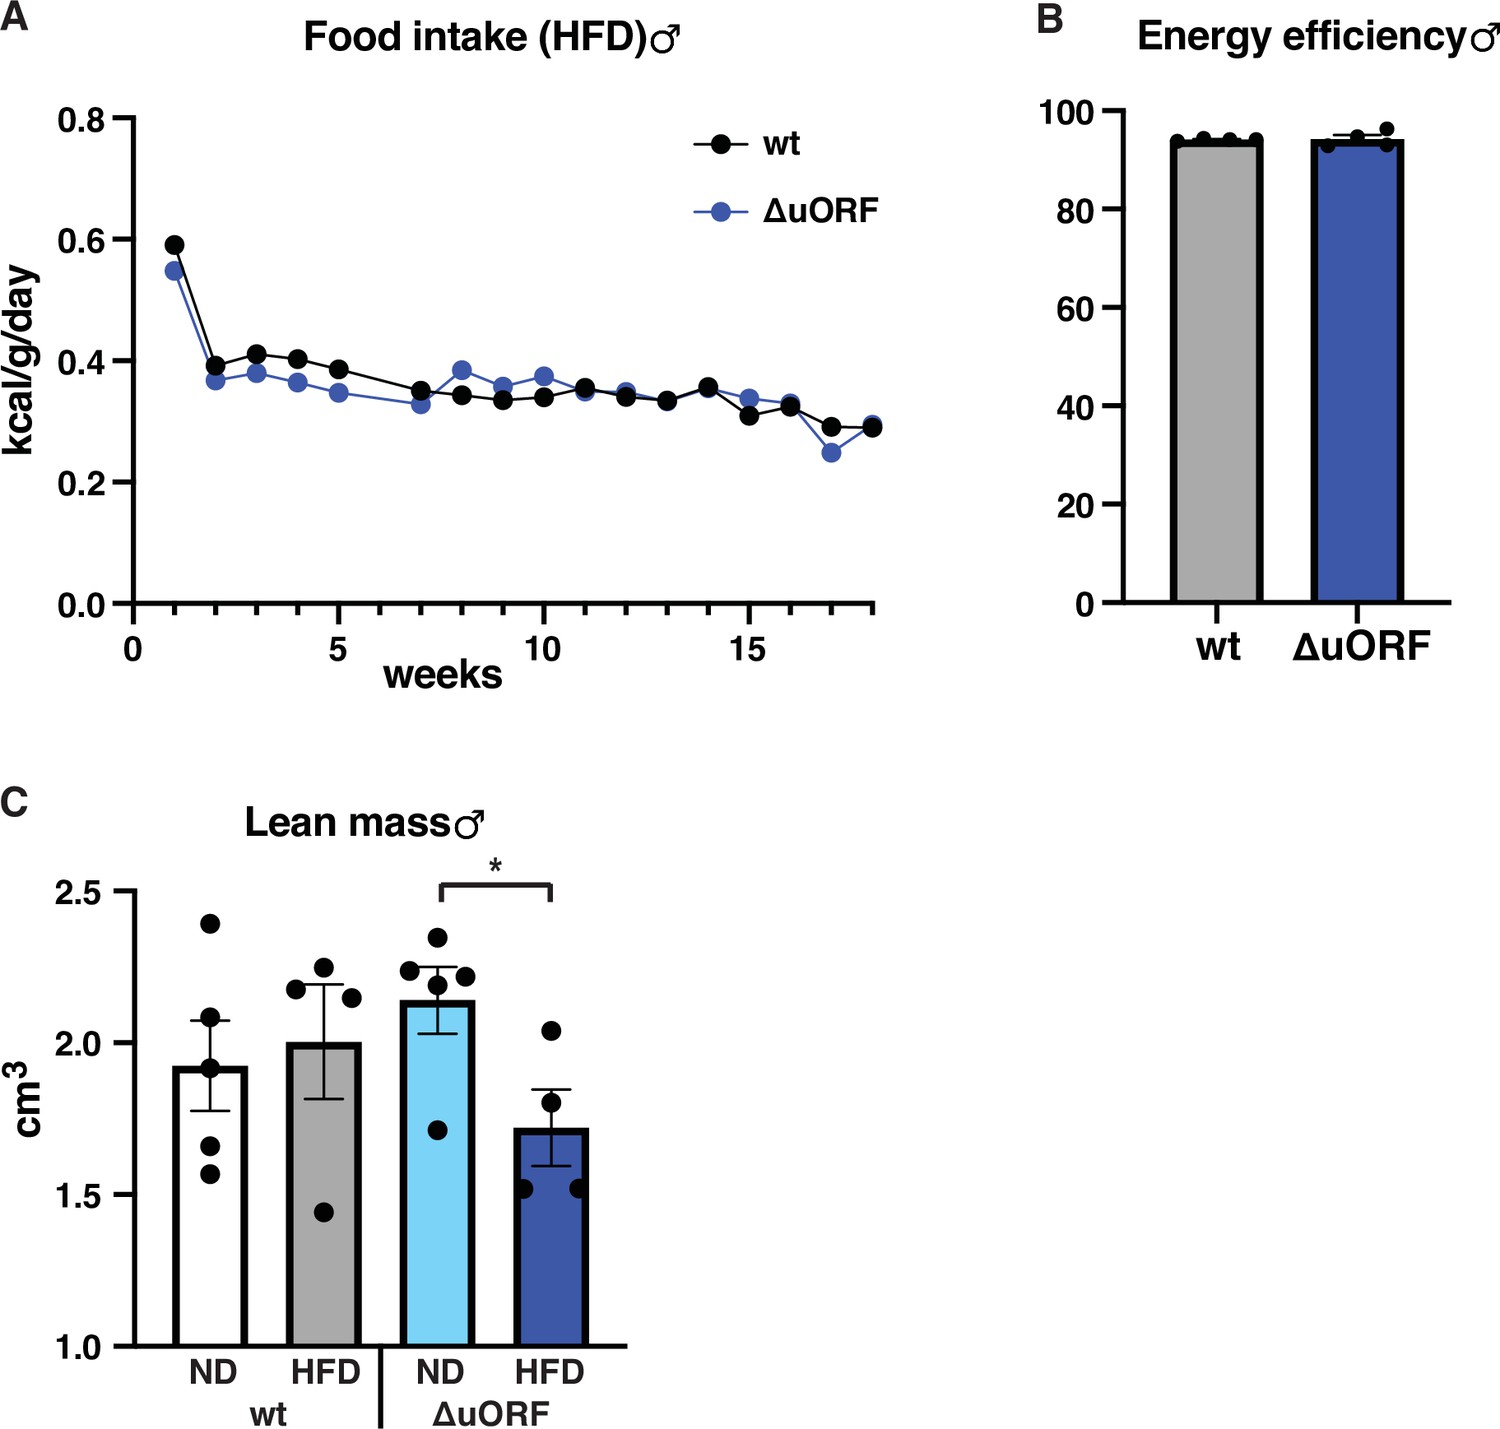
Food intake, energy efficiency and lean mass of male mice on high-fat diet (HFD).
(A) Daily food intake per mouse on HFD, normalized to body weight as determined over 18 weeks (males, wt, n = 9 mice / 4 cages; ΔuORF n = 7 mice / 2 cages). (B) Efficiency of caloric utilization in males on HFD measured by bomb calorimetry of food and feces (wt, n = 4; ΔuORF n = 4). (C) Volume of lean body mass of CebpbΔuORF male mice measured by abdominal CT analyses (19 weeks; ND, n = 5; HFD n = 4). All values are mean ± SEM. P-values were determined with Student’s t-test, *p < 0.05.
-
Figure 1—figure supplement 1—source data 1
Raw data and calculations related to Figure 1A–C.
- https://cdn.elifesciences.org/articles/62625/elife-62625-fig1-figsupp1-data1-v2.xlsx
Figure 2
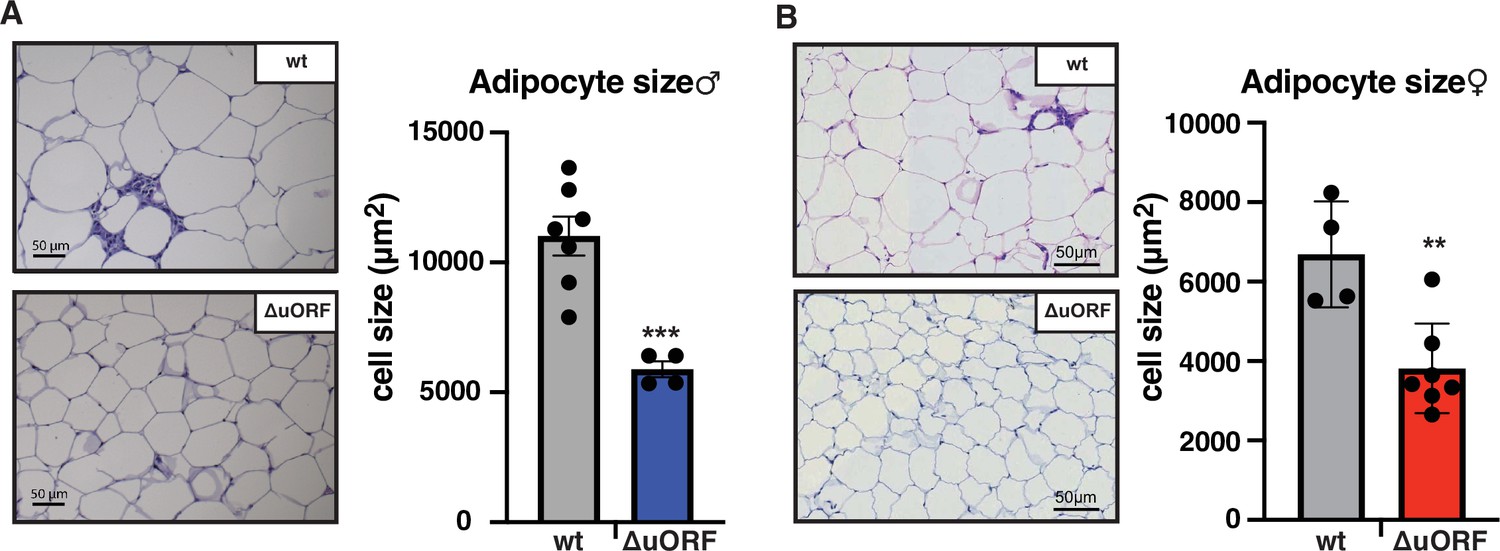
CebpbΔuORF mice on high-fat diet (HFD) store fat in hyperplastic adipocytes.
Histological hematoxylin and eosin (H&E) staining of epididymal WAT from (A) males (19 weeks HFD) and (B) females (19 weeks HFD). Quantification of the fat cell area is shown at the right (males: wt, n = 7; ΔuORF, n = 4; females: wt, n = 4; ΔuORF, n = 7; 12 adjacent cells are measured per mouse).
-
Figure 2—source data 1
Raw data related to Figure 2A, B.
- https://cdn.elifesciences.org/articles/62625/elife-62625-fig2-data1-v2.xlsx
Figure 3
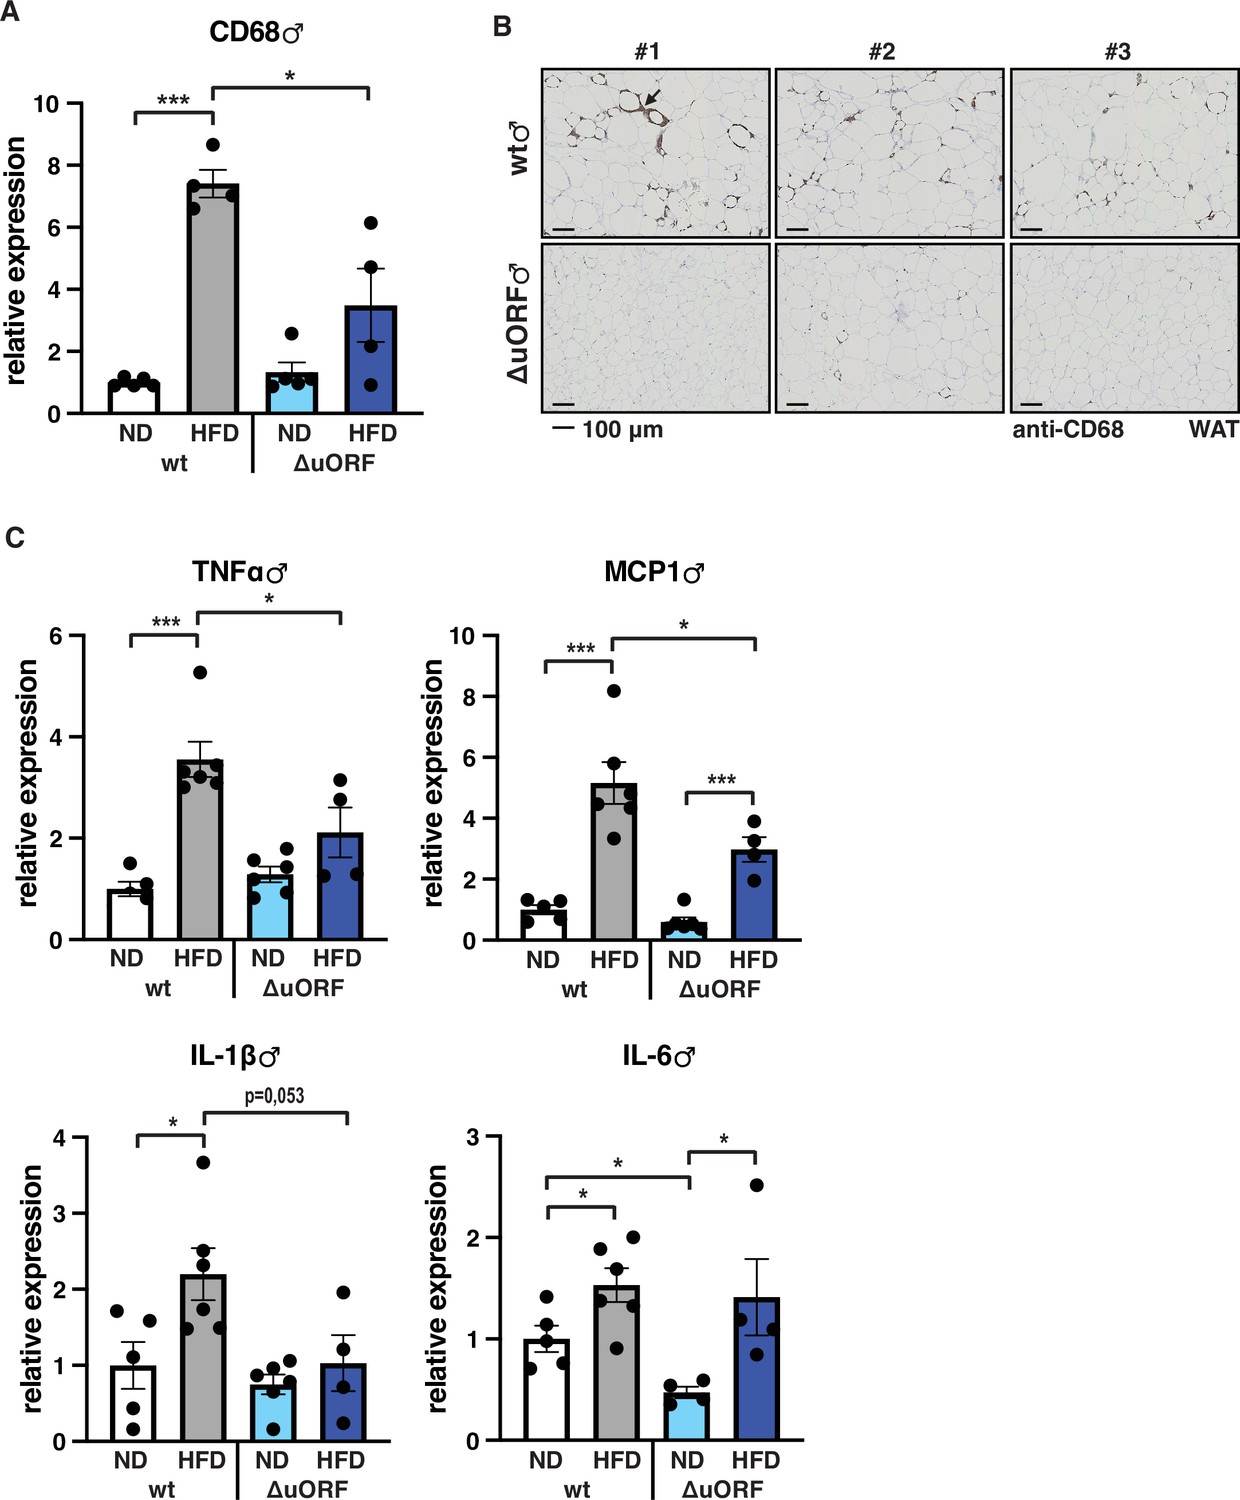
Inflammation of the visceral WAT is reduced in CebpbΔuORF male mice on high-fat diet (HFD).
(A) Relative mRNA expression levels of the macrophage marker CD68 measured in the visceral fat of CebpbΔuORF (ΔuORF) and wt male mice on either normal diet (ND) or HFD (19 weeks; ND, n = 5; HFD, n = 4). (B) Immunohistological staining of the visceral fat of CebpbΔuORF male mice (ΔuORF) and wt mice on HFD (19 weeks) using a CD68-specific antibody (arrow points to specific staining). Histological sections from three individual mice per genotype are shown. (C) Relative mRNA expression levels of the inflammatory cytokines TNFα, MCP1, IL-1β, and IL6 measured in the visceral fat of CebpbΔuORF (ΔuORF) and wt male mice on either normal diet (ND) or HFD (19 weeks; wt: ND, n = 5; HFD, n = 6; ΔuORF: ND, n = 6 (for IL-6, n = 4, the results of two mice were excluded due to undetectable signal); HFD, n = 4). All values are mean ± SEM. p-Values were determined with Student’s t-test, *p < 0.05; ***p < 0.001.
-
Figure 3—source data 1
Raw data related to Figure 3A, C.
- https://cdn.elifesciences.org/articles/62625/elife-62625-fig3-data1-v2.xlsx
Figure 4
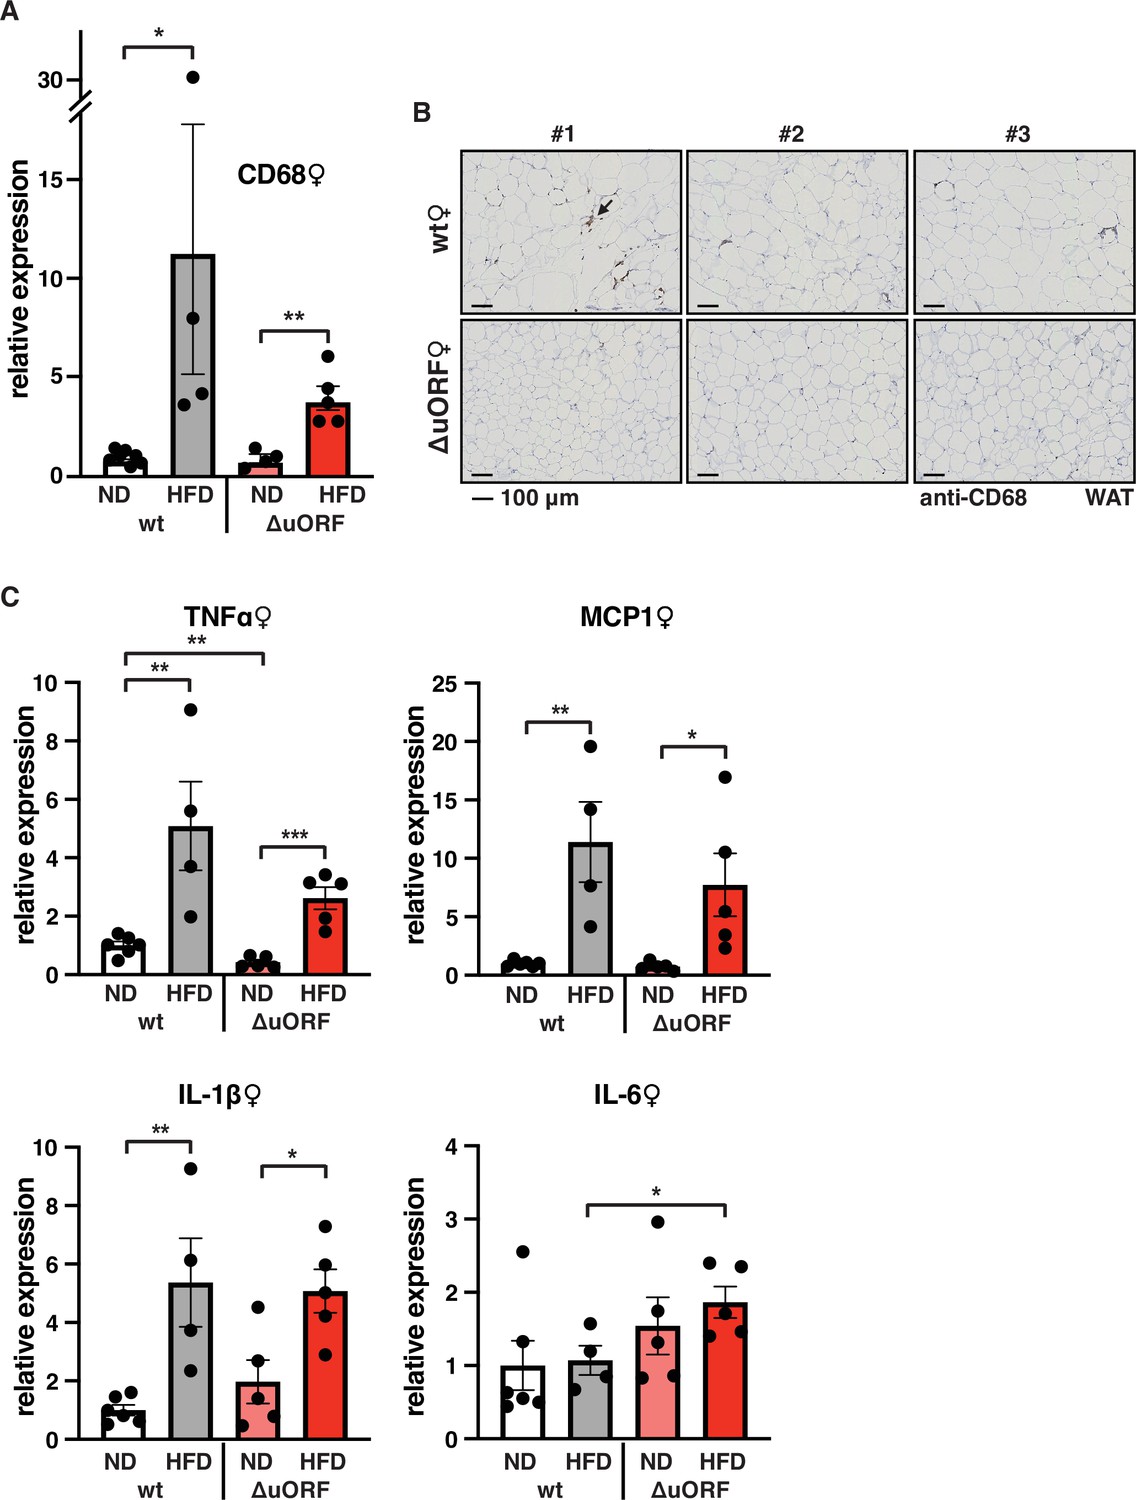
Macrophage infiltration of the visceral WAT is reduced in CebpbΔuORF female mice on high-fat diet (HFD).
(A) Relative mRNA expression levels of the macrophage marker CD68 measured in the visceral fat of CebpbΔuORF (ΔuORF) and wt female mice on either normal diet (ND) or HFD (19 weeks; wt: ND, n = 7; HFD, n = 4; ΔuORF: ND, n = 4 (the result from one mouse was excluded due to undetectable signal); HFD, n = 5). (B) Immunohistological staining of the visceral fat of CebpbΔuORF female mice (ΔuORF) and wt mice on HFD (19 weeks) using a CD68-specific antibody (arrow points to specific staining). Histological sections from three individual mice per genotype are shown. (C) Relative mRNA expression levels of the inflammatory cytokines TNFα, MCP1, IL-1β, and IL6 measured in the visceral fat of CebpbΔuORF female mice (ΔuORF) and wt mice on either normal diet (ND) or HFD (19 weeks; wt: ND, n = 6; HFD, n = 4; ΔuORF: ND, n = 5; HFD, n = 5). All values are mean ± SEM. p-Values were determined with Student’s t-test, *p < 0.05; **p < 0.01.
-
Figure 4—source data 1
Raw data related to Figure 4A, C.
- https://cdn.elifesciences.org/articles/62625/elife-62625-fig4-data1-v2.xlsx
Figure 5 with 1 supplement
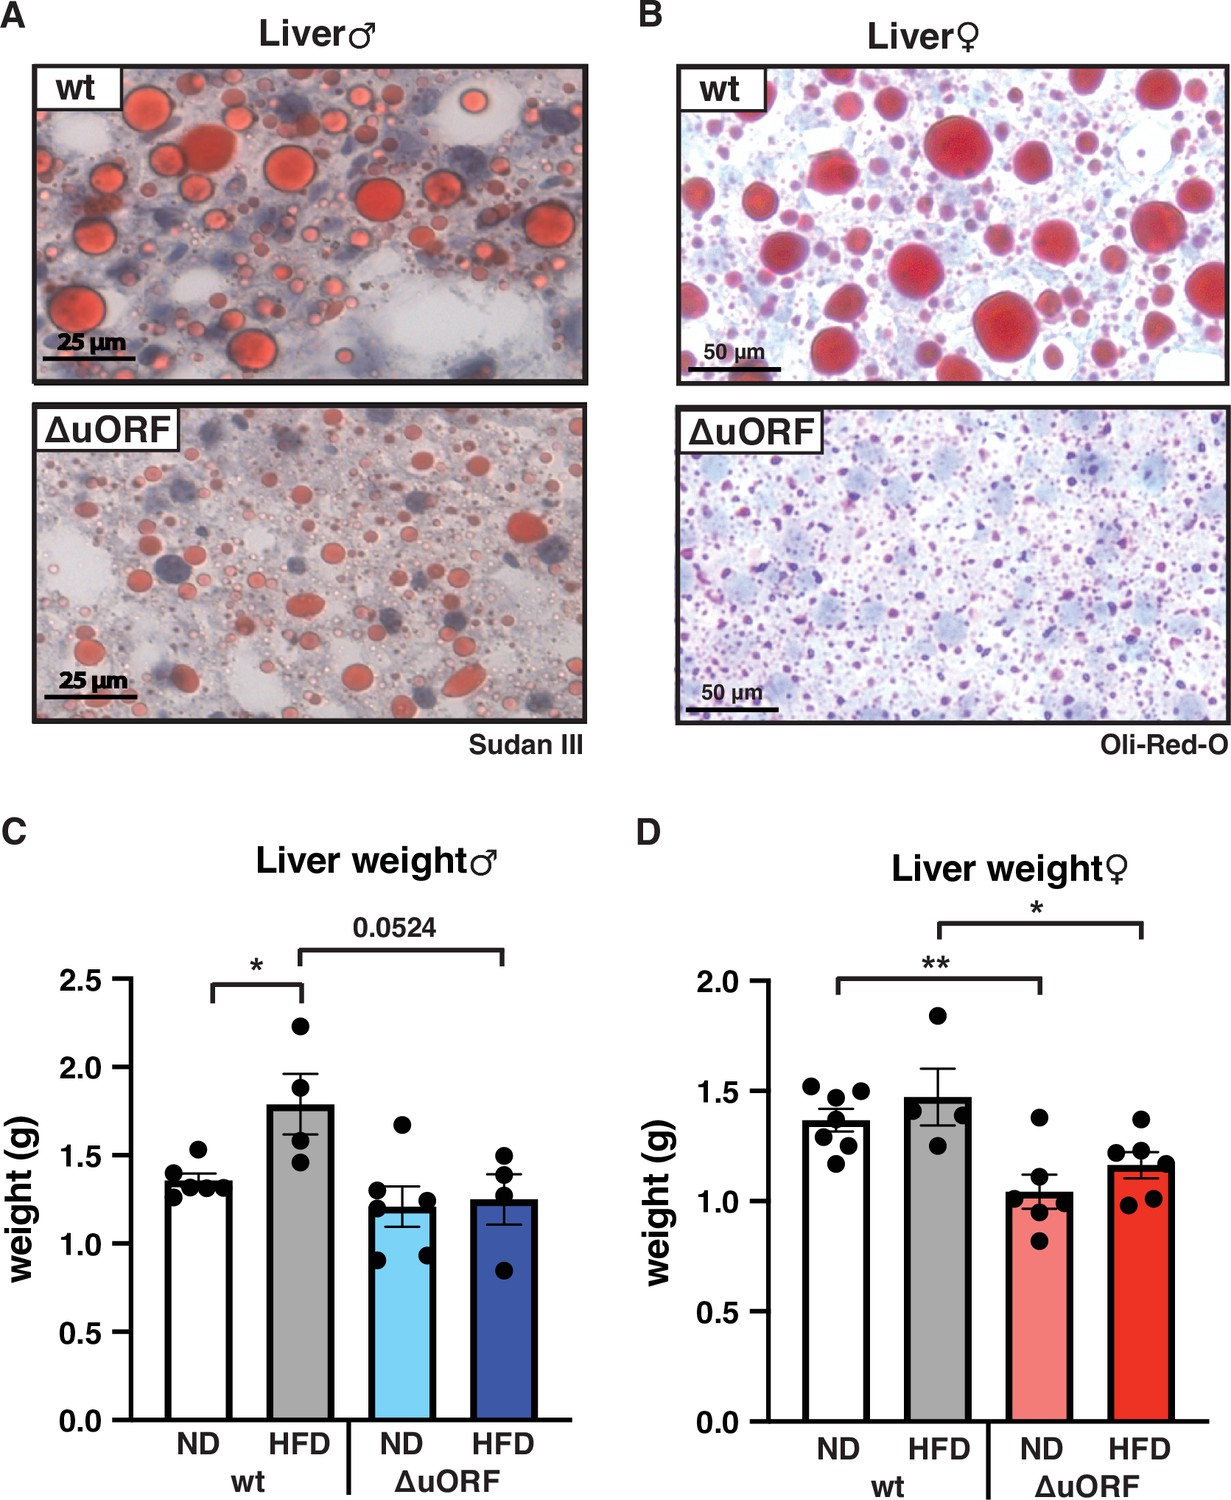
CebpbΔuORF mice on high-fat diet (HFD) are protected against steatosis.
Histological sections of liver from (A) males and (B) females of wt or CebpbΔuORF mice (ΔuORF) (19 weeks). Sections were stained with hematoxylin (blue) and Sudan III (males) or Oil-Red-O (females) for red color lipid staining. Liver weight of (C) males and (D) females of wt or CebpbΔuORF mice (ΔuORF) (19 weeks; males: ND, n = 6; HFD, n = 4; females: wt ND, n = 7, wt HFD, n = 4; ΔuORF wt and HFD, n = 6). All values are mean ± SEM. p-Values were determined with Student’s t-test, *p < 0.05; **p < 0.01.
-
Figure 5—source data 1
Raw data related to Figure 5C, D.
- https://cdn.elifesciences.org/articles/62625/elife-62625-fig5-data1-v2.xlsx
Figure 5—figure supplement 1
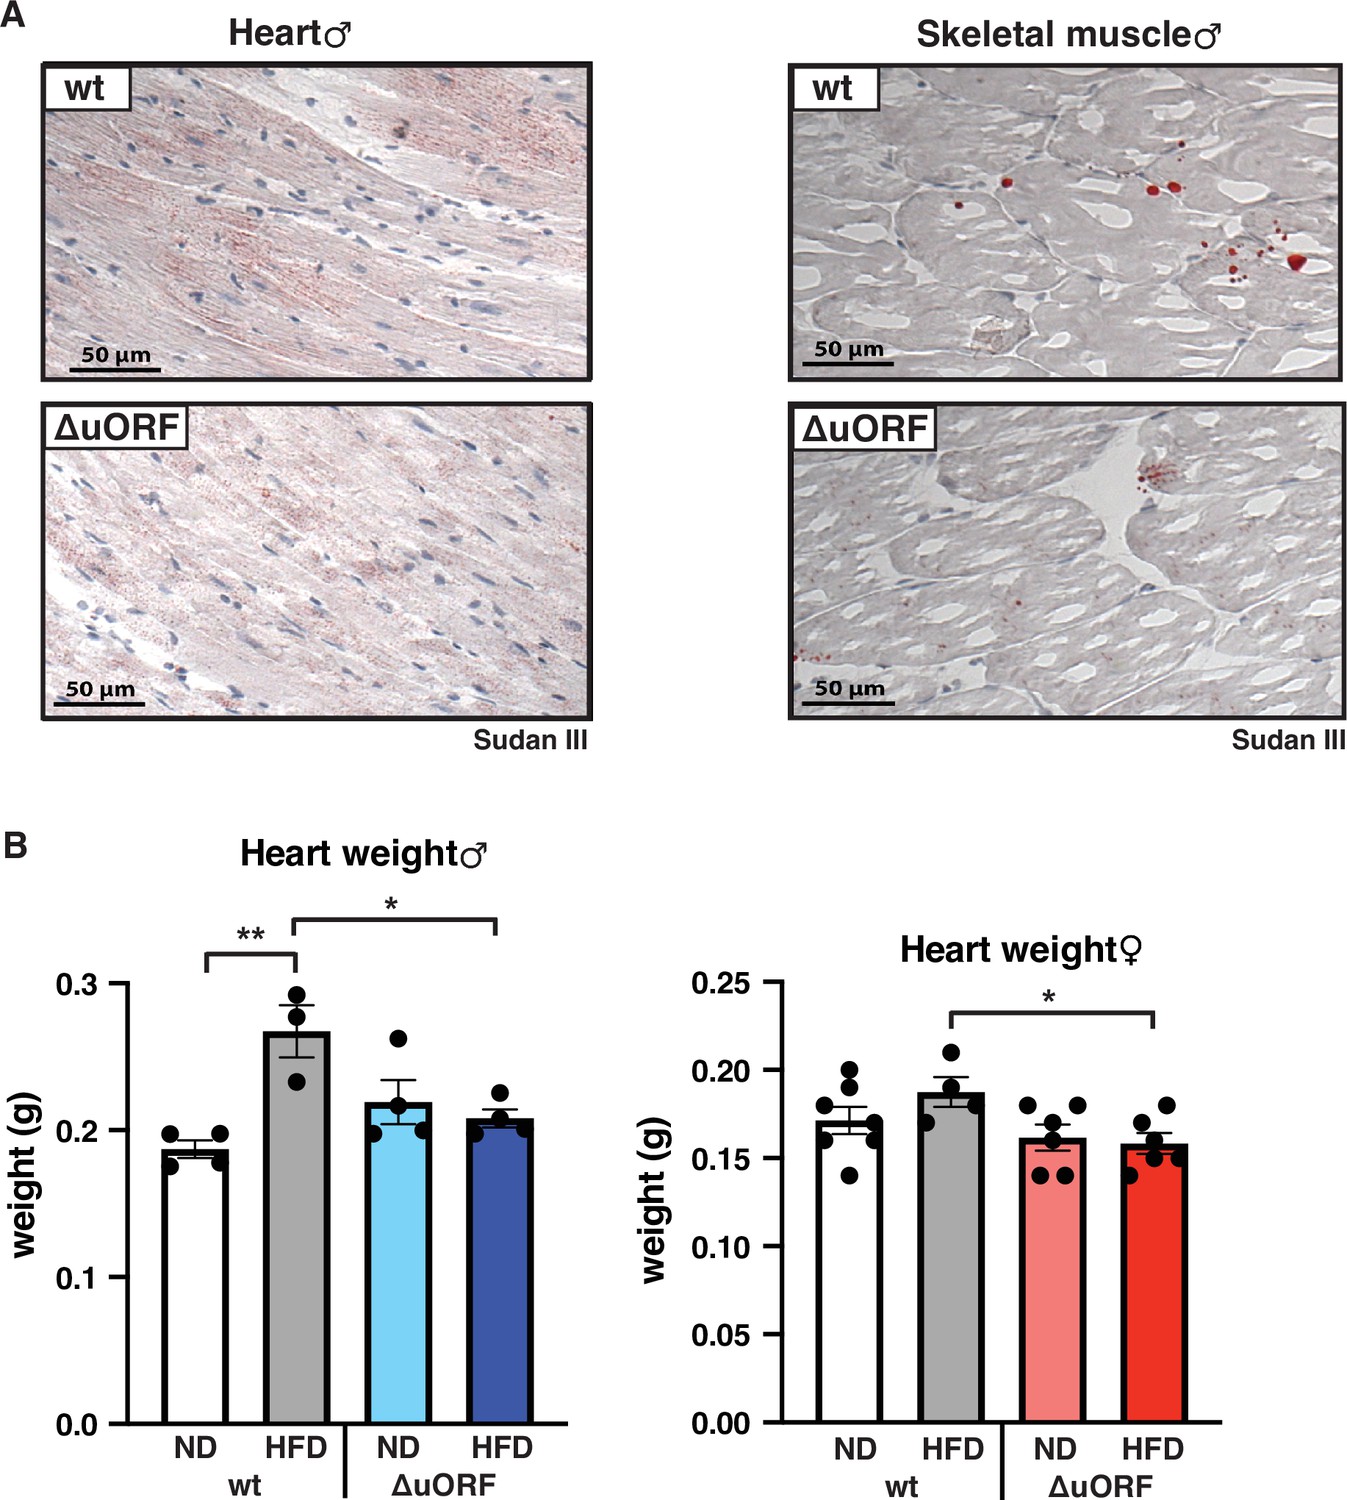
CebpbΔuORF mice on high-fat diet (HFD) are protected against steatosis in the heart and skeletal muscle.
(A) Histological sections of cardiac muscle and (B) skeletal muscle of wt or CebpbΔuORF male mice (ΔuORF) (19 weeks). Sections were stained with hematoxylin (blue) and Sudan III for red color lipid staining. (C) Heart weights of CebpbΔuORF and wt males and (D) females as indicated on normal diet (ND) or HFD (19 weeks, males: wt ND, n = 4; wt HFD, n = 3, ΔuORF ND and HFD, n = 4; females: wt ND, n = 7, wt HFD, n = 4, ΔuORF ND and HFD, n = 6). All values are mean ± SEM. p-Values were determined with Student’s t-test, *p < 0.05; **p < 0.01.
-
Figure 5—figure supplement 1—source data 1
Raw data related to Figure 5—figure supplement 1C, D.
- https://cdn.elifesciences.org/articles/62625/elife-62625-fig5-figsupp1-data1-v2.xlsx
Figure 6
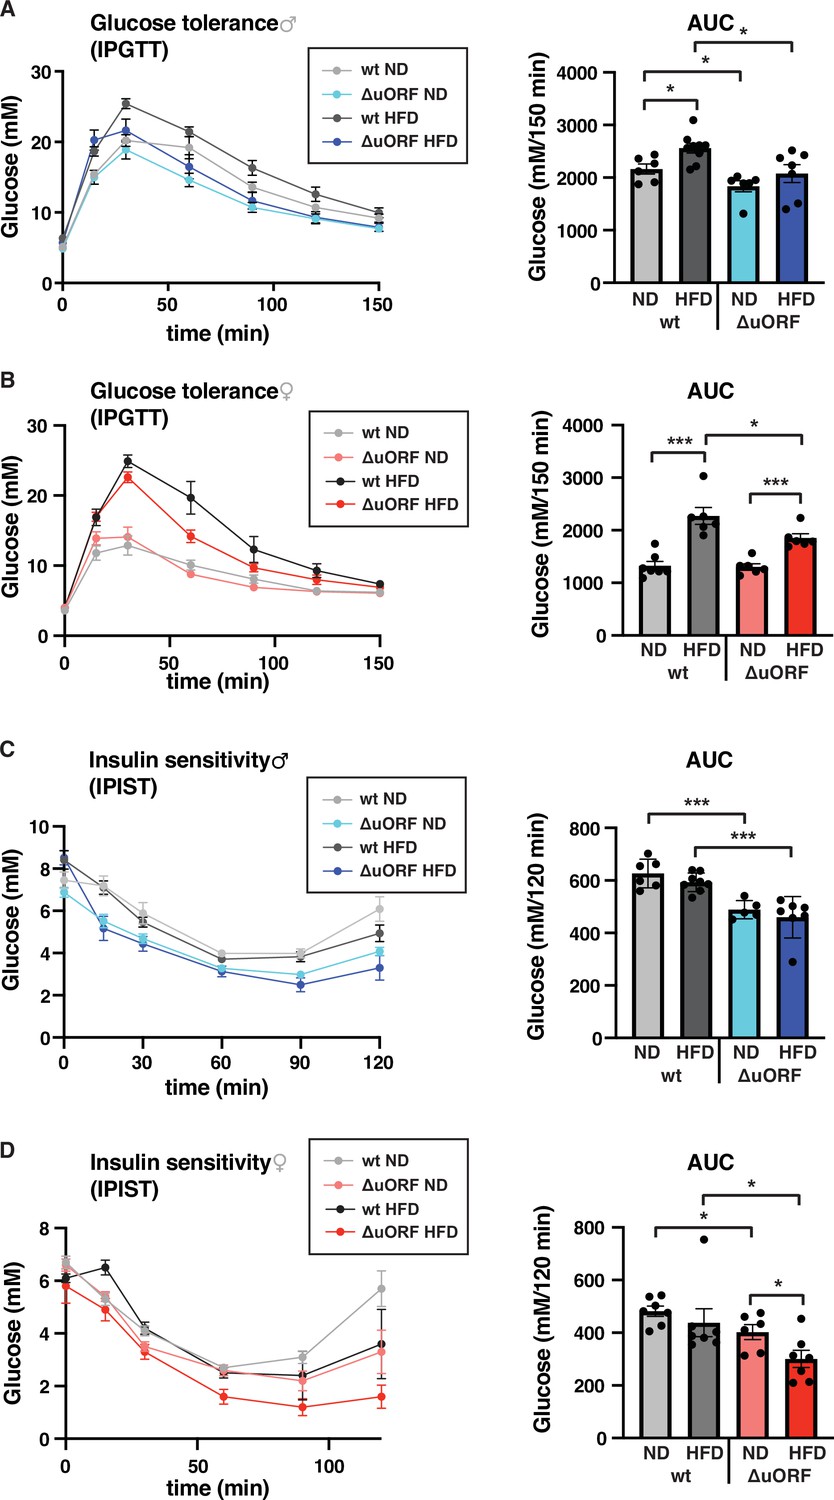
CebpbΔuORF mice show improved glucose tolerance and insulin sensitivity on a high-fat diet (HFD).
Intraperitoneal glucose tolerance test (IPGTT) with the calculated area under the curve (AUC) of CebpbΔuORF (A) male and (B) female (ΔuORF) and wt mice injected i.p. with glucose (2 g/kg) after a 16 hr fast (7 weeks; males: wt ND, n = 6; wt HFD, n = 9; ΔuORF ND, n = 6; ΔuORF HFD, n = 7; females: wt ND, n = 7; wt HFD, n = 6; ΔuORF ND and HFD, n = 6). Intraperitoneal insulin sensitivity test (IPIST) with the calculated area under the curve (AUC) of CebpbΔuORF (C) male and (D) female (ΔuORF) mice and wt mice injected i.p. with insulin (0.5 IU/kg) (7 weeks; males: wt ND, n = 6; wt HFD, n = 8; ΔuORF ND, n = 5; ΔuORF HFD, n = 7; females: wt ND, n = 7; wt HFD, n = 7; ΔuORF ND, n = 6; ΔuORF HFD, n = 7). All values are mean ± SEM. p-Values were determined with Student’s t-test, *p < 0.05; ***p < 0.001.
-
Figure 6—source data 1
Raw data related to Figure 6A–D.
- https://cdn.elifesciences.org/articles/62625/elife-62625-fig6-data1-v2.xlsx
Figure 7 with 1 supplement
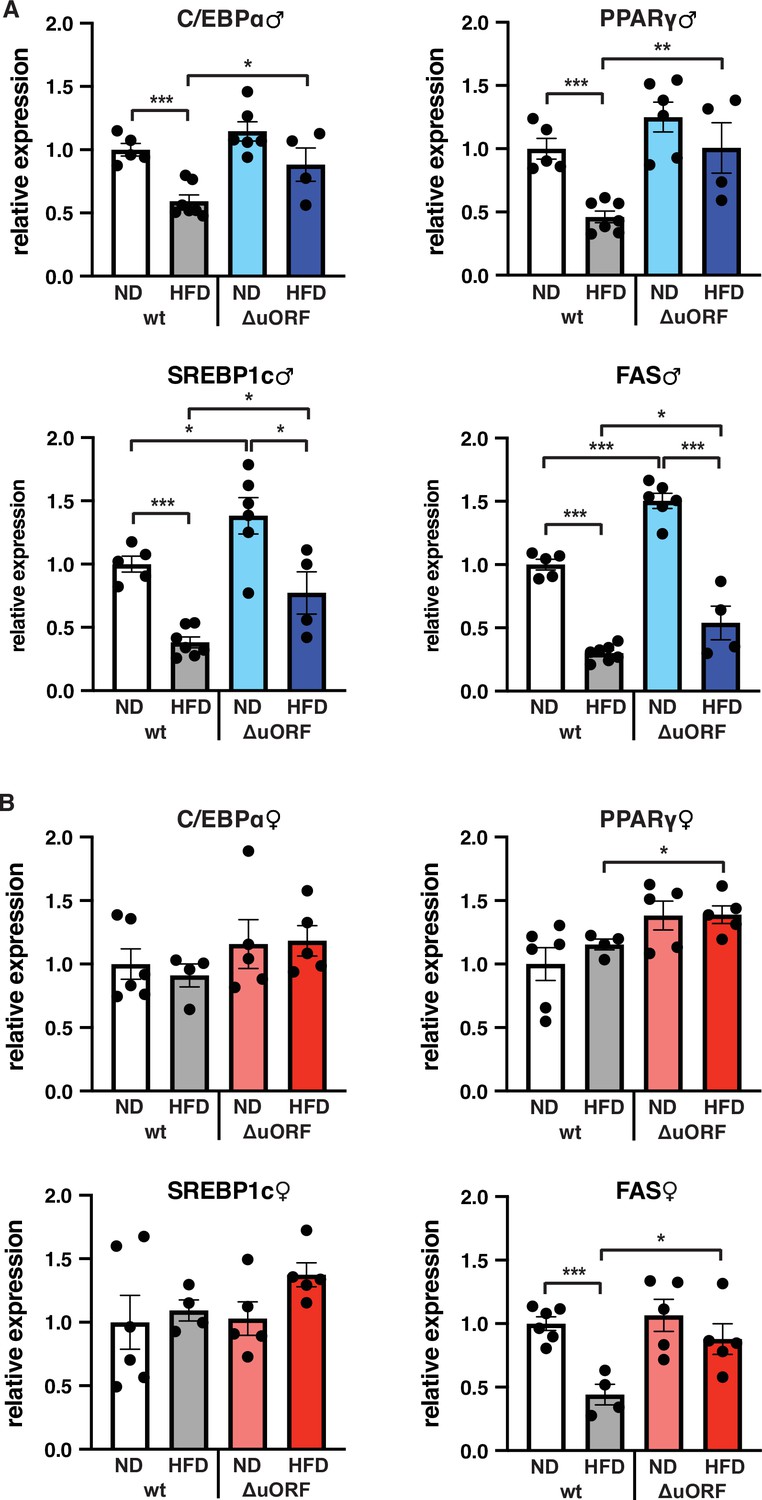
Expression of key adipogenic genes is elevated in CebpbΔuORF male mice on high-fat diet (HFD).
Relative mRNA expression levels of the adipogenic transcription factors C/EBPα, PPARγ and SREBBP1c and key enzyme FAS measured visceral WAT of CebpbΔuORF (A) male and (B) female (ΔuORF) mice and wt mice on either normal diet (ND) or HFD (19 weeks; males: wt ND, n = 5; wt HFD, n = 7; ΔuORF ND, n = 6; ΔuORF HFD, n = 4; females: wt ND, n = 6; wt HFD, n = 4; ΔuORF ND and HFD, n = 5). All values are mean ± SEM. p-Values were determined with Student’s t-test, *p < 0.05; **p < 0.01; ***p < 0.001.
-
Figure 7—source data 1
Raw data related to Figure 7A, B.
- https://cdn.elifesciences.org/articles/62625/elife-62625-fig7-data1-v2.xlsx
Figure 7—figure supplement 1
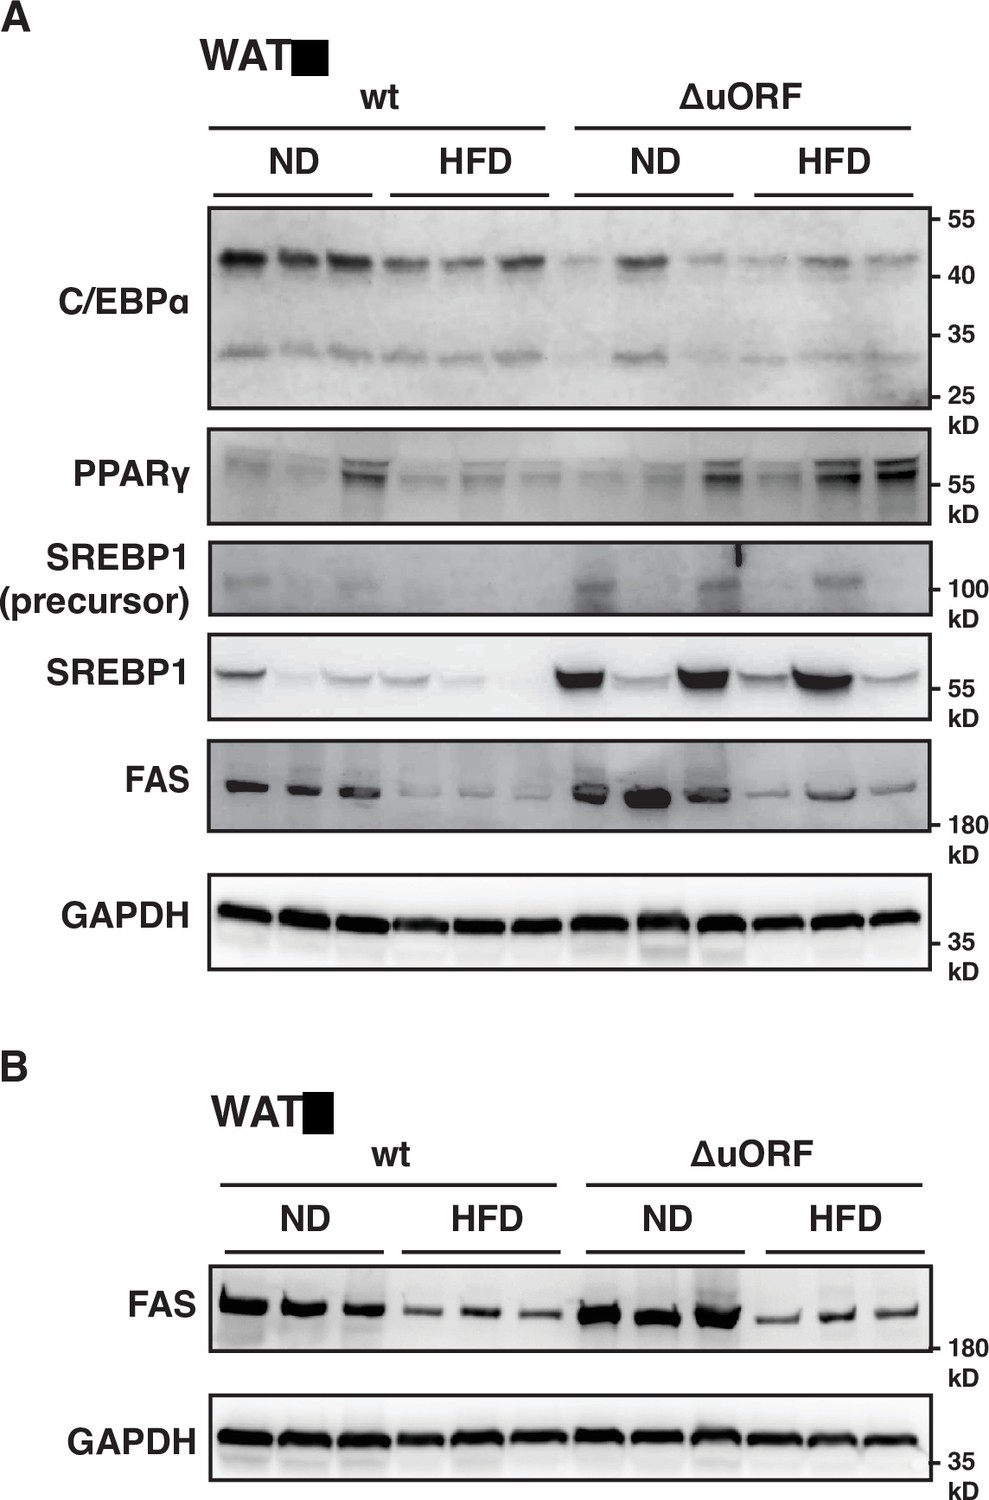
Protein expression of key adipogenic genes is elevated in CebpbΔuORF mice on high-fat diet (HFD).
(A) Immunoblot of the adipogenic transcription factors C/EBPα, PPARγ and SREBP1 and the key enzyme FAS performed with visceral WAT extracts from CebpbΔuORF male mice (ΔuORF) and wt mice on either normal diet (ND) or HFD (19 weeks). An immunoblot of GAPDH served as loading control. (B) Immunoblot of the key enzyme FAS performed with liver extracts from CebpbΔuORF female mice (ΔuORF) and wt mice on either normal diet (ND) or HFD (19 weeks). An immunoblot of GAPDH served as loading control.
Figure 8
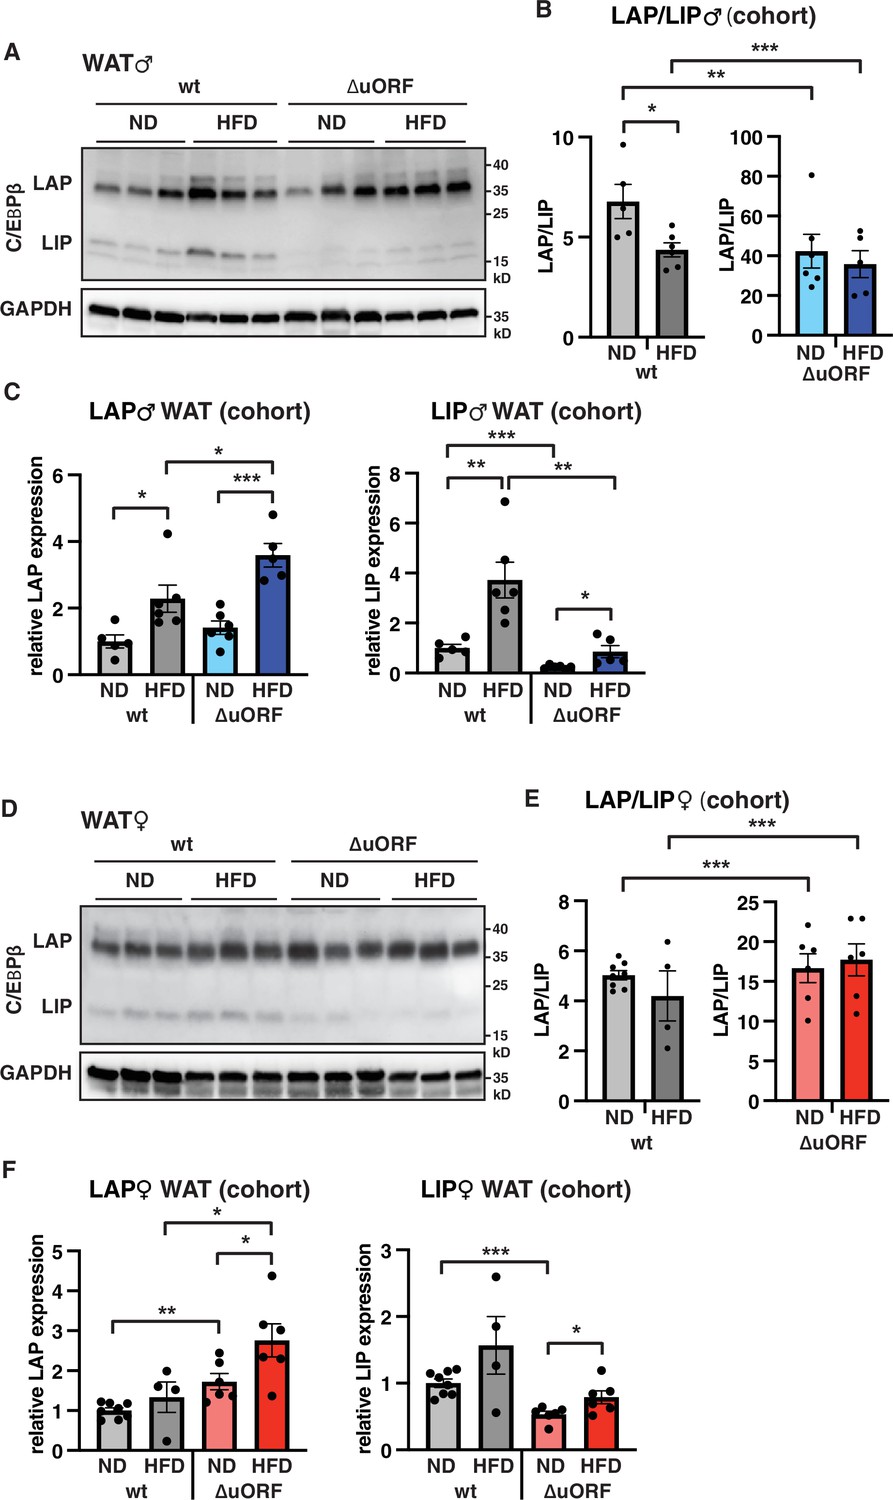
LAP and LIP expression under ND and HFD feeding.
(A) Immunoblots of C/EBPβ and GAPDH loading control performed with visceral WAT extracts from wt or CebpbΔuORF males on either normal diet (ND) or HFD (19 weeks). (B) Quantification of the LAP/LIP ratio in split bar diagrams for better visualization, and (C) quantification of LAP and LIP isoform expression separately (normalized to the GAPDH signal) using the whole cohort (wt ND, n = 5; wt HFD, n = 6; ΔuORF ND, n = 6; ΔuORF HFD, n = 5). (D) Immunoblots of C/EBPβ and GAPDH loading control performed with visceral WAT extracts from wt or CebpbΔuORF females on either normal diet (ND) or HFD (19 weeks). (E) Quantification of the LAP/LIP ratios in split bar diagrams for better visualization, and (F) quantification of LAP and LIP isoform expression separately (normalized to the GAPDH signal) using the whole cohort (wt ND, n = 8; wt HFD, n = 4; ΔuORF ND and HFD, n = 6). All values are mean ± SEM. p-Values were determined with Student’s t-test, *p < 0.05; **p < 0.01; ***p < 0.001.
-
Figure 8—source data 1
Raw data related to Figure 8B, C, E and F.
- https://cdn.elifesciences.org/articles/62625/elife-62625-fig8-data1-v2.xlsx
Tables
Key resources table
| Reagent type (species) or resource | Designation | Source or reference | Identifiers | Additional information |
|---|---|---|---|---|
| Genetic reagent (M. musculus) | C/EBPβΔuORF | https://doi.org.10.1101/gad.557910https://doi.org.10.15252/embr.201439837 | males, back-crossed for 6 generations and females, back-crossed for 12 generations into C57BL/6 J background | |
| Antibody | Anti-C/EBPβ (E299) (rabbit monoclonal) | Abcam | Cat# ab32358, RRID:AB_726796 | (1:1000) |
| Antibody | Anti-C/EBPα (D56F10) (rabbit monoclonal) | Cell Signaling | Cat# 8178, RRID:AB_11178517 | (1:1000) |
| Antibody | Anti-PPARγ (C26H12) (rabbit monoclonal) | Cell Signaling | Cat# 2435, RRID:AB_2166051 | (1:1000) |
| Antibody | Anti-FAS (C20G5) (rabbit monoclonal) | Cell Signaling | Cat# 3180, RRID:AB_2100796 | (1:1000) |
| Antibody | Anti-GAPDH (14 C10) (rabbit monoclonal) | Cell Signaling | Cat# 2118, RRID:AB_561053 | (1:1000) |
| Antibody | Anti-SREBP1 (2 A4) (mouse monoclonal) | NeoMarkers | Cat# MS-1207-PO | (1:1000) |
| Antibody | Anti-CD68 (E307V) (rabbit monoclonal) | Cell Signaling | Cat# 97,778 | (1:200) |
| Antibody | Anti-rabbit IgG, HRP-conjugated (donkey polyclonal) | GE Healthcare | Cat#: NA934, RRID:AB_772206 | (1:5000) |
| Antibody | Anti-mouse IgG, HRP-conjugated (sheep polyclonal) | GE Healthcare | Cat#: NXA931, RRID:AB_772209 | (1:5000) |
| Antibody | Anti-rabbit IgG, biotin-conjugated (goat polyclonal) | Vector Labs | Cat#: BA-1000 | (1:250) |
| Sequence-based reagent | CD68 (F) | https://doi.org.10.7554/eLife.34985.001 | PCR primer | 5’-GCCCACCAC CACCAGTCACG –3’ |
| Sequence-based reagent | CD68 (R) | https://doi.org.10.7554/eLife.34985.001 | PCR primer | 5’GTGGTCCAG GGTGAGGGCC A-3’ |
| Sequence-based reagent | PPARγ (F) | https://doi.org.10.15252/embr.201439837 | PCR primer | 5’-GCCCTTTGG TGACTTTATGG –3’ |
| Sequence-based reagent | PPARγ (R) | https://doi.org.10.15252/embr.201439837 | PCR primer | 5’-CAGCAGGTT GTCTTGGATGT 3’ |
| Sequence-based reagent | C/EBPα (F) | https://doi.org.10.15252/embr.201439837 | PCR primer | 5’-CAAGAACAG CAACGAGTACC G-3’ |
| Sequence-based reagent | C/EBPα (R) | https://doi.org.10.15252/embr.201439837 | PCR primer | 5’-GTCACTGGT CAACTCCAGCA C-3’ |
| Sequence-based reagent | SREBP1c (F) | https://doi.org.10.15252/embr.201439837 | PCR primer | 5’-AACGTCACT TCCAGCTAGAC –3’ |
| Sequence-based reagent | SREBP1c (R) | https://doi.org.10.15252/embr.201439837 | PCR primer | 5’-CCACTAAGG TGCCTACAGAG C-3’ |
| Sequence-based reagent | FAS (F) | https://doi.org.10.15252/embr.201439837 | PCR primer | 5’-ACACAGCAA GGTGCTGGAG-3’ |
| Sequence-based reagent | FAS (R) | https://doi.org.10.15252/embr.201439837 | PCR primer | 5’-GTCCAGGCT GTGGTGACTCT –3’ |
| Sequence-based reagent | TNFα (F) | This paper | PCR primer | 5’-CCAGACCCT CACACTCA-3’ |
| Sequence-based reagent | TNFα (R) | This paper | PCR primer | 5’-CACTTGGTG GTTTGCTACGA C-3’ |
| Sequence-based reagent | MCP1 (F) | This paper | PCR primer | 5‘-GCTGGAGAG CTACAAGAGGA TCA-3’ |
| Sequence-based reagent | MCP1 (R) | This paper | PCR primer | 5‘-ACAGACCTC TCTCTTGAGCT TGGT-3’ |
| Sequence-based reagent | IL-1β (F) | This paper | PCR primer | 5‘-GAAATGCCA CCTTTTGACAG TG-3’ |
| Sequence-based reagent | IL-1β (R) | This paper | PCR primer | 5‘-TGGATGCTC TCATCAGGACA G-3’ |
| Sequence-based reagent | IL-6 (F) | This paper | PCR primer | 5’-CCGGAGAGG AGACTTCACAG –3’ |
| Sequence-based reagent | IL-6 (R) | This paper | PCR primer | 5’-TTCTGCAAG TGCATCATCGT –3’ |
| Sequence-based reagent | GAPDH (F) | This paper | PCR primer | 5’-ATTGTCAGC AATGCATCCTG –3’ |
| Sequence-based reagent | GAPDH (R) | This paper | PCR primer | 5’-ATGGACTGT GGTCATGAGC C-3’ |
| Sequence-based reagent | β-actin (F) | https://doi.org.10.15252/embr.201439837 | PCR primer | 5’-AGAGGGAAA TCGTGCGTGA C-3' |
| Sequence-based reagent | β-actin (R) | https://doi.org.10.15252/embr.201439837 | PCR primer | 5'-CAATAGTGA TGACCTGGCC GT-3’ |
| Commercial assay or kit | Vectastain ABC HRP Kit | Vector Labs | Cat#: PK-4000 | |
| Commercial assay or kit | Western Lightning Plus ECL Reagent | Perkin Emer | Cat#: NEL103001EA | |
| Commercial assay or kit | ECL Prime Western Blotting Reagent | GE Healthcare | Cat#: RPN2236 | |
| Commercial assay or kit | Restore Western Blot Stripping buffer | Thermo Fisher | Cat#: 21,063 | |
| Commercial assay or kit | QIAzol Lysis re-agent | QIAGEN | Cat#: ID:79,306 | |
| Commercial assay or kit | RNeasy Lipid Tissue Mini kit | QIAGEN | Cat#: ID:74,804 | |
| Commercial assay or kit | Rneasy Plus Mini kit | QIAGEN | Cat#: ID:74,134 | |
| Commercial assay or kit | Transcriptor First Strand cDNA Synthesis kit | Roche | Cat#: 4379012001 | |
| Commercial assay or kit | Light Cycler 480 SYBR Green I Master Mix | Roche | Cat#: 0470751600 | |
| Chemical compound, drug | Insulin (human) | Lilly | Cat#: HI-210 | |
| Chemical compound, drug | Sudan III | Sigma-Aldrich | Cat#: S4136 | |
| Chemical compound, drug | Oil-Red-O | Sigma-Aldrich | Cat#: O0625 | |
| Software, algorithm | GraphPad Prism 9.0 | Graphpad Software, La Jolla, CA | RRID:SCR_002798 | |
| Software, algorithm | Image Quant LAS 4000 Mini Imager Software | GE Healthcare | RRID:SCR_014246 | |
| Software, algorithm | ImageJ | https://doi.org.10.1186/s12859-017-1934-z | RRID:SCR_003070 |
Additional files
Download links
A two-part list of links to download the article, or parts of the article, in various formats.
Downloads (link to download the article as PDF)
Open citations (links to open the citations from this article in various online reference manager services)
Cite this article (links to download the citations from this article in formats compatible with various reference manager tools)
Enhanced C/EBPβ function promotes hypertrophic versus hyperplastic fat tissue growth and prevents steatosis in response to high-fat diet feeding
eLife 11:e62625.
https://doi.org/10.7554/eLife.62625


