HOXA9 promotes MYC-mediated leukemogenesis by maintaining gene expression for multiple anti-apoptotic pathways
- Tsuruoka Metabolomics Laboratory, National Cancer Center, Japan
- Department of Molecular Oncology and Leukemia Program Project, Research Institute for Radiation Biology and Medicine, Hiroshima University, Japan
- Department of Hematology and Oncology, Kyoto University Graduate School of Medicine, Japan
- Department of Molecular Laboratory Medicine, Graduate School of Medical Sciences, Kumamoto University, Japan
- Division of Hematological Malignancy, National Cancer Center Research Institute, Japan
Figures
Figure 1 with 2 supplements
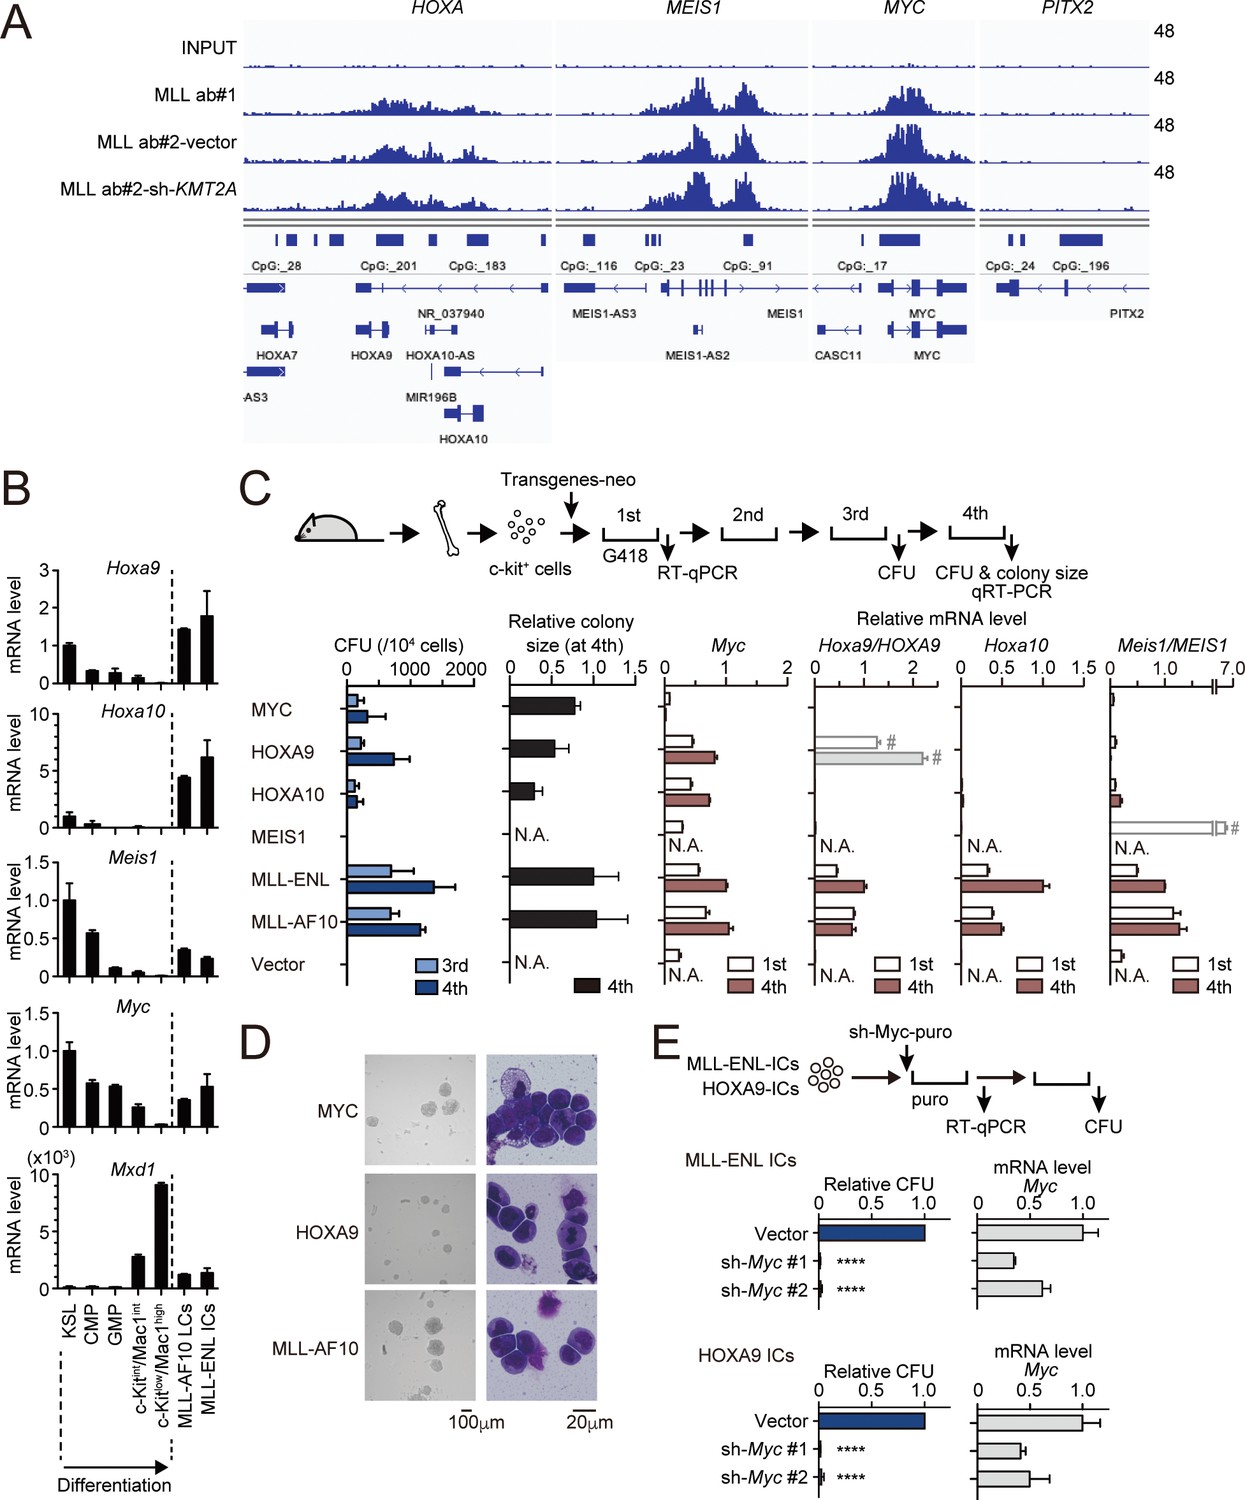
MLL fusion proteins and HOXA9 sustain MYC expression against differentiation-induced transcriptional suppression.
(A) Genomic localization of MLL-ENL in HB1119 cells. ChIP signals at the loci of posterior HOXA genes, MEIS1, MYC, and PITX2 (negative control) are shown using the Integrative Genomics Viewer (The Broad Institute). HB1119 cells were transduced with shRNA specific for wild-type (wt) MLL but not MLL-ENL (sh- KMT2A) to deplete wt MLL, as shown in Figure 1—figure supplement 1B. Ab: antibody. (B) Expression of MLL-target genes and Mxd1 (a differentiation marker) during myeloid differentiation. Bone marrow cells at various differentiation stages were obtained by FACS sorting and analyzed by qRT-PCR. Expression levels relative to KSL are shown (Mean with SD, n = 3, PCR replicates). MLL-AF10-LCs and MLL-ENL-ICs were included in the analysis for comparison. KSL: c-Kit+, Sca1+, and Lineage–; CMP: common myeloid progenitor; GMP: granulocyte macrophage progenitor; int: intermediate. (C) Transforming potential of MLL target genes. Clonogenic potential of the indicated constructs was analyzed by myeloid progenitor transformation assays. Colony forming unit per 104 cells (CFU) (Mean with SD, n = 3, biological replicates), relative colony size (Mean with SD, n ≥ 100), and relative mRNA levels of indicated genes (Mean with SD, n = 3, PCR replicates) were measured at the indicated time points. #: Both endogenous murine transcripts and exogenous human transcripts were detected by the qPCR primer set used and the columns were shown with faded color. N.A.: not assessed. (D) Morphologies of the colonies and transformed cells. Representative images of bright field (left) and May-Grunwald-Giemsa staining (right) are shown with scale bars. (E) Effects of Myc knockdown on MLL-ENL- and HOXA9-ICs. Relative CFU (Mean with SD, n = 3, biological replicates) and mRNA level of Myc (Mean with SD, n = 3 PCR replicates) are shown. Statistical analysis was performed using ordinary one-way ANOVA with the vector control. ****p < 0.0001.
Figure 1—figure supplement 1
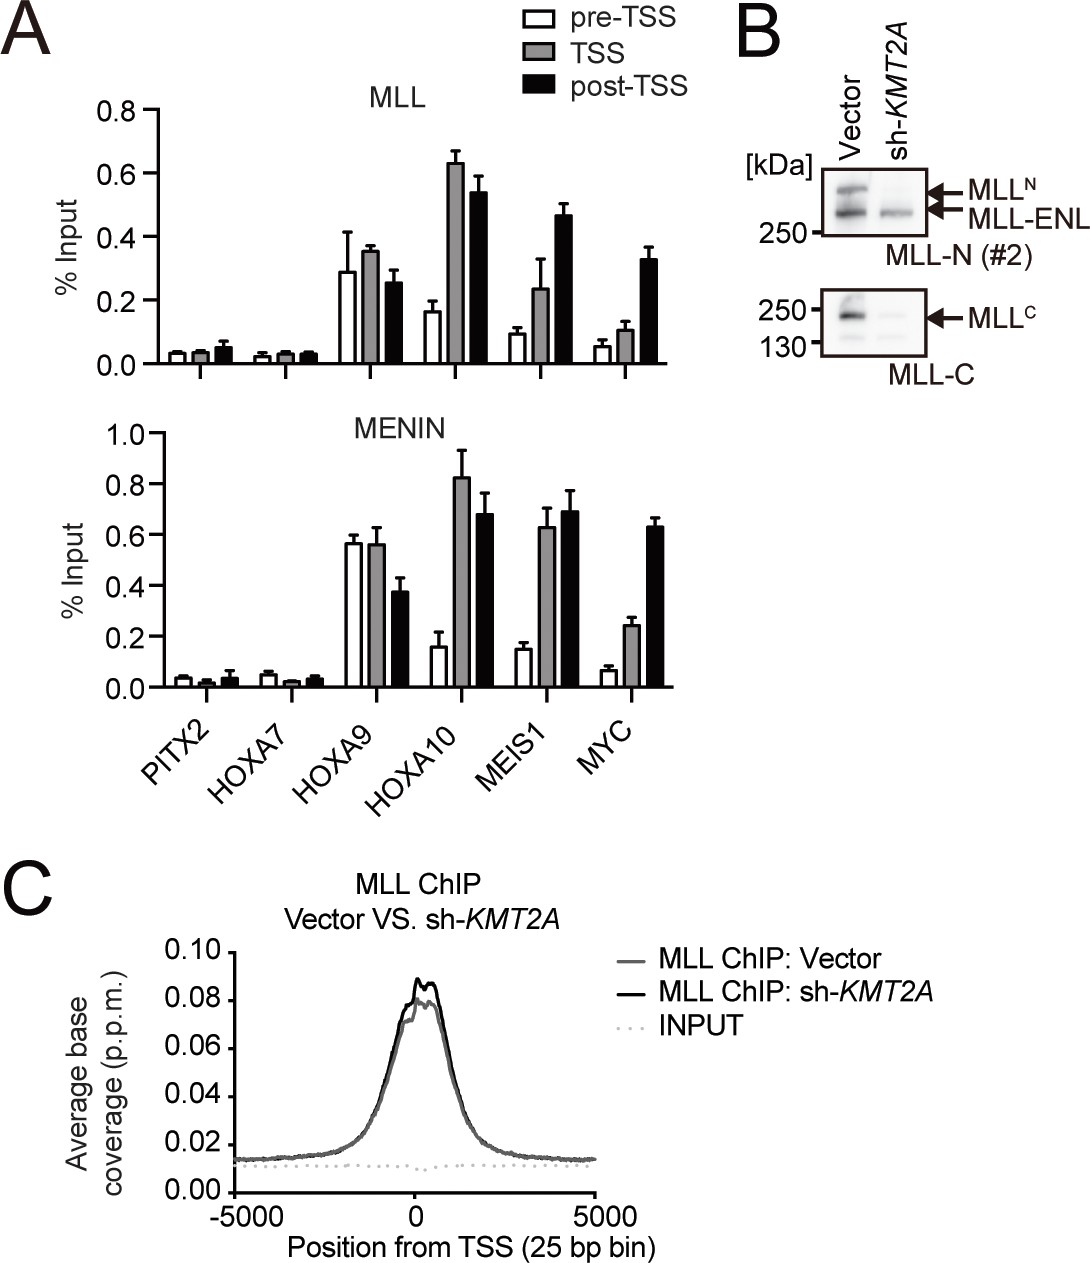
Association of the MLL-ENL complex on target promoters.
(A) Genomic localization of the MLL-ENL complex in HB1119 cells. ChIP-qPCR was performed using anti-MLL and MENIN antibodies. Precipitated DNA was subjected to qPCR using specific probes for the pre-TSS (−1.0 to −0.5 kb from the TSS), TSS (0 to 0.5 kb from the TSS), and post-TSS (1.0 to 1.5 kb from the TSS) regions of the indicated genes. ChIP signals were expressed as the percent input (Mean with SD, n = 3, PCR replicates). (B) Depletion of wildtype (wt) MLL in HB1119 cells. HB1119 cells were transduced with shRNA specific for wt MLL, but not MLL-ENL (sh-KMT2A). Protein expression of MLL-ENL and wt MLL was analyzed by western blotting using specific antibodies against the N-terminal epitope of wt MLL, which is retained by both the MLLN fragment of wt MLL and MLL-ENL, and the C-terminal epitope, which is retained only by the MLLC fragment of wt MLL (Yokoyama et al., 2002). (C) Distribution patterns of MLL proteins at gene promoters in wt MLL-depleted cells. The distribution pattern of MLL ChIP signals around transcription start sites (TSSs) in HB1119 cells with or without knockdown of wt MLL was analyzed in a genome wide manner. The data are partially redundant with our previous report (Okuda et al., 2017).
© 2017, American Society for Clinical Investigation. The gel images in panel B are reprinted from Supplemental Figure 3 of our previous report Okuda et al., 2017, with permission from the Journal of Clinical Investigation. This panel is not covered by the CC-BY 4.0 license and its further reproduction would need permission from the copyright holder
Figure 1—figure supplement 2
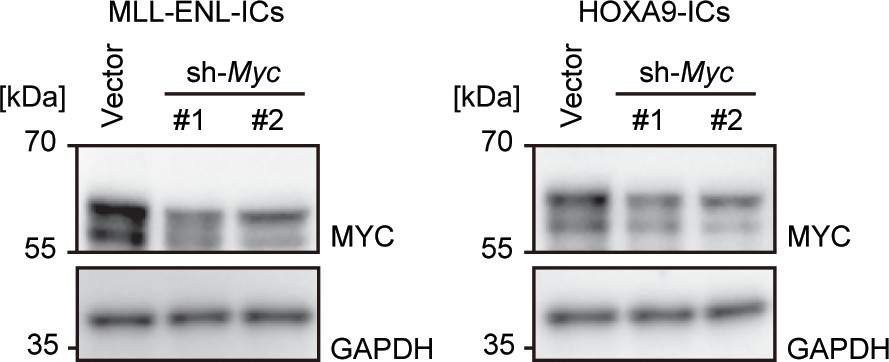
Expression of the MYC protein after Myc knockdown.
Western blotting was performed on MLL-ENL- and HOXA9-ICs to demonstrate the knockdown effects of shRNA for Myc.
Figure 2 with 1 supplement
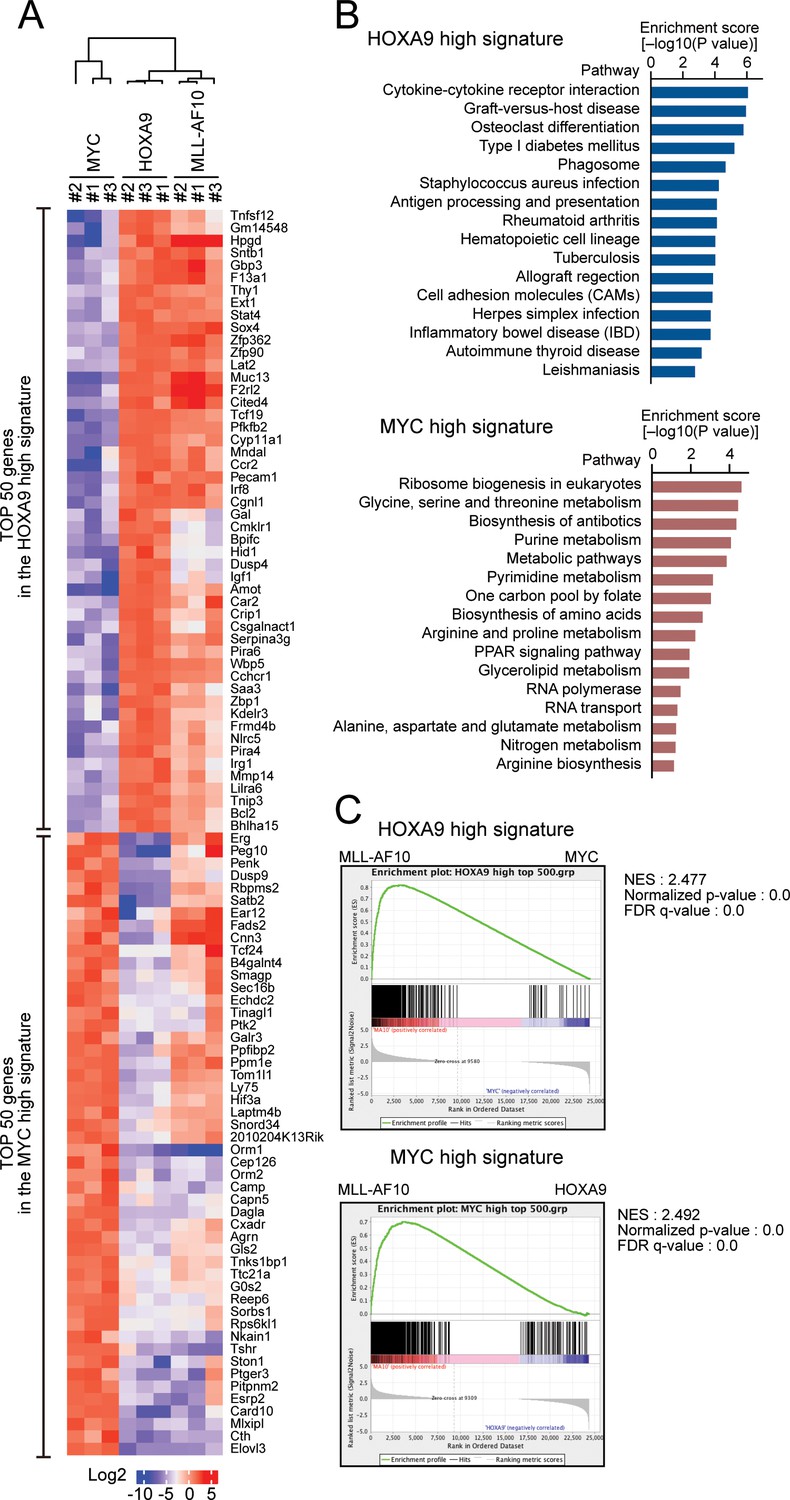
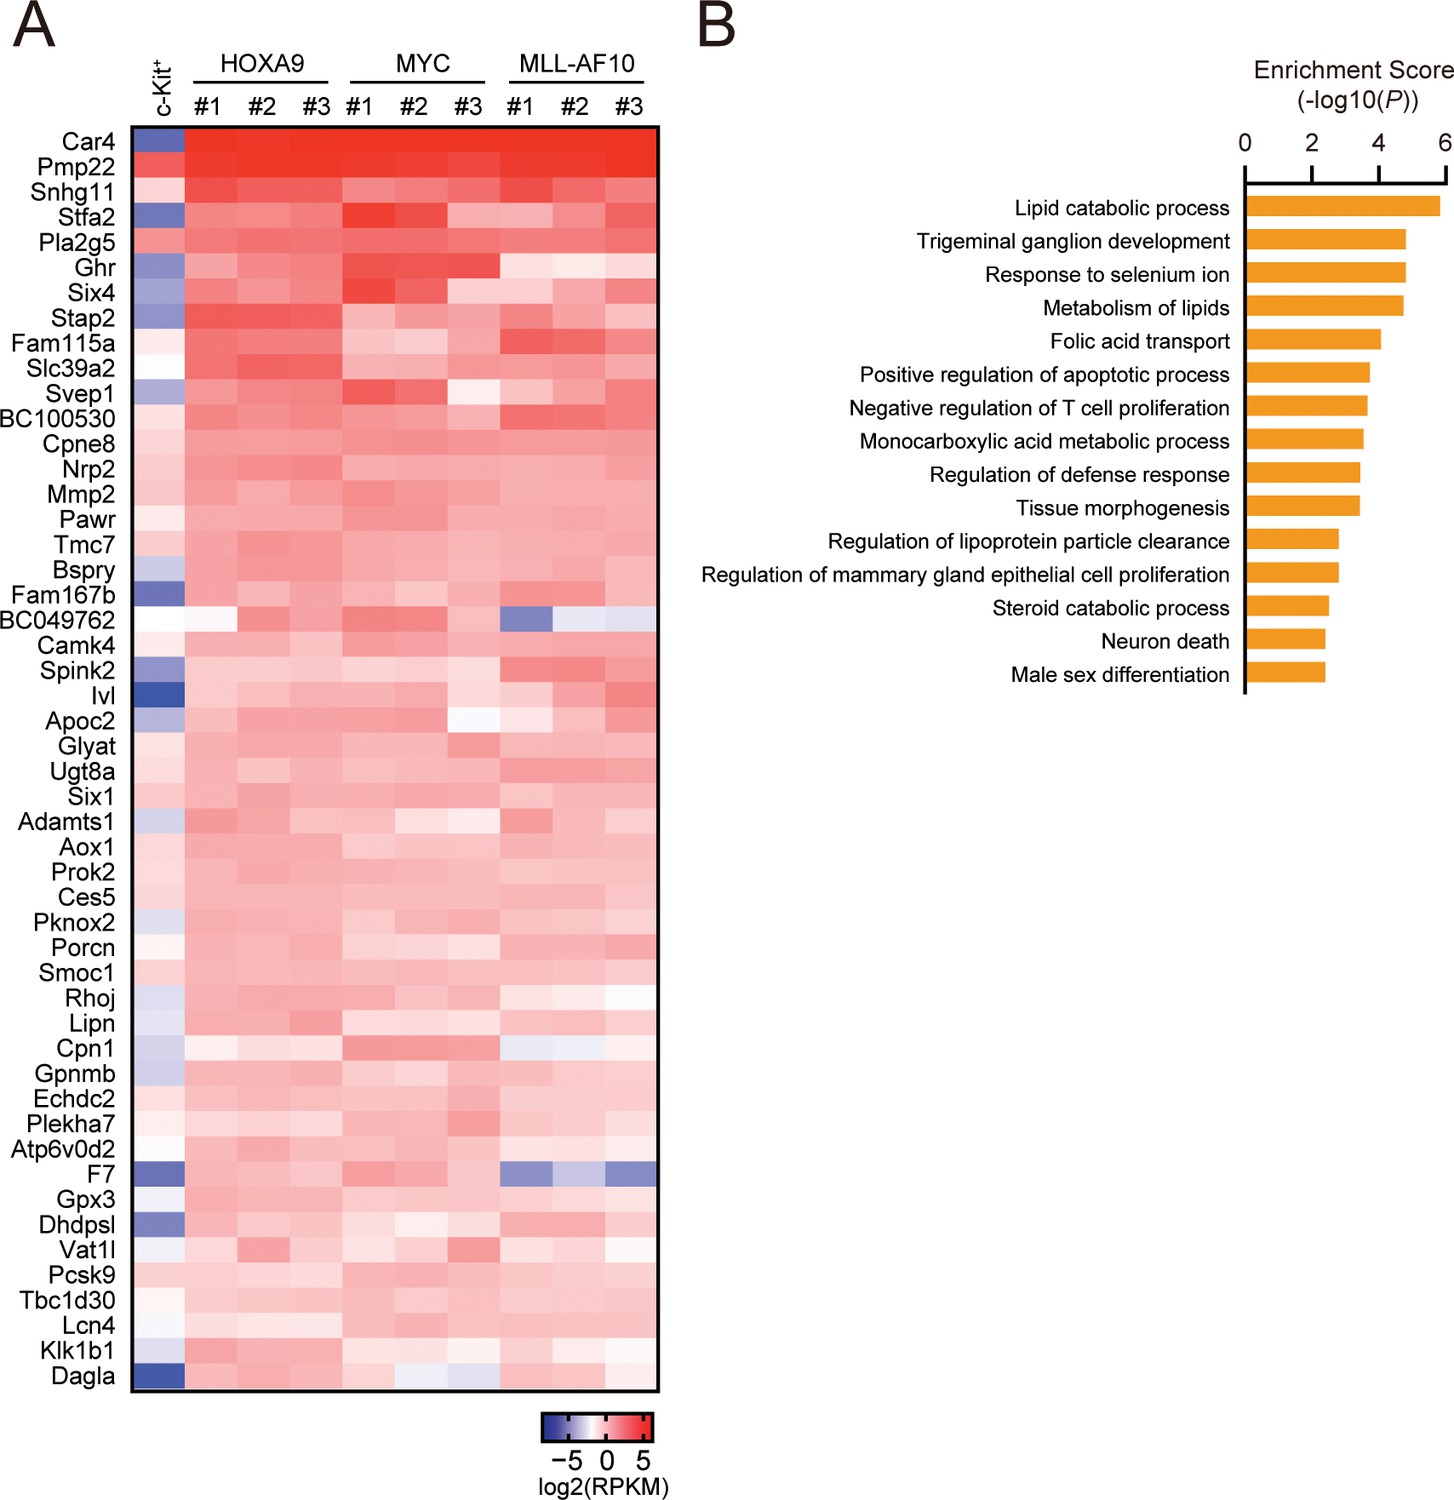
HOXA9 confers the identity of a hematopoietic precursor while MYC drives anabolic pathways.
(A) Relative expression of the top 50 genes categorized as the HOXA9 high signature and the MYC high signature in HOXA9-, MYC-, and MLL-AF10-ICs. The RPKM data are provided in Figure 2—source data 1. (B) Pathways related to the HOXA9 high signature (blue) and the MYC high signature (red). The top 500 genes in the HOXA9 high or MYC high signatures were subjected to KEGG pathway analysis. The summary is provided in Figure 2—source data 1 (C) Gene set enrichment analysis of the HOXA9 high and MYC high signatures in MLL-AF10-ICs compared with MYC-ICs (top) and HOXA9-ICs (bottom), respectively.
-
Figure 2—source data 1
Gene expression profiles of HOXA9-, MYC-, and MLL-AF10-transformed cells.
- https://cdn.elifesciences.org/articles/64148/elife-64148-fig2-data1-v1.xlsx
Figure 2—figure supplement 1
Biological pathways commonly regulated by HOXA9 and MYC.
(A) Genes commonly regulated by HOXA9 and MYC. ICs used in Figure 2A and freshly prepared cKit+ cells were analyzed by RNA-seq. A representative set of commonly upregulated genes in HOXA9- and MYC-ICs compared to cKit+ cells are shown in a heatmap. (B) Pathways commonly regulated by HOXA9 and MYC. Genes exhibiting > 2-fold increase commonly in HOXA9- and MYC-ICs compared to c-Kit+ cells were grouped as ‘HOXA9-MYC common target genes’. Go pathway analysis for top 250 HOXA9-MYC common target genes was performed.
Figure 3 with 1 supplement
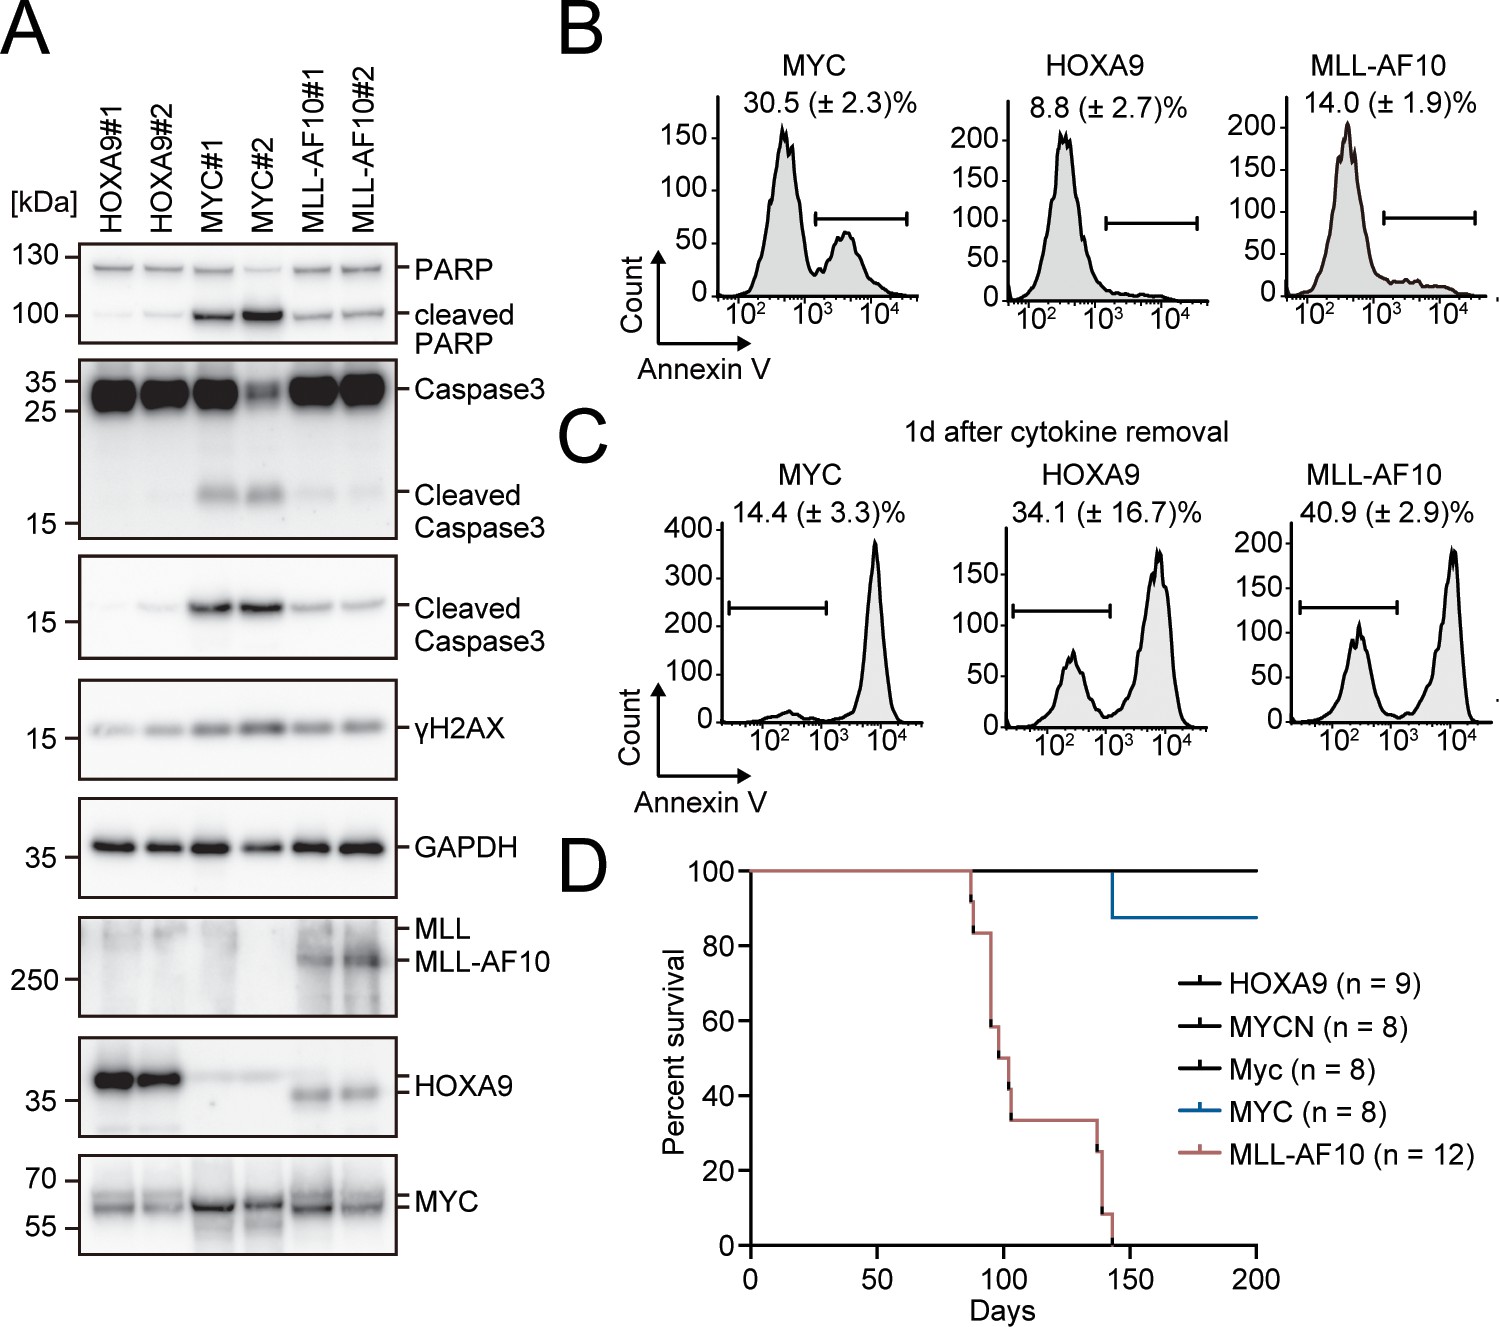
Apoptosis is induced by MYC, while is alleviated by HOXA9 and MLL-AF10.
(A) Protein expression of transgenes and apoptotic markers in HOXA9-, MYC-, and MLL-AF10-ICs. (B and C) Apoptotic tendencies of HOXA9-, MYC-, and MLL-AF10-ICs. Representative FACS plots and the summarized data (Mean with SD, n = 3, biological replicates) of Annexin V staining of HOXA9-, MYC-, and MLL-AF10-ICs in the presence of cytokines (B) and 1d after their removal (C) are shown. (D) In vivo leukemogenic potential of MLL target genes and MLL-AF10. Kaplan-Meier curves of mice transplanted with HPCs transduced with the indicated genes and the number of replicates are shown.
Figure 3—figure supplement 1
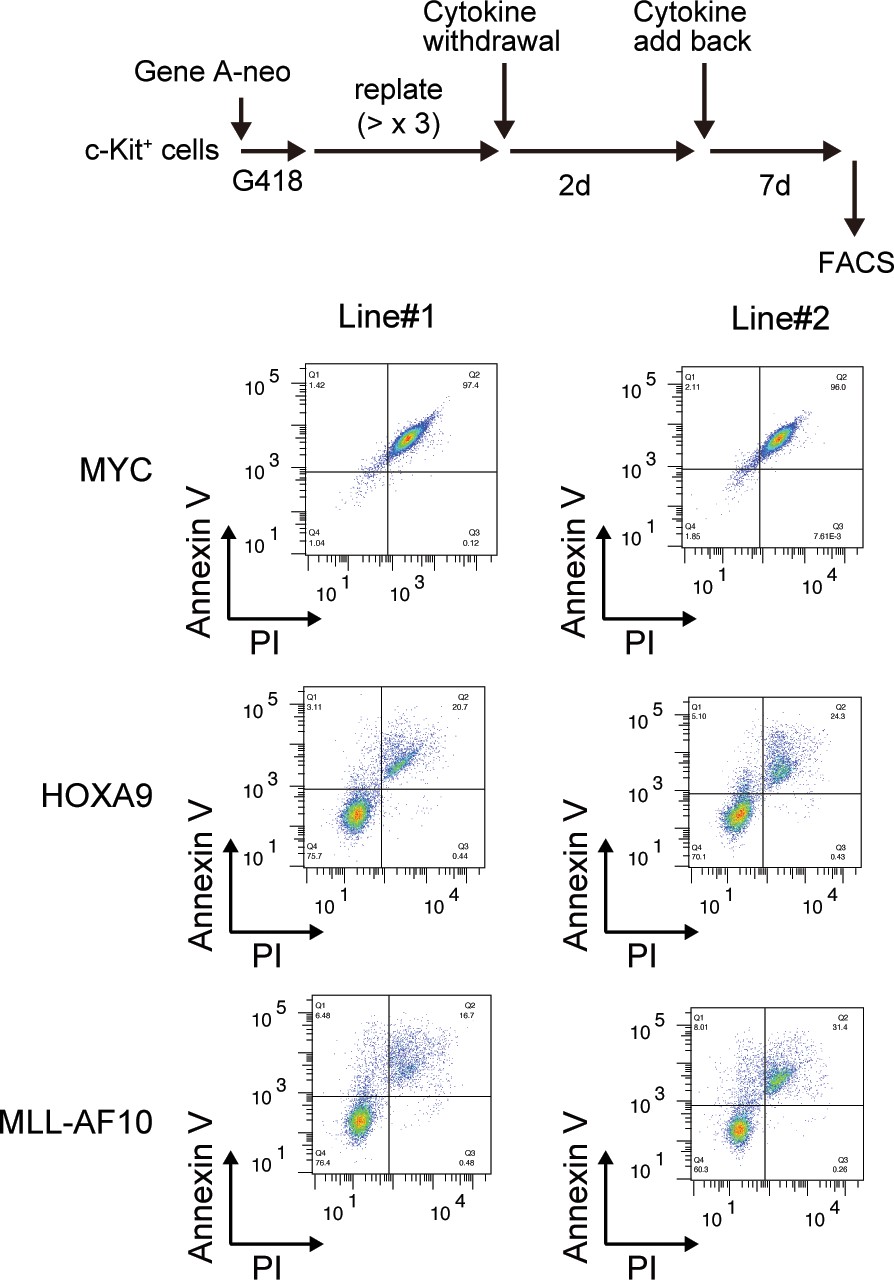
| Survival of HOXA9-expressing cells upon cytokine withdrawal.
MYC-, HOXA9-, MLL-AF10-ICs were subjected to cytokine withdrawal for 2 days, then cultured in the presence of cytokines for 7 days, and examined by FACS for Annexin V- and Propidium Iodide (PI)-positivity.
Figure 4 with 4 supplements
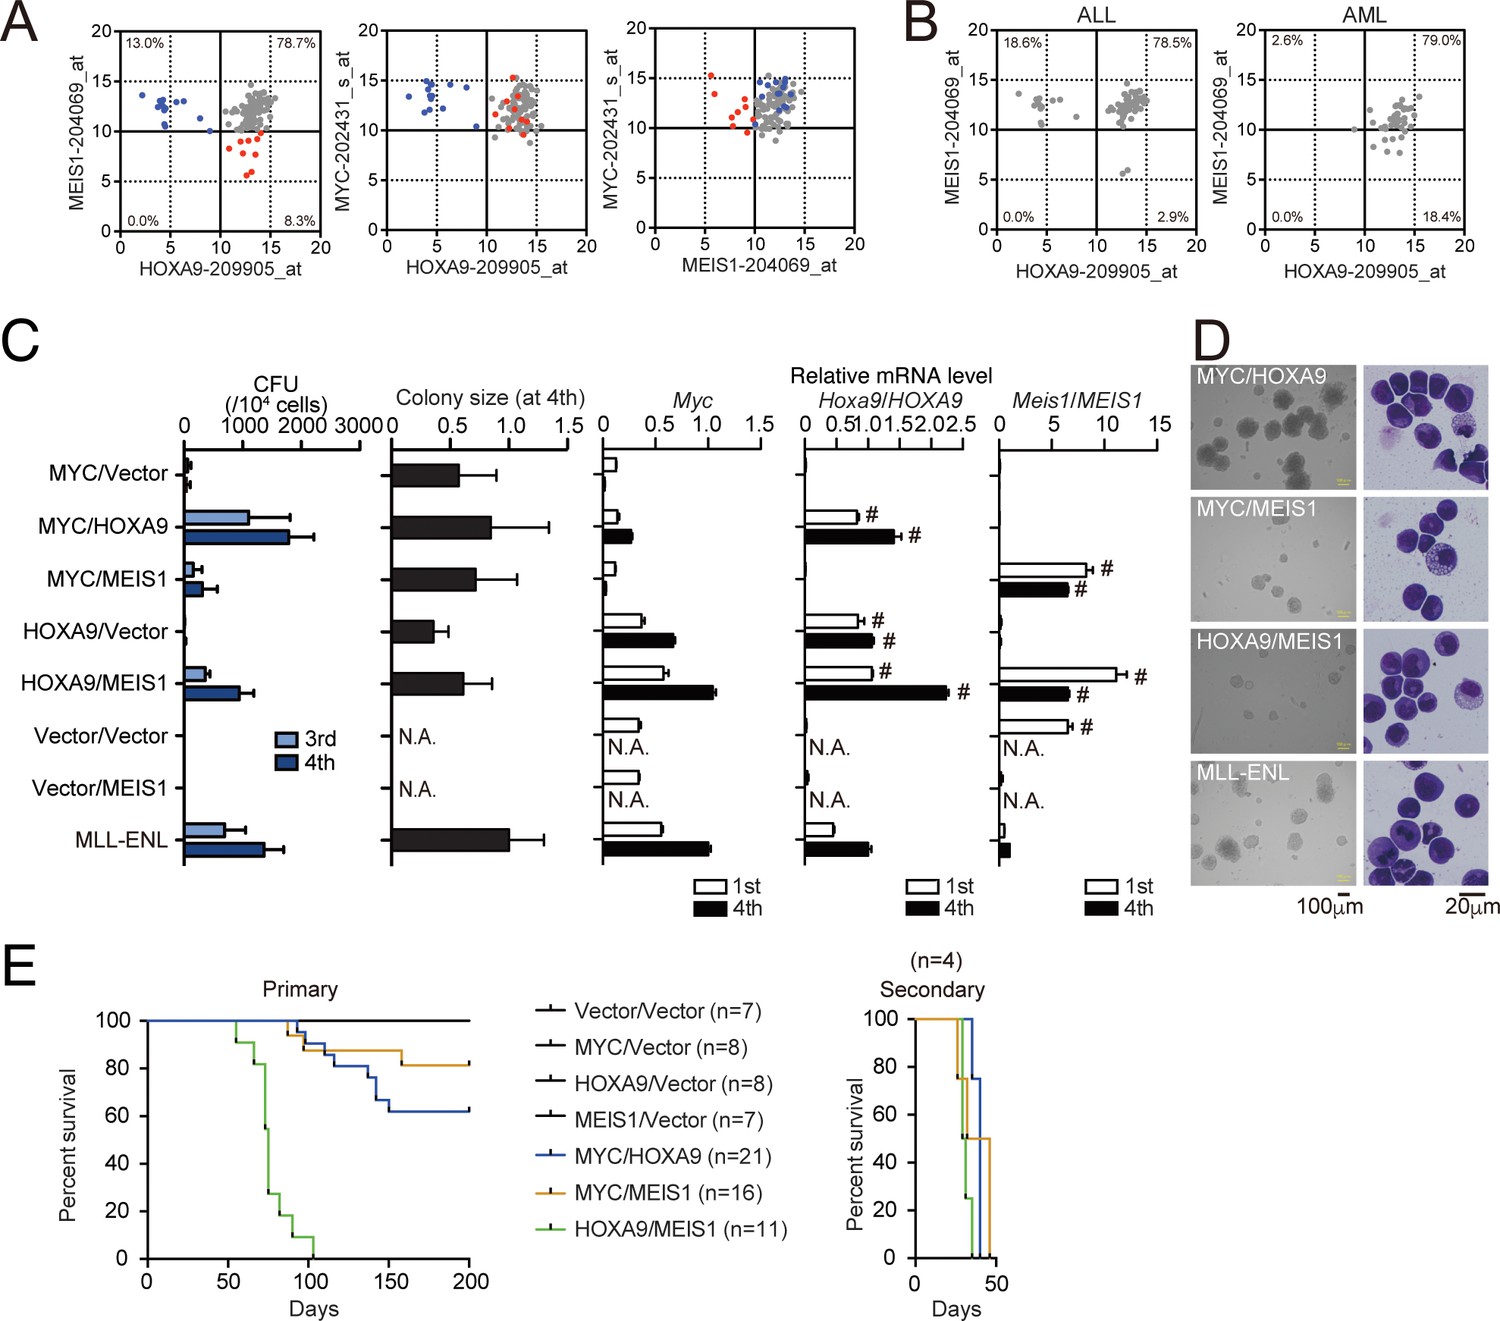
HOXA9 promotes MYC-mediated leukemogenesis.
(A and B) Expression profiles of MLL fusion-mediated leukemia patients reported in the MILE study (Haferlach et al., 2010). Probe intensities of the indicated genes are plotted for all MLL fusion-mediated leukemia patients (A). Patients in the HOXA9low/MEIS1high (blue) and HOXA9high/MEIS1low (red) groups are highlighted. Probe intensities of HOXA9 and MEIS1 are plotted separately by leukemia phenotype (ALL or AML) (B). The expression profiles are provided in Figure 4—source data 1. (C) Transforming potential of various combinations of MLL target genes. CFU (Mean with SD, n = 3, biological replicates) and relative colony size (Mean with SD, n ≥ 100) are shown as in Figure 1C. (D) Morphologies of the colonies and transformed cells. Bright-field (left) and May-Grunwald-Giemsa staining (right) images are shown with scale bars. (E) In vivo leukemogenic potential of various oncogene combinations. Kaplan-Meier curves of mice transplanted with HPCs transduced with the indicated genes are shown as in Figure 3D. Bone marrow cells from moribund mice were harvested and used for secondary transplantation.
-
Figure 4—source data 1
Gene expression profiles of MLL fusion-mediated leukemia patients in the MILE data.
- https://cdn.elifesciences.org/articles/64148/elife-64148-fig4-data1-v1.xlsx
Figure 4—figure supplement 1
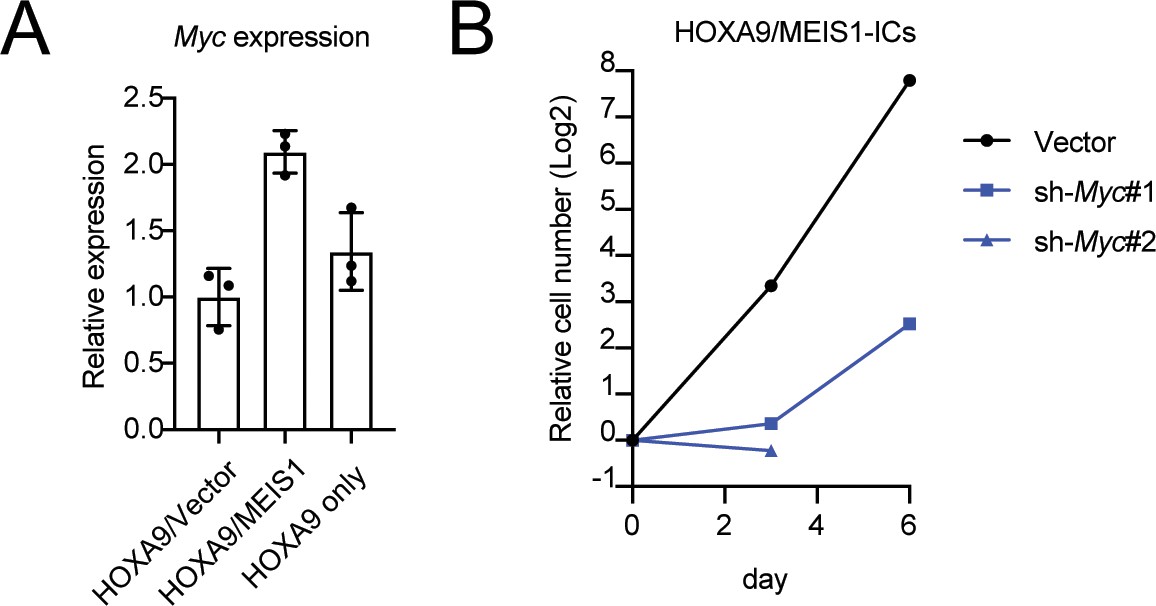
Role of MYC in HOXA9/MEIS1-mediated transformation.
(A) Myc expression levels in HOXA9- and HOXA9/MEIS1-transduced cells. Myc RNA levels of three biological replicates of indicated ICs were determined by qRT-PCR (Mean with SD). (B) Inhibition of the proliferation of HOXA9/MEIS1-transduced cells by Myc knockdown. The same shRNA used in Figure 1E were transduced to HOXA9/MEIS-ICs and their cell number was counted every 3 days.
Figure 4—figure supplement 2
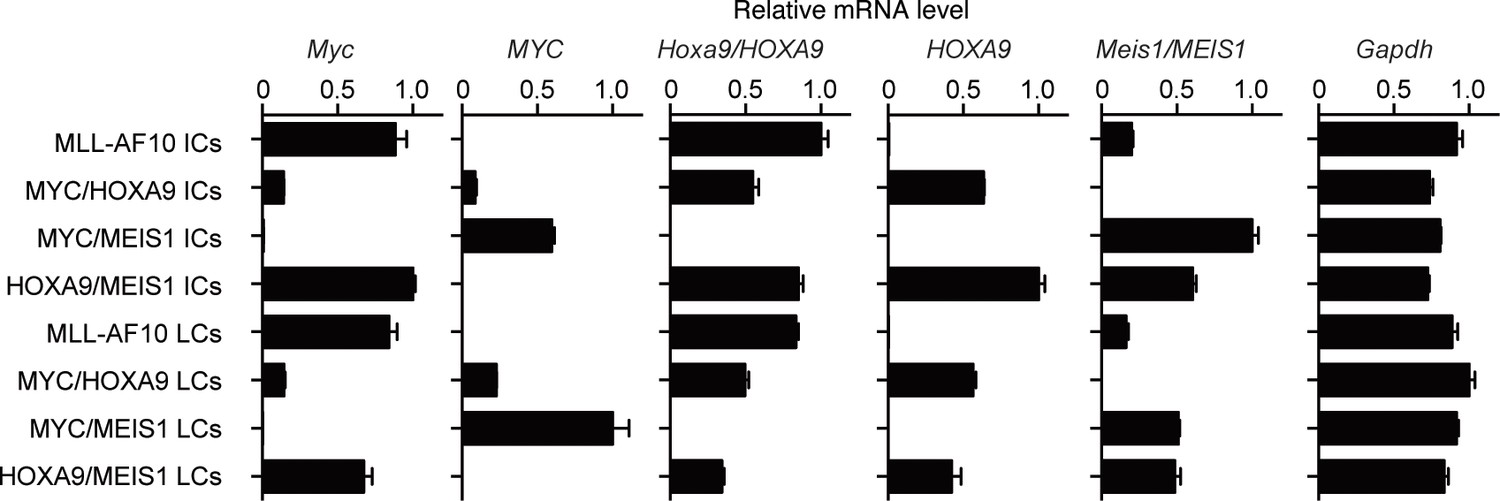
Expression of endogenous Myc and the transgenes in immortalized- and leukemia-cells.
Relative mRNA levels of the indicated genes (Mean with SD, n=3, PCR replicates) are shown along with those of the respective ICs. LCs were cultured ex vivo for several passages to remove non-leukemia cells and subjected to qRT-PCR.
Figure 4—figure supplement 3
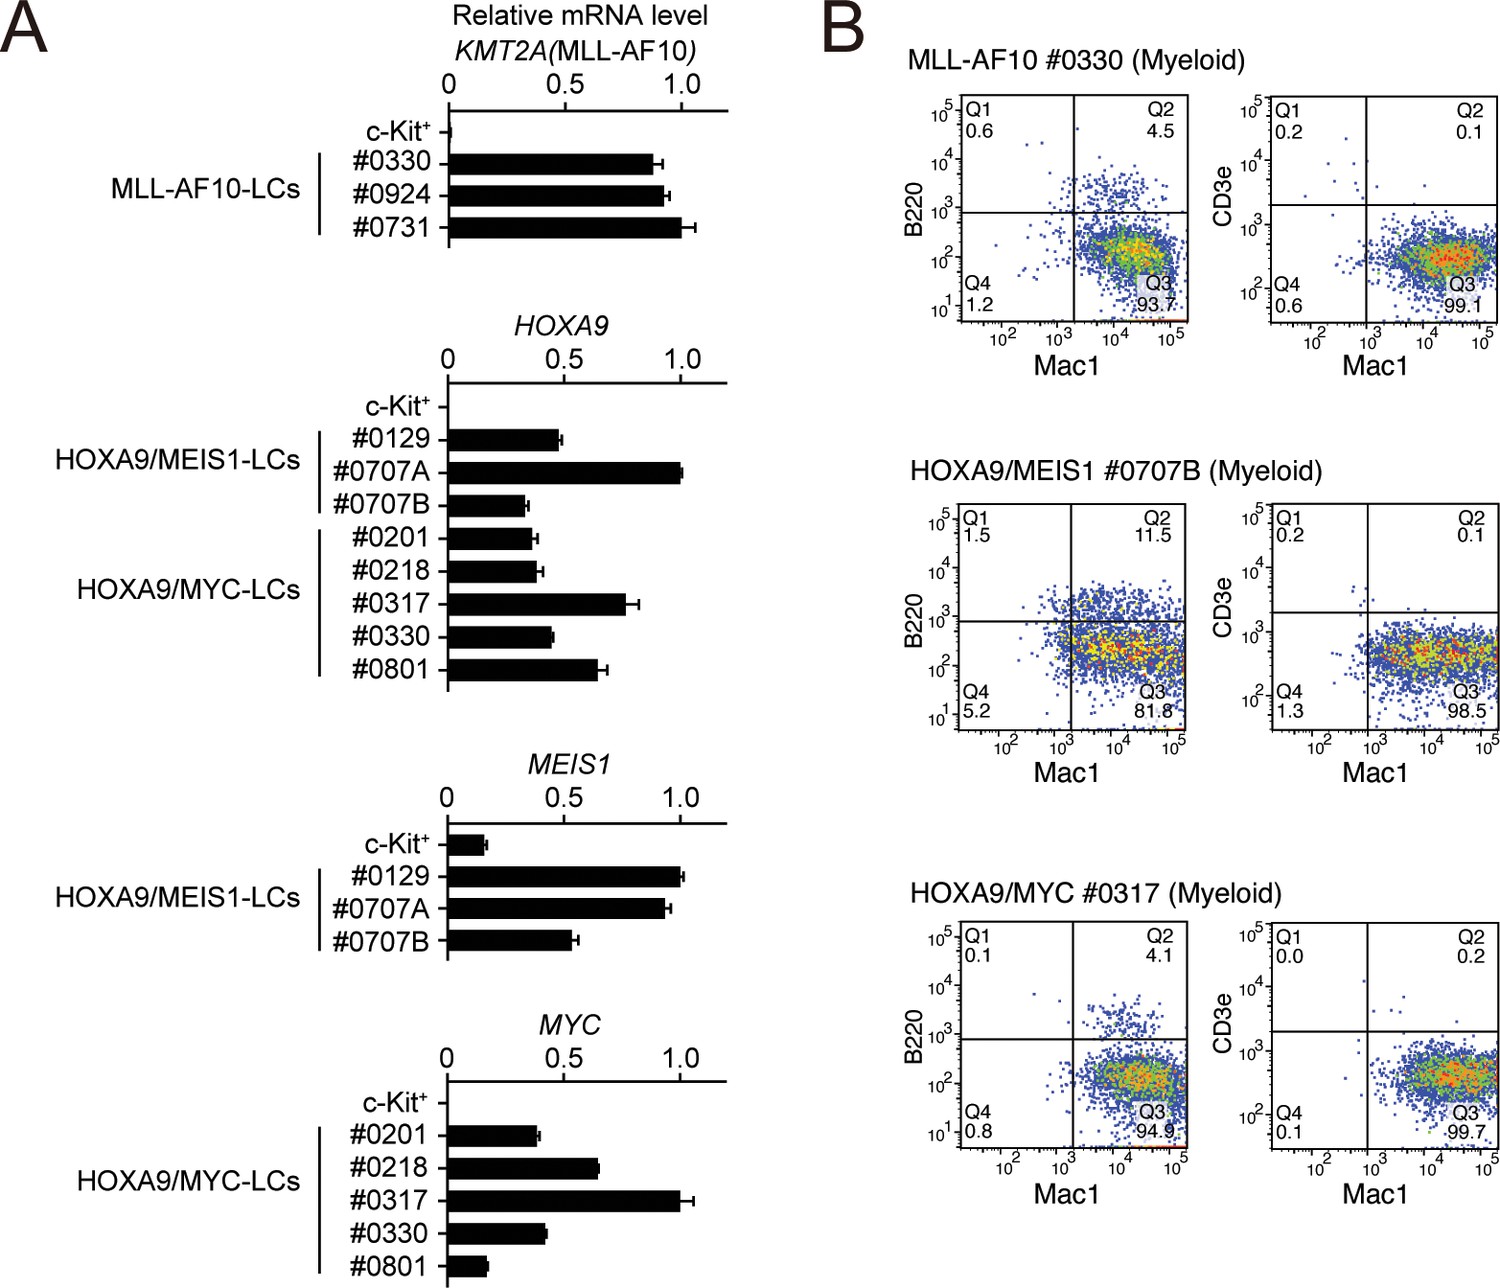
Phenotypes of MLL-AF10-, HOXA9/MEIS1-, and HOXA9/MYC-mediated leukemia cells at the endpoint.
(A) Expressions of transgenes at the endpoint in the LCs described in Figure 4E. Cells were harvested from moribund mice and were analyzed by qRT-PCR (Mean with SD, n = 3, PCR replicates). cDNA of c-Kit+ cells were used as negative control. (B) Immunophenotype of the leukemia cells in Figure 4E. Cells were harvested from moribund mice and were analyzed by FACS using indicated antibodies.
Figure 4—figure supplement 4
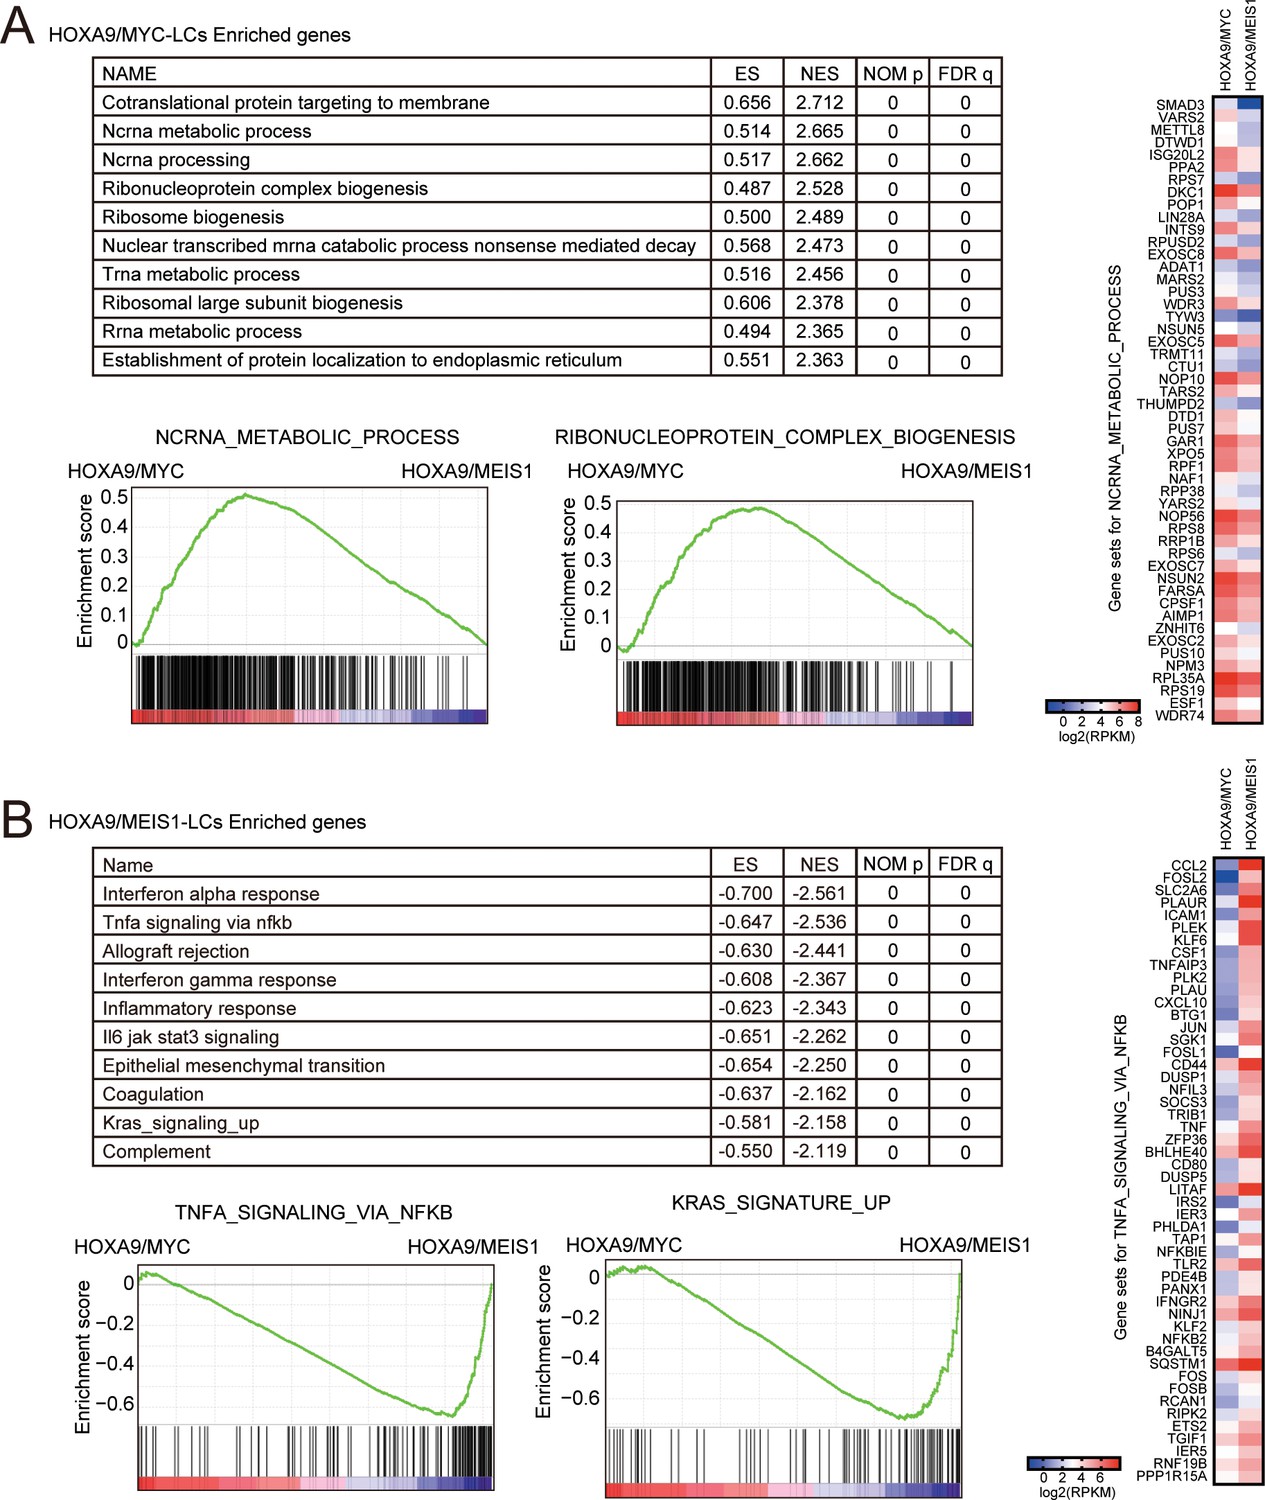
Biological pathways differentially regulated in HOXA9/MYC- and HOXA9/MEIS1-driven leukemias.
(A) Pathways upregulated uniquely by HOXA9/MYC compared to HOXA9/MEIS1. Gene set enrichment analysis for HOXA9/MYC-LCs was performed against HOXA9/MEIS1-LCs. Ten representative enriched pathways and two of their enrichment curves are shown. A heatmap of the expression levels of ‘ncRNA metabolic process’ genes is shown on the right. (B) Pathways upregulated uniquely by HOXA9/MEIS1 compared to HOXA9/MYC. Gene set enrichment analysis is performed as in A. A heatmap of the expression levels of ‘TNFα signaling via NFκB’ genes is shown on the right.
Figure 5 with 2 supplements
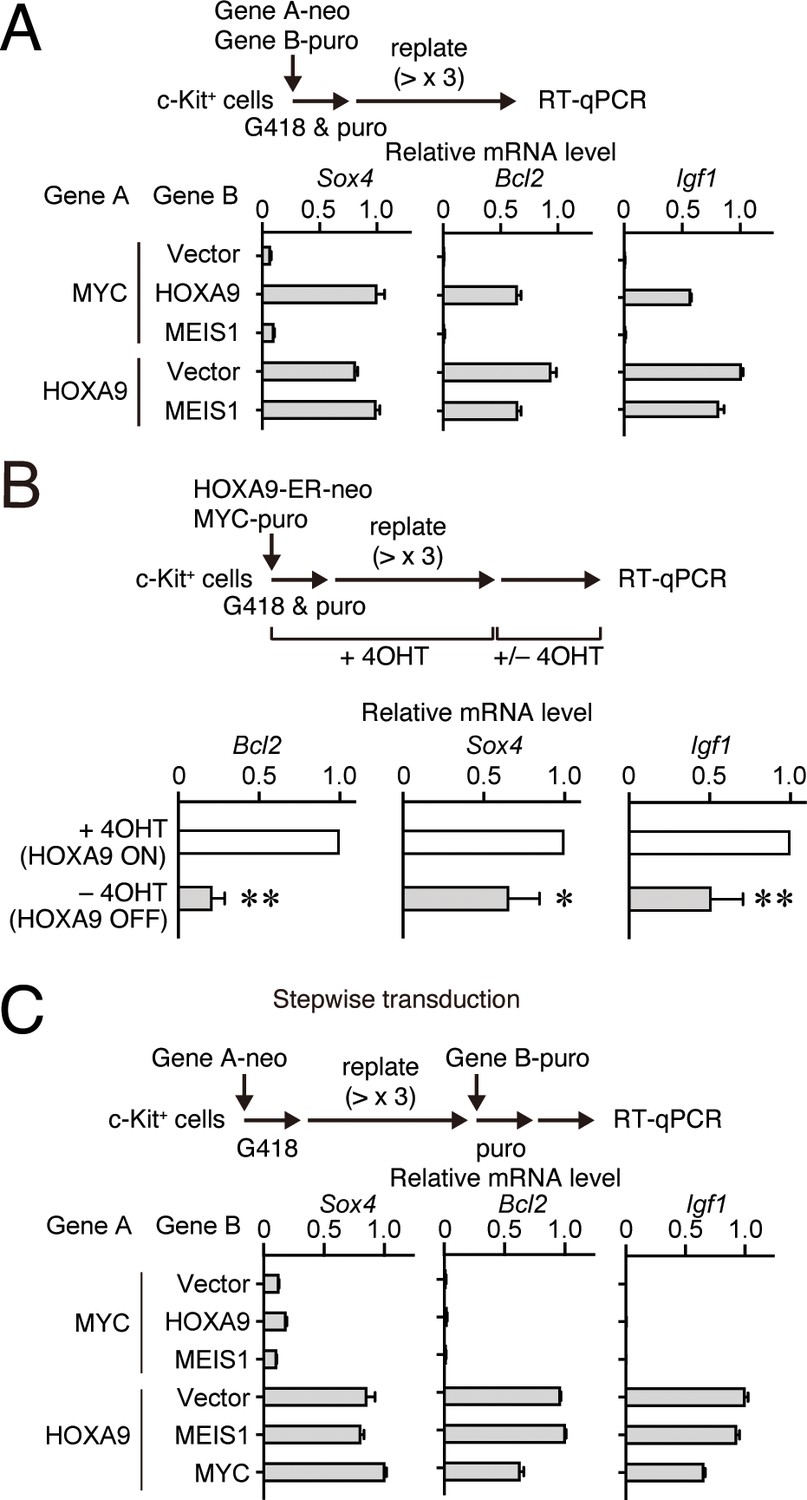
HOXA9 functions as a transcription maintenance factor.
(A) Gene expression of HPCs immortalized by various transgenes. Relative mRNA levels of HOXA9 target genes (Mean with SD, n = 3, PCR replicates) in myeloid progenitors transformed by various combinations of MLL target genes are shown. Two genes were transduced into HPCs in a simultaneous manner. (B) Gene expression after inactivation of HOXA9. HOXA9-ER and MYC were doubly transduced into HPCs and cultured in the presence of 4-OHT ex vivo. After 4-OHT withdrawal, qRT-PCR analysis was performed for the indicated genes (Mean, n=4, biological replicates). Statistical analysis was performed using unpaired two-tailed Student’s t-test. **p< 0.01, *p < 0.05. (C) Gene expression of HPCs immortalized by step-wise transduction of various transgenes. Relative mRNA levels of HOXA9 target genes in myeloid progenitors transformed by various combinations of MLL target genes are shown as in A. Two genes were transduced into HPCs in a stepwise manner.
Figure 5—figure supplement 1
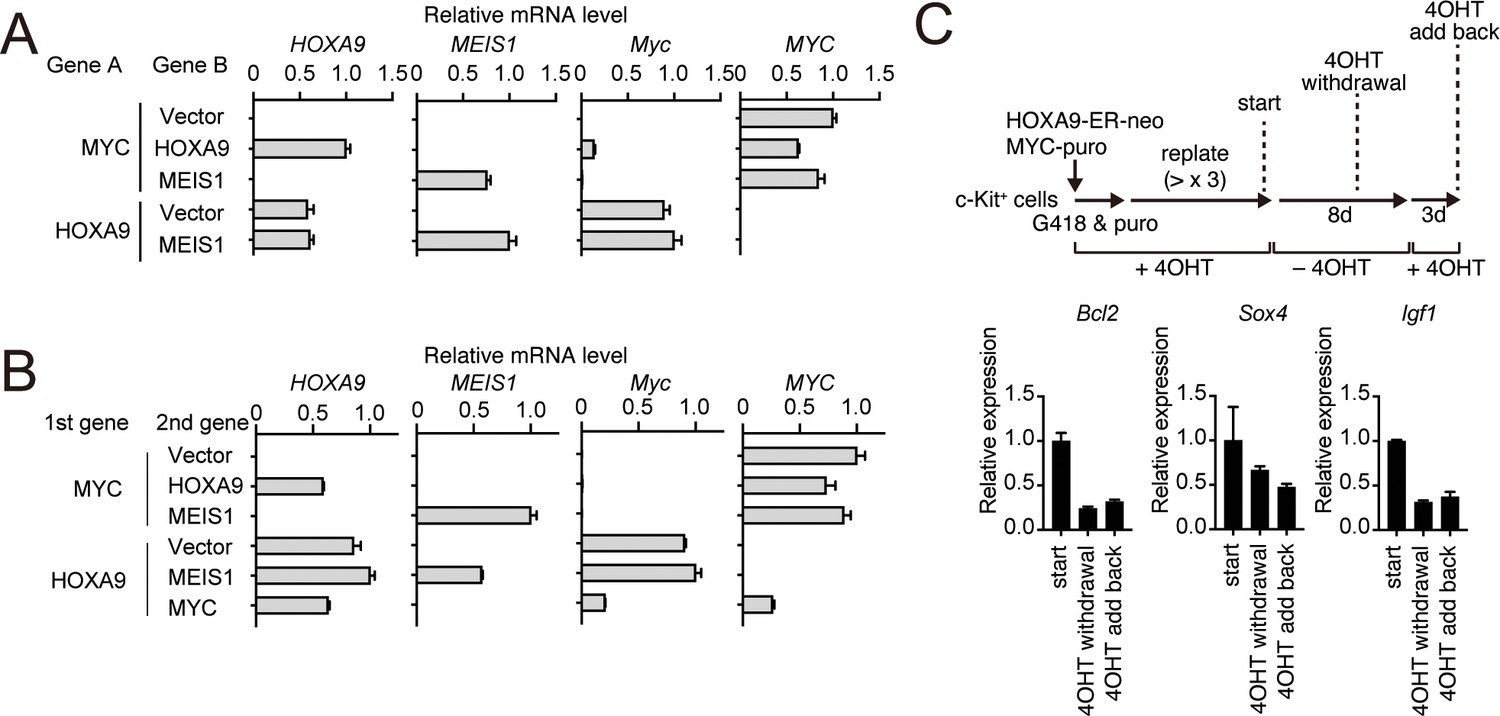
HOXA9-dependent gene expression of various HOXA9 target genes.
(A) Relative mRNA levels of the transgenes and endogenous Myc in the cells used in Figure 5A. (B) Relative mRNA levels of the transgenes and endogenous Myc in the cells used in Figure 5C. (C) Expression of HOXA9 target genes during the inactivation and subsequent reactivation of HOXA9. Schema is shown on top. qRT-PCR was performed at the indicated time point (Mean with SD, n = 3, PCR replicates).
Figure 5—figure supplement 2
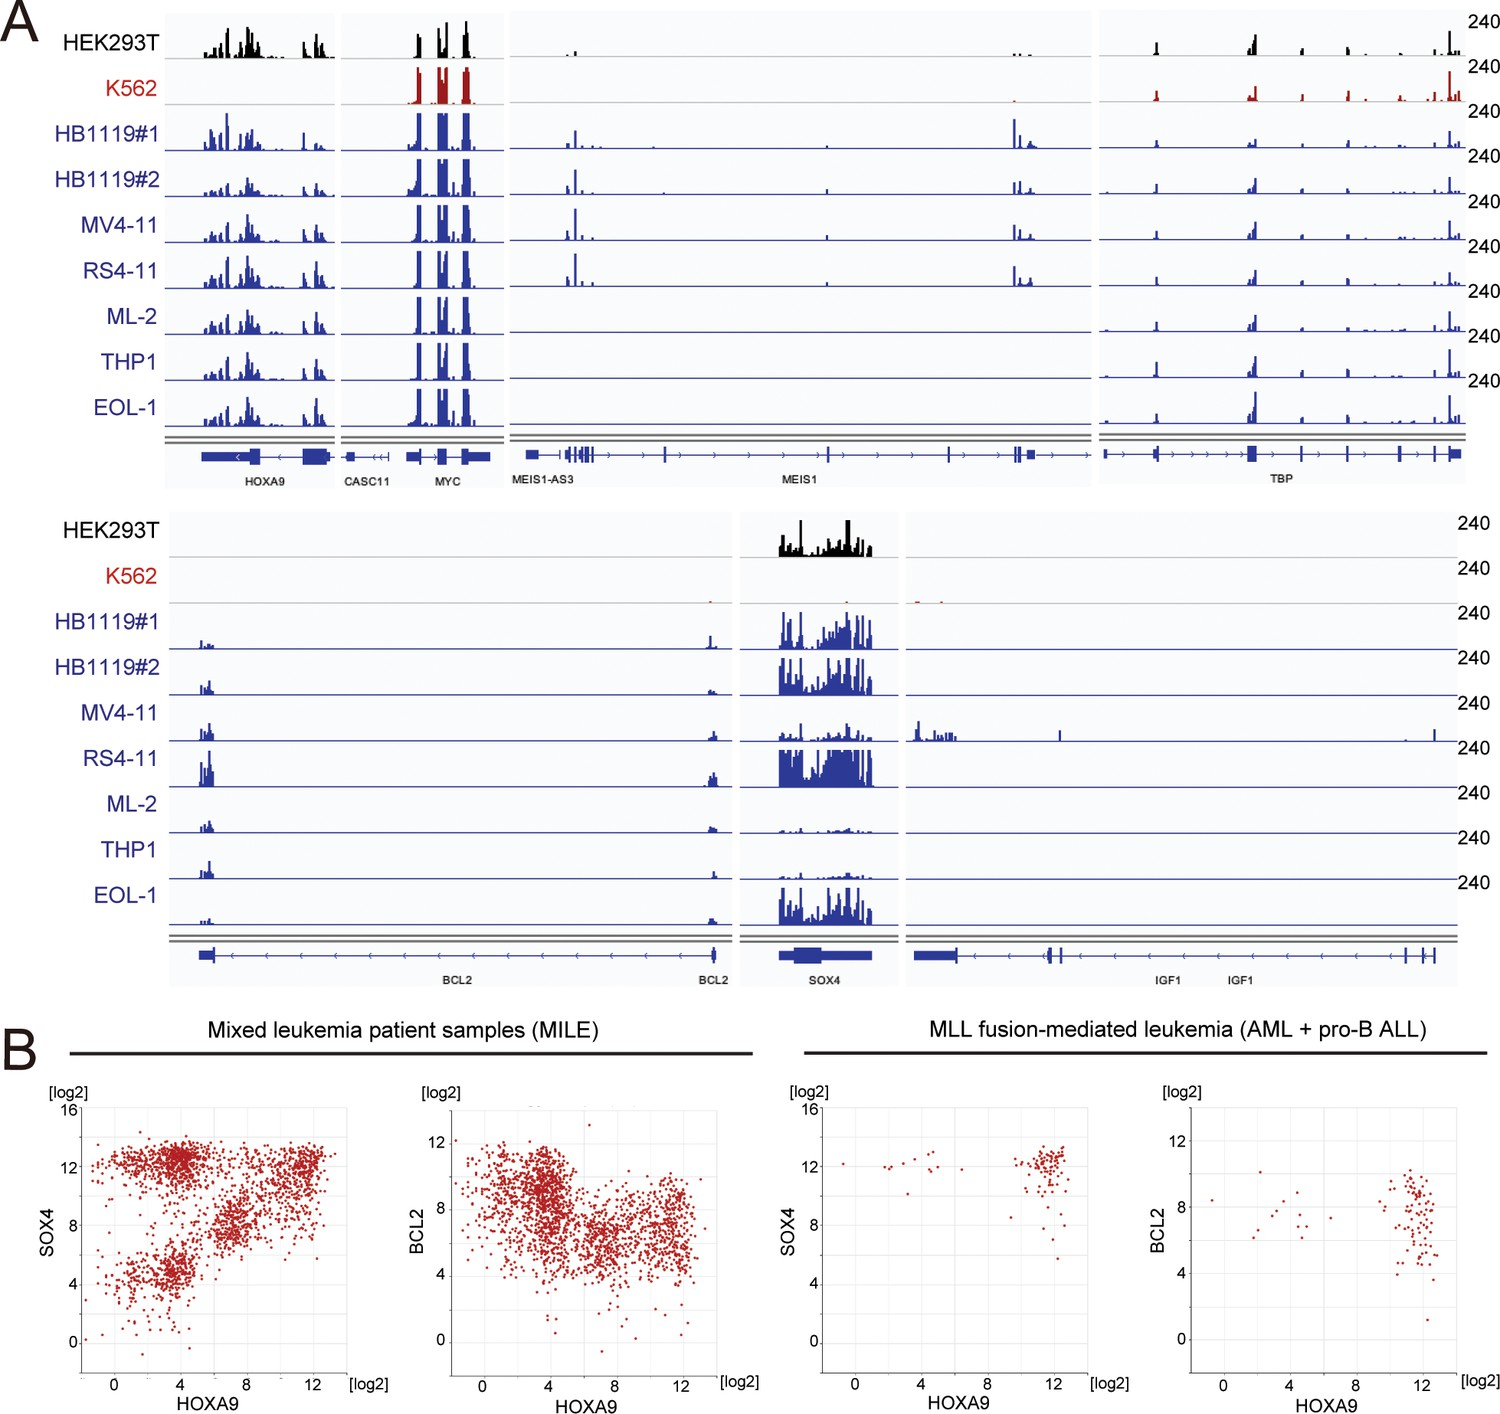
Gene expression of various HOXA9 target genes in cell lines and patients.
(A) RNA-seq analysis of various MLL fusion cell lines (highlighted in blue). Non-MLL fusion cell lines (i.e. HEK293T and K562) were included for comparison. HB1119 cells were analyzed in duplicates. (B) Relative expression of HOXA9 and its target genes in leukemia patients of the MILE study (Haferlach et al., 2010). Relative expression levels of HOXA9 compared with SOX4 or BCL2 are shown in all of the mixed leukemia samples (left) and MLL fusion-mediated leukemia (AML and pro-B ALL) samples (right).
Figure 6 with 1 supplement
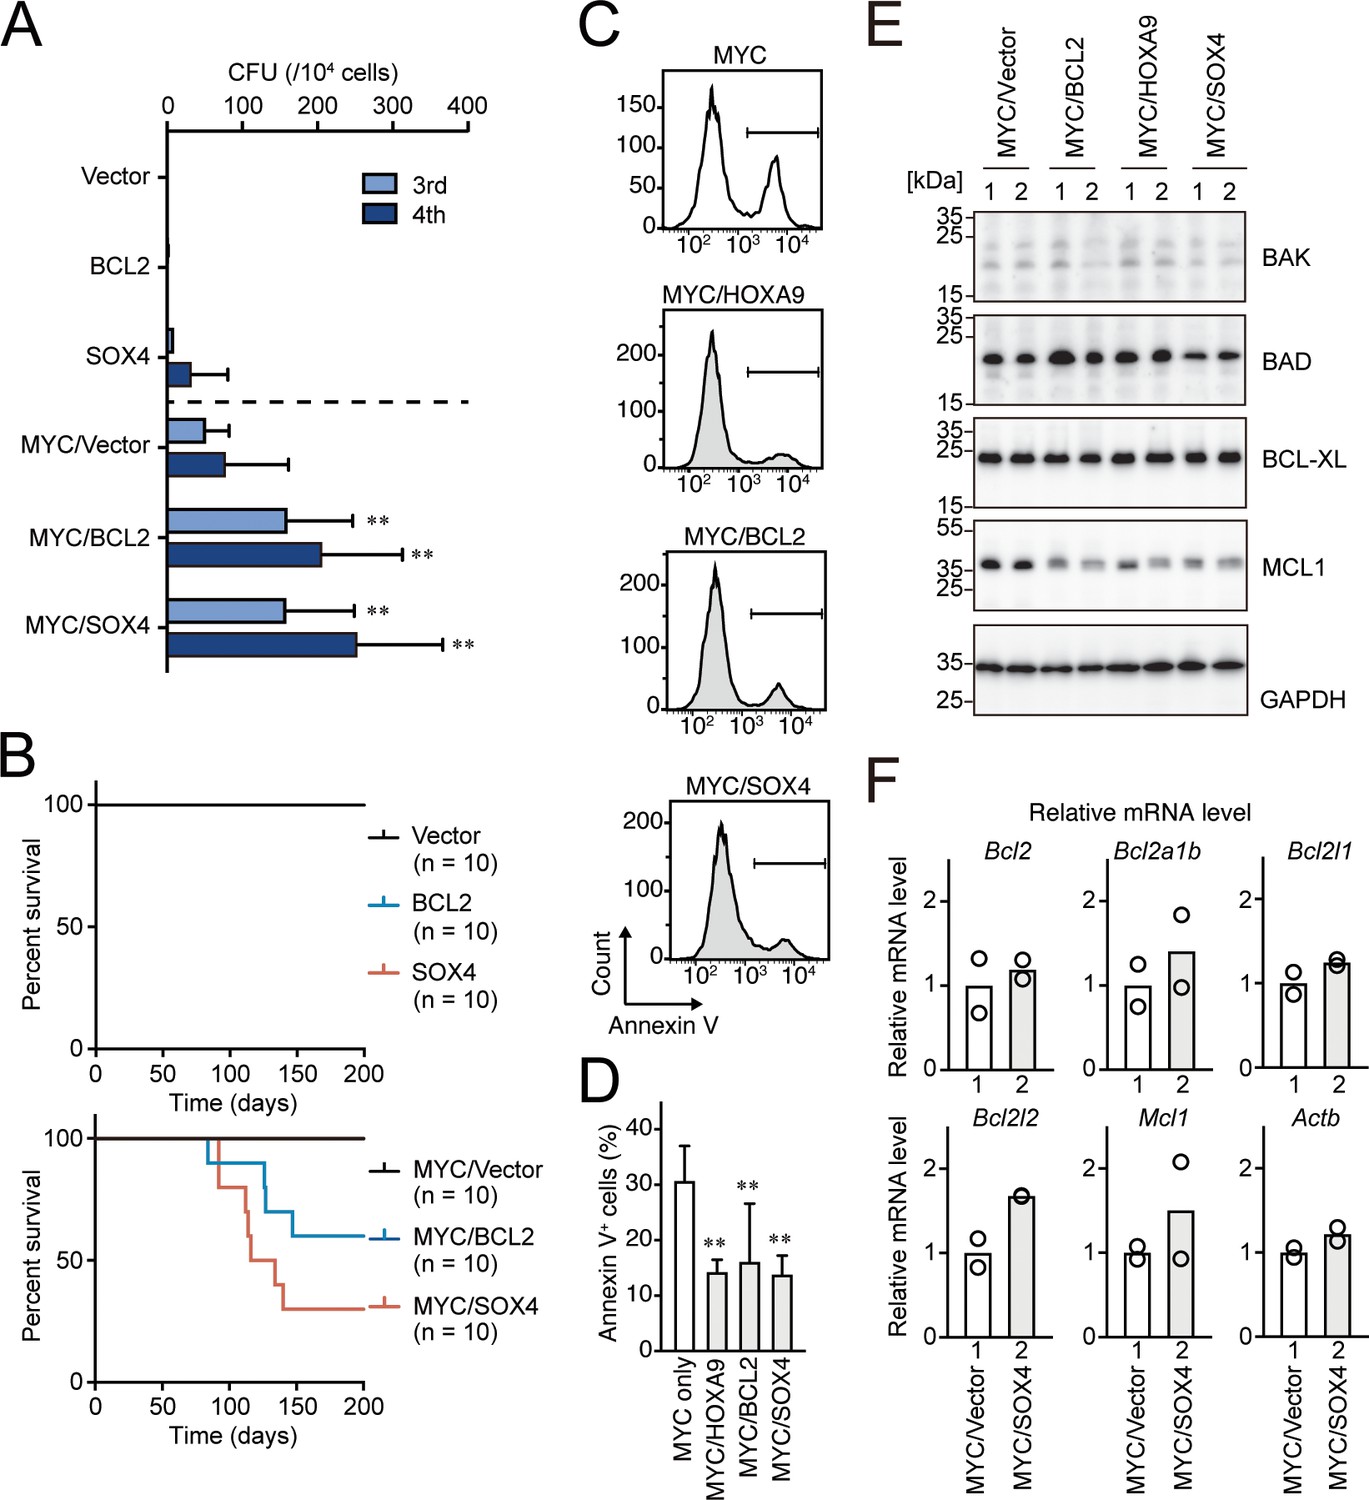
BCL2 and SOX4 promote MYC-mediated leukemogenesis by alleviating apoptosis.
(A) Transforming potential of various combinations of MYC and HOXA9 target genes. CFU (Mean with SD, n = 3, biological replicates) is shown as in Figure 1C. (B) In vivo leukemogenic potential of various combinations of MYC and HOXA9 target genes. Kaplan-Meier curves of mice transplanted with HPCs transduced with the indicated genes are shown as in Figure 3D. (C and D) Apoptotic tendencies of MYC-expressing progenitors co-transduced with HOXA9, BCL2, or SOX4. Representative FACS plots (C) and the summarized data (D) (Mean with SD, n = 3, biological replicates) of Annexin V staining are shown. Statistical analysis was performed using ordinary one-way ANOVA with MYC-ICs. (E) Expression of apoptosis-related proteins in HPCs transformed by various combinations of transgenes. Western blots of HPCs transformed by indicated transgenes are shown (F) Relative expression levels of apoptosis-related genes in MYC/SOX4-ICs and MYC/vector-ICs. Relative mRNA levels of the indicated apoptosis-related genes (Mean, n = 2, biological replicates) are shown.
Figure 6—figure supplement 1
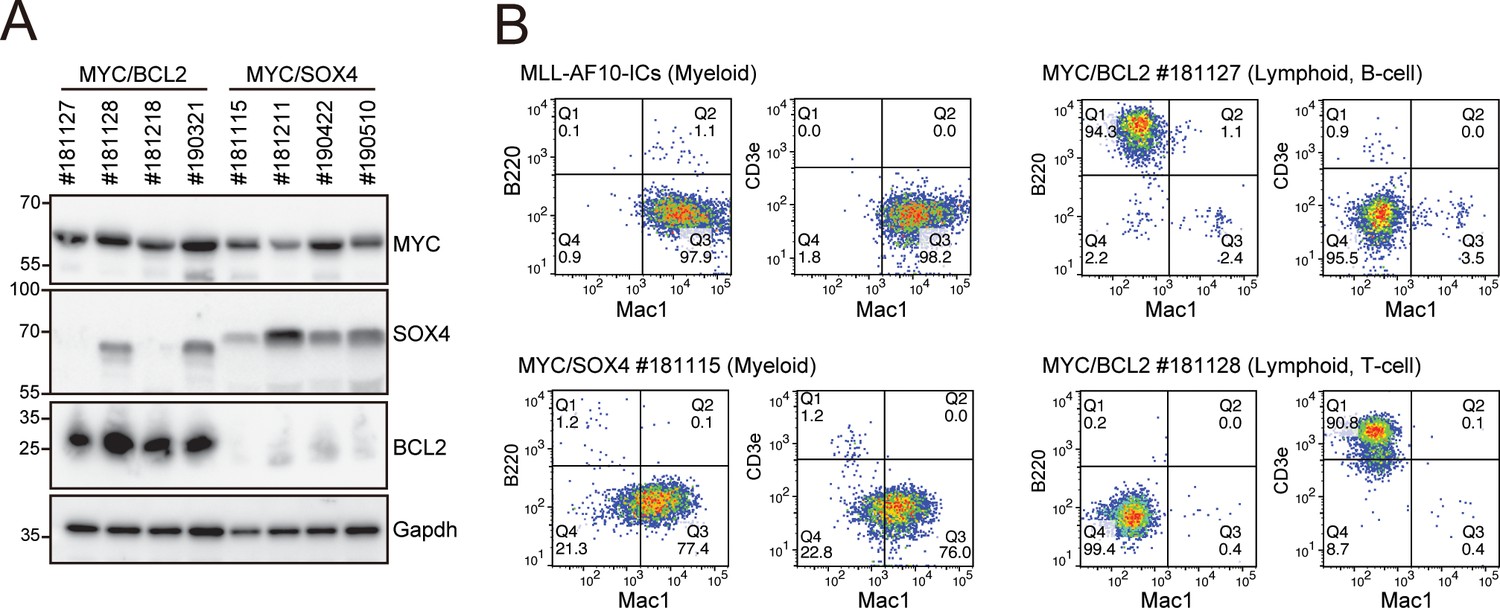
Phenotypes of MYC/BCL2- and MYC/SOX4-mediated leukemias at the endpoint.
(A) Expression of the transgenes in LCs induced by various combinations of transgenes. LCs were harvested from moribund mice (n = four each) and analyzed by western blotting. (B) Immunophenotype of LCs induced by various combinations of transgenes. Cells were harvested from moribund mice and were analyzed by FACS using indicated antibodies.
Figure 7 with 3 supplements
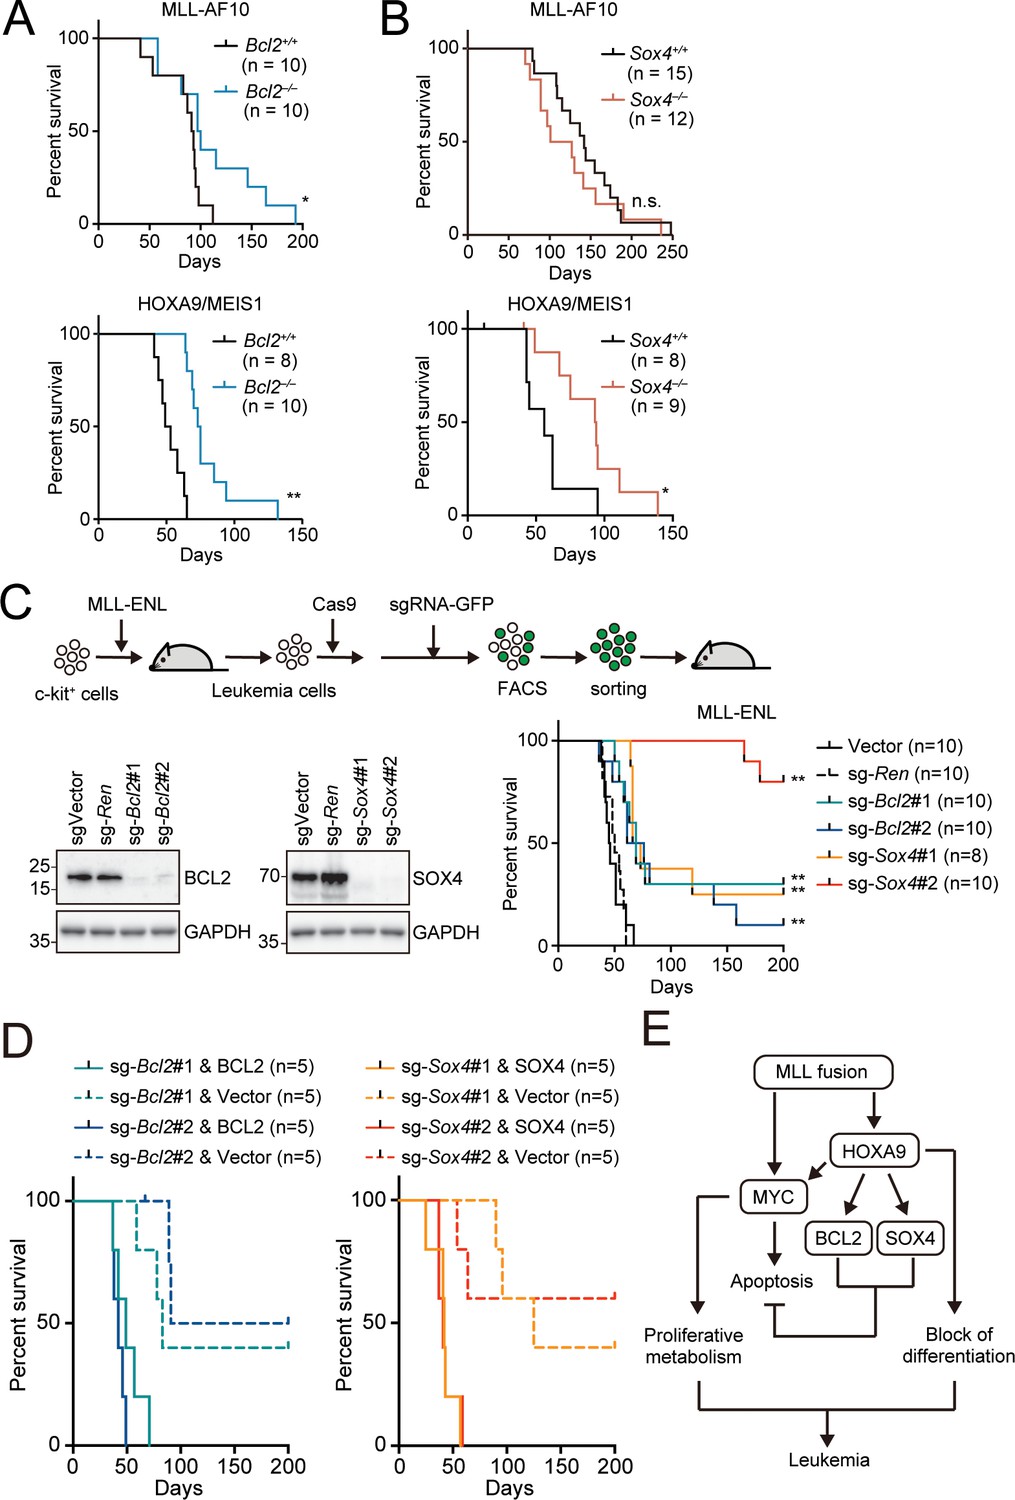
Endogenous BCL2 and SOX4 support the initiation and maintenance of leukemia.
(A) Effects of Bcl2-deficiency on the initiation of leukemogenesis in vivo. HPCs were isolated from Bcl2+/+ or Bcl2–/– embryos and transduced with the retroviruses for MLL-AF10 or the HOXA9/MEIS1 combination. Kaplan-Meier curves of mice transplanted with the transduced HPCs are shown. Statistical analysis was performed using the log-rank test and Bonferroni correction with the wildtype control. *p ≤ 0.05. (B) Effects of Sox4-deficiency on the initiation of leukemogenesis in vivo. In vivo leukemogenesis assay was performed on Sox4+/+ or Sox4–/– embryos as in A (C) Effects of Bcl2- or Sox4-deficiency on the maintenance of leukemia initiating cells. Western blots of MLL-ENL leukemia cells transduced with sgRNA for BCL2 or SOX4 are shown on the left. Kaplan-Meier curves of mice transplanted with MLL-ENL leukemia cells transduced with the indicated sgRNAs are shown on the right. Statistical analysis was performed using the log-rank test and Bonferroni correction with the vector control. (D) Rescue of in vivo leukemogenic potential by sgRNA-resistant transgenes. Before transduction of sgRNA, MLL-ENL-LCs were transduced with sgRNA-resistant BCL2 or SOX4. In vivo leukemogenesis assay was performed as described in Figure 3D. (E) A model illustrating HOXA9-mediated pathogenesis in MLL fusion-mediated leukemia.
Figure 7—figure supplement 1
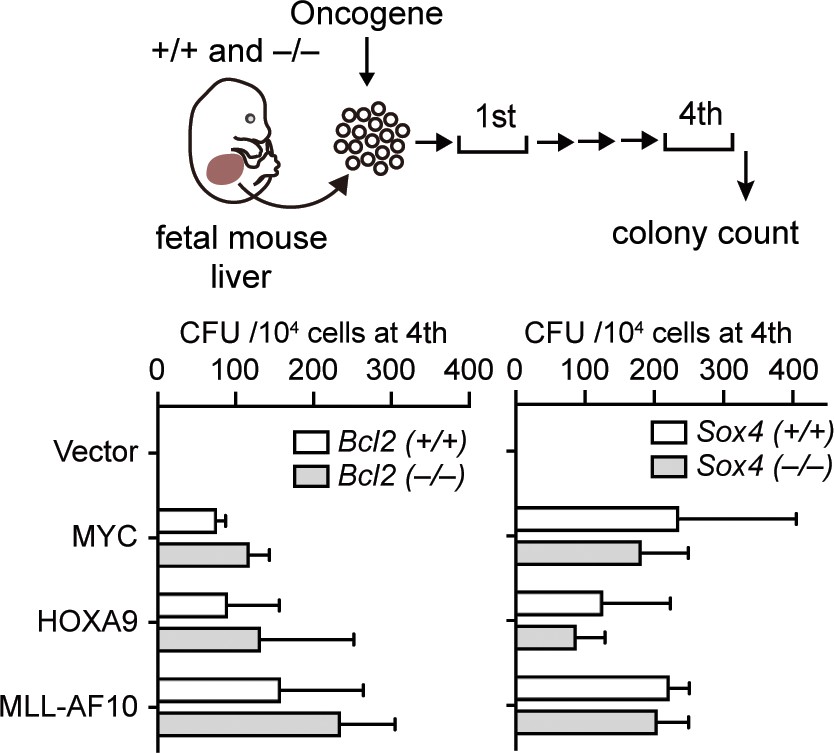
Requirement of BCL2 and SOX4 in transformation ex vivo.
Retroviruses for MLL-AF10, HOXA9, or MYC were transduced into HPCs isolated from fetal liver of the indicated genotypes. CFU (Mean with SD, n = 3, biological replicates) of myeloid progenitors derived from Bcl2- or Sox4-knockout embryos is shown.
Figure 7—figure supplement 2
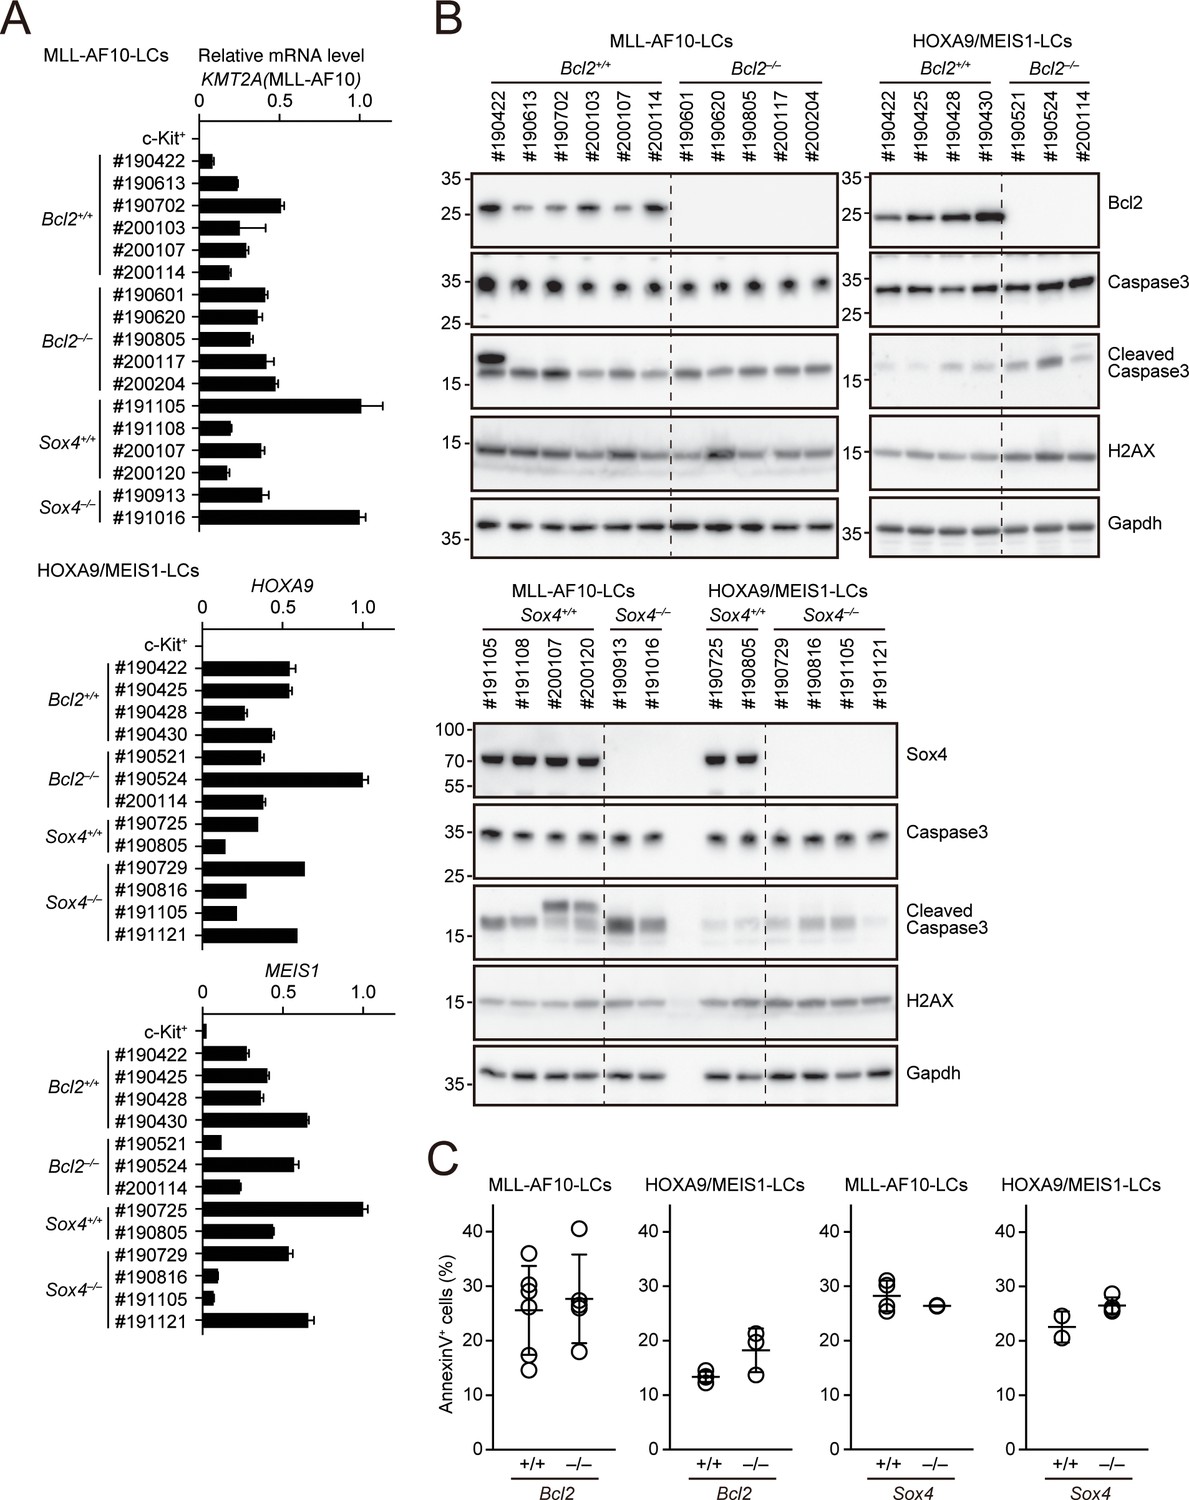
Apoptotic tendencies of Bcl2- or Sox4-deficient leukemia cells.
(A) Expressions of transgenes in LCs. Leukemia cells were harvested from moribund mice. (MLL-AF10; Bcl2+/+, n = 6, MLL-AF10; Bcl2–/–, n = 5, MLL-AF10; Sox4+/+, n = 4, MLL-AF10; Sox4–/–, n = 2, HOXA9/MEIS1; Bcl2+/+, n = 4, HOXA9/MEIS1; Bcl2–/–, n = 3, HOXA9/MEIS1; Sox4+/+, n = 2, HOXA9/MEIS1; Sox4–/– n = 4,). Cells were harvested from moribund mice and were analyzed by qRT-PCR (Mean with SD, n = 3, PCR replicates). cDNA of c-Kit+ cells were used as negative control. (B) Expressions of apoptotic markers in LCs. Cleaved caspase three and γH2AX were analyzed by western blotting. (C) Apoptotic tendencies of LCs. AnnexinV positivity was analyzed by FACS as in Figure 3B.
Figure 7—figure supplement 3

Effects of Bcl2 or Sox4 knockout on MLL-ENL-leukemia cells.
sgRNA/GFP was transduced into Cas9-expressing MLL-ENL-LCs. Changes in GFP+ cells (%) (Mean n=3, biological replicates) are shown with sg-Men1 serving as a positive control.
Tables
Appendix 1—key resources table
| Reagent type (species) or resource | Designation | Source or reference | Identifiers | Additional information |
|---|---|---|---|---|
| Strain, strain background (Mus musculus) | C57BL/6J | CLEA Japan | ||
| Strain, strain background (Mus musculus) | Bcl2 KO (B6.129P2-Bcl2<tm1Tsu>/TsuRbrc) | Gift from Yoshihide Tsujimoto (via RIKEN BRC) Kamada et al., 1995 | ||
| Strain, strain background (Mus musculus) | Sox4 KO (STOCK Sox4<tm1Cle>/Mmmh) | Gift from Hans Clevers (via RIKEN BRC) Schilham et al., 1996 | ||
| Cell line (Homo-sapiens) | PLAT-E | Gift from Toshio Kitamura Morita et al., 2000 | RRID:CVCL_B488 | |
| Cell line (Homo-sapiens) | HB1119 | Gift from Michael L. Cleary Tkachuk et al., 1992; Yokoyama et al., 2004 | The cell line was verified by the expression of MLL-ENL | |
| Cell line (Homo-sapiens) | HEK293TN | System Bioscience | Cat# LV900A-1 RRID:CVCL_UL49 | |
| Cell line (Homo-sapiens) | HEK293T | Gift from Michael L. Cleary Yokoyama et al., 2004 | authenticated by the JCRB Cell Bank in 2019 | |
| Cell line (Homo-sapiens) | K562 | Gift from Michael L. Cleary Yokoyama et al., 2004 | RRID:CVCL_0004 | authenticated by the JCRB Cell Bank in 2021 |
| Cell line (Homo-sapiens) | MV4-11 | ATCC | Cat# CRL-9591 RRID:CVCL_0064 | authenticated by the JCRB Cell Bank in 2021 |
| Cell line (Homo-sapiens) | RS4-11 | Gift from Michael L. Cleary | RRID:CVCL_0093 | authenticated by the JCRB Cell Bank in 2021 |
| Cell line (Homo-sapiens) | ML-2 | DSMZ | Cat# ACC15 RRID:CVCL_1418 | authenticated by the JCRB Cell Bank in 2021 |
| Cell line (Homo-sapiens) | THP1 | Gift from Michael L. Cleary | RRID:CVCL_0006 | authenticated by the JCRB Cell Bank in 2021 |
| Cell line (Homo-sapiens) | EOL-1 | Gift from Michael L. Cleary | RRID:CVCL_0258 | authenticated by the JCRB Cell Bank in 2021 |
| Antibody | MLLn ab#1 (Rabbit polyclonal) | In-house Yokoyama et al., 2002 | rpN1 | ChIP (1:400) |
| Antibody | MLLn ab#2 (Rabbit monoclonal, D2M7U) | Cell Signaling Technology | Cat# 14689 RRID:AB_2688009 | ChIP (1:400) |
| Antibody | MLLc (Rabbit monoclonal, D6G8N) | Cell Signaling Technology | Cat# 14197 RRID:AB_2688010 | WB (1:1000) |
| Antibody | MENIN (Rabbit polyclonal) | Bethyl Laboratories | Cat# A300-105A RRID:AB_2143306 | ChIP (1:400) WB (1:1000) |
| Antibody | MYC (Rabbit monoclonal, D3N8F) | Cell Signaling Technology | Cat# 13987 RRID:AB_2631168 | WB (1:2000) |
| Antibody | Caspase3 (Rabbit monoclonal, D3R6Y) | Cell Signaling Technology | Cat# 14220 RRID:AB_2798429 | WB (1:2000) |
| Antibody | Cleaved Caspase3 (Rabbit monoclonal, 5A1E) | Cell Signaling Technology | Cat# 9664 RRID:AB_2070042 | WB (1:2000) |
| Antibody | PARP (Rabbit polyclonal) | Cell Signaling Technology | Cat# 9542 RRID:AB_2160739 | WB (1:2000) |
| Antibody | γH2AX (Rabbit polyclonal) | Bethyl Laboratories | Cat# A300-081A RRID:AB_203288 | WB (1:1000) |
| Antibody | BCL2 (Mouse monoclonal, C-2) | Santa Cruz Biotechnology | Cat# sc-7382 RRID:AB_626736 | WB (1:500) |
| Antibody | SOX4 (Mouse monoclonal, B-7) | Santa Cruz Biotechnology | Cat# sc-518016 | WB (1:200) |
| Antibody | HOXA9 (Rabbit polyclonal) | Millipore | Cat# 07–178 RRID:AB_11210179 | WB (1:1000) |
| Antibody | GAPDH (Rabbit polyclonal) | Santa Cruz Biotechnology | Cat# sc-25778 RRID:AB_10167668 | WB (1:2000) |
| Antibody | BAK (Rabbit monoclonal, D4E4) | Cell Signaling Technology | Cat# 12105 RRID:AB_2716685 | WB (1:2000) |
| Antibody | BAD (Rabbit monoclonal, D24A9) | Cell Signaling Technology | Cat# 9239 RRID:AB_2062127 | WB (1:2000) |
| Antibody | BCL-XL (Rabbit monoclonal, 54H6) | Cell Signaling Technology | Cat# 2764 RRID:AB_2228008 | WB (1:2000) |
| Antibody | MCL1 (Rabbit monoclonal, D35A5) | Cell Signaling Technology | Cat# 5453 RRID:AB_10694494 | WB (1:2000) |
| Antibody | APC Annexin V | BD Biosciences | Cat# 550475 RRID:AB_2868885 | FACS (1:100) |
| Antibody | Propidium iodide | Thermo Fisher Scientific | P3566 | FACS (1:2000) |
| Antibody | Gr-1 (Rat monoclonal, RB6-8C5) | BD Biosciences | Cat# 553127 RRID:AB_394643 | FACS (1:100) |
| Antibody | B220 (Rat monoclonal, RA3-6B2) | BD Biosciences | Cat#: 553088 RRID:AB_394618 | FACS (1:100) |
| Antibody | TER119 (Rat monoclonal, TER-119) | BD Biosciences | Cat#: 557915 RRID:AB_396936 | FACS (1:100) |
| Antibody | CD3e (Hamster monoclonal, 145–2 C11) | BD Biosciences | Cat#: 553062 RRID:AB_394595 | FACS (1:100) |
| Antibody | Mac/CD11b (Rat monoclonal, M1/70) | BD Biosciences | Cat#: 553310 RRID:AB_394774 | FACS (1:100) |
| Antibody | c-Kit (Rat monoclonal, 2B8) | BD Biosciences | Cat#: 553355 RRID:AB_394806 | FACS (1:100) |
| Antibody | Sca1 (Rat monoclonal, D7) | BD Biosciences | Cat#: 553108 RRID:AB_394629 | FACS (1:100) |
| Antibody | CD34 (Rat monoclonal, RAM34) | BD Biosciences | Cat#: 751621 RRID:AB_2875614 | FACS (1:100) |
| Antibody | CD16/32 (Rat monoclonal, 93) | BD Biosciences | Cat#: 751690 RRID:AB_2875675 | FACS (1:100) |
| Recombinant DNA reagent | pMSCV-neo | Clontech | Cat#: 634401 | Gene expression vector |
| Recombinant DNA reagent | pMSCV-puro | Clontech | Cat#: 634401 | Gene expression vector |
| Recombinant DNA reagent | pMSCV-hygro | Clontech | Cat#: 634401 | Gene expression vector |
| Recombinant DNA reagent | pLKO5.EFS.GFP | Addgene (gift from Benjamin Ebert) Heckl et al., 2014 | Addgene Plasmid #57822 RRID:Addgene_57822 | sgRNA backbone |
| Recombinant DNA reagent | pKLV2-Cas9.bsd | Addgene (gift from Kosuke Yusa) Tzelepis et al., 2016 | Addgene Plasmid #68343 RRID:Addgene_68343 | Cas9 expression vector |
| Recombinant DNA reagent | pMDLg/pRRE | Addgene (gift from Didier Trono) Dull et al., 1998 | Addgene Plasmid #12251 RRID:Addgene_12251 | Lentivirus packaging vector |
| Recombinant DNA reagent | pRSV-rev | Addgene (gift from Didier Trono) Dull et al., 1998 | Addgene Plasmid #12253 RRID:Addgene_12253 | Lentivirus packaging vector |
| Recombinant DNA reagent | pMD2.G | Addgene (gift from Didier Trono) Dull et al., 1998 | Addgene Plasmid #12259 RRID:Addgene_12259 | Lentivirus packaging vector |
| Recombinant DNA reagent | pLKO.1-puro | Addgene (gift from Bob Weinberg) Stewart et al., 2003 | Addgene Plasmid #84530 RRID:Addgene_84530 | shRNA backbone |
| Sequence-based reagent | sgRNAs | This study | See Supplementary file 1 | |
| Sequence-based reagent | shRNA | This study | See Supplementary file 1 | |
| Sequence-based reagent | qPCR primers | Thermo Fisher Scientific | See Supplementary file 1 | |
| Commercial assay or kit | RNeasy Mini Kit | Qiagen | Cat#: 74106 | |
| Commercial assay or kit | Super Script III First-Strand Synthesis System | Thermo Fisher Scientific | Cat# 18080051 | |
| Commercial assay or kit | TruSeq ChIP Sample Prep Kit SetB | Illumina | Cat# IP-202–1024 | |
| Commercial assay or kit | Sure Select Strand Specific RNA Library Prep Kit | Agilent Technologies | Cat#: G9691A | |
| Software, algorithm | GraphPad Prism7 | GraphPad Software Inc | RRID:SCR_002798 | Data analysis |
| Software, algorithm | FlowJo | BD Biosciences | RRID:SCR_008520 | FACS data analysis |
| Software, algorithm | Integrative Genomics Viewer | Thorvaldsdóttir et al., 2013 | RRID:SCR_011793 | Data visualization |
| Software, algorithm | CASAVA 1.8.2 | Illumina | RRID:SCR_001802 | RNA-seq data analysis |
| Software, algorithm | DAVID | Jiao et al., 2012 | RRID:SCR_001881 | RNA-seq data analysis |
| Software, algorithm | Complex heatmap | Gu et al., 2016 | RRID:SCR_017270 | RNA-seq data analysis |
| Software, algorithm | R2: Genome Analysis and Visualization Platform | AMC: Oncogenomics | http://r2.amc.nl http://r2platform.com | RNA-seq data analysis |
| Software, algorithm | Gene set enrichment analysis | Subramanian et al., 2005 | https://www.gsea-msigdb.org/gsea/index.jsp | RNA-seq data analysis |
| Other | c-Kit magnetic beads | Miltenyi Biotec | Cat# 130-091-224 RRID:AB_2753213 |
Additional files
-
Source data 1
Gel images.
- https://cdn.elifesciences.org/articles/64148/elife-64148-data1-v1.pdf
-
Supplementary file 1
Reagents and data sets.
- https://cdn.elifesciences.org/articles/64148/elife-64148-supp1-v1.docx
-
Transparent reporting form
- https://cdn.elifesciences.org/articles/64148/elife-64148-transrepform-v1.docx
Download links
A two-part list of links to download the article, or parts of the article, in various formats.
Downloads (link to download the article as PDF)
Open citations (links to open the citations from this article in various online reference manager services)
Cite this article (links to download the citations from this article in formats compatible with various reference manager tools)
HOXA9 promotes MYC-mediated leukemogenesis by maintaining gene expression for multiple anti-apoptotic pathways
eLife 10:e64148.
https://doi.org/10.7554/eLife.64148


