Ct threshold values, a proxy for viral load in community SARS-CoV-2 cases, demonstrate wide variation across populations and over time
- Nuffield Department of Medicine, University of Oxford, United Kingdom
- The National Institute for Health Research Health Protection Research Unit in Healthcare Associated Infections and Antimicrobial Resistance at the University of Oxford, United Kingdom
- The National Institute for Health Research Oxford Biomedical Research Centre, University of Oxford, United Kingdom
- MRC Clinical Trials Unit at UCL, UCL, United Kingdom
- Department of Mathematics, University of Manchester, United Kingdom
- IBM Research, Hartree Centre, United Kingdom
- National Infection Service, Public Health England, United Kingdom
- MRC Biostatistics Unit, University of Cambridge, Cambridge Institute of Public Health, United Kingdom
- Office for National Statistics, United Kingdom
- Office of the Regius Professor of Medicine, University of Oxford, United Kingdom
- Health Improvement Directorate, Public Health England, United Kingdom
- Wellcome Trust, United Kingdom
- University of Glasgow, United Kingdom
- Lighthouse Laboratory in Glasgow, Queen Elizabeth University Hospital, United Kingdom
- Department of Infectious Diseases and Microbiology, Oxford University Hospitals NHS Foundation Trust, John Radcliffe Hospital, United Kingdom
- Big Data Institute, Nuffield Department of Population Health, University of Oxford, United Kingdom
- Health Economics Research Centre, Nuffield Department of Population Health, University of Oxford, United Kingdom
Figures
Figure 1

Distribution of Ct values at each positive test by genes detected and self-reported symptoms.
Note: Points show the median and boxes the interquartile range. OR=ORF1ab. Positives where only the ORF1ab+N genes were detected are split by whether the swab was taken before or after 16 November 2020, reflecting the expansion of B.1.1.7 (which has S-gene target failure on the assay used in the survey).
Figure 2
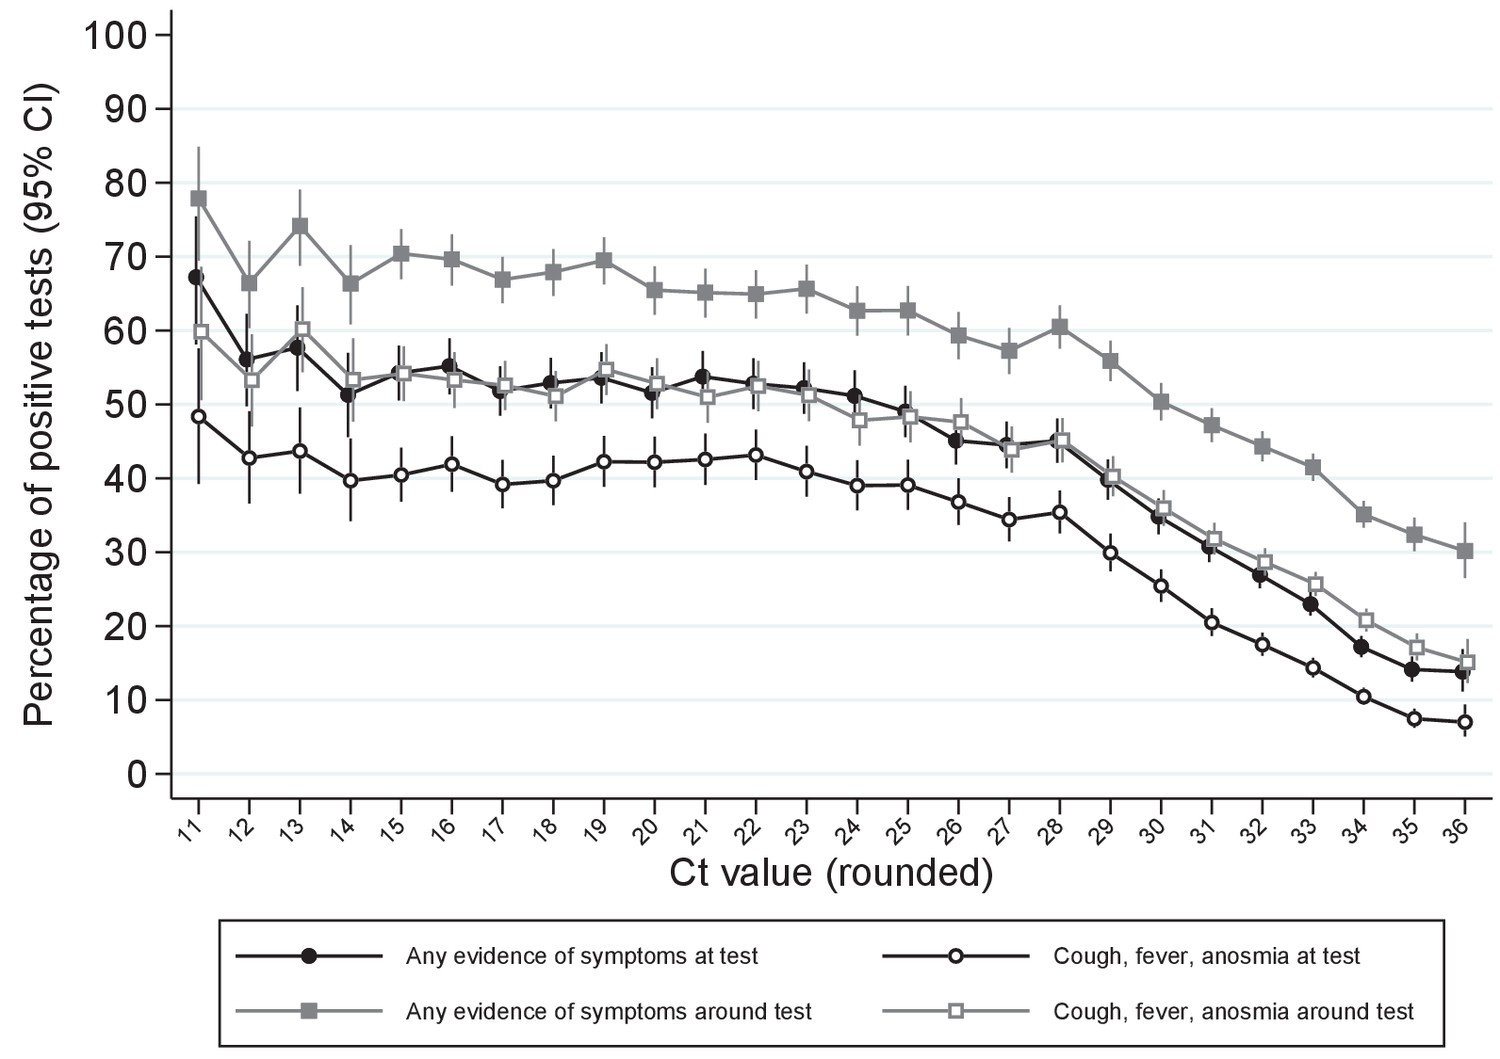
Percentage reporting symptoms by Ct value.
Note: Points show the percentage of positive tests with each rounded Ct value reporting any symptoms or cough, fever, anosmia/ageusia at each test or around each test (see Materials and methods for symptoms collection and definitions). Ct values under 11 and over 36 grouped with 11 and 36, respectively.
Figure 3
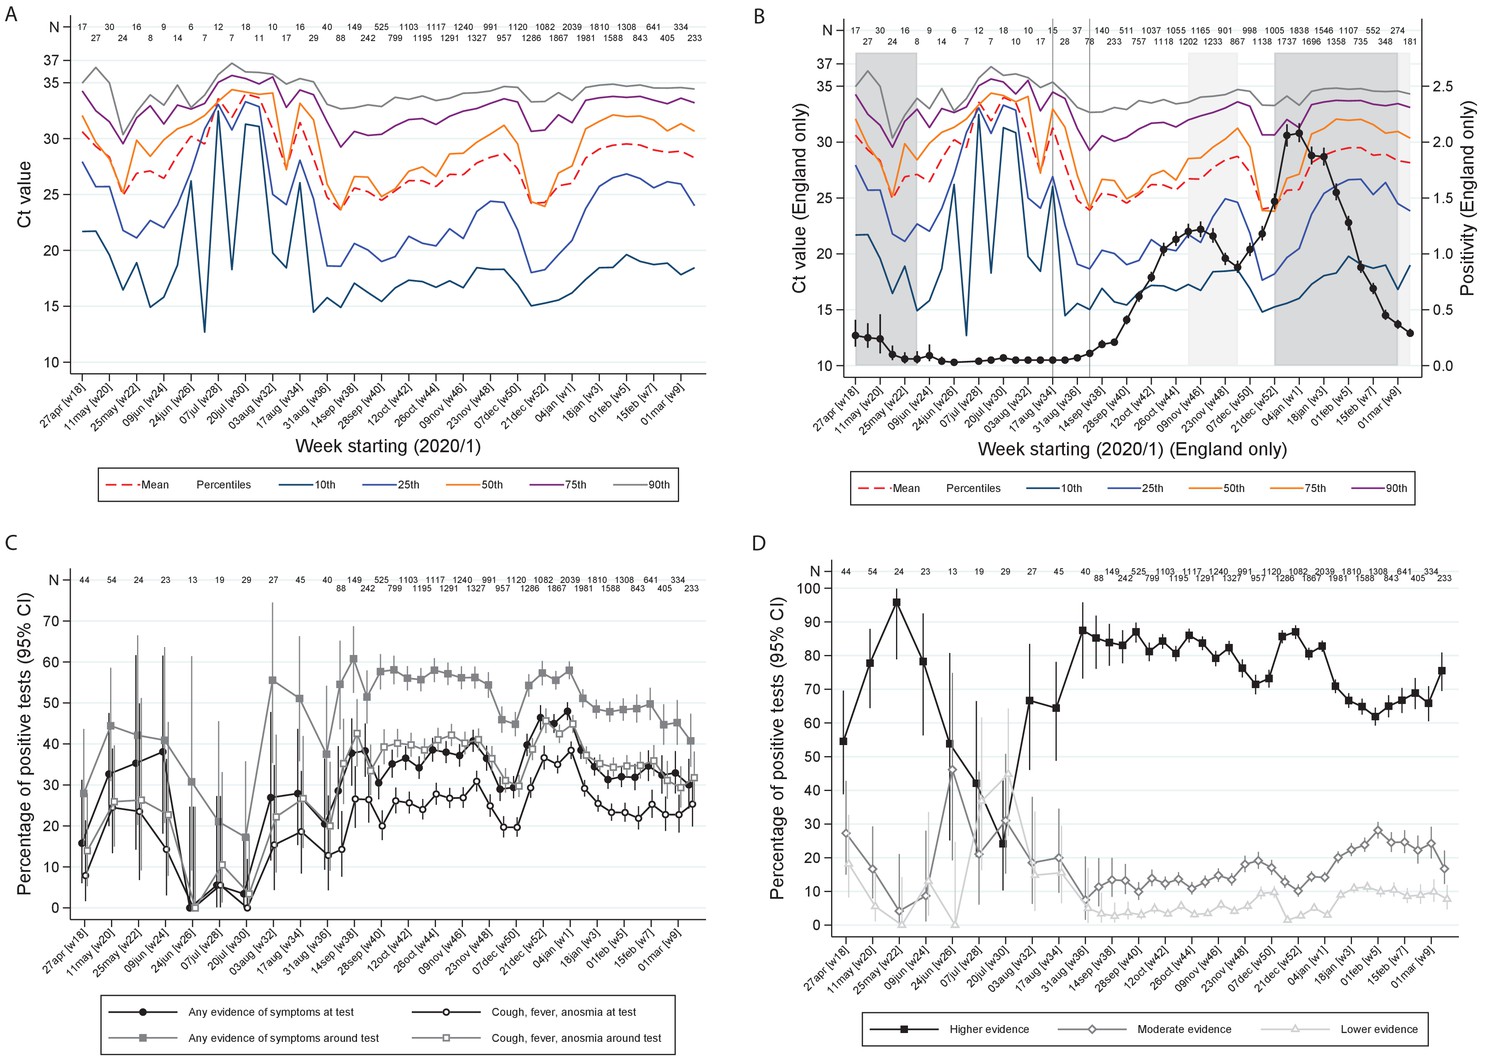
Variation over calendar time in the distribution of Ct values in the UK (A) and England (B) together with percentage positivity in England (B), and in self-reported symptoms (C) and evidence supporting positives (D).
Note: Panel (A) shows the distribution of Ct values each week including all positives across the UK. Panel (B) is restricted to England shown together with the official estimates of positivity as reported by the Office for National Statistics (black line) and periods of national ‘stay-at-home’ restrictions (schools shut in dark grey, schools open in light gray). Panels (C) and (D) show the proportions reporting symptoms and with different levels of evidence supporting the positive test, respectively. Variation in the width of 95% CI reflects the increase in size of the survey from mid August (Supplementary file 1).
Figure 4
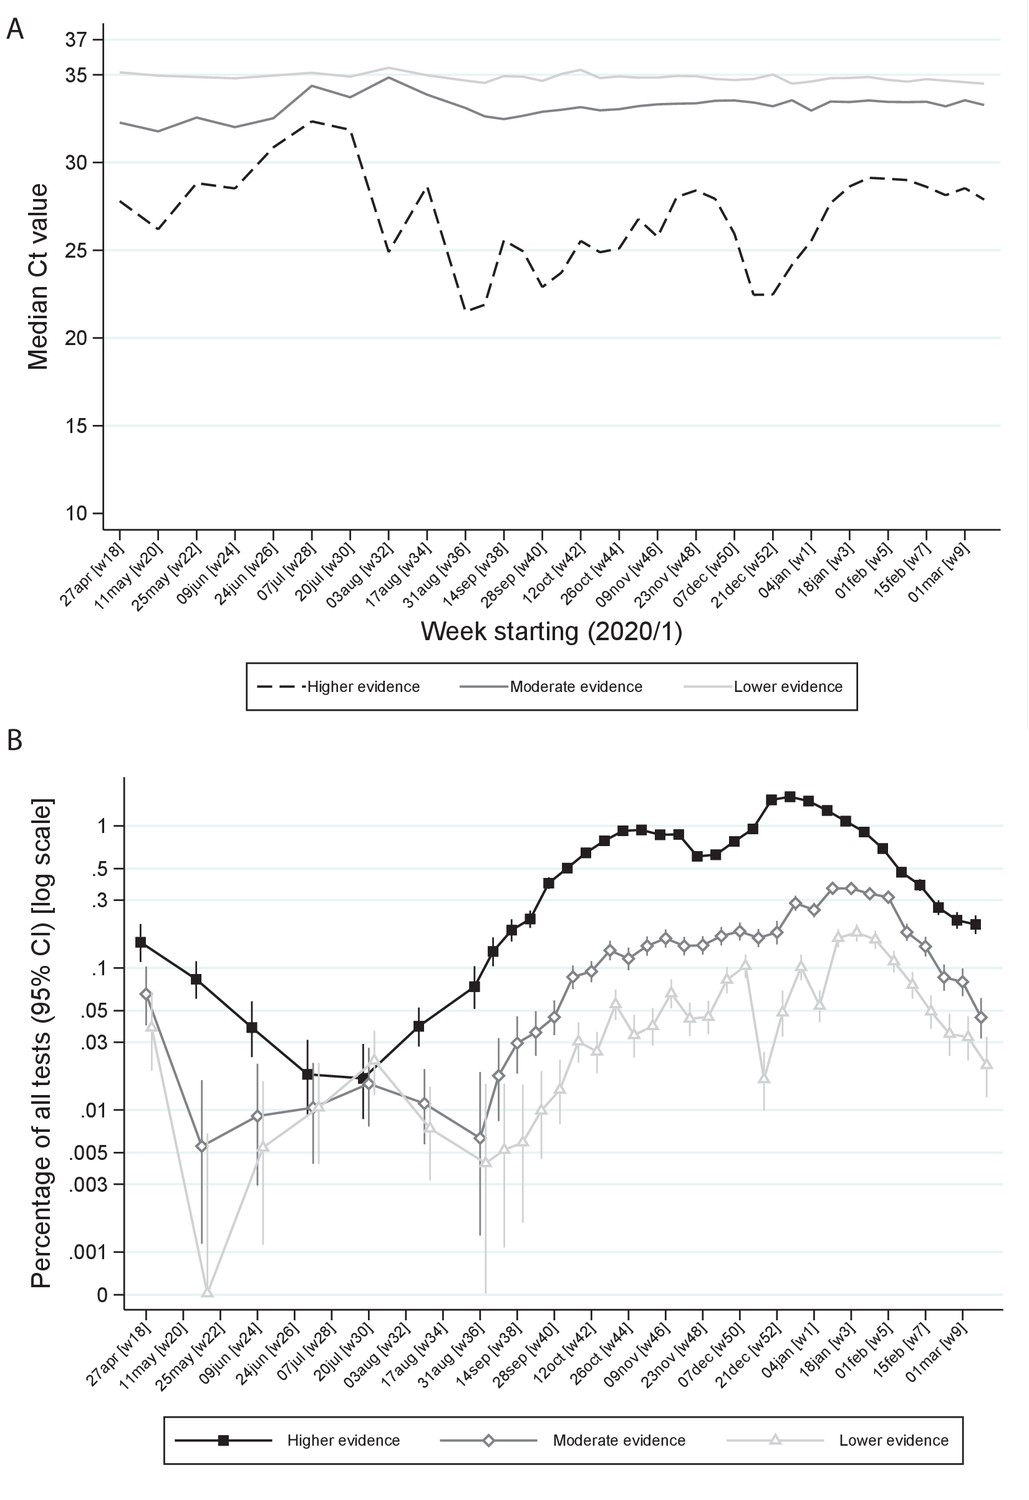
Ct values (A) and percentage positive of all tests (B) by level of evidence and time.
Note: Panel (A) shows median Ct values according to level of evidence and panel (B) percentage of all swab tests positive according to level of evidence over calendar time. The early part of the study is grouped into 3 week periods due to lower numbers of positives.
Figure 5
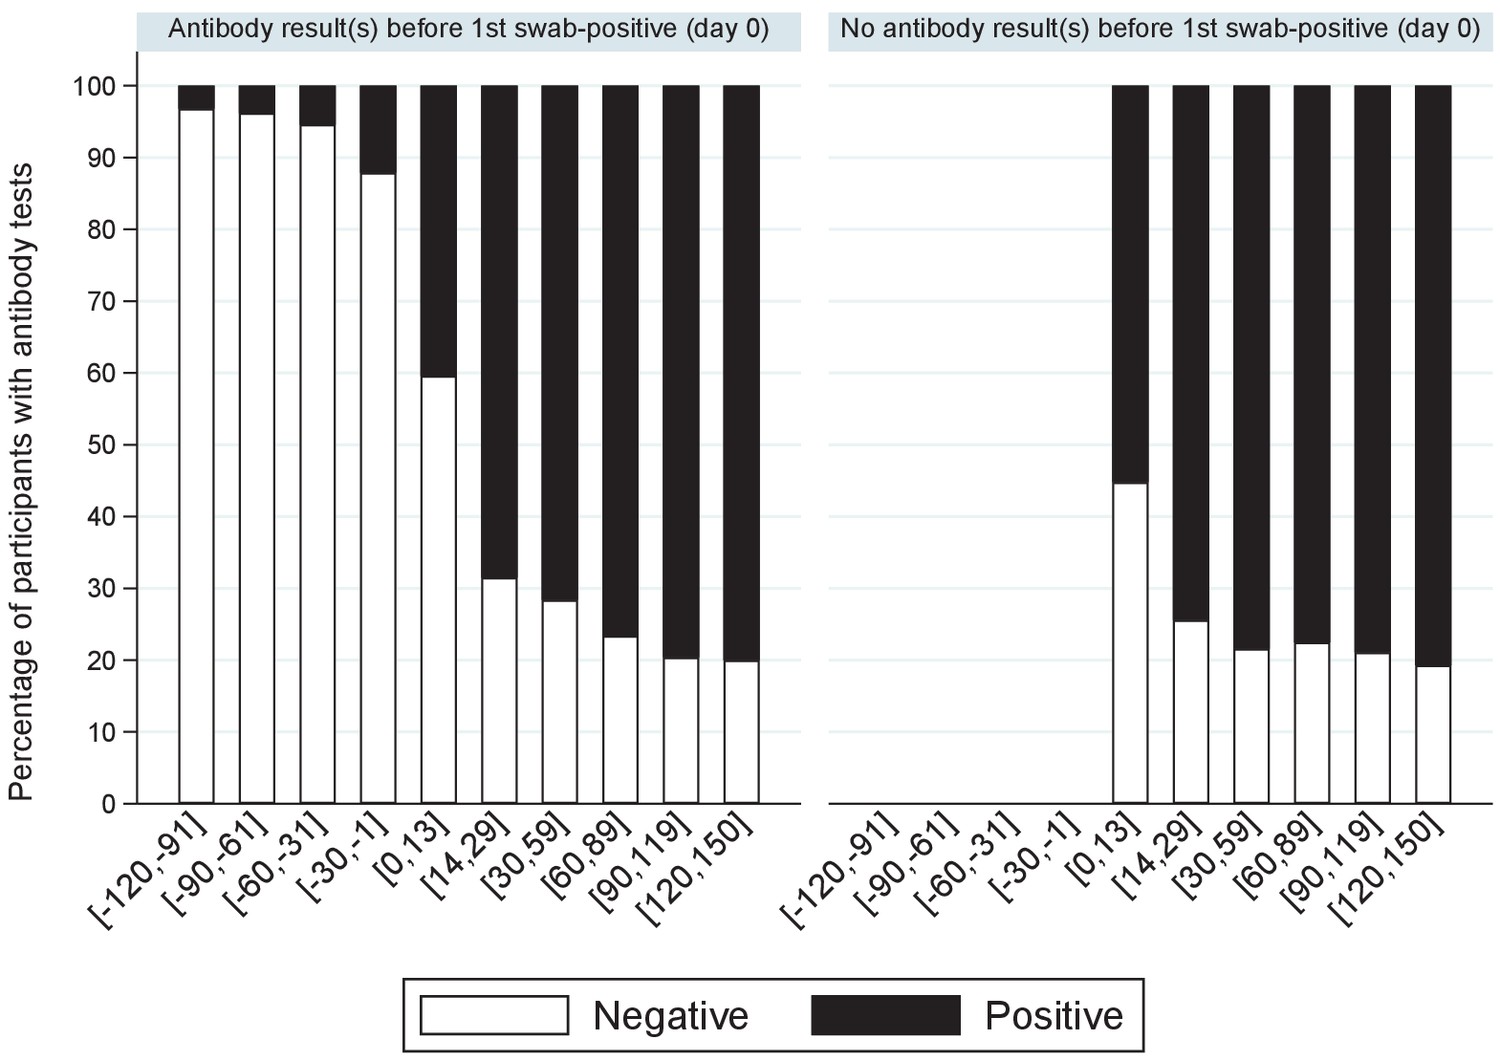
Percentage of positive antibody tests over time from first positive swab.
Note: showing the percentage of participants with S-antibody positive or negative tests according to days from their first positive swab, separately for those with and without any antibody results prior to their first positive swab.
Appendix 1—figure 1

Relationship between Ct values and viral load.
Appendix 1—figure 2
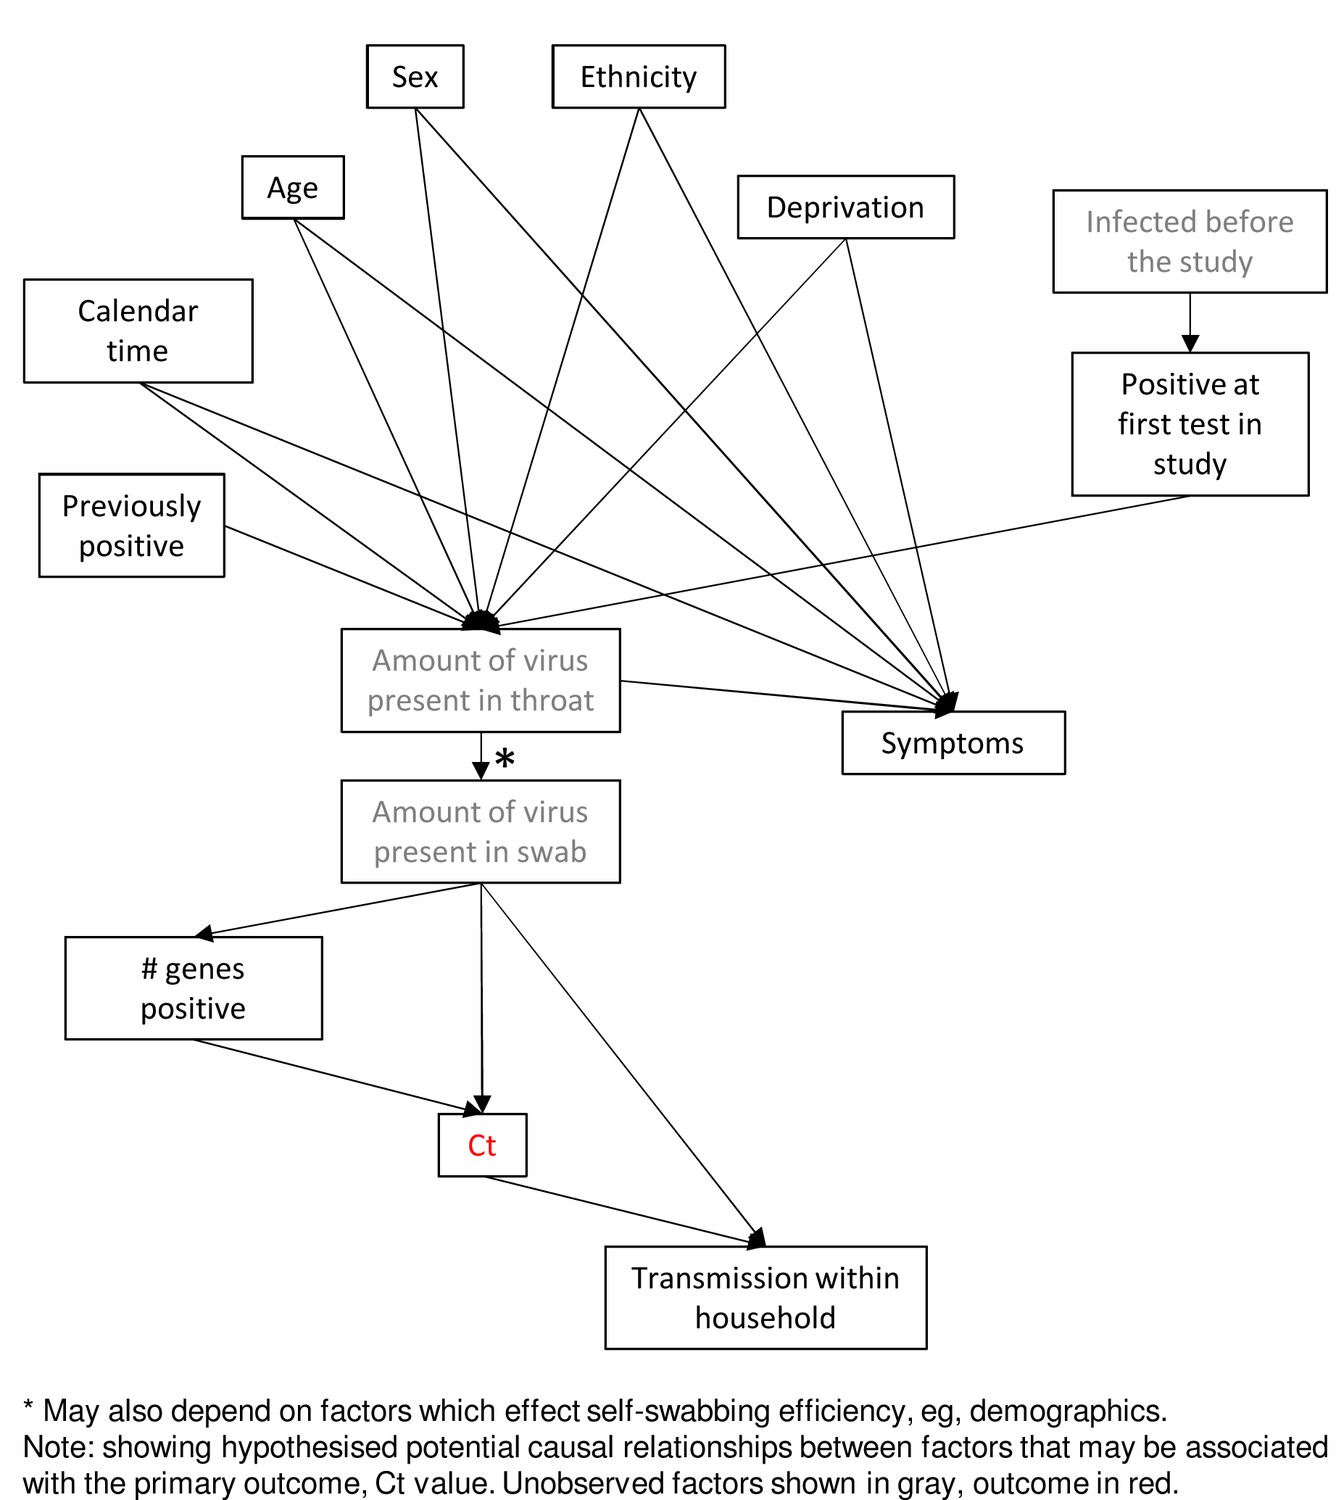
Directed acyclic graph of potential relationships between factors.
*May also depend on factors which effect self-swabbing efficiency, e.g., demographics.
Tables
Table 1
Genes detected in positive swabs.
| All positives (N = 27,879) | First positive per participant (N = 21,811) | |||
|---|---|---|---|---|
| Number of genes detected | N (%) | Median CT* (IQR) [range] | N (%) | Median CT* (IQR) [range] |
| 1 | 6550 (23%) | 33.8 (32.9–34.7) [12.7–38.7] | 5102 (23%) | 33.9 (32.9–34.7) [12.7–38.7] |
| 2 | 1145 (4%) | 32.3 (30.9–33.4) [10.3–37.2] | 773 (4%) | 32.3 (30.7–33.4) [10.3–37.2] |
| 2: ORF1ab+N 16 Nov 2020 onwards | 9867 (35%) | 26.4 (19.4–31.1) [9.2–37.8] | 8184 (38%) | 25.3 (18.6–30.7) [9.2–37.8] |
| 3 | 10,317 (37%) | 25.3 (19.8–29.5) [9.3–36.8] | 7752 (36%) | 23.9 (18.8–28.8) [9.3–36.8] |
| Genes detected | ||||
| N only | 4479 (13%) | 33.9 (33.0–34.8) [26.1–38.7] | 3419 (16%) | 34.0 (33.1–34.8) [28.2–38.7] |
| ORF1ab only | 2044 (7%) | 33.6 (32.6–34.5) [16.8–38.3] | 1656 (8%) | 33.7 (32.7–34.6) [16.8–38.3] |
| S only† | 27 (0.1%) | 34.9 (33.5–36.1) [12.7–37.3] | 27 (0.1%) | 34.9 (33.5–36.1) [12.7–37.3] |
| N+ORF1ab: before 16 Nov 2020 | 731 (3%) | 31.9 (30.3–32.9) [10.3–37.2] | 497 (2%) | 31.8 (29.7–33.0) [10.3–38.2] |
| N+ORF1ab: 16 Nov 2020 onwards | 9867 (35%) | 26.4 (19.4–31.1) [9.2–37.8] | 8184 (38%) | 23.9 (18.8–28.8) [9.3–36.8] |
| S+ORF1ab | 190 (0.7%) | 32.5 (31.2–33.5) [15.1–36.6] | 138 (0.6%) | 32.4 (31.0–33.6) [15.1–36.6] |
| N+S | 224 (0.8%) | 33.4 (32.5–34.2) [25.0–36.8] | 138 (0.6%) | 33.3 (32.4–34.3) [27.3–36.8] |
| N+S+ORF1ab | 10,317 (37%) | 25.3 (19.8–29.5) [9.3–36.8] | 7752 (36%) | 25.3 (18.6–30.7) [9.2–37.8] |
-
*Taking the mean Ct per positive swab across positive gene targets (Spearman rho = 0.98 for each pair of genes where both positive, p<0.0001).
†17/27 before mid-May only: after this samples positive for the S gene only were not called positive overall by the algorithm and therefore reflect likely recording errors.
-
Note: excluding 23 positive results without Ct values or genes detected available. Comparing first vs subsequent positives per participant, exact p<0.0001 for both number of genes detected and specific genes detected.
Table 2
Evidence supporting positive test results indicating presence of virus and impact on other factors.
| Strength of evidence for true infection | ||||
|---|---|---|---|---|
| Higher | Moderate | Lower | p (exact) | |
| Number (col %) (N = 27,879) | 21,329 (77%) | 4741 (17%) | 1809 (6%) | |
| Factors determining classification | ||||
| Number of genes detected (row %) | 3: 10,317 (48%) 2: 11,012 (52%) | 1: 4741 (100%) | 1: 1809 (100%) | |
| CT, median | 26.2 | 33.4 | 34.8 | |
| CT, n (row %) <34* | 21,070 (98.8%) | 3613 (76%) | 0 (0%) | |
| Symptoms around test, n (row %) | 12,466 (58%) | 2243 (47%) | 0 (0%) | <0.0001 (exc lower) |
| Occupational risk†, n (row %) | 1322 (6%) | 307 (6%) | 0 (0%) | 0.48 (exc lower) |
| Other factors | ||||
| Cough, fever, anosmia, ageusia around test, n (row %) | 9345 (44%) | 1241 (26%) | 0 (0%) | <0.0001 (exc lower) |
| First positive test n (row %) (vs subsequent positive test) | 16,709 (78%) | 3508 (74%) | 1594 (88%) | <0.0001 |
| First test in study, n (row %) (vs follow-up i.e. prior negative in study) | 2281 (11%) | 482 (10%) | 199 (11%) | 0.49 |
| Any genome sequence obtained, confirming presence of virus‡ | 6,621/9,022 (73%) | 544/2,315 (24%) | 0/836 (0%) | <0.0001 |
| Any other household member ever positive$ | 11,493/18,494 (62%) | 1,513/4,004 (38%) | 318/1,525 (21%) | <0.0001 |
-
*Approximate 97.5th percentile of CT in higher evidence positives through 2 August 2020 when classification first applied.
†Reported working in a patient-facing healthcare role/care/residential home.
-
‡Any genome sequence obtained out of attempted (other positives not found or not yet attempted).
$Denominator households with two or more study participants.
-
Note: Classification arbitrarily determined on 2 August 2020 based on the number of genes detected, Ct values and pre-test probability (see Materials and methods).
Additional files
-
Supplementary file 1
Month of recruitment into the COVID-19 Infection Survey.
- https://cdn.elifesciences.org/articles/64683/elife-64683-supp1-v3.docx
-
Supplementary file 2
Association between characteristics and Ct values.
(A) Univariable effects and main model considering all factors, (B) multivariable model excluding potential mediators of effects of demographics.
- https://cdn.elifesciences.org/articles/64683/elife-64683-supp2-v3.docx
-
Supplementary file 3
Data points underlying figures.
- https://cdn.elifesciences.org/articles/64683/elife-64683-supp3-v3.xlsx
-
Supplementary file 4
Stata code.
- https://cdn.elifesciences.org/articles/64683/elife-64683-supp4-v3.docx
-
Transparent reporting form
- https://cdn.elifesciences.org/articles/64683/elife-64683-transrepform-v3.docx
Download links
A two-part list of links to download the article, or parts of the article, in various formats.
Downloads (link to download the article as PDF)
Open citations (links to open the citations from this article in various online reference manager services)
Cite this article (links to download the citations from this article in formats compatible with various reference manager tools)
Ct threshold values, a proxy for viral load in community SARS-CoV-2 cases, demonstrate wide variation across populations and over time
eLife 10:e64683.
https://doi.org/10.7554/eLife.64683


