Polymerization of misfolded Z alpha-1 antitrypsin protein lowers CX3CR1 expression in human PBMCs
- Department of Respiratory Medicine, Hannover Medical School, Biomedical Research in Endstage and Obstructive Lung Disease Hannover (BREATH), Member of the German Center for Lung Research (DZL), Germany
- Cell Sorting Core Facility Hannover Medical School, Germany
- 8sens.biognostic GmbH, Germany
- Institute of Clinical Chemistry, Hannover Medical School, Germany
- Department of Molecular Genetics, Institute of Health Carlos III, Center for Biomedical Research in the Network of Rare Diseases (CIBERER), Spain
- Institute for Biophysical Chemistry, Hannover Medical School, Germany
- Department of Gastroenterology, Hepatology and Endocrinology, Hannover Medical School, Germany
- Medical Clinic III, Gastroenterology, Metabolic Diseases and Intensive Care, University Hospital RWTH Aachen, Germany
- Department of Pulmonology, Leiden University Medical Center, Member of European Reference Network LUNG, section Alpha-1-antitrypsin Deficiency, Netherlands
Figures
Figure 1 with 1 supplement
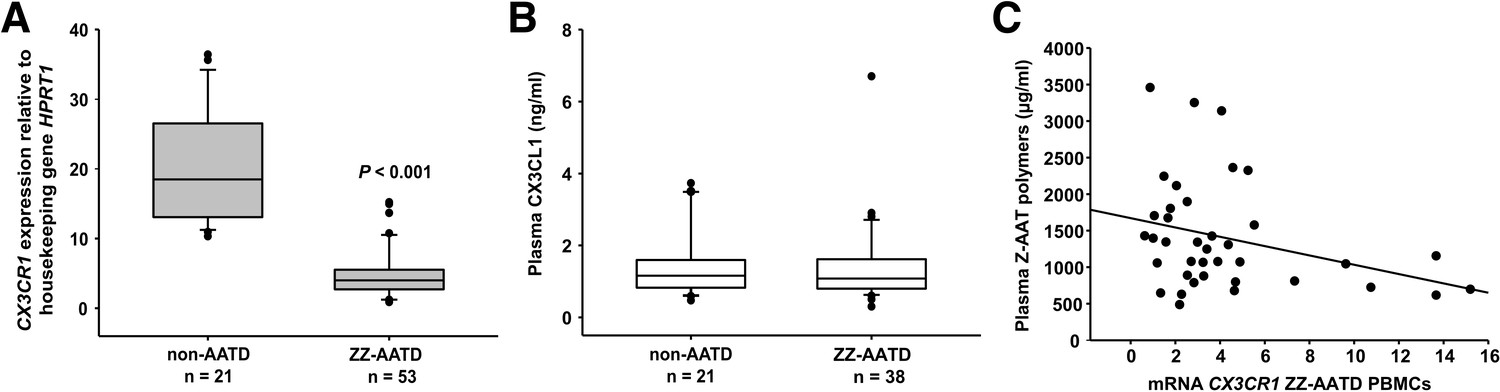
Relationship between CX3CR1 gene expression levels and AAT deficiency and the concentration of circulating AAT polymers.
CX3CR1 gene expression levels in peripheral blood mononuclear cells (PBMCs) related to alpha-1 antitrypsin-deficiency (AATD) and plasma concentrations of CX3CR1 ligand (CX3CL1) and Z-AAT polymer. (A)PBMCs were isolated from AATD subjects and non-AATD controls. CX3CR1 gene expression relative to HPRT1 housekeeping gene was determined by real-time PCR using Taqman gene expression assays. Measurements were carried out in duplicates. Data are presented as median (IQR) in boxplots, lines represent medians. Outliers are defined as data points located outside the whiskers. p-Value was calculated by Mann-Whitney U test. (B) Plasma levels of CX3CL1 in AATD (plasma available for n = 38 AATD) and non-AATD individuals measured by ELISA. Measurements were carried out in triplicates. Data are presented as median (IQR) in boxplots with whiskers. Outliers are defined as data points located outside the whiskers. (C) Negative correlation of CX3CR1 mRNA in PBMCs and plasma Z-AAT polymer levels from ZZ AATD individuals from graph (B). Pearson’s correlation test, r2 = −0.313, p=0.055, n = 38.
-
Figure 1—source data 1
Source files, containing original data for Figure 1A and B, to document CX3CR1 expression (A), and plasma levels of CX3CL1 in alpha-1 antitrypsin-deficient (AATD) and non-AATD individuals (B).
- https://cdn.elifesciences.org/articles/64881/elife-64881-fig1-data1-v2.xlsx
Figure 1—figure supplement 1

Schematic presentation of the study design.
The German cohort comprises 41 ZZ alpha-1 antitrypsin-deficient (AATD) volunteers irrespective of clinical status and medications. For control, we collected blood from 21 non-AATD volunteers with normal AAT blood levels. We prepared peripheral blood mononuclear cells (PBMCs) for further gene expression analysis by real-time PCR and plasma for determination of Z-AAT polymers by nephelometry. The Leiden cohort consisting of 12 ZZ AATD emphysema patients was used for gene expression analysis.
Figure 2 with 5 supplements
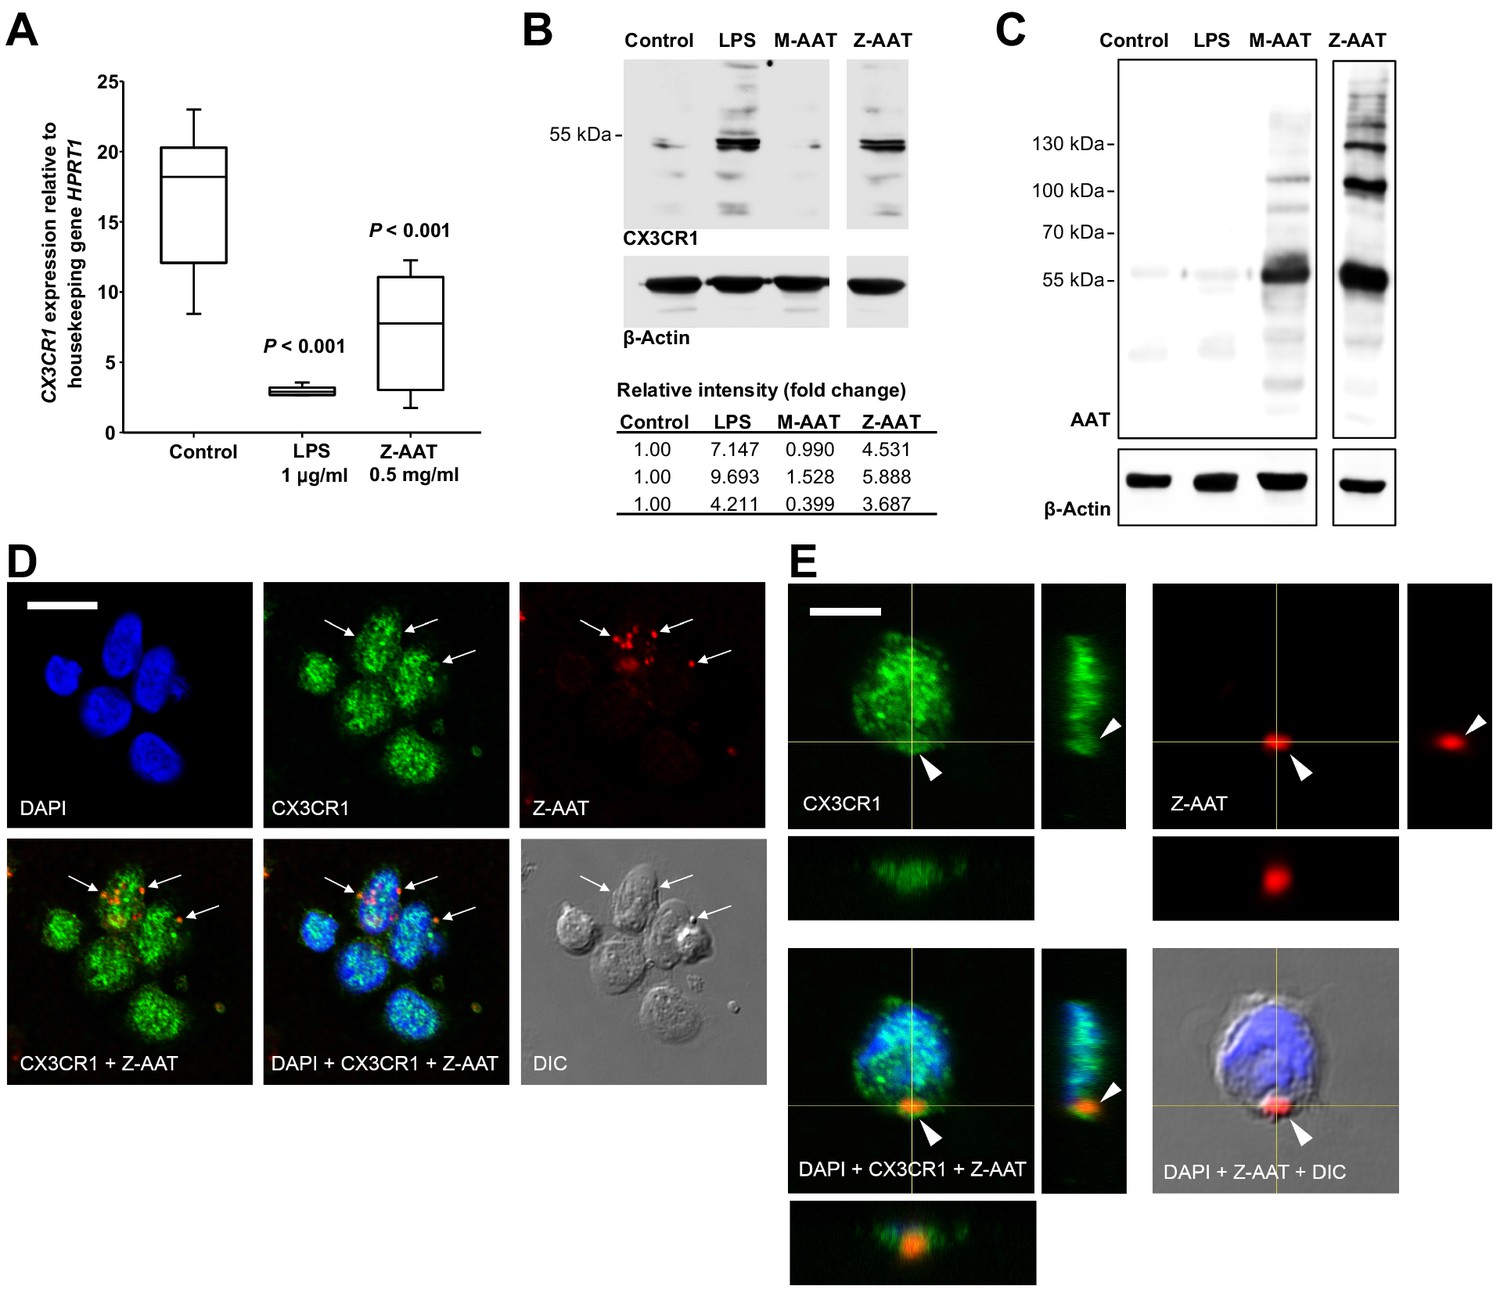
Effects of Z alpha-1 antitrypsin (Z-AAT) and M-AAT on CX3CR1 mRNA and protein expression.
(A) CX3CR1 gene expression relative to HPRT1 housekeeping gene was determined by real-time PCR using Taqman gene expression assays. Peripheral blood mononuclear cells (PBMCs) were incubated for 18 hr with plasma-derived Z-AAT, lipopolysaccharide (LPS), or M-AAT in the concentrations as indicated, or with RPMI medium alone (control). The data from n = 6 independent experiments are presented as median (IQR) in box and whisker plot format; lines represent medians in each box. Measurements were carried out in duplicates. p-Value was calculated by nonparametric Kruskal-Wallis test. (B) Representative uncut Western blot (n = 3 independent experiments) of CX3CR1 in RIPA lysates prepared from PBMCs incubated for 18 hr alone or with LPS (1 µg/ml), M-AAT (1 mg/ml), or Z-AAT (0.5 mg/ml). For analysis of CX3CR1, equal amounts of protein were separated by SDS-PAGE under reducing conditions. Relative intensities were calculated for each band using the ratio relative to β-actin, as a loading control, and then normalized by the experimental control. (C) For analysis of cellular AAT, the same lysates were separated under non-reducing conditions. Western blots were probed with polyclonal rabbit anti-human AAT recognizing monomeric, polymeric, or truncated forms of AAT. One representative blot from n = 3 independent experiments is shown. β-Actin was used for a loading control. (D) and (E) Co-distribution of Z-AAT polymers with CX3CR1 in human total PBMCs incubated with 0.5 mg/ml Z-AAT polymers for 18 hr. (D) Immunofluorescence microscopy revealed co-localization of Z-AAT polymers (red) with CX3CR1-positive structures (green). Arrows point areas of co-localization. Scale bar, 10 µm. (E) Confocal microscopy 3D stack with orthogonal reconstruction shows an aggregate of Z-AAT polymers (red) surrounded by CX3CR1-positive (green) cellular extensions forming a cap-like structure (arrowhead). Scale bar, 5 µm. The images with indicated channels merged and the corresponding differential interference contrast (DIC) image are presented. 4', 6- Diamidino 2-phenylindole (DAPI) was used for nuclei staining (blue).
-
Figure 2—source data 1
Source file, containing original data for Figure 2A, to document reduced CX3CR1 expression in peripheral blood mononuclear cells (PBMCs) treated with Z alpha-1 antitrypsin (Z-AAT) or lipopolysaccharide (LPS) (A).
- https://cdn.elifesciences.org/articles/64881/elife-64881-fig2-data1-v2.xlsx
Figure 2—figure supplement 1
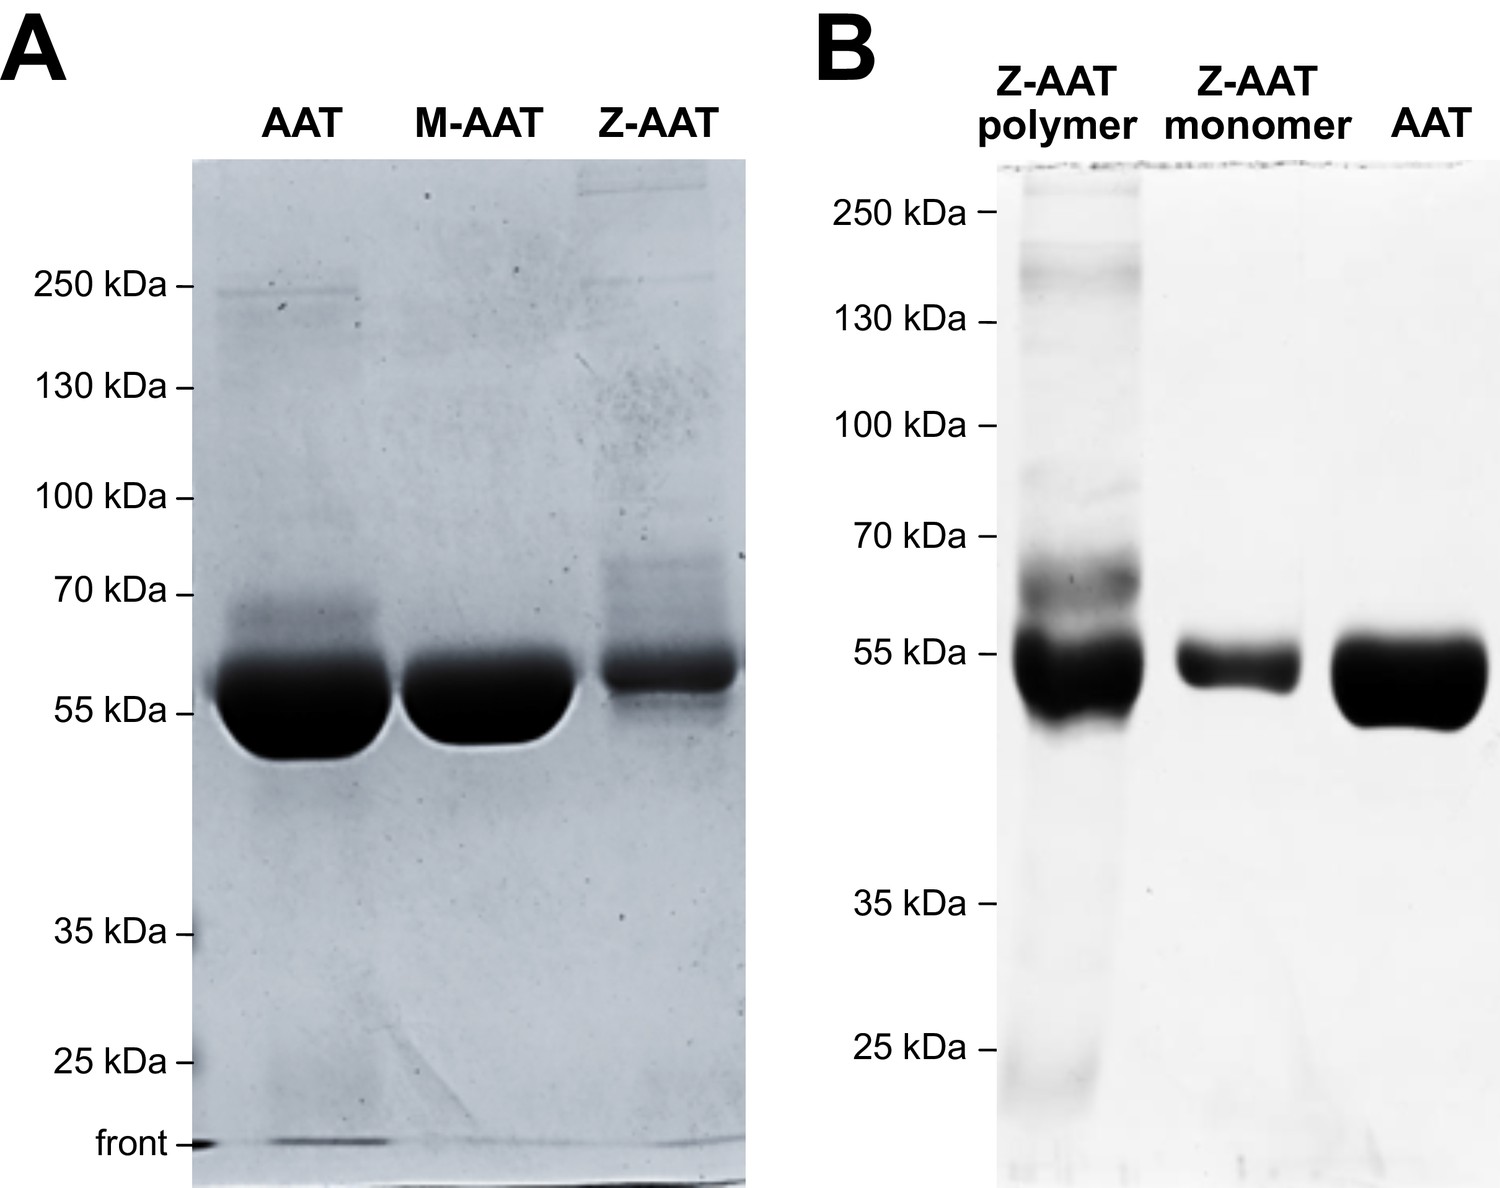
Quality control of isolated M- and Z-AAT (alpha-1 antitrypsin) proteins by SDS-PAGE.
(A) Plasma M- and Z-AAT was purified by affinity chromatography with AAT-specific Alpha-1 Antitrypsin Select matrix. Proteins were run on a 10% SDS-PAGE gel and stained with Coomassie Blue G250. AAT (Respreeza) was added as a positive control. Gels were run for each protein preparations. One representative gel is shown. (B) Z-AAT polymers were purified by affinity chromatography with AAT-specific Alpha-1 Antitrypsin Select matrix and monomeric Z-AAT was separated by using vivaspin-20, 100 kDa centrifugal column units. Z-polymers, Z-monomers, and native AAT (as control) were run on a 10% SDS-PAGE gel without sample heating and without β-mercaptoethanol, and stained with Coomassie Blue G250. Representative gel is shown.
Figure 2—figure supplement 2
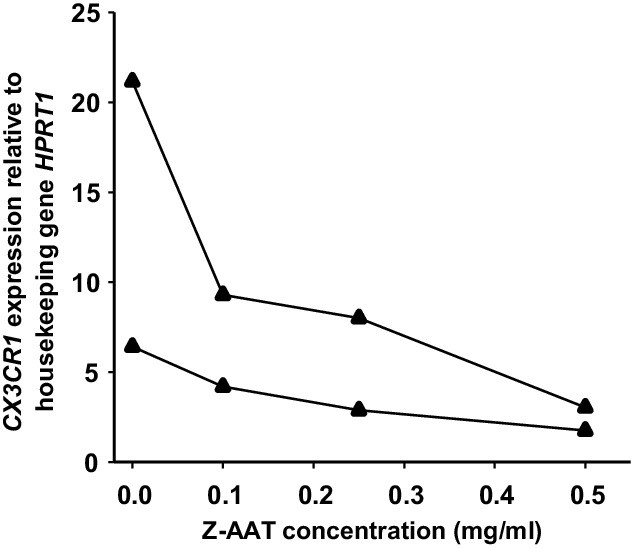
Z alpha-1 antitrypsin (Z-AAT) in a concentration-dependent manner reduces CX3CR1 mRNA expression in peripheral blood mononuclear cells (PBMCs) isolated from healthy donors.
PBMCs were incubated for 18 hr with plasma-derived Z-AAT in the concentrations as indicated. CX3CR1 gene expression relative to HPRT1 housekeeping gene was determined by real-time PCR using Taqman gene expression assays. Curves show results from two independent experiments. Each point represents mean of two repeats.
Figure 2—figure supplement 3
Z alpha-1 antitrypsin (Z-AAT) induces association of CX3CR1 with lipid rafts.
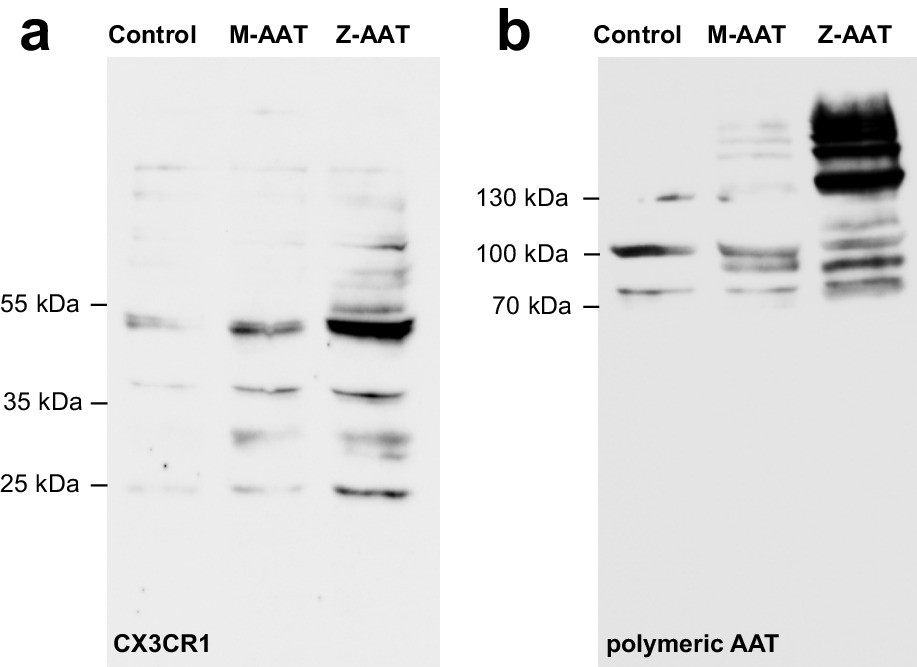
Lipid rafts were solubilized from membrane fractions with UltraRIPA kit. (a) For analysis of CX3CR1, equal amounts of protein were separated by SDS-PAGE under reducing conditions. One representative blot from n = 3 independent experiments is shown. (b) For analysis of lipid raft associated AAT polymers, the same samples were separated under non-reducing conditions. The Western blot was probed with monoclonal antibody (2C1) recognizing polymeric AAT. One representative blot from n = 3 independent experiments is shown.
Figure 2—figure supplement 4
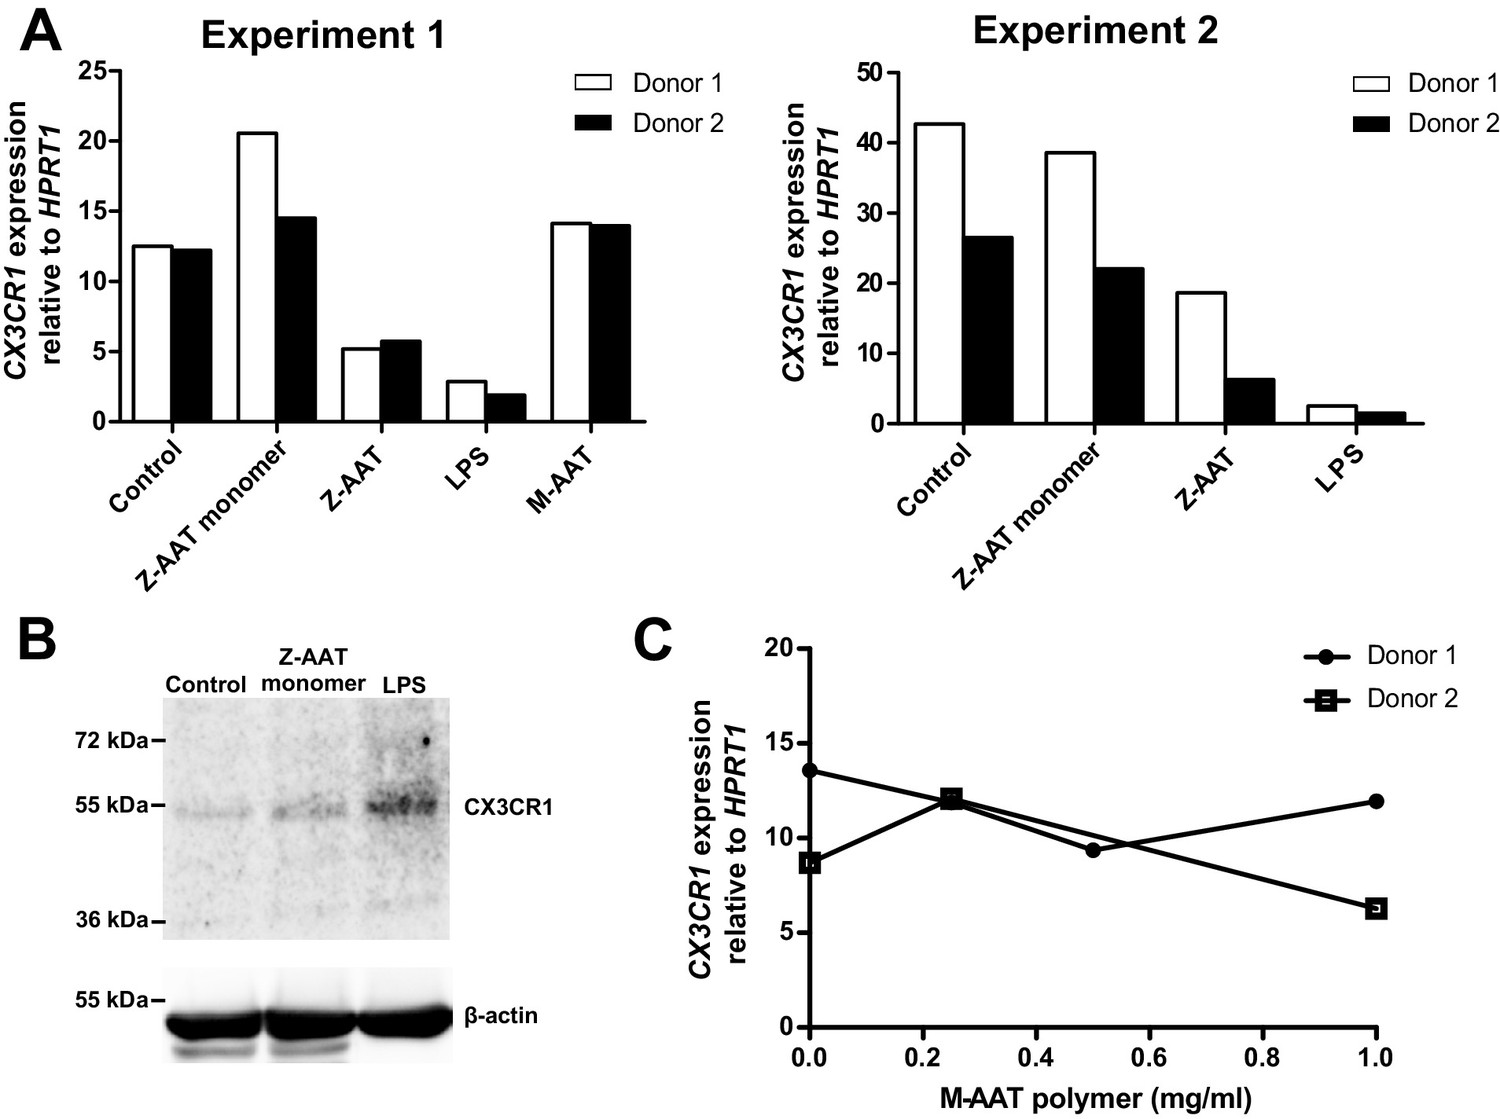
CX3CR1 transcript and protein expressions in the presence of Z alpha-1 antitrypsin (Z-AAT) monomer, Z-AAT polymer, native M-AAT, and M-AAT polymer.
(A) CX3CR1 mRNA expression relative to HPRT1 was determined by real-time PCR using Taqman gene expression assays. Peripheral blood mononuclear cells (PBMCs) were incubated for 18 hr in RPMI medium alone or with addition of Z-AAT monomer or Z-AAT polymer (each 0.5 mg/ml), or lipopolysaccharide (LPS) (1 µg/ml) or native M-AAT (0.5 mg/ml). Measurements were carried out in duplicates. Data are represented as bars from four independent experiments. (B) Levels of CX3CR1 lysates prepared in RIPA buffer from PBMCs incubated for 18 hr with RPMI (control) and with Z-AAT monomer (0.5 mg/ml) or LPS (1 µg/ml) (used as a positive control). For analysis of CX3CR1, equal amounts of protein were separated by 10% SDS-PAGE under reducing conditions followed by Western blotting. Representative uncut Western blot (n = 2 independent experiments) is shown. β-Actin was used for a loading control. (C) CX3CR1 mRNA expression relative to HPRT1 was determined by real-time PCR using Taqman gene expression assays. PBMCs were incubated for 18 hr in RPMI medium alone or with different concentrations of heat-induced M-AAT polymers (60°C, for 3 hr). Measurements were carried out in duplicates. Data are represented as curves from two independent donors.
Figure 2—figure supplement 5
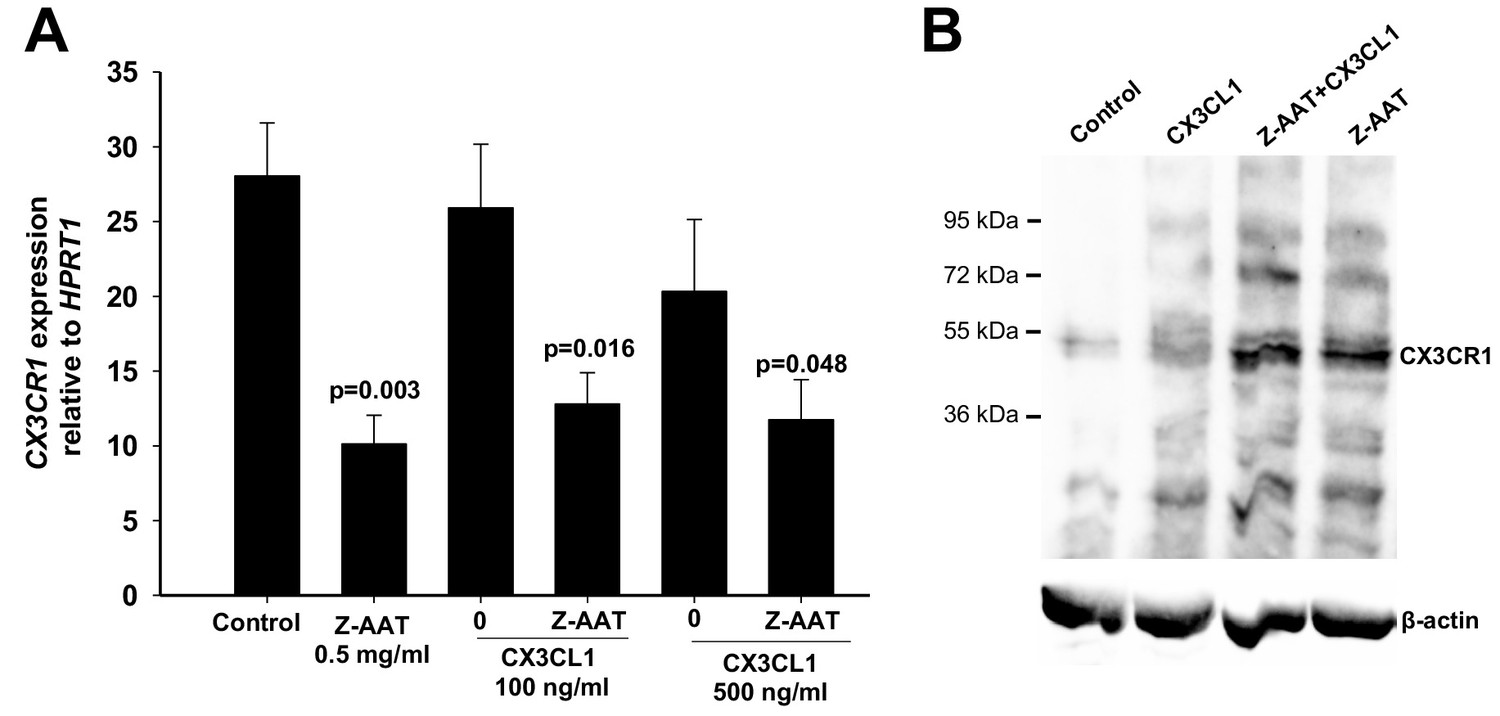
Effect of CX3CL1 alone or in combination with Z alpha-1 antitrypsin (Z-AAT) on CX3CR1 transcript and protein expression.
Peripheral blood mononuclear cells (PBMCs) were incubated for 18 hr with CX3CL1 and Z-AAT polymers separately or in combination or with RPMI medium alone (control). (A) CX3CR1 gene expression relative to HPRT1 housekeeping gene was determined by real-time PCR using Taqman gene expression assays. The data from n = 8 independent experiments for control and 100 ng/ml CX3CL1 conditions and n = 4 for 500 ng/ml CX3CR1 conditions with or without Z-AAT are presented as mean (SEM). Measurements were carried out in duplicates. p-Values were calculated from one-way ANOVA test. (B) Levels of CX3CR1 in RIPA lysates prepared from PBMCs incubated for 18 hr with RPMI (control) and with CX3CL1 (100 ng/ml) and Z-AAT (0.5 mg/ml) separately or in combination. For analysis of CX3CR1, equal amounts of protein were separated by SDS-PAGE under reducing conditions followed by Western blotting. Representative uncut Western blot (n = 2 independent experiments) is shown. β-Actin was used for a loading control.
-
Figure 2—figure supplement 5—source data 1
Source file, containing original data for Figure 2—figure supplement 5A, to document CX3CR1 gene expression in peripheral blood mononuclear cell (PBMC).
- https://cdn.elifesciences.org/articles/64881/elife-64881-fig2-figsupp5-data1-v2.xlsx
Figure 3 with 1 supplement
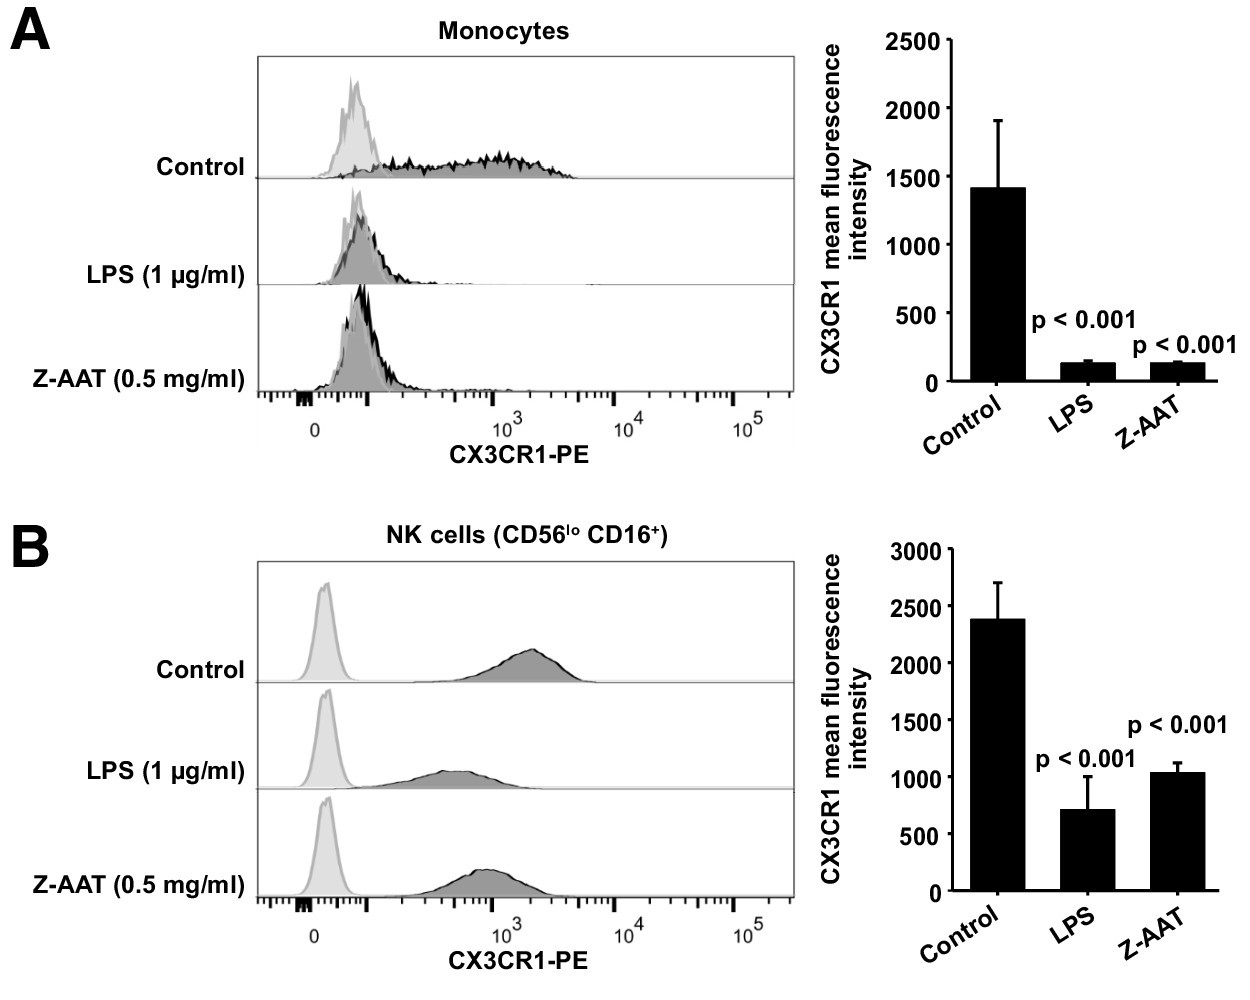
Flow cytometric analysis of CX3CR1 surface expression in peripheral blood mononuclear cells (PBMCs) after incubation with RPMI alone (control), Z alpha-1 antitrypsin (Z-AAT), or lipopolysaccharide (LPS) in the concentrations as indicated for 18 hr.
CX3CR1-expressing cells were found in the monocyte gate (A) and in the NK cell gate (CD56lo CD16+) (B). Histograms show representative results and bars represent mean (SD) of n = 4 independent biological repeats each measured one time. After incubation with Z-AAT or LPS, monocytes and NK cells show significantly reduced CX3CR1 surface expression in comparison to untreated control cells. p-Values were calculated by one-way ANOVA.
-
Figure 3—source data 1
Source files, containing original data for Figure 3A,B, to document reduced CX3CR1 surface expression in monocytes (A) and NK cells (B) after treatment with Z alpha-1 antitrypsin (Z-AAT) or lipopolysaccharide (LPS) (A).
- https://cdn.elifesciences.org/articles/64881/elife-64881-fig3-data1-v2.xlsx
Figure 3—figure supplement 1
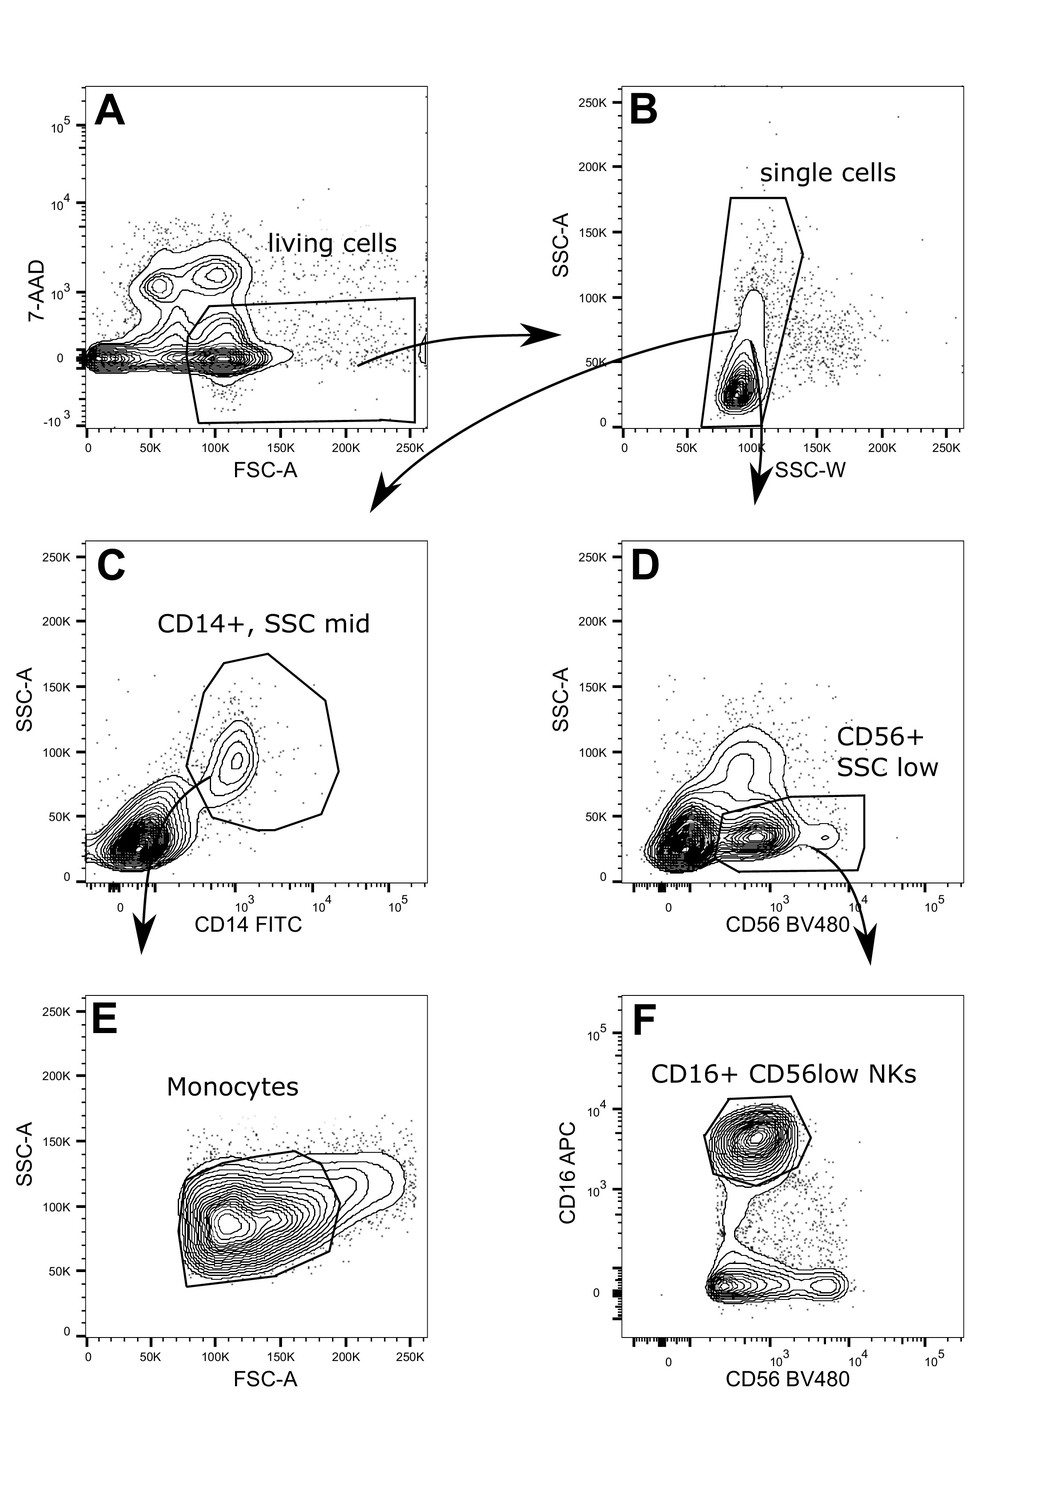
Gating strategy: sequential gating to identify monocytes and NK cells from total peripheral blood mononuclear cells (PBMCs).
PBMCs were stained with CD14, CD16, and CD56 in the presence of 7-amino-actinomycin D (7-AAD). Dead cells were excluded by 7-AAD. From the single cells, CD14+ cells with a mid-level of granularity (SSC mid) were further gated for a mid-level FSC to identify monocytes. For the identification of NK cells, CD56+ cells with a low level of granularity (SSC low) were further selected by CD16. The above plots are representative for four different donors.
Figure 4 with 2 supplements
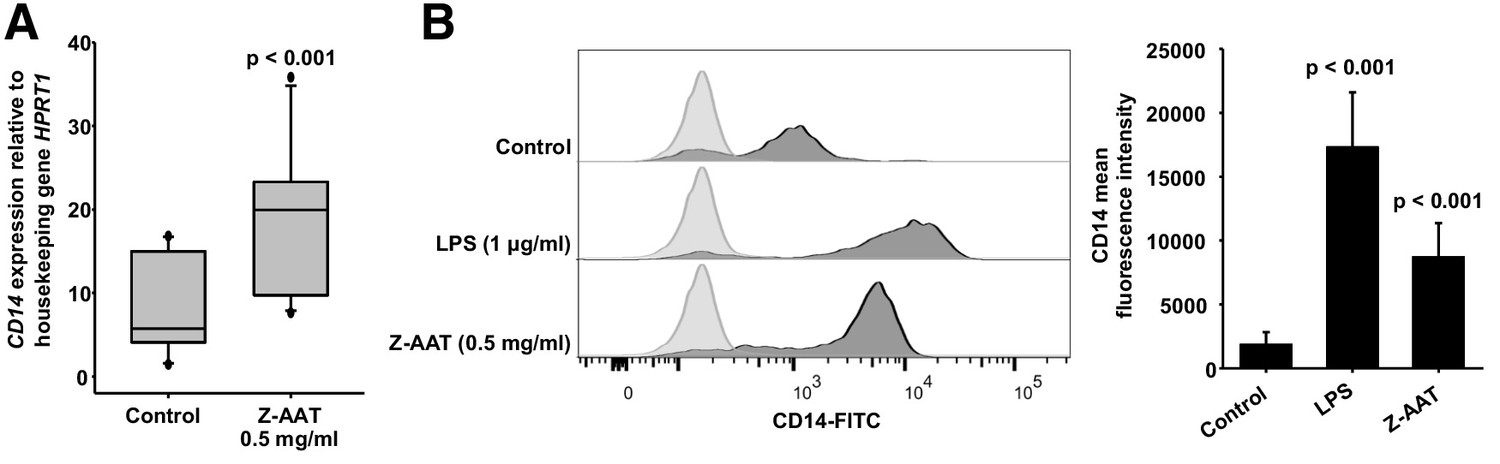
Z alpha-1 antitrypsin (Z-AAT) and lipopolysaccharide (LPS) induce CD14 expression.
(A) Z-AAT increases CD14 gene expression. Peripheral blood mononuclear cells (PBMCs) were incubated for 18 hr with 0.5 mg/ml Z-AAT or RPMI medium alone (control). CD14 mRNA expression relative to HPRT1 was determined by real-time PCR using Taqman gene expression assays. Measurements were carried out in duplicates. Data are represented as median (IQR) in boxplots, lines represent medians of n = 14 independent biological repeats. Outliers are defined as data points located outside the whiskers. p-Values were calculated using nonparametric Kruskal-Wallis test. (B) Z-AAT increases monocyte CD14 surface expression. PBMCs were cultured with RPMI (control), Z-AAT, or LPS for 18 hr. CD14 mean fluorescence intensities of monocytic cells were determined by flow cytometry. Histograms show representative results and bars represent mean (SD) of n = 4 independent biological repeats each measured one time. p-Values were calculated from ANOVA.
-
Figure 4—source data 1
Source files, containing original data for Figure 4A, B to document CD14 gene expression in peripheral blood mononuclear cells (PBMCs) (A) and CD14 surface expression in monocytes (B).
- https://cdn.elifesciences.org/articles/64881/elife-64881-fig4-data1-v2.xlsx
Figure 4—figure supplement 1
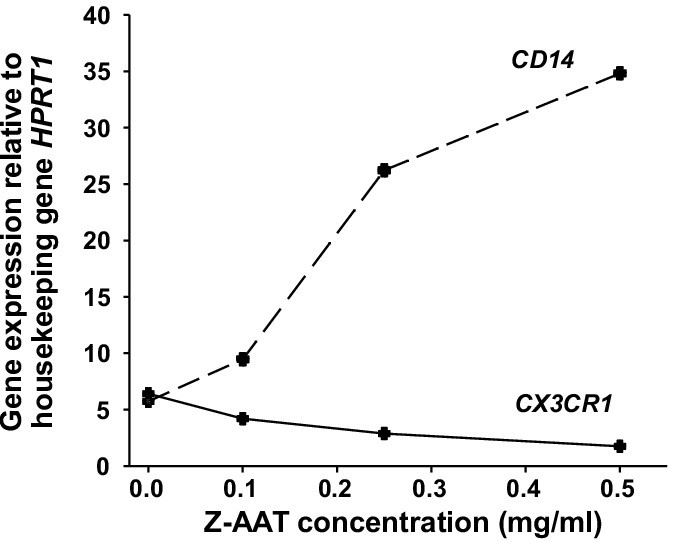
Inverse changes in CD14 and CX3CR1 mRNA expression in peripheral blood mononuclear cells (PBMCs) treated with different concentrations of Z alpha-1 antitrypsin (Z-AAT).
PBMCs were incubated for 18 hr with plasma-derived Z-AAT in the concentrations as indicated, or with RPMI medium alone (control). CX3CR1 and CD14 gene expression relative to HPRT1 housekeeping gene was determined by real-time PCR using Taqman gene expression assays. Curves represent two independent experiments.
Figure 4—figure supplement 2
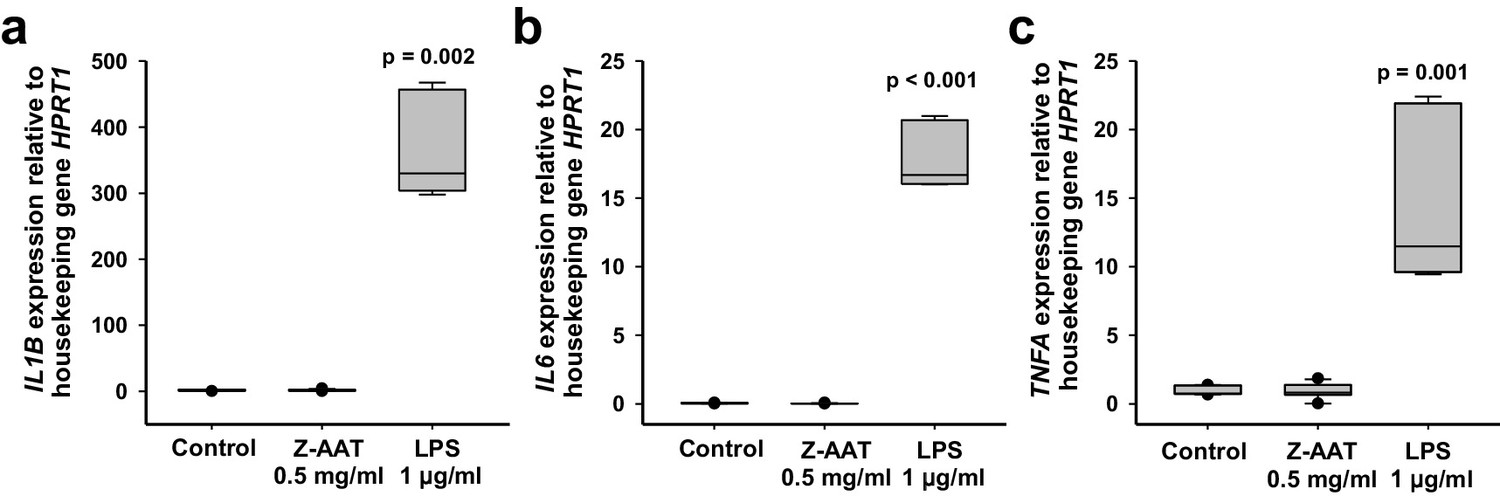
Z alpha-1 antitrypsin (Z-AAT) does not induce cytokine expression.
Peripheral blood mononuclear cells (PBMCs) were treated with Z-AAT or lipopolysaccharide (LPS) (used as a positive control) for 18 hr. IL1B (a), IL6 (b), and TNFA (c) mRNA expression relative to HPRT1 housekeeping gene was determined by real-time PCR using Taqman gene expression assays. Data presented as median (IQR) in box and whisker plots, lines represent medians, outliers are defined as data points located outside the whiskers. n = 4 independent experiments. p-Values were calculated by Kruskal-Wallis one-way analysis.
-
Figure 4—figure supplement 2—source data 1
Source files, containing original data for Figure 4—figure supplement 2 to document IL1B (a), IL6 (b), and TNFA (c) gene expression in peripheral blood mononuclear cells (PBMCs).
- https://cdn.elifesciences.org/articles/64881/elife-64881-fig4-figsupp2-data1-v2.xlsx
Tables
Key resources table
| Reagent type (species) or resource | Designation | Source or reference | Identifiers | Additional information |
|---|---|---|---|---|
| Biological sample (Homo sapiens) | PBMCs | Blood samples | Collected from 41 ZZ AATD and 21 non-AATD healthy controls | |
| Sequenced-based reagent (human) | CX3CR1 | Thermo Fisher Scientific | Taqman assay 4331182 | Hs00365842_m1 |
| Sequenced-based reagent (human) | TNFA | Thermo Fisher Scientific | Taqman assay 4331182 | Hs01113624_g1 |
| Sequenced-based reagent (human) | IL6 | Thermo Fisher Scientific | Taqman assay 4331182 | Hs00985639_m1 |
| Sequenced-based reagent (human) | IL1B | Thermo Fisher Scientific | Taqman assay 4331182 | Hs01555410_m1 |
| Sequenced-based reagent (human) | HPRT1 | Thermo Fisher Scientific | Taqman assay 4331182 | Hs02800695_m1 |
| Sequenced-based reagent (human) | CD14 | Thermo Fisher Scientific | Taqman assay 4331182 | Hs00169122_g1 |
| Other | Non-adherent 12-well plates | Greiner Bio-One | 665970 | |
| Other | Alpha-1 Antitrypsin Select matrix | GE Healthcare Life Sciences, Cytiva | 17547201 | |
| Other | Plasma purified human AAT | CSL Behring | Respreeza | |
| Other | LPS | Sigma-Aldrich | L2880 | Escherichia coli O55:B5 |
| Commercial assay or kit | Pierce Chromogenic Endotoxin Quant Kit | Thermo Fisher Scientific | A39553 | |
| Commercial assay or kit | UltraRIPA kit | BioDynamics Laboratory | F015 | |
| Antibody | Anti-AAT polymer, LG96 (mouse monoclonal) | Deposited at German Collection of Microorganisms and Cell Cultures: DSM ACC3092 | LG96 | ELISA: Coating: 1 µg/ml; LG96-HRP conjugate: (1:2000) Immunofluorescence: (1:5000) |
| Antibody | Anti-human AAT (rabbit polyclonal) | Agilent Dako | A001202-2 | (1:800) |
| Antibody | Anti-AAT polymer (mouse monoclonal) | Hycult Biotech | Clone 2C1; HM2289 | (1:500) |
| Antibody | Anti-CX3CR1 (rabbit polyclonal) | Abcam | ab8021 | (1:500) |
| Antibody | Anti-β-actin (mouse monoclonal) | Sigma-Aldrich | Clone AC-15; A3854 | HRP-conjugated; (1:20,000) |
| Antibody | Anti-CX3CR1 (rabbit polyclonal) | Abcam | ab8021 | (1:500) |
| Antibody | Anti-CX3CR1 (mouse monoclonal) | Invitrogen, Thermo Fisher Scientific | Clone 2A9-1; 12-6099-42 | PE-conjugated; 5 µl per test |
| Antibody | Anti-CD14 (mouse monoclonal) | Invitrogen, Thermo Fisher Scientific | Clone TuK4; MHCD1401 | FITC-conjugated; 5 µl per test |
| Antibody | Anti-CD16 (mouse monoclonal) | Immunotools | Clone 3G8; 21278166 | APC-conjugated; 5 µl per test |
| Antibody | Anti-CD56 (mouse monoclonal) | BD Biosciences | Clone NCAM16.2; 566124 | BV-480 conjugated; 5 µl per test |
| Peptide, recombinant protein | Human CX3CL1/Fractalkine | Bio-Techne | 365-FR-025 | |
| Software, algorithm | FlowJo | Becton, Dickinson and Company | v10 | |
| Software, algorithm | SigmaPlot 14 | Systat Software | v14.0 |
Table 1
Primers for gene expression analysis.
| Primer | Assay ID |
|---|---|
| CX3CR1 | Hs00365842_m1 |
| TNFA | Hs01113624_m1 |
| IL6 | Hs00985639_m1 |
| IL1B | Hs01555410_s1 |
| HPRT1 | Hs02800695_m1 |
| CD14 | Hs00169122_g1 |
Additional files
Download links
A two-part list of links to download the article, or parts of the article, in various formats.
Downloads (link to download the article as PDF)
Open citations (links to open the citations from this article in various online reference manager services)
Cite this article (links to download the citations from this article in formats compatible with various reference manager tools)
Polymerization of misfolded Z alpha-1 antitrypsin protein lowers CX3CR1 expression in human PBMCs
eLife 10:e64881.
https://doi.org/10.7554/eLife.64881


