Evolution of cytokine production capacity in ancient and modern European populations
- Department of Internal Medicine and Radboud Center for Infectious diseases (RCI), Radboud University Nijmegen Medical Centre, Netherlands
- Radboud Institute for Molecular Life Sciences (RIMLS), RadboudUniversity Medical Center, Netherlands
- Department of Computational Biology for Individualised Infection Medicine, Centre for Individualised Infection Medicine (CiiM), a joint venture between Helmholtz-Centre for Infection Research (HZI) and the Hannover Medical School (MHH), Germany
- TWINCORE, Centre for Experimental and Clinical Infection Research, a joint venture between Helmholtz-Centre for Infection Research (HZI) and the Hannover Medical School (MHH), Germany
- Department of Genetics, University Medical Centre Groningen, Netherlands
- Human Evolution, Department of Organismal Biology, Uppsala University, Sweden
- Centre for Anthropological Research, Department of Anthropology and Development Studies, University of Johannesburg, South Africa
- Institut de Biologia Evolutiva (UPF-CSIC), Universitat Pompeu Fabra, Spain
- Department for Genomics & Immunoregulation, Life and Medical Sciences Institute (LIMES), University of Bonn, Germany
Figures
Figure 1 with 3 supplements
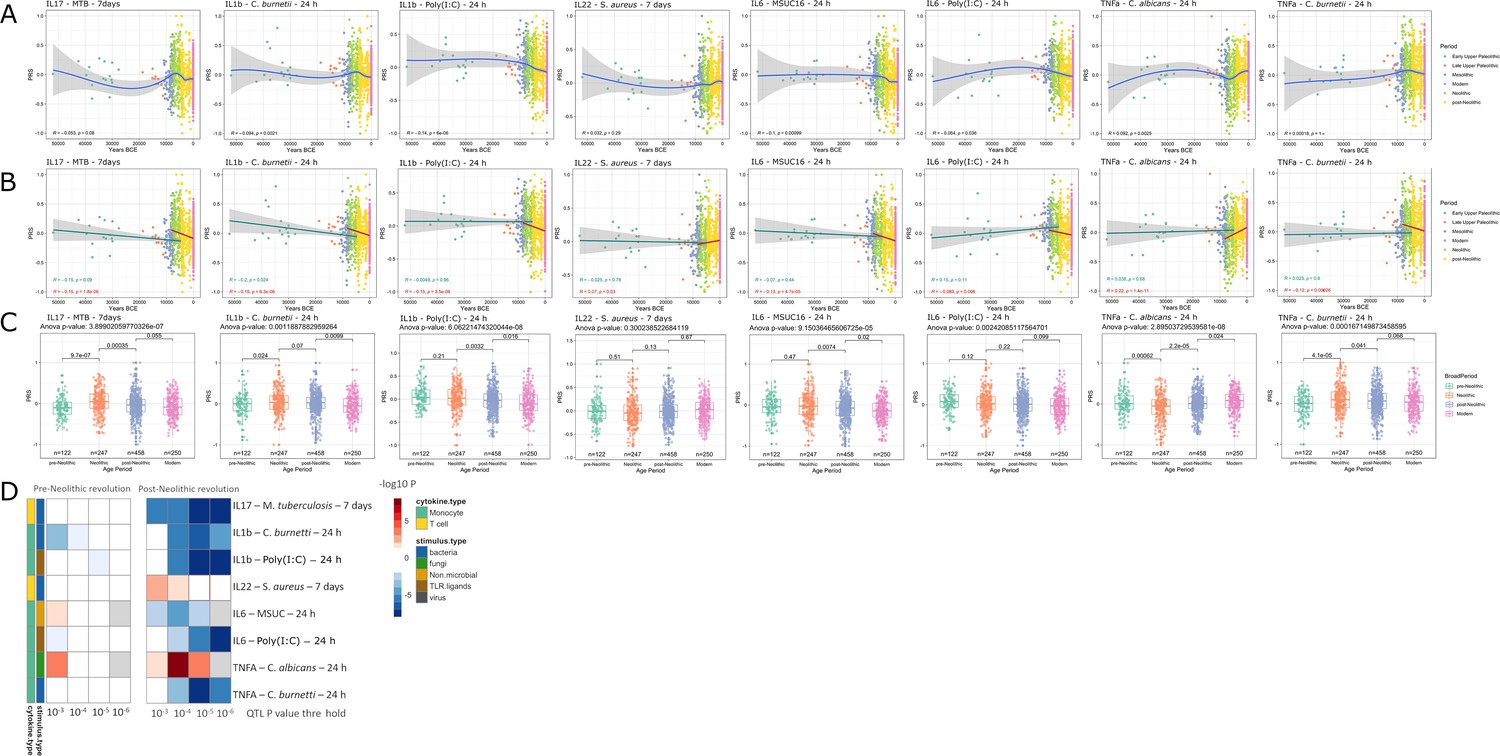
Distribution of PRS of cytokine response QTLs across time.
(A–C) Polygenic risk score (PRS) models based on quantitative trait loci (QTLs) at a p-value threshold of 1e-5. Gray area around regression lines represents the 95% confidence interval. (A) LOESS regression models showing the changing differences in PRS across time. (B) Dual linear models showing the difference in trends before and after the Neolithic revolution. (C) Boxplots showing the difference in mean PRS between adjacent broad time periods using a t-test and the overall difference in means using analysis of variance (ANOVA). (D) Heatmap showing the consistency in regression trends before and after the Neolithic revolution using different QTL inclusion thresholds (1e-3 to 1e-6). Intracellular organisms that can cause zoonotic disease: Mycobacterium tuberculosis, Coxiella burnetti. Extracellular organisms: Staphylococcus aureus, Candida albicans. MSUC: monosodium urate crystals. PolyIC: polyinosinic:polycytidylic acid.
Figure 1—figure supplement 1

Correlation between cytokine PRS and time.
Missing genotype rates ranged through 0.96, 0.9, 0.8, and 0.7. Quantitative trait locus (QTL) p-values for variants included in our polygenic risk score (PRS) models ranged through 10−3, 10−4, 10−5, and 10−6. The color key indicates the range of -log10 p-values of the Pearson correlation between PRS and time. Red and blue indicate positive and negative association, respectively.
Figure 1—figure supplement 2
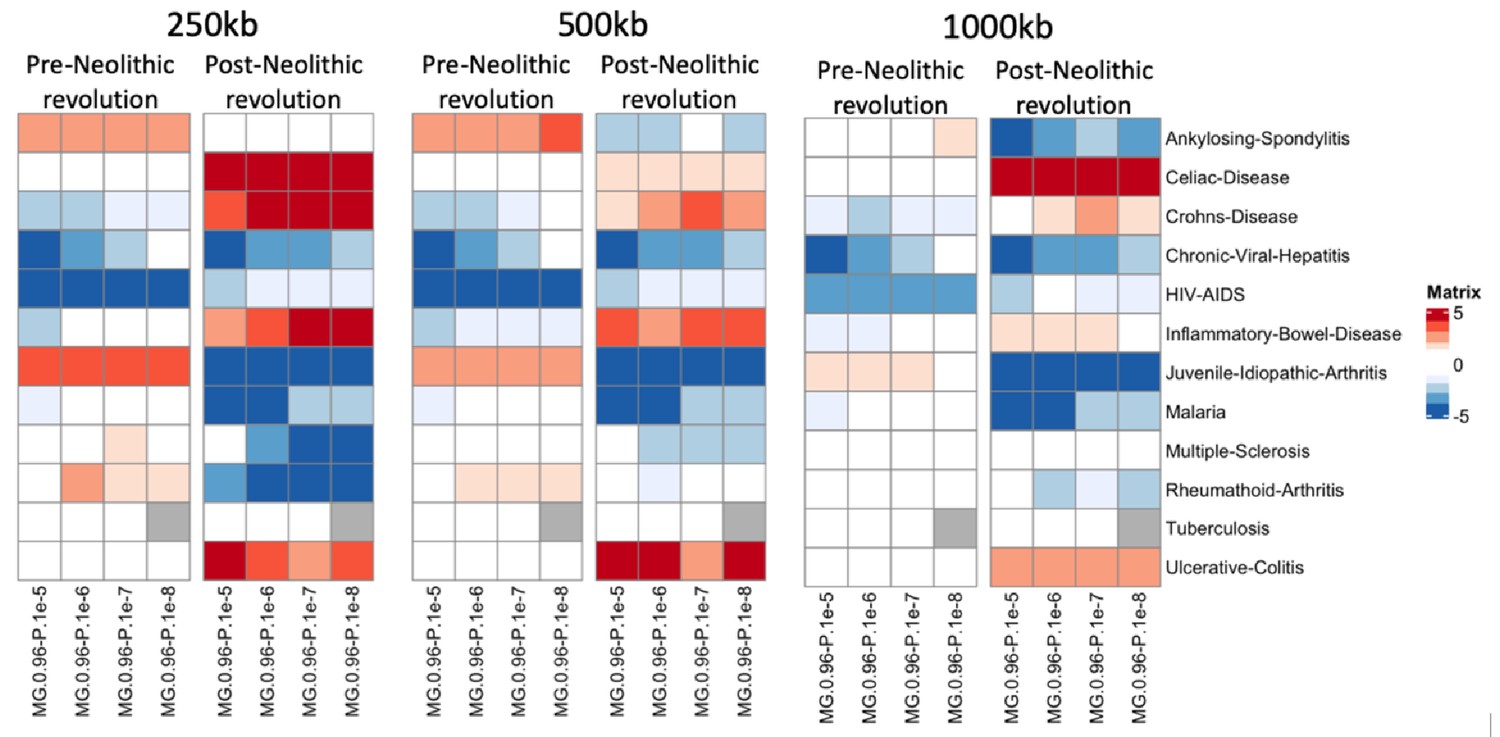
PRS correlation pre- and post-Neolithic revolution using polygenic scores calculated at various window sizes.
Heatmaps showing changes in polygenic risk scores (PRS) for immune-related complex traits before and after the Neolithic revolution are shown using window sizes 250 kb, 500 kb, and 1000 kb around lead single-nucleotide polymorphisms (SNPs).
Figure 1—figure supplement 3
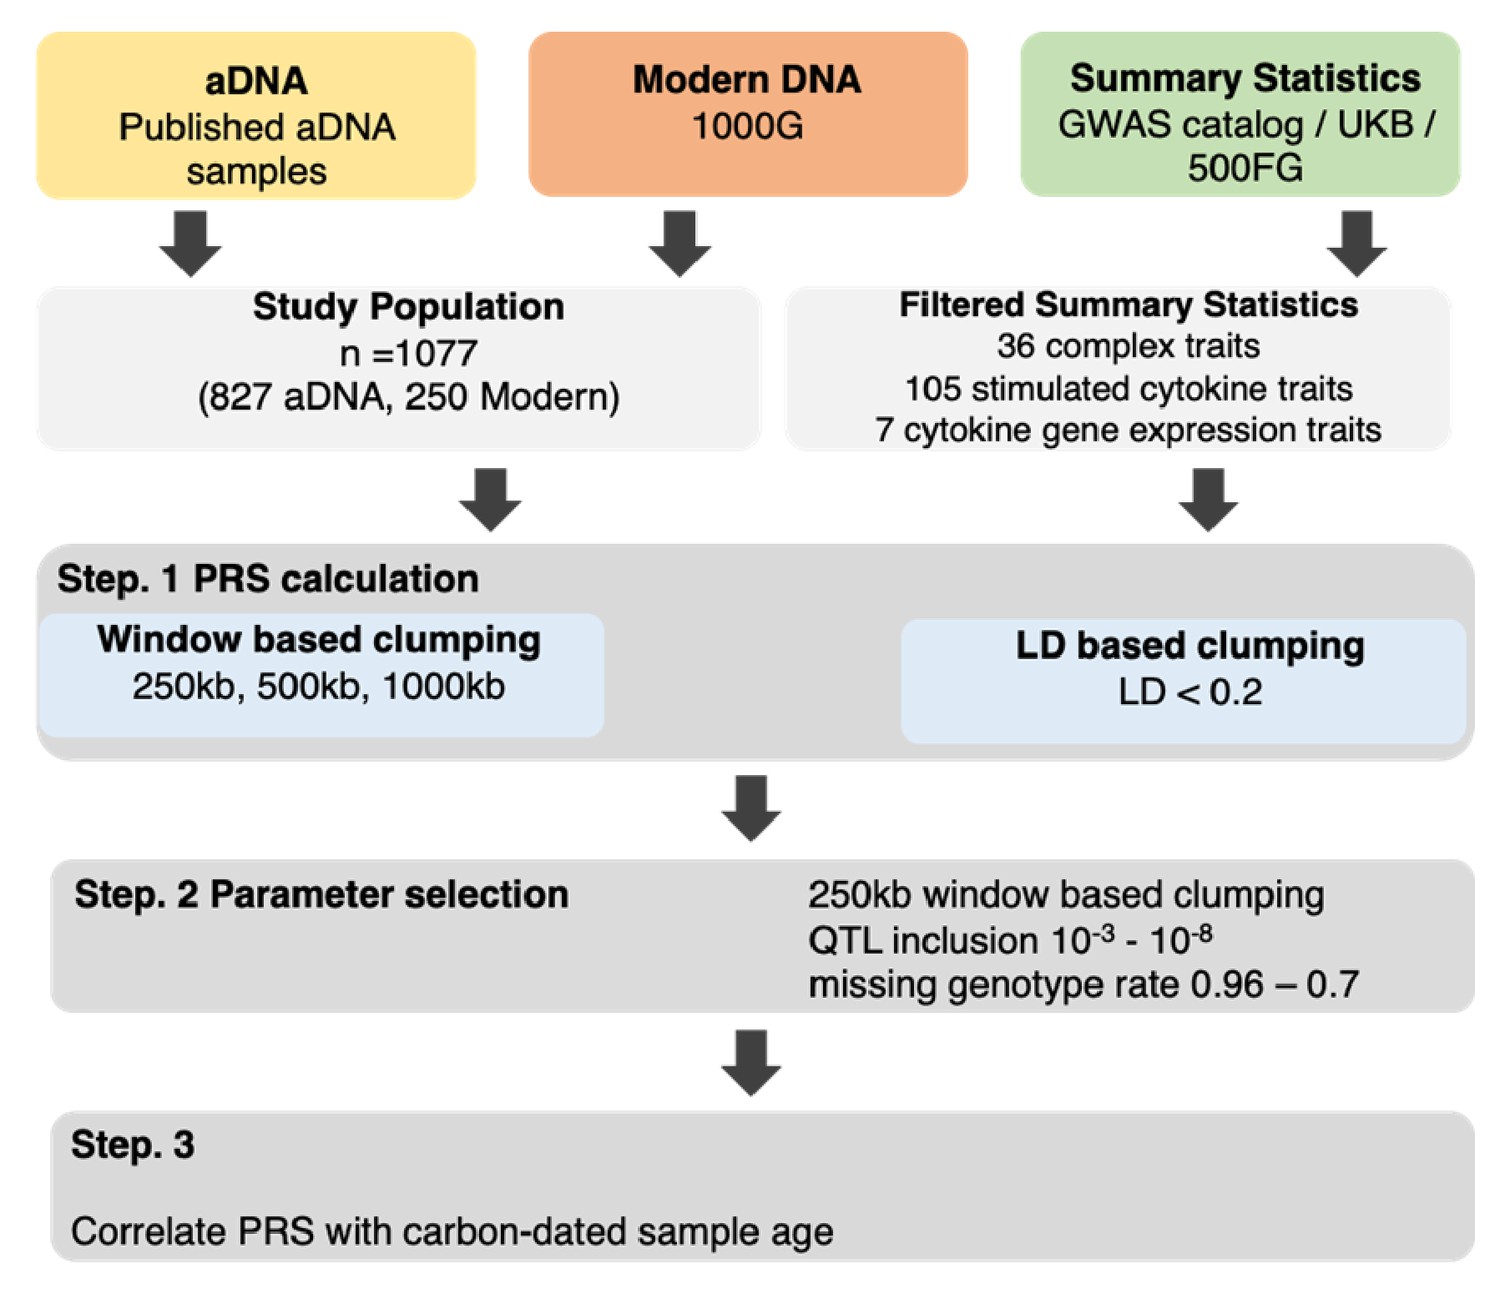
aDNA and modern DNA samples of European individuals were used in combination with summary statistics from predominantly.
European populations to calculate PRS of immune-related traits. This was done at various threshold combinations before correlating the scores with the sample age.
Figure 2 with 1 supplement
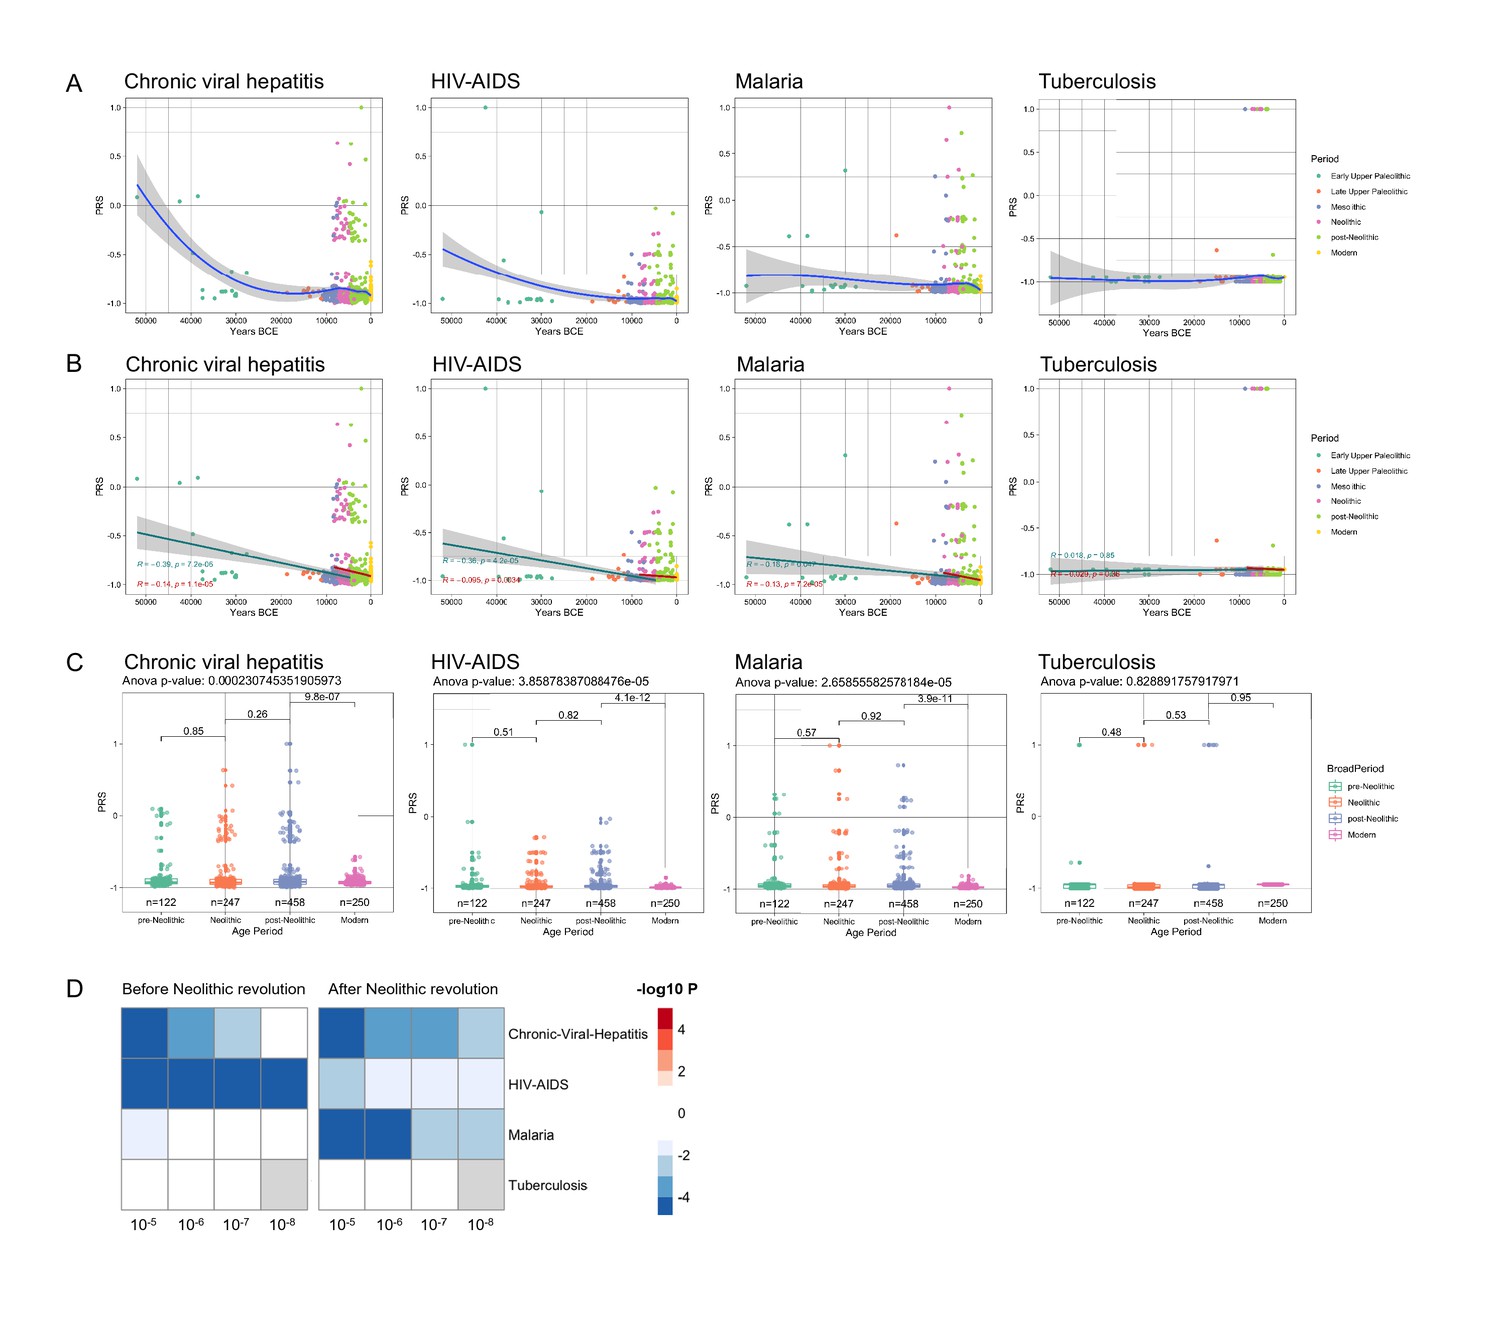
Distribution of PRS of infectious diseases across time.
(A–C) Polygenic risk score (PRS) models based on a p-value threshold of 1e-5. Gray area around regression lines represents the 95% confidence interval. (A) LOESS regression models showing the changing differences in PRS across time. (B) Dual linear models showing the difference in trends before and after the Neolithic revolution. (C) Boxplots showing the difference in mean PRS between adjacent broad time periods using a t-test and the overall difference in means using analysis of variance (ANOVA). (D) Heatmap showing the consistency in regression trends before and after the Neolithic revolution using different quantitative trait locus (QTL) inclusion thresholds (1e-5 to 1e-8).
Figure 2—figure supplement 1
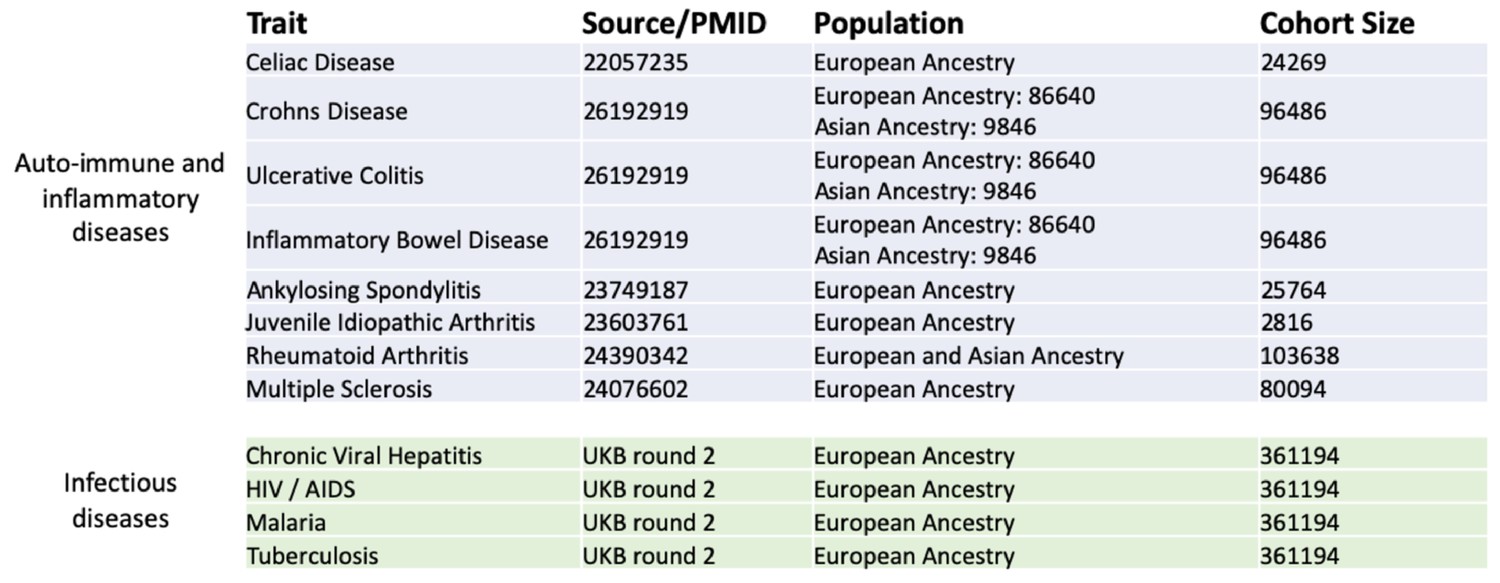
GWAS summary statistics and cohorts used for PRS calculation.
Traits were separated into two categories: auto-immune and inflammatory disease-related traits, and infectious disease-related traits. Genome-wide association studies (GWAS) summary statistics from predominantly European populations were selected.
Figure 3

Distribution of PRS of inflammatory diseases across time.
(A–C) Polygenic risk score (PRS) models based on a p-value threshold of 1e-5. Gray area around regression lines represents the 95% confidence interval. (A) LOESS regression models showing the changing differences in PRS across time. (B) Dual linear models showing the difference in trends before and after the Neolithic revolution. (C) Boxplots showing the difference in mean PRS between adjacent broad time periods using a t-test and the overall difference in means using analysis of variance (ANOVA). (D) Heatmap showing the consistency in regression trends before and after the Neolithic revolution using different quantitative trait locus (QTL) inclusion thresholds (1e-5 to 1e-8).
Figure 4 with 1 supplement
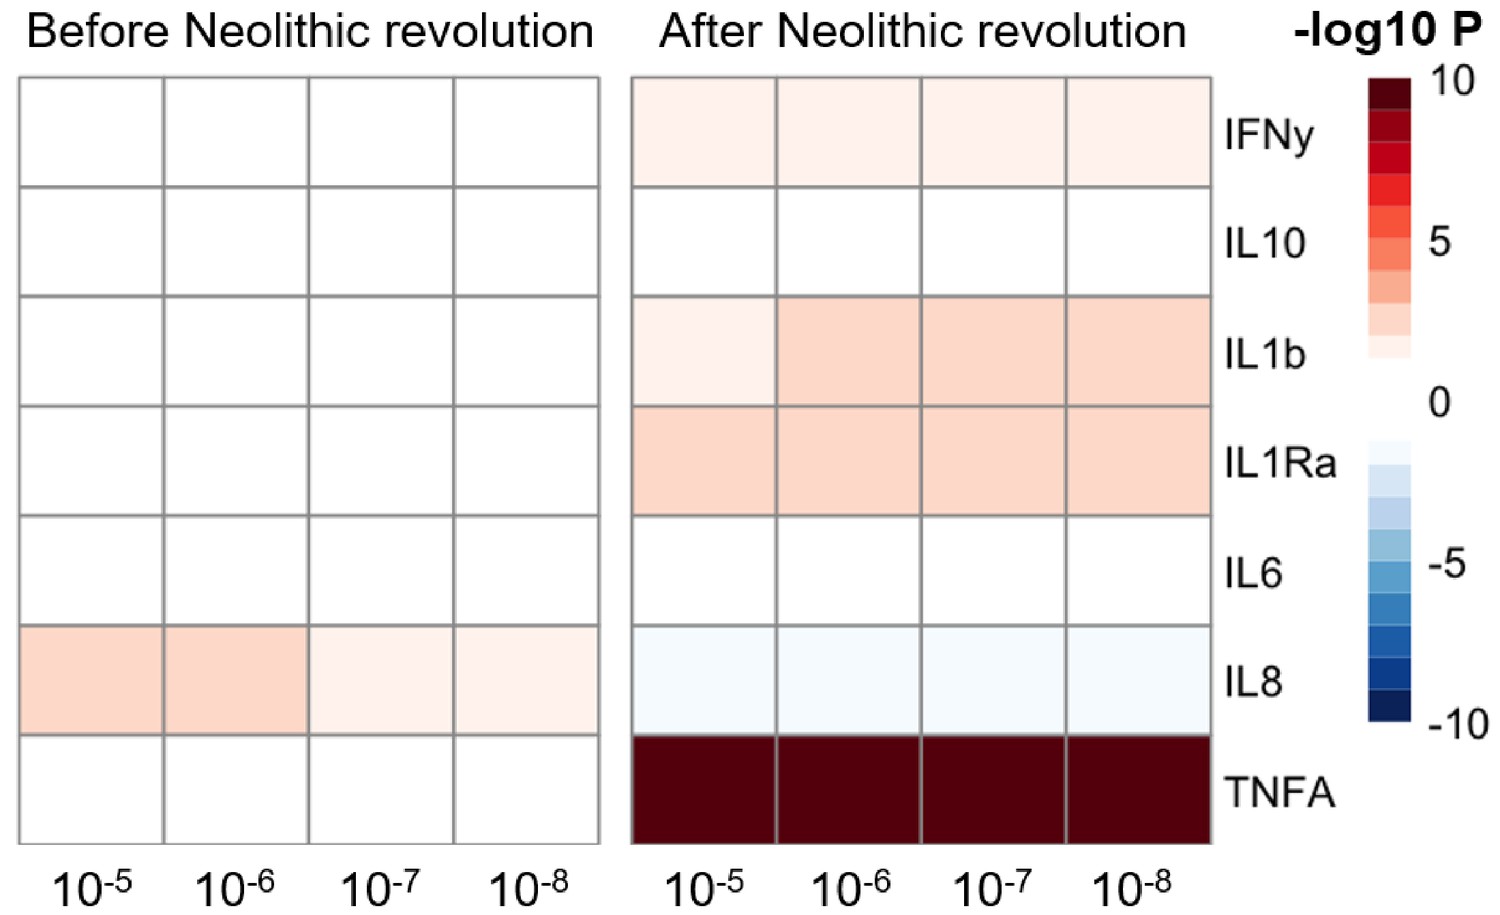
Changes in cytokine gene expression PRS across time before and after the Neolithic revolution using different QTL thresholds (1e-5 to 1e-8).
Missing genotype rates ranged through 0.96, 0.9, 0.8, and 0.7. Quantitative trait locus (QTL) p-values for variants included in our polygenic risk score (PRS) models ranged through 10−3, 10−4, 10−5, 10−6, 10−7, and 10−8. The color key indicates the range of -log10 p-values of the Pearson correlation between PRS and time. Red and blue indicate positive and negative association, respectively.
Figure 4—figure supplement 1
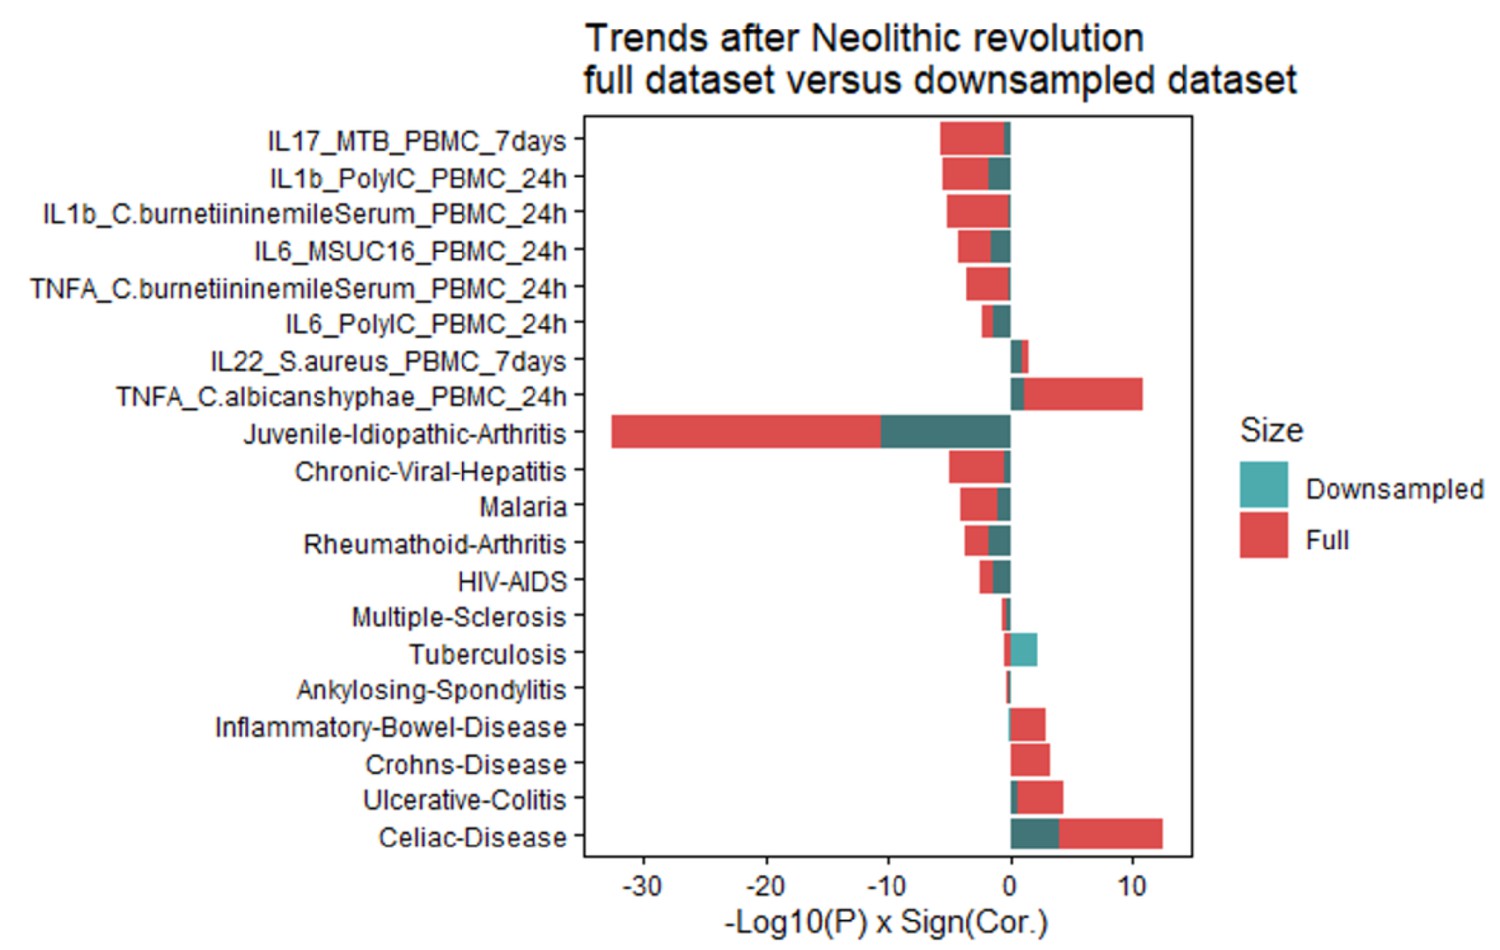
Robustness of correlation coefficients post-Neolithic is independent of the sample size.
Changes in polygenic risk scores (PRS) following the Neolithic revolution remain consistent after down-sampling samples from after the start of the Neolithic period to the same amount as samples before the Neolithic period. The -log10 p-value multiplied by the sign of the correlation coefficient is shown; the results for the down-sampled set are shown in blue and those for the full dataset are shown in red.
Additional files
-
Supplementary file 1
Stimulated cytokine expression combinations at different timepoints.
(a) Overview of the stimulus, cytokine, and time-point combinations. In total, 105 unique stimulated cytokine traits were available using various types of stimuli measuring both the innate and the adaptive immune response. (b) Tests for selection as opposed to the genetic drift were performed between populations from adjacent time periods. A two-tailed test was used to determine whether the mean trait Fst between pre-Neolithic–Neolithic, Neolithic–post-Neolithic, and post-Neolithic–Modern samples was significantly different compared to 10,000 random LD- and MAF-matched mean Fsts calculated using the same amount of single-nucleotide polymorphisms (SNPs).
- https://cdn.elifesciences.org/articles/64971/elife-64971-supp1-v1.xlsx
-
Transparent reporting form
- https://cdn.elifesciences.org/articles/64971/elife-64971-transrepform-v1.docx
Download links
A two-part list of links to download the article, or parts of the article, in various formats.
Downloads (link to download the article as PDF)
Open citations (links to open the citations from this article in various online reference manager services)
Cite this article (links to download the citations from this article in formats compatible with various reference manager tools)
Evolution of cytokine production capacity in ancient and modern European populations
eLife 10:e64971.
https://doi.org/10.7554/eLife.64971


