Collateral sensitivity associated with antibiotic resistance plasmids
- Servicio de Microbiología. Hospital Universitario Ramón y Cajal and Instituto Ramón y Cajal de Investigación Sanitaria, Spain
- Centro de Investigación Biológica en Red Epidemiología y Salud Pública, Instituto de Salud Carlos III, Spain
- Department of Biology and Wildlife Diseases, Faculty of Veterinary Hygiene and Ecology, University of Veterinary and Pharmaceutical Sciences, Czech Republic
- Red Española de Investigación en Patología Infecciosa. Instituto de Salud Carlos III, Spain
- Centro Nacional de Biotecnología-CSIC, Spain
Figures
Figure 1 with 2 supplements
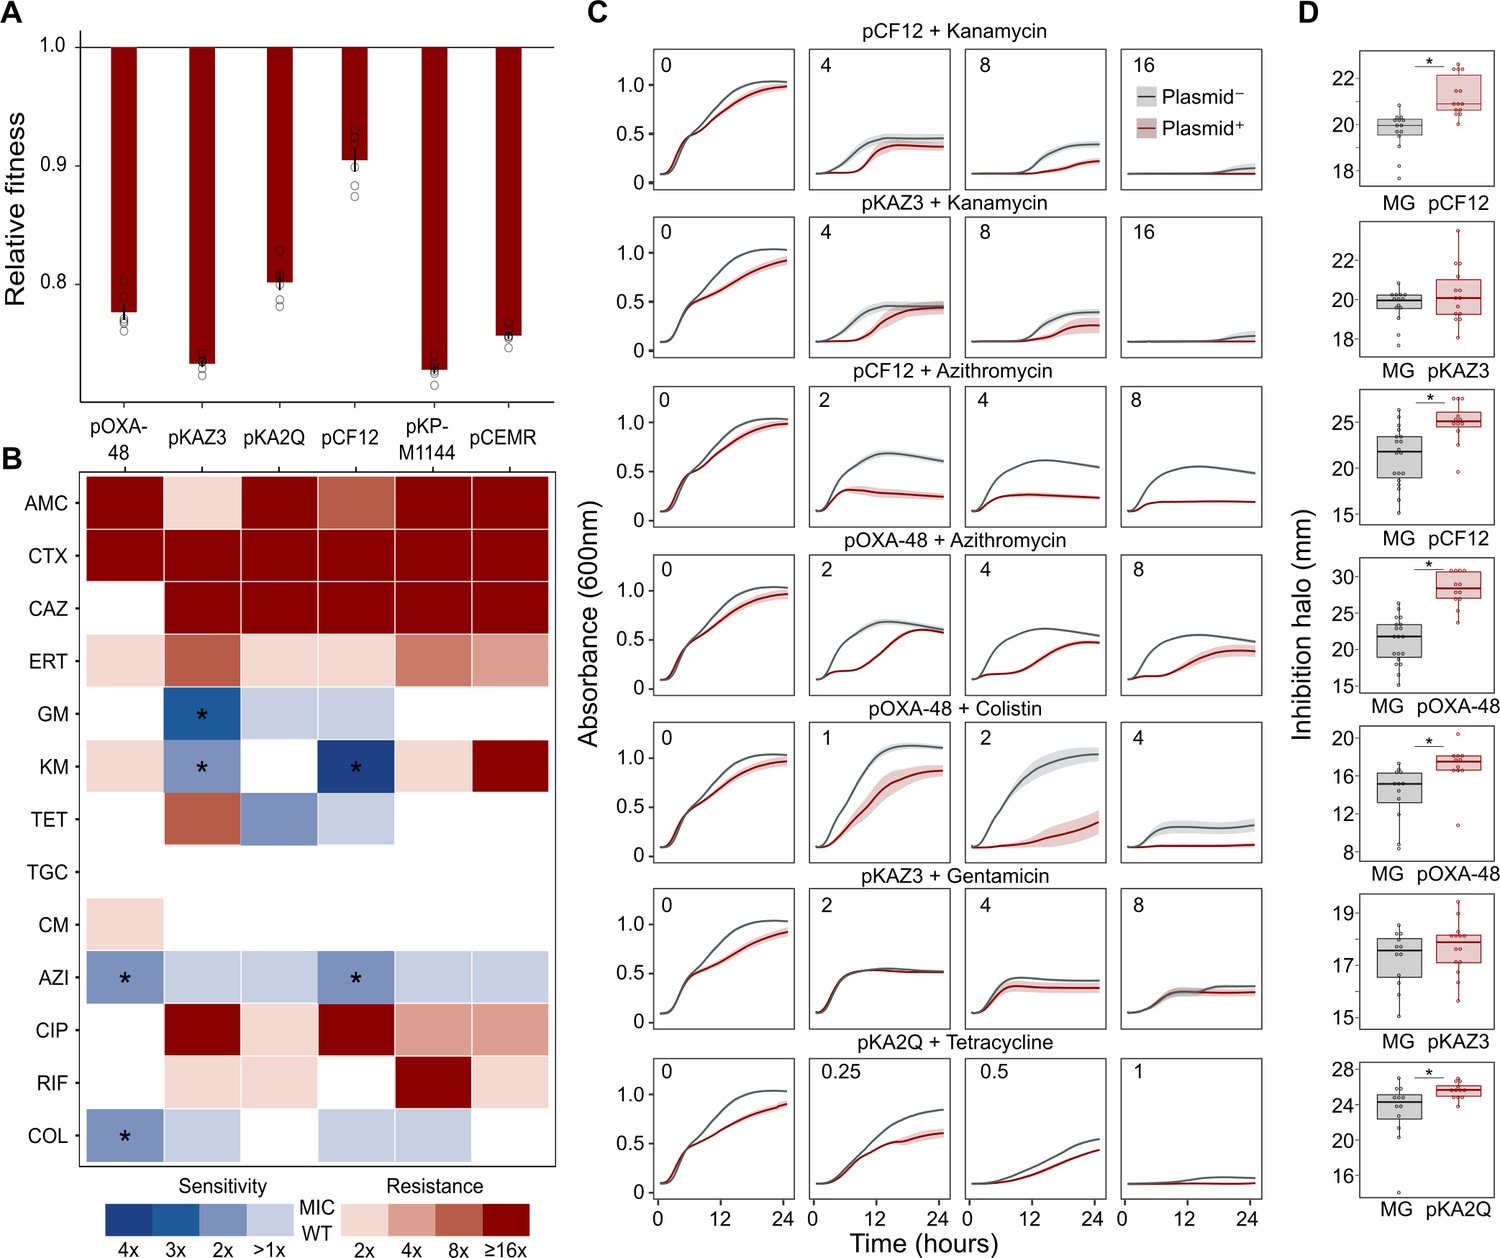
Collateral sensitivity and fitness effects associated with antibiotic resistance (ABR) plasmids.
(A) Competition assay determined fitness of plasmid-carrying clones relative to the plasmid-free MG1655 strain. Bars represent the means of six independent experiments (represented by dots), and error bars represent the standard error of the mean. (B) Heat-map representing collateral responses to antibiotics associated with plasmid acquisition. The color code represents the fold change of MIC in plasmid-carrying derivatives compared to plasmid-free MG1655 (see legend). Asterisks indicate a significant ≥2 fold decrease in MIC (Mann-Whitney U test; p<0.015). AMC, amoxicillin-clavulanic acid; CTX, cefotaxime; CAZ, ceftazidime; ERT, ertapenem; GM, gentamicin; KM, kanamycin; TET, tetracycline; TGC, tigecycline; CM, chloramphenicol; AZI, azithromycin; CIP, ciprofloxacin; RIF, rifampicin; and COL, colistin. (C) Growth curves of MG1655 and plasmid-carrying MG1655 strains exposed to increasing antibiotic concentrations. The antibiotic concentration, in mg/L, is indicated at the top left corner of each panel. Lines represent the mean of 6 biological replicates, and the shaded area indicates standard error of the mean. (D) Boxplot representations of the inhibition halo diameters, in mm, obtained from disk-diffusion antibiograms of plasmid-free and plasmid-carrying MG1655. Plasmid/antibiotic combinations in each row are the same as the ones indicated in panel C. Horizontal lines within boxes indicate median values, upper and lower hinges correspond to the 25th and 75th percentiles, and whiskers extend to observations within 1.5 times the interquartile range. Individual data points are also represented (11–15 biological replicates). Asterisks indicate statistically significant differences (unpaired t-test with Welch’s correction p<0.044).
-
Figure 1—source data 1
Numerical data that are represented in Figure 1.
- https://cdn.elifesciences.org/articles/65130/elife-65130-fig1-data1-v2.xlsx
Figure 1—figure supplement 1

Plasmids used in this study.
Scheme depicting the six plasmids used in this study. Antibiotic resistance genes are labeled and highlighted in yellow. Accession numbers are as follows: pKAZ3 (MT720905), pOXA-48_K8 (MT441554), pCF12 (MT720906), pCEMR (MT720903), pKP-1144 (MT720902), pKA2Q (MT720904). pOXA-48_K8 is a pOXA-48-like plasmid that shares a 100% coverage and >99% identity with the first described pOXA-48 plasmid (Poirel et al., 2012). For simplicity, we refer to this plasmid as pOXA-48 throughout the text. Plasmids are not drawn to scale.
Figure 1—figure supplement 2
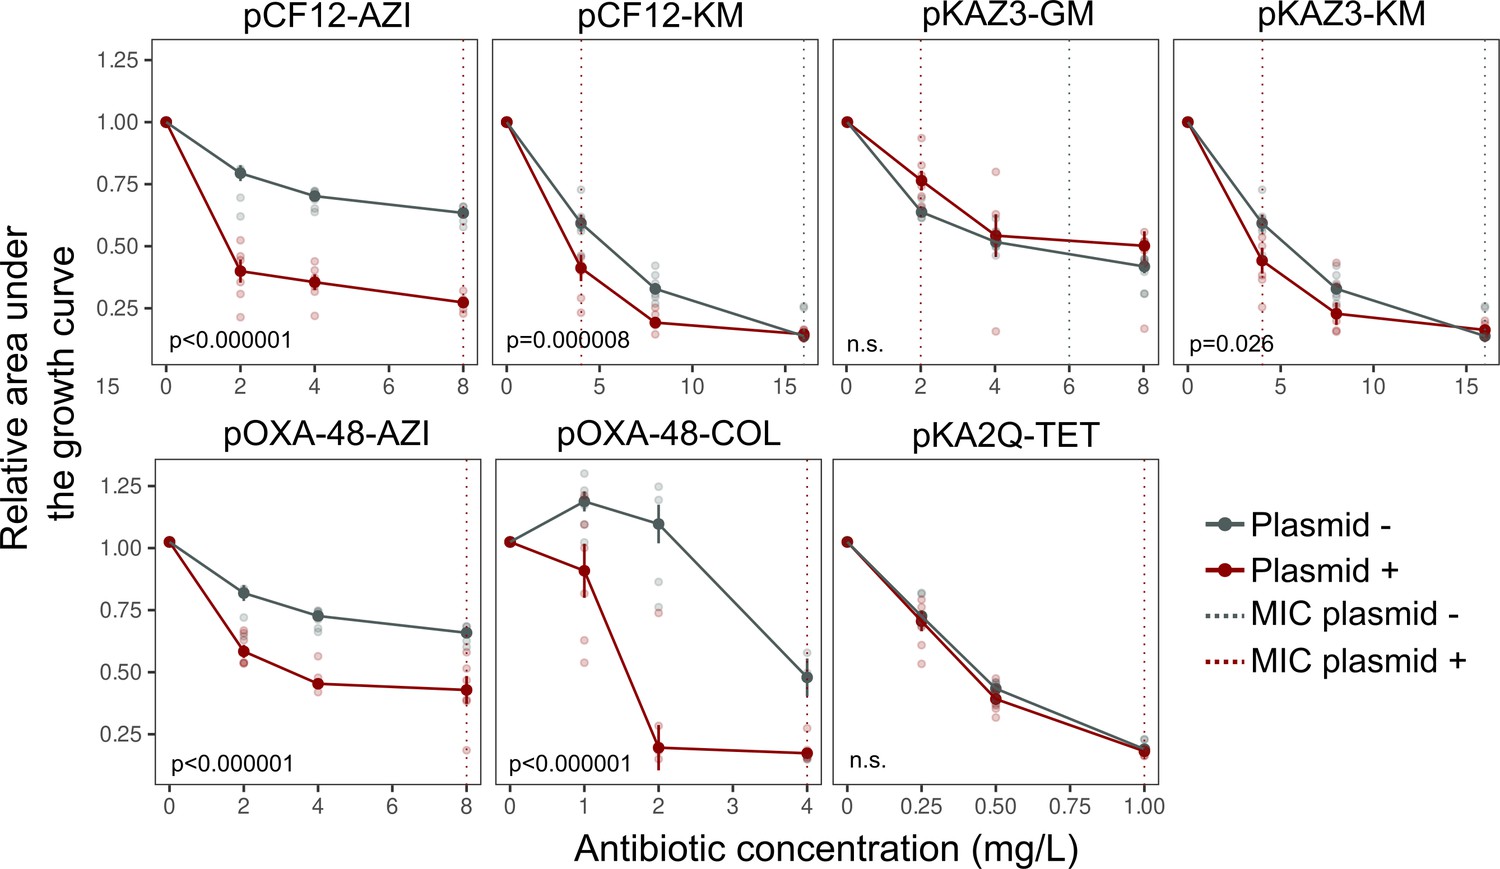
Analysis of bacterial growth curves.
Comparison of the relative area under the growth curve of MG1655 (gray lines) and its plasmid-carrying derivatives (red) under different antibiotic concentrations. Each data point corresponds to the mean of 6–12 biological replicates and error bars correspond to the standard error of the mean. Individual data points are also represented. Vertical lines indicate MIC values for plasmid-bearers (red dashed line) and plasmid-free strains (gray dashed line). MIC values that would lie outside plot ranges are omitted. p-Values are provided for the significantly different comparisons (ANOVA effect of ‘plasmid x antibiotic concentration’ interaction; ANOVA results are shown in Supplementary file 1B). AZI: azithromycin, COL: colistin, GM: gentamycin, KM: kanamycin, TET: tetracycline. Files accompanying this manuscript.
-
Figure 1—figure supplement 2—source data 1
Numerical data that are represented in Figure 1—figure supplement 2.
- https://cdn.elifesciences.org/articles/65130/elife-65130-fig1-figsupp2-data1-v2.xlsx
Figure 2
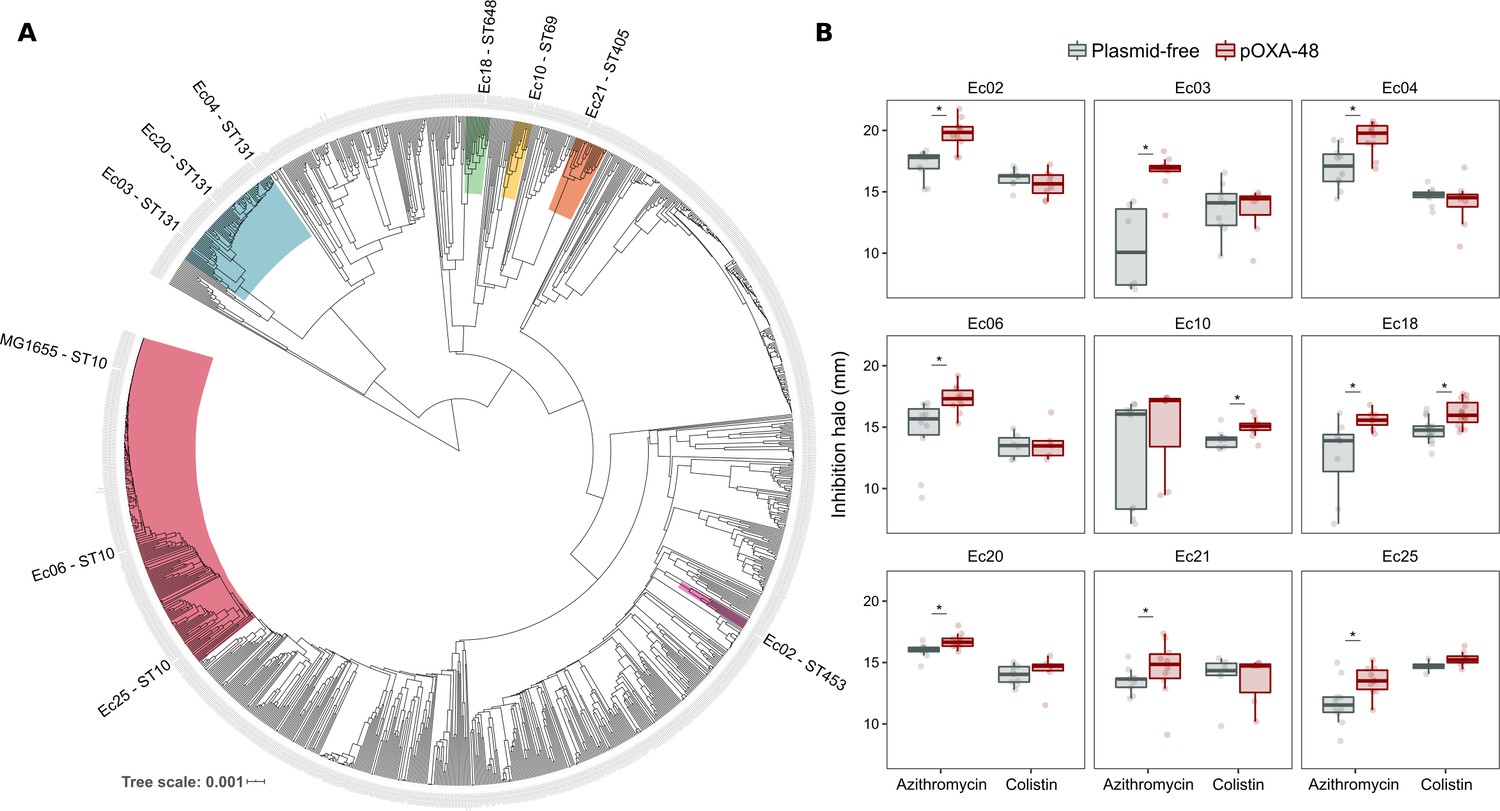
Phylogeny and collateral sensitivity profiles of E. coli clinical isolates.
(A) Phylogenetic tree of E. coli species, highlighting the strains used in this study and their sequence types (ST). Colors within tree branches represent different STs. The tree depicts the phylogenetic relationships of 1344 representative E. coli genomes obtained from NCBI. (B) Representation of the inhibition halo diameters, in mm, obtained from disk-diffusion antibiograms of clinical isolates and their transconjugants carrying pOXA-48. Horizontal lines inside boxes indicate median values, upper and lower hinges correspond to the 25th and 75th percentiles, and whiskers extend to observations within 1.5 times the interquartile range. Individual data points are also represented (6–12 replicates, jittered to facilitate data visualization). Asterisks denote statistically significant differences (t-test with Welch’s correction p<0.035 in all cases).
-
Figure 2—source data 1
Numerical data that are represented in Figure 2.
- https://cdn.elifesciences.org/articles/65130/elife-65130-fig2-data1-v2.xlsx
Figure 3

Plasmid-mediated CS can be exploited to preferentially kill plasmid-carrying bacteria.
Survival curves of plasmid-free (gray solid lines) and plasmid-carrying (red dashed lines) bacterial populations in response to constant or sequential antibiotic treatments. Plasmid-free or plasmid-carrying bacterial populations were cultured separately for 2 days with either constant antibiotic exposure or with a change of antibiotic after the first day; treatments are specified by the background colors in each panel. Log-rank test p-values assessing statistically different survival curves are shown. n.s. non-significant. For strains Ec10, Ec18, Ec21, and Ec25 n = 24; for MG1665 n = 48. AZI, azithromycin; COL, colistin.
-
Figure 3—source data 1
Numerical data that are represented in Figure 3.
- https://cdn.elifesciences.org/articles/65130/elife-65130-fig3-data1-v2.xlsx
Tables
Table 1
Plasmids used in this study.
| Plasmid | Incompatibility group | Mobility (MOB family) | Size (bp) | Resistance Genes | Reference (Genbank Ac. No.) |
|---|---|---|---|---|---|
| pOXA-48_K8 | IncL | Conjugative (MOBP) | 65,499 | blaOXA-48 | (León-Sampedro et al., 2020) (MT441554) |
| pKAZ3 | IncA/C | Conjugative (MOBH) | 147,957 | blaVEB-9, qnrVC-1, sul1, tetA', tetC, dfrA1, dfrA23 | (Flach et al., 2015) (KR827392.1) |
| pKA2Q | IncQ | Mobilizable (MOBF) | 8,789 | blaFOX-8 | (Hernández-García et al., 2018a) (MT720904) |
| pCF12 | IncX3 | Conjugative (MOBP) | 43,704 | blaSHV-12, qnrS1 | This work (MT720906) |
| pCEMR | ColE-like | Mobilizable | 14,478 | blaVIM-1, aac(6')-Ib3 sul1, aadA1, qacEΔ1 | (Papagiannitsis et al., 2018) (MG049738.1) |
| pKP-M1144 | ColE-like | Non-transmissible | 12,029 | blaBEL-1, blaGES-5, blaIMP-8, aac(6')-Ib3 | (Papagiannitsis et al., 2015) (KF745070.2) |
-
*pOXA-48_K8 is a pOXA-48-like plasmid (see Materials and methods and Figure 1—figure supplement 1). For simplicity, we refer to this plasmid as pOXA-48 throughout the study.
Additional files
-
Supplementary file 1
This file includes antibiotic susceptibility data.
(A) ANOVA results of the growth curves (B), information on chromosomal mutations accumulated during plasmid acquisition (C), and the characteristics of the E. coli clinical isolates used in this study (D).
- https://cdn.elifesciences.org/articles/65130/elife-65130-supp1-v2.docx
-
Transparent reporting form
- https://cdn.elifesciences.org/articles/65130/elife-65130-transrepform-v2.pdf
Download links
A two-part list of links to download the article, or parts of the article, in various formats.
Downloads (link to download the article as PDF)
Open citations (links to open the citations from this article in various online reference manager services)
Cite this article (links to download the citations from this article in formats compatible with various reference manager tools)
Collateral sensitivity associated with antibiotic resistance plasmids
eLife 10:e65130.
https://doi.org/10.7554/eLife.65130


