Identification of novel HPFH-like mutations by CRISPR base editing that elevate the expression of fetal hemoglobin
- Centre for Stem Cell Research (a Unit of inStem, Bengaluru), Christian Medical College Campus, India
- Sree Chitra Tirunal Institute for Medical Sciences and Technology, India
- Innovative Genomics Institute, University of California, Berkeley, United States
- Institute of Data Science and Biotechnology, Gladstone Institutes, United States
- School of Biotechnology and Biomolecular Sciences, University of New South Wales, Australia
- Manipal Academy of Higher Education, India
- Department of Haematology, Christian Medical College & Hospital, India
- Cell Engineering Division, RIKEN BioResource Center, Japan
- Research and Development Department, Central Blood Institute Blood Service Headquarters, Japanese Red Cross Society, Japan, Japan
- Department of Biochemistry, Christian Medical College, India
- Department of Microbiology, Immunology and Molecular Genetics, University of California, Los Angeles, United States
- Institute of Molecular Health Sciences, Department of Biology, Switzerland
Figures
Figure 1 with 1 supplement
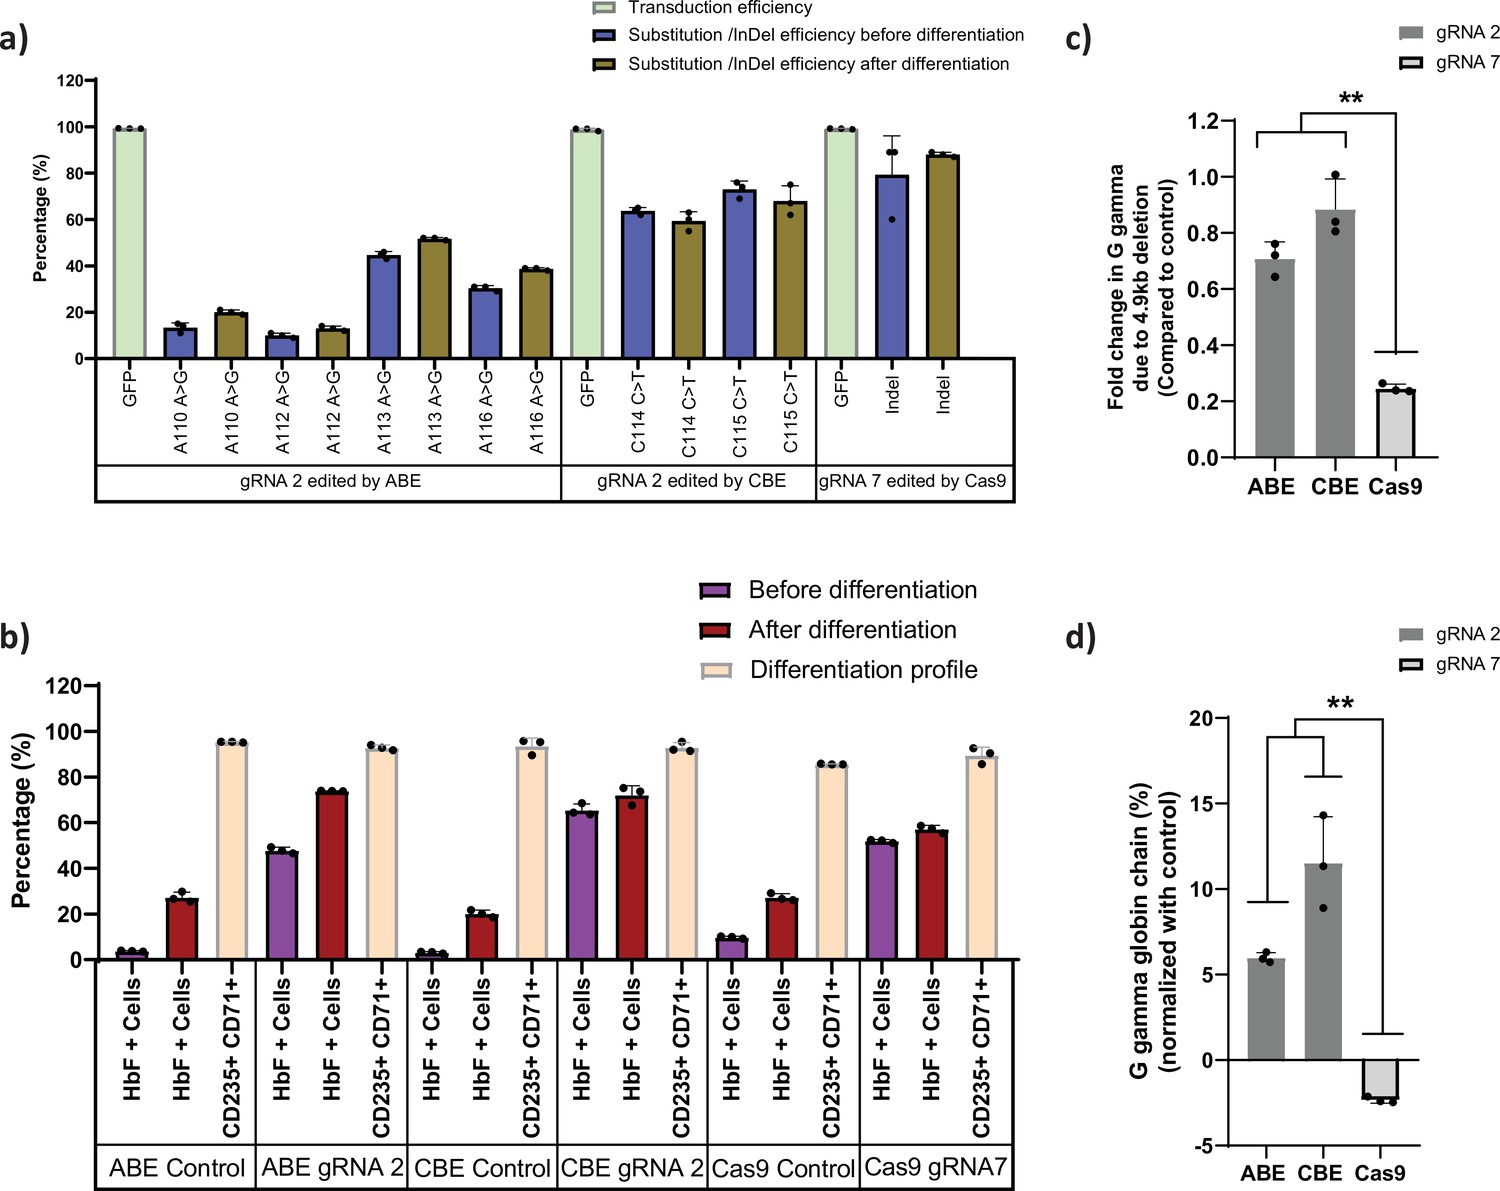
Base editors are preferred tool over Cas9 for editing the highly homologous HBG1 and HBG2 promoter.
Highly homologous HBG promoter was edited by adenine base editor (ABE), cytosine base editor (CBE), and Cas9 with suitable guide RNAs (gRNAs) that target the well-known BCL11A binding site (–115 transcription start site [TSS]). (a) Transduction efficiency of gRNA-2 (for ABE and CBE) or gRNA-7 (for Cas9), percentage of individual base conversion for ABE and CBE (with gRNA-2) and insertions and deletions (indels) for Cas9 (with gRNA-7) before and after erythroid differentiation are represented. The transduction efficiency was analyzed by FACS, the individual base substitution and indel percentage were analyzed by EditR and ICE software respectively after sanger sequencing. (b) Flow cytometry analysis of fetal hemoglobin (HbF) and erythroid maturation markers (CD235a and CD71) expression in edited HUDEP-2 cells. The percentage of HbF-expressing cells were analyzed before and after differentiation into erythroblasts. (c) Analysis of HBG2 deletion (due to 4.9 kb deletion) by qRT-PCR in the base edited and Cas9 edited HUDEP-2 cells. (d) Expression of G gamma-globin chain in ABE, CBE, and Cas9 edited HUDEP-2 cells, measured by RP-HPLC after differentiation into erythroblasts. The data were normalized with respective controls. Data are expressed as mean ± SEM from three biological replicates, asterisks indicate levels of statistical significance (**p < 0.01).
Figure 1—figure supplement 1
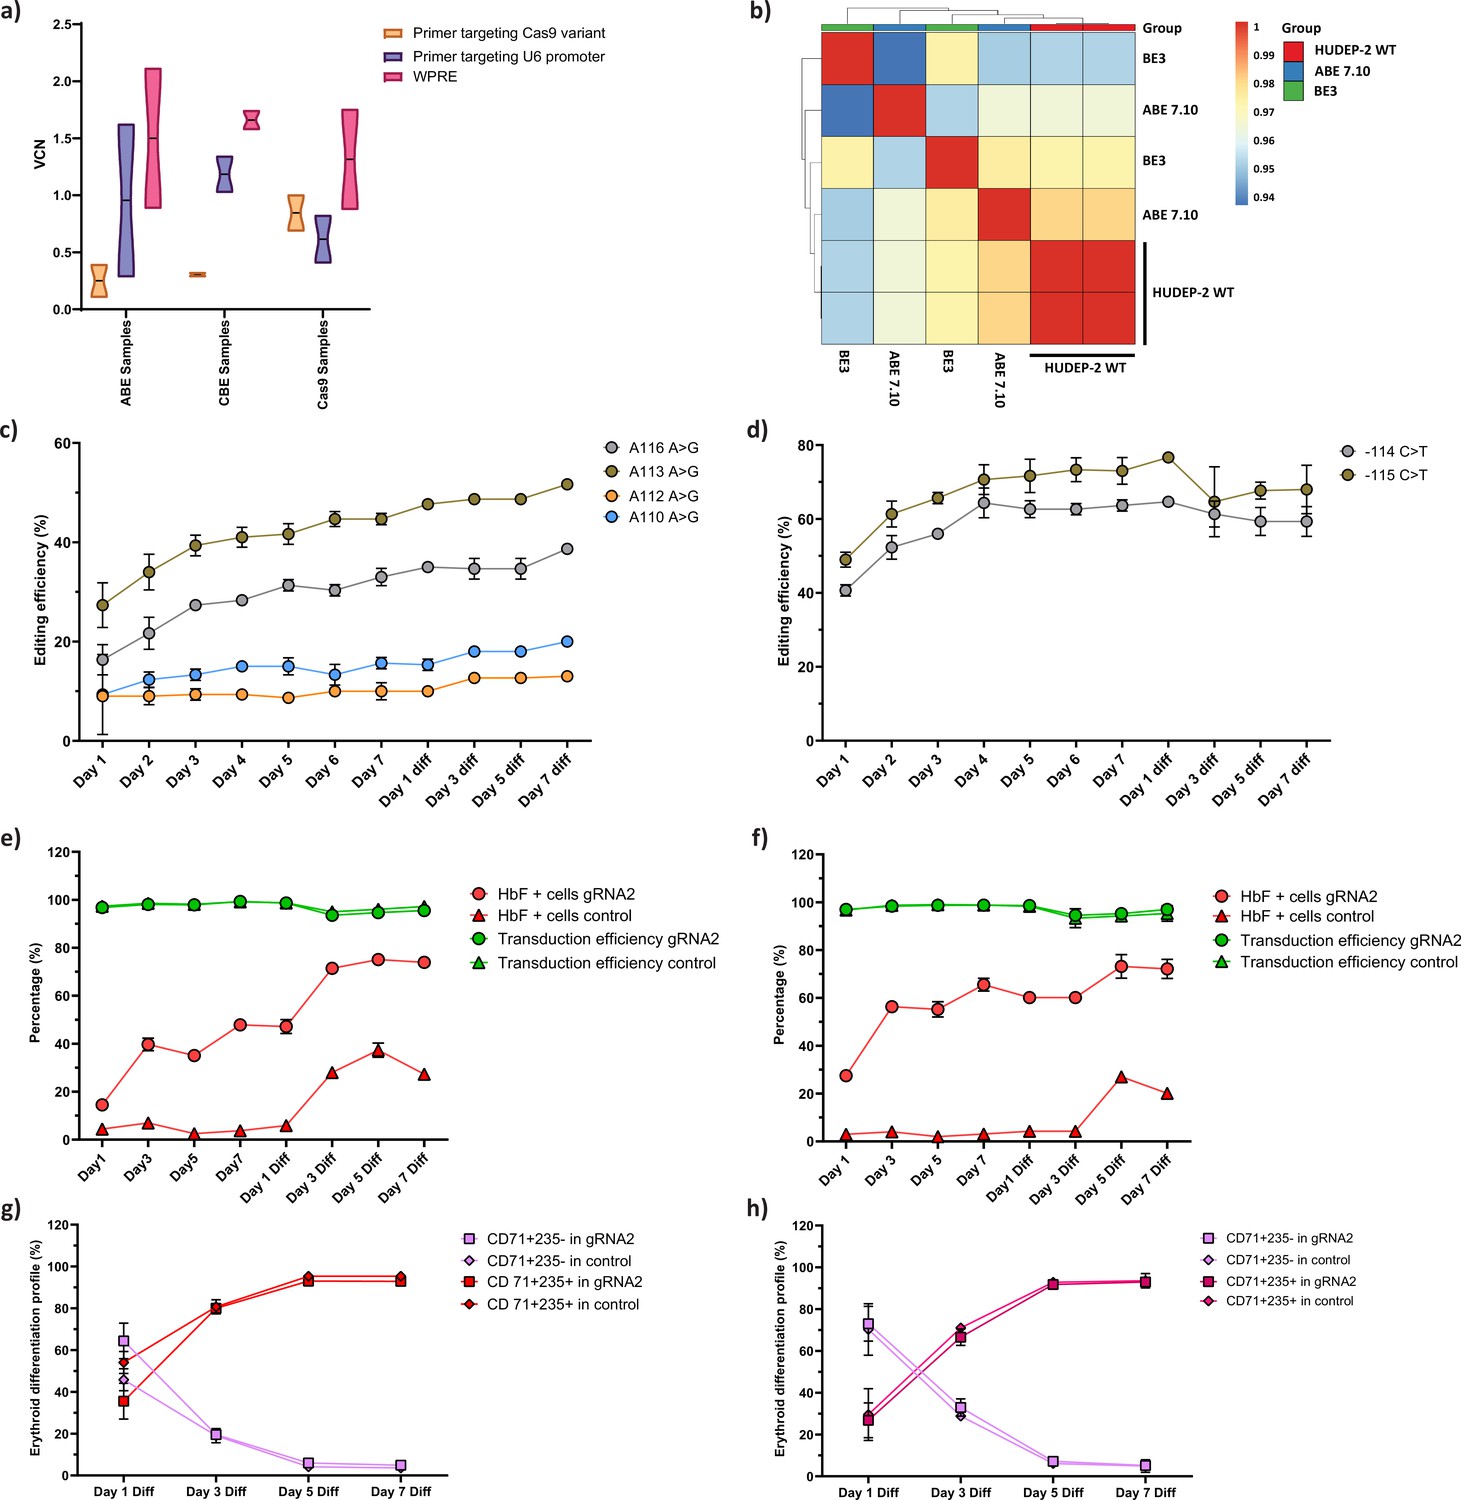
Characterization of the HUDEP-2 cells expressing adenine (ABE) and cytosine base editor (CBE).
(a) Vector copy number (VCN) per cell for the integrated guide RNA (gRNA) as well as the gene editors (ABE, CBE, and Cas9) in the respective HUDEP-2 stable cell lines. Primer targeting Cas9 is specific for the gene editors while that targeting U6 promoter is specific for gRNA; primer targeting WPRE is common for both gRNA and gene editors. (b) Transcriptome analysis of ABE and CBE expressing HUDEP-2 cells that are represented in pairwise Pearson correlation matrix. The R value for individual boxes is represented by the gradient bar. Individual base conversion efficiency of ABE (c) or CBE (d) expressing HUDEP-2 cells transduced with gRNA-2 on different days of expansion and differentiation. The base substitution at –115 region of HBG promoter (BCL11A binding site) were analyzed by EditR after sanger sequencing. Flow cytometry analysis of fetal hemoglobin (HbF) and GFP expression in ABE (e) or CBE (f) expressing HUDEP-2 cells transduced with gRNA-2 during different days of expansion and erythroid differentiation. The expression of GFP is directly proportional to the percentage of cells transduced with gRNA-2. The differentiation profile (CD71+ CD235a+ and CD71+ CD235a- population) of the base edited HUDEP-2 cells expressing ABE (g) and CBE (h) are represented from day 1 to day 7 of erythroid differentiation, measured by flow cytometry. The decrease in CD71+ CD235- population and increase in CD71+ CD235+ population display progress in erythroid differentiation. Data are expressed as mean ± SEM from three biological replicates.
Figure 2 with 3 supplements
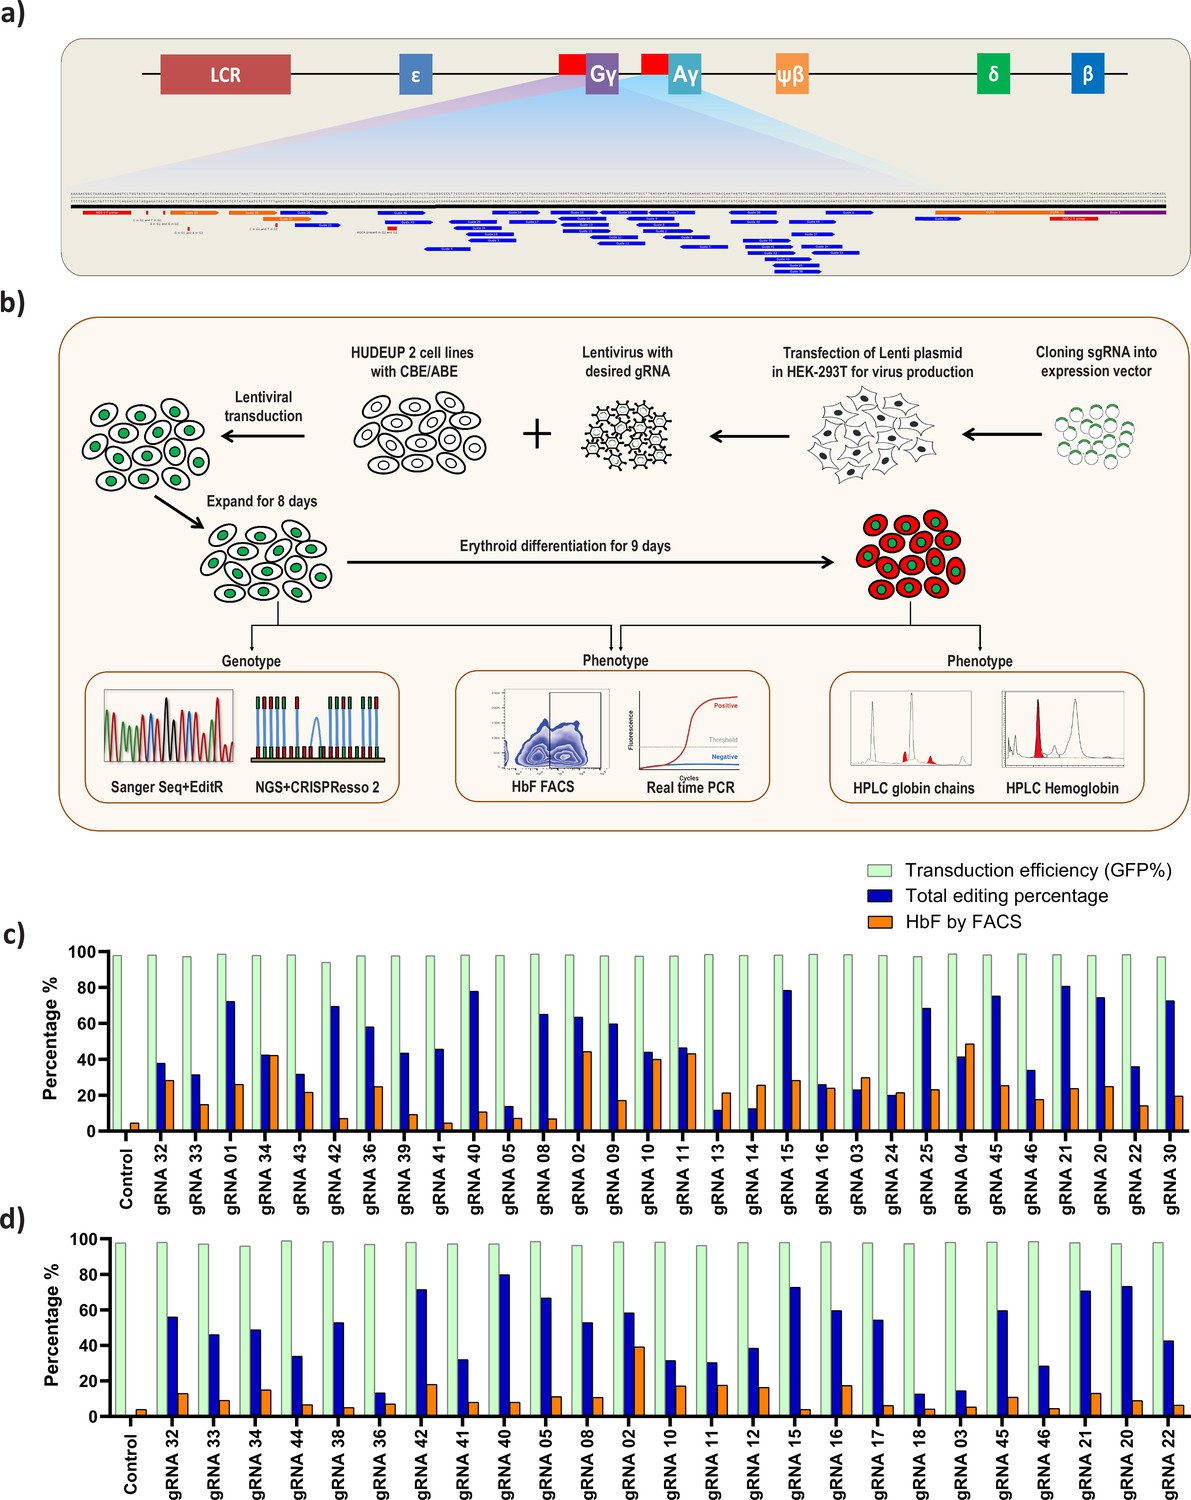
Screening of HBG promoter using base editors to identify novel point mutations that elevate fetal hemoglobin (HbF) expression.
(a) Schematic representation of the overall screening approach, adenine base editor (ABE) or cytosine base editor (CBE) expressing HUDEP-2 cells were transduced with guide RNA (gRNAs) that target the proximal promoter of the HBG gene. The edited cells were expanded for 8 days. Editing efficiency was evaluated by Sanger sequencing and NGS, while functional analysis was carried out using FACS and qRT-PCR. Top targets from both the ABE and CBE screens with the highest induction of HbF were validated and differentiated to erythroid cells. The differentiated cells were further subjected to FACS, qRT-PCR, RP-HPLC, and HPLC analysis to determine the number of HbF positive cells, HBG expression, individual gamma-globin chains, and fetal hemoglobin levels, respectively. (b) Representation of gRNA targeting HBG promoter region in HUDEP-2 cell line, gRNAs targeting –320 bp upstream of transcription start site (TSS) in HBG genes (HBG1 and HBG2) promoter regions are represented in the figure. gRNAs common for HBG1 and HBG2 promoters are represented in blue, while the gRNAs specific to HBG1 promoter are represented in orange color, the primers used for deep sequencing are represented as a red bar. Comparison of transduction efficiency, base editing frequency, and HbF expression in HUDEP-2 cells expressing ABE (c) and CBE (d) transduced with different gRNAs targeting the HBG proximal promoter. The base edited cells were sequenced by NGS and analyzed for total editing frequency using CRISPResso-2. The transduction efficiency (GFP+ cells) and HbF positive cells were analyzed by FACS.
Figure 2—figure supplement 1
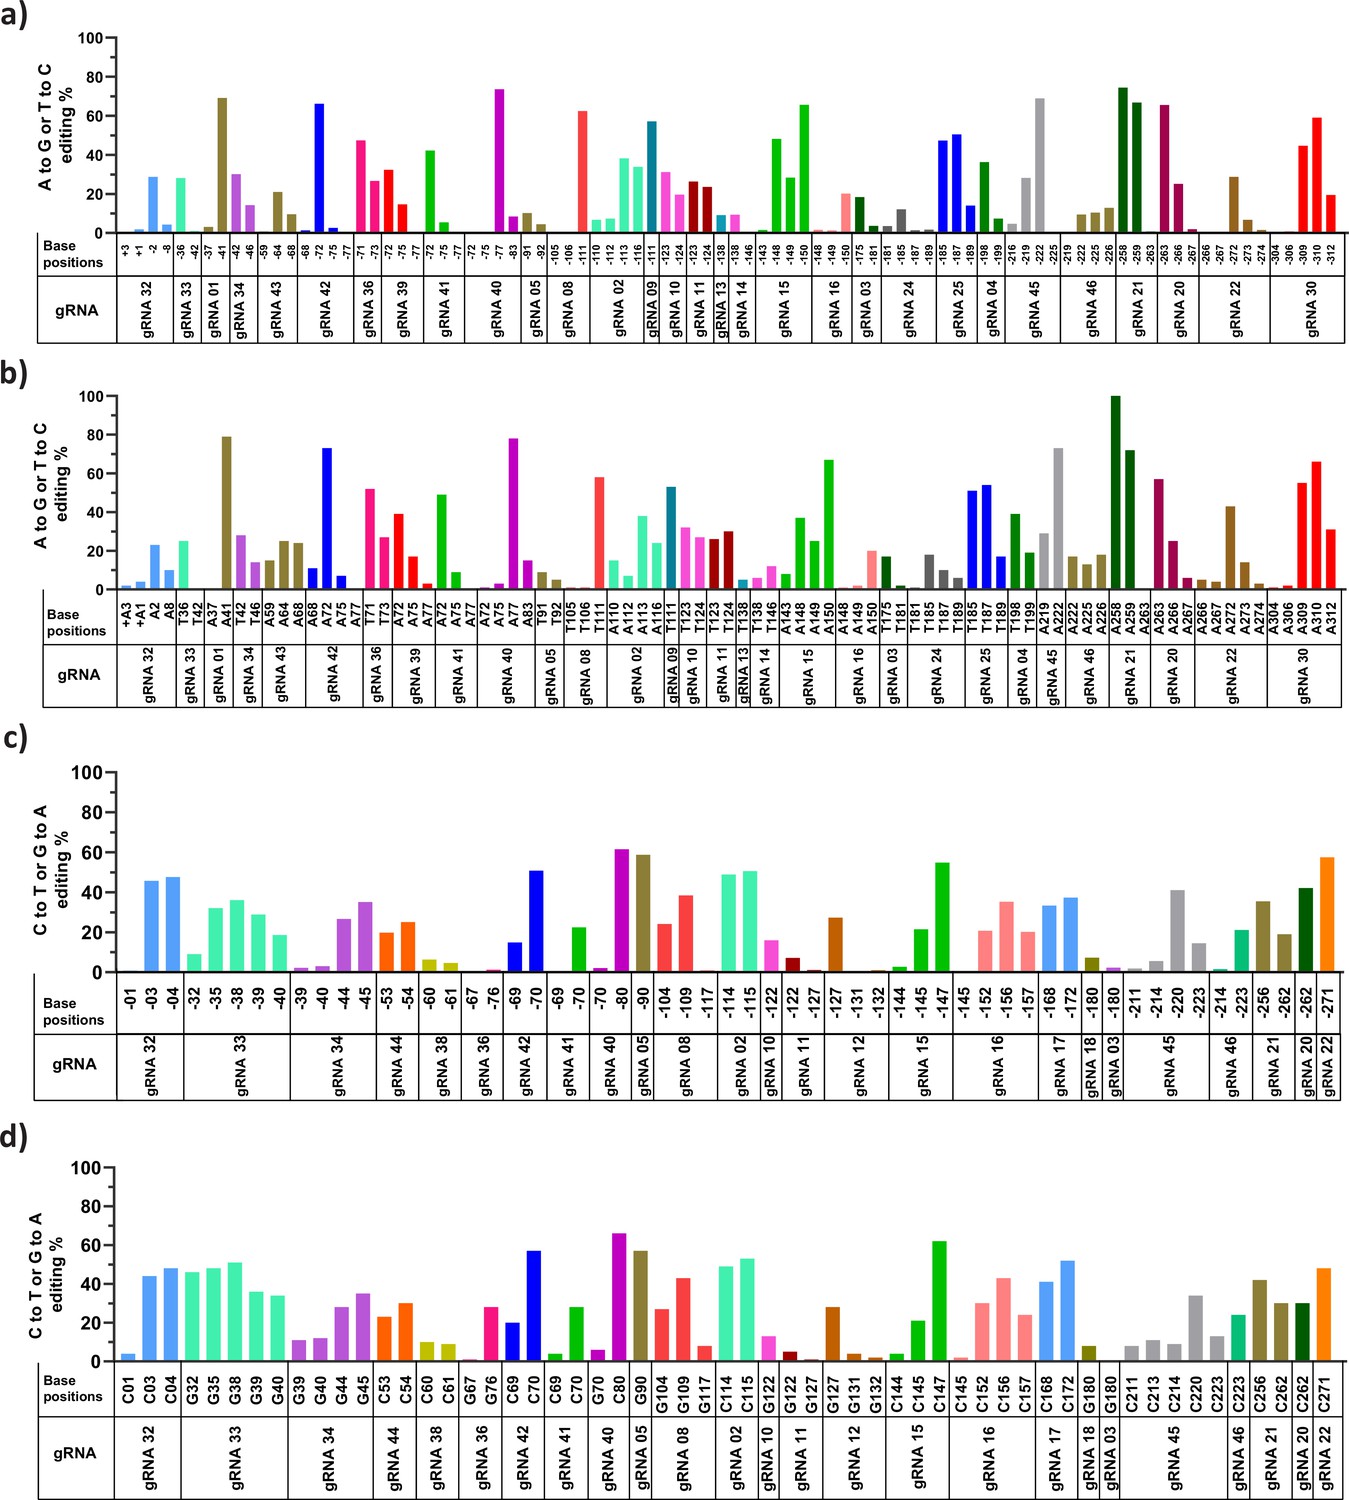
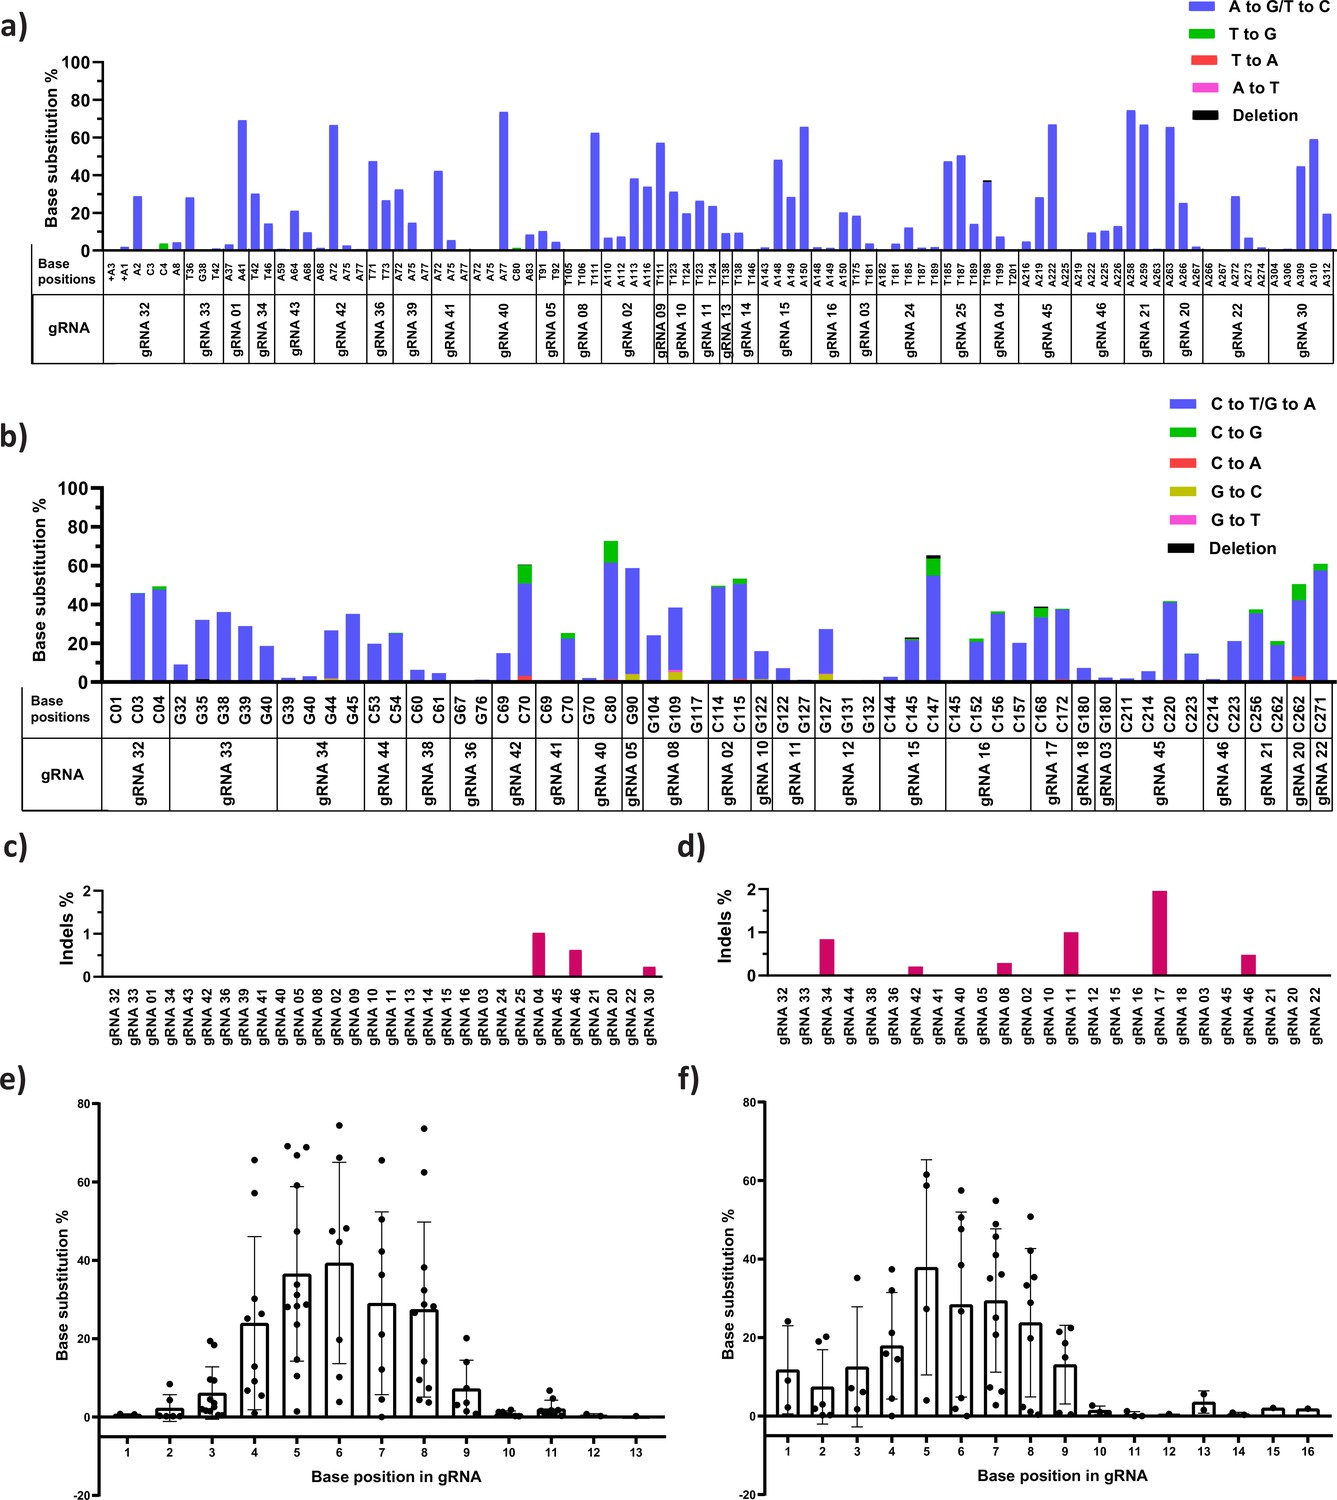
Analysis of base substitution efficiency at single base pair resolution in HBG promoter by adenine base editor (ABE) and cytosine base editor (CBE) through NGS and Sanger sequencing.
The ABE and CBE stable cells transduced with the indicated guide RNAs (gRNAs) were sequenced by NGS (figure (a) ABE and (c) CBE) and Sanger sequencing (figure (b) ABE and (d) CBE), the sequencing data were analyzed using CRISPResso-2 and EditR, respectively. The base conversion positions are sequentially represented in the x-axis up to –320 bp from the transcription start site (TSS). The base conversion efficiency of individual bases for each gRNA is represented in the y-axis as the percentage of the desired base converted (A- to-G or C- to-T).
Figure 2—figure supplement 2
The product purity and preferred editing window of adenine (ABE) and cytosine base editors (CBE) at the target site.
Specific and non-specific editing of ABE (a) and CBE (b) at the target sites for different guide RNAs (gRNAs) was analyzed by deep sequencing (NGS); individual base position in the HBG promoter region is mentioned in the x-axis, and the number of reads representing the specific and non-specific conversion is plotted in y-axis as percentage. Percentage of insertions and deletions (indels) at the indicated target sites in the cells treated with ABE (c) and CBE (d) analyzed using CRISPResso-2 tool after NGS. Role of the positional effect of a target base in deciding the editing scope of ABE (e) and CBE (f) for different gRNAs. The x-axis represents the base position in the protospacer, considering the PAM as positions 21–23 and the y-axis represents the base substitution percentage.
Figure 2—figure supplement 3
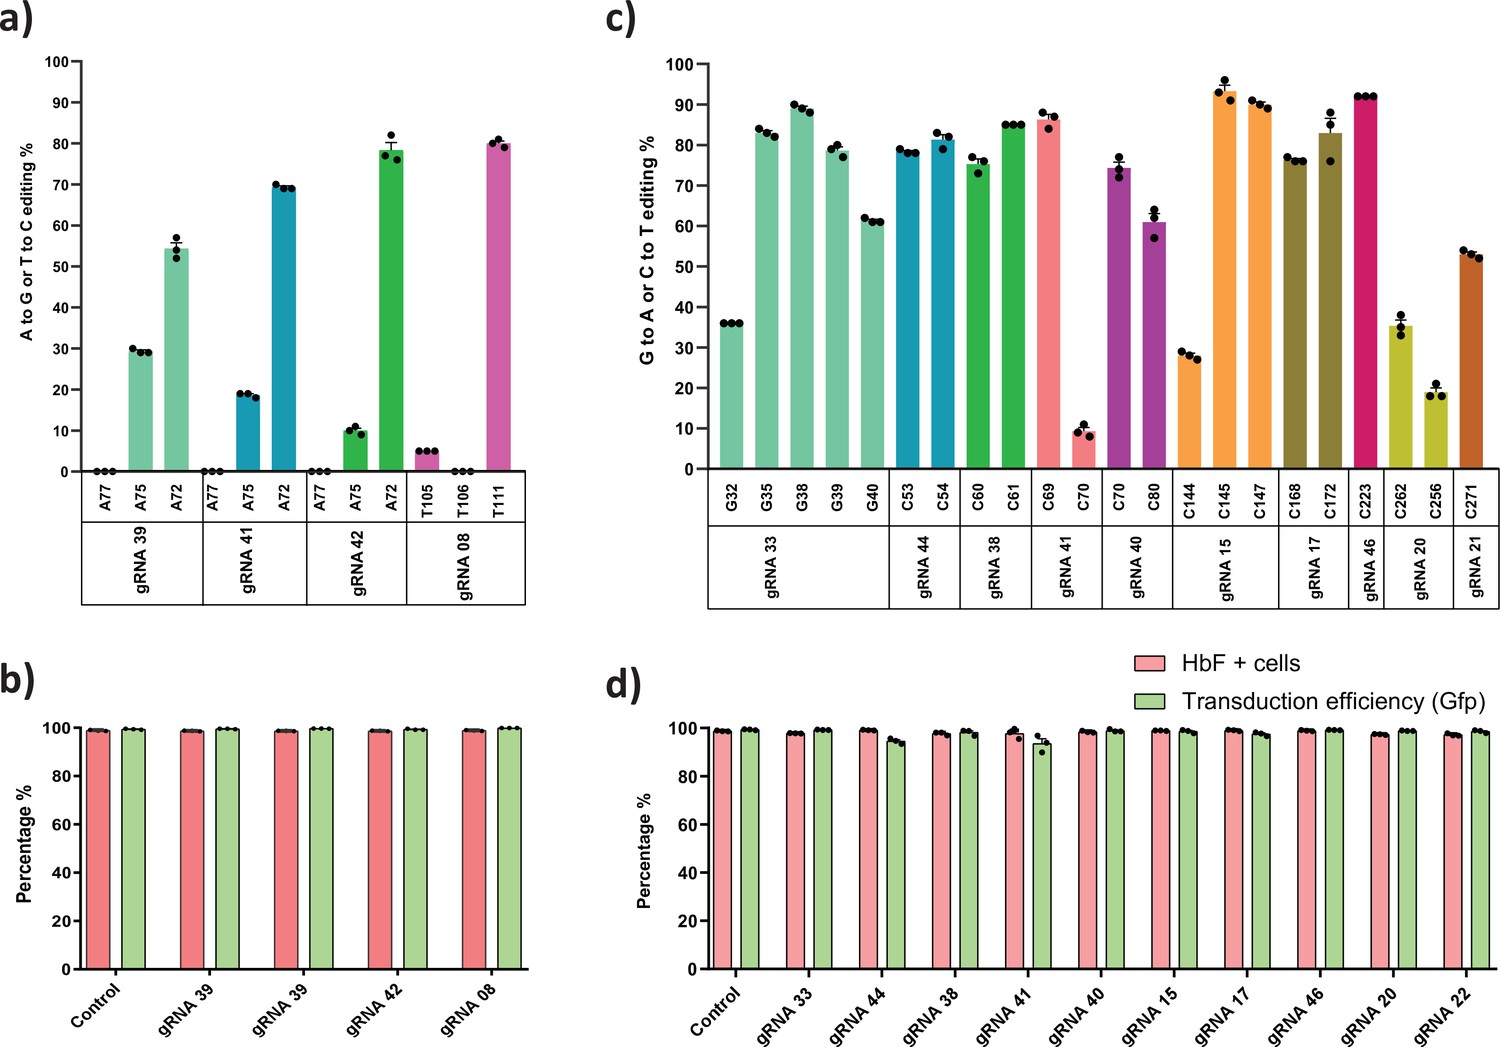
Base editing of HBG promoter to identify nucleotide substitutions that suppress fetal hemoglobin (HbF) expression.
K562 cells expressing adenine base editor (ABE) (a) or cytosine base editor (CBE) (b) were transduced with the indicated guide RNA (gRNA) were sequenced by Sanger sequencing and analyzed using EditR. The gRNAs that showed lower HbF levels with higher editing efficiency were chosen based on the initial screening results. Percentage of HbF positive cells and the transduction efficiency (GFP+) of the respective gRNA for ABE (c) and CBE (d), measured by flow cytometry.
Figure 3 with 4 supplements
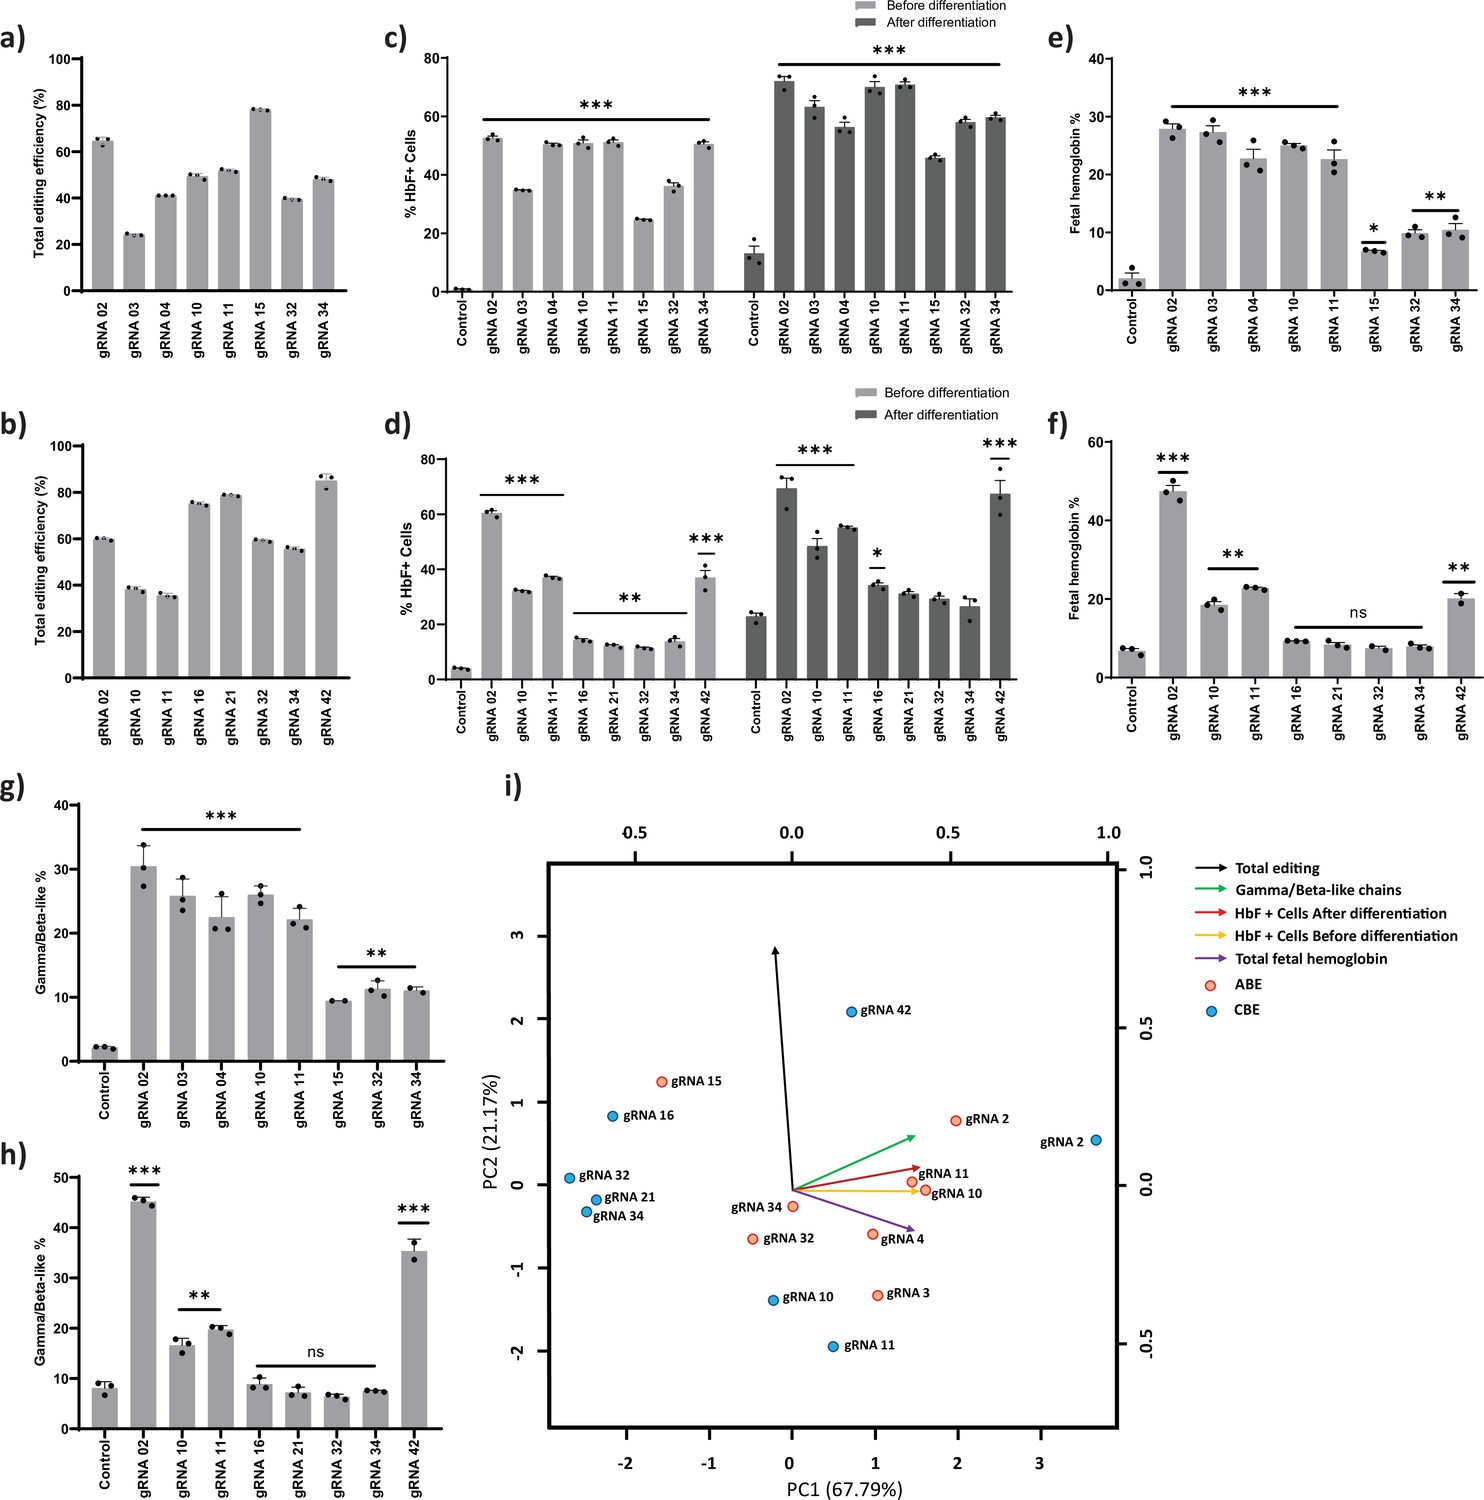
Validation of targeted base editing for top eight guide RNAs (gRNAs) from the primary screen of adenine base editor (ABE) and cytosine base editor (CBE) at HBG promoters.
HUDEP-2 cells expressing ABE or CBE transduced with the top eight gRNAs were analyzed by deep sequencing at the targeted regions in the HBG promoter. The total editing efficiencies of ABE (a) or CBE (b) are represented as the percentage of total sequencing reads with target C:A converted to T:G at specified sites. Evaluation of fetal hemoglobin (HbF) positive cells in HUDEP-2 cells expressing ABE (c) or CBE (d) transduced with the respective gRNAs, before and after differentiation by flow cytometry; globin chains analysis in ABE (e) or CBE (f) edited HUDEP-2 cells after erythroid differentiation by RP-HPLC; HbF analysis in ABE (g) or CBE (h) edited HUDEP-2 cells after erythroid differentiation by HPLC. (i) Principal component analysis plot for the correlation between the outcomes of base editing using top eight gRNAs. The relationship between the base edit frequency, HbF+ cells, HbF, and gamma/beta-like chains in ABE or CBE edited HUDEP-2 stable cell for the indicated gRNAs were analyzed. The first two principal components are plotted, and the variance accounted for by each principal component is shown. Data are expressed as mean ± SEM from three biological replicates (p > 0.05). Asterisks indicate levels of statistical significance **p < 0.01, ***p < 0.001.
Figure 3—figure supplement 1
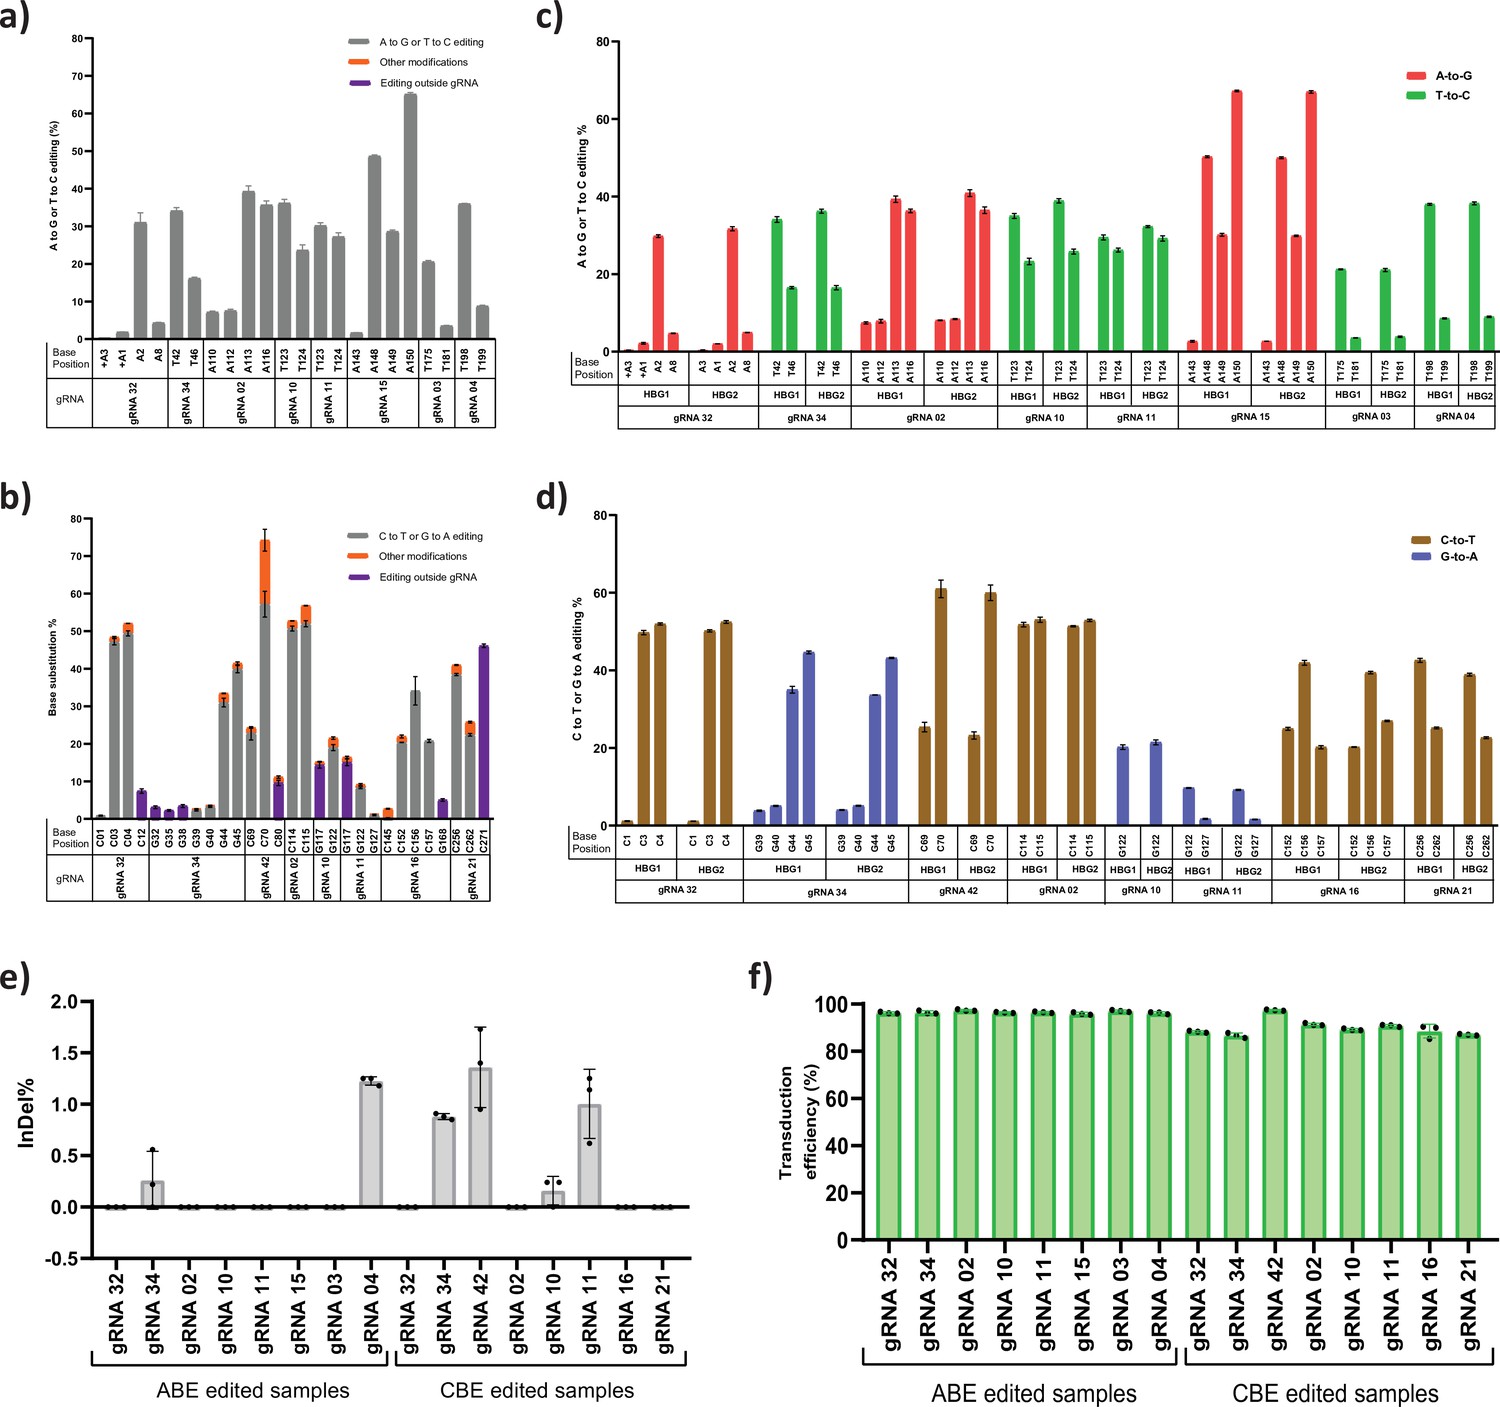
Assessment of base editing efficiency at the highly homologous HBG1 and HBG2 promoter.
HUDEP-2 cells expressing adenine base editor (ABE) or cytosine base editor (CBE) were transduced with the top eight guide RNAs (gRNAs) and analyzed by deep sequencing at the targeted regions in the HBG promoter. The base substitution for ABE (a) and CBE (b) at single base resolution for the respective gRNA at target site is depicted, the unintended conversion at the target site and conversion beyond protospacer are represented as orange and blue bar, respectively. Comparison of base editing efficiencies of ABE (c) or CBE (d) at the indicated target sites of HBG1 and HBG2 promoter region in HUDEP-2 cells. The highly homologous HBG1 and HBG2 promoter regions were together amplified and deep sequenced to segregate the specific editing between the HBG1 and HBG2 promoters by using four single nucleotide variations at −271,–307, –317, and –324 position. (e) Representation of indel frequency for ABE and CBE stable cells transduced with top eight gRNAs and (f) their transduction efficiency. Data are expressed as mean ± SEM from three biological replicates.
Figure 3—figure supplement 2
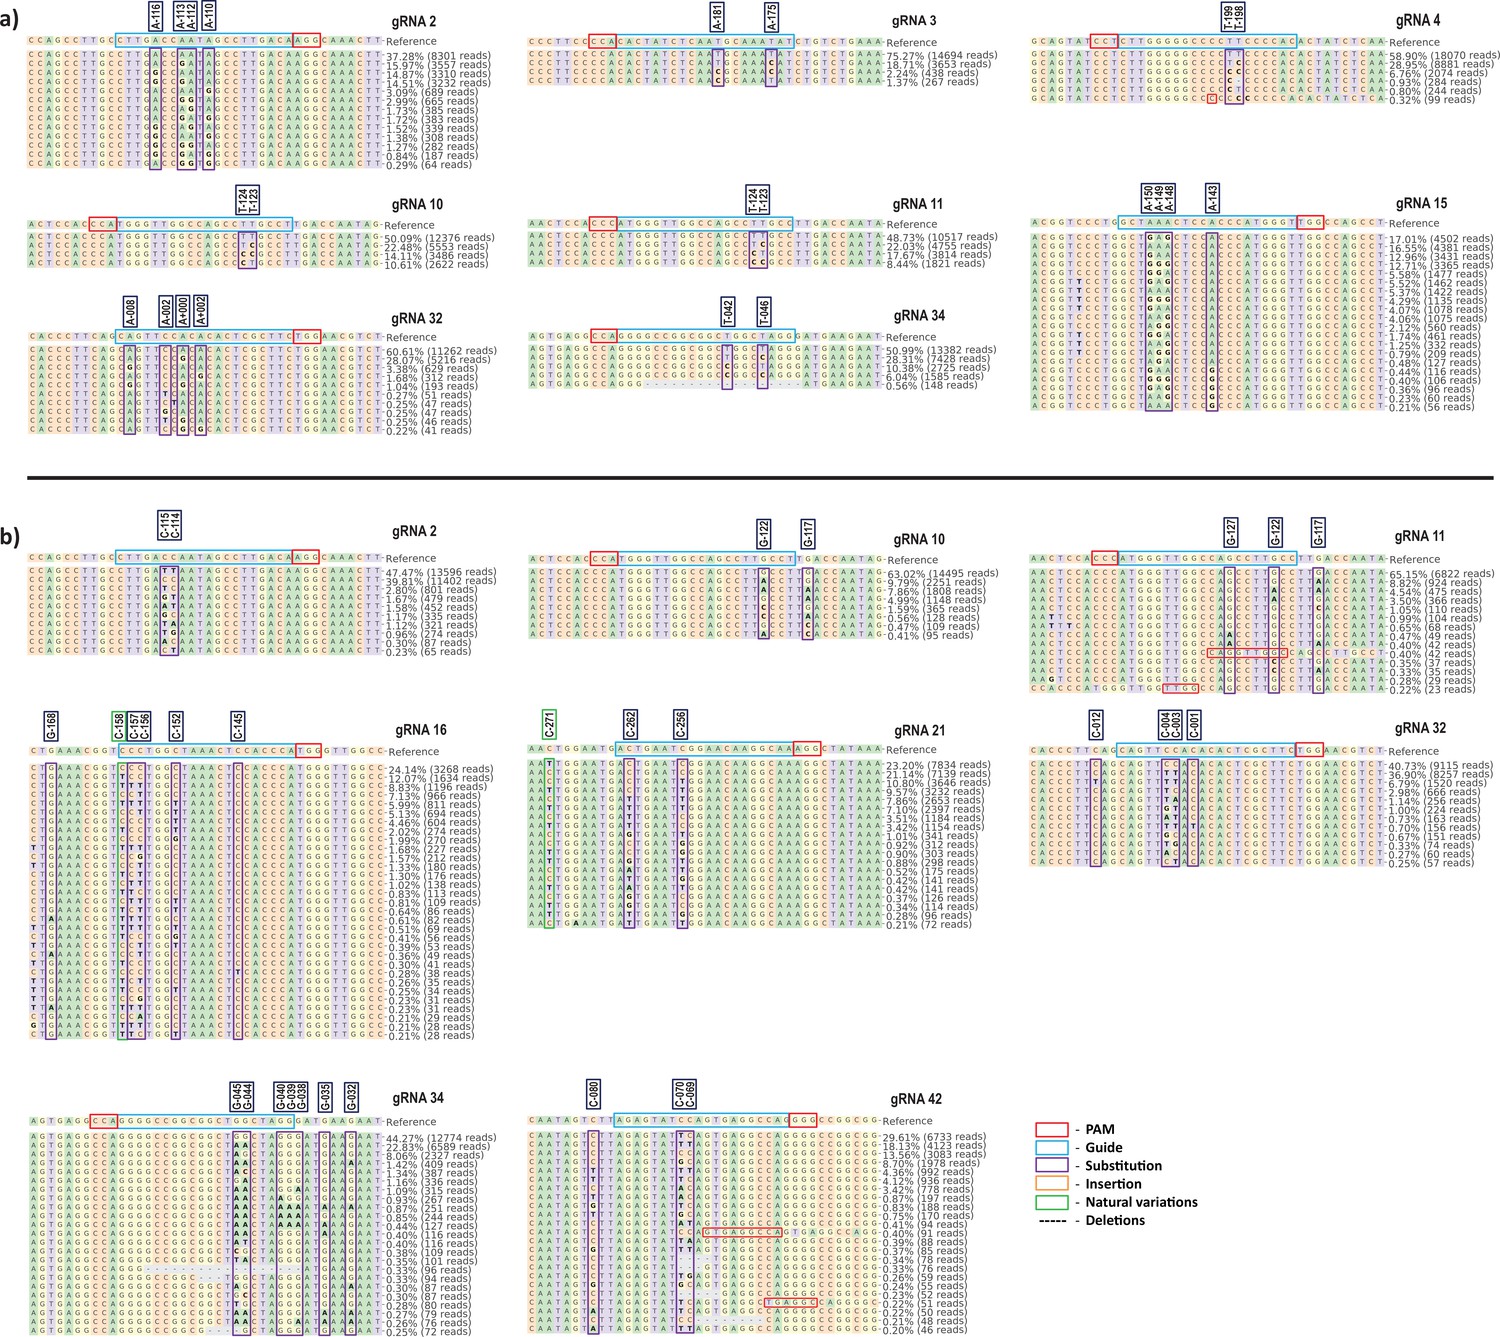
Summary of alleles frequency for top eight guide RNAs (gRNAs) at target site by adenine base editor (ABE) and cytosine base editor (CBE).
CRISPResso-2 analysis shows the overall base editing frequencies for individual gRNAs at the target site in ABE (a) and CBE (b) edited cells. The target region in HBG proximal promoter was PCR amplified and analyzed by next-generation amplicon sequencing. gRNA sequence, PAM site, substitution, insertion, natural variations, deletions, and base position in HBG promoter of HUDEP-2 cells are shown in the respective boxes.
Figure 3—figure supplement 3
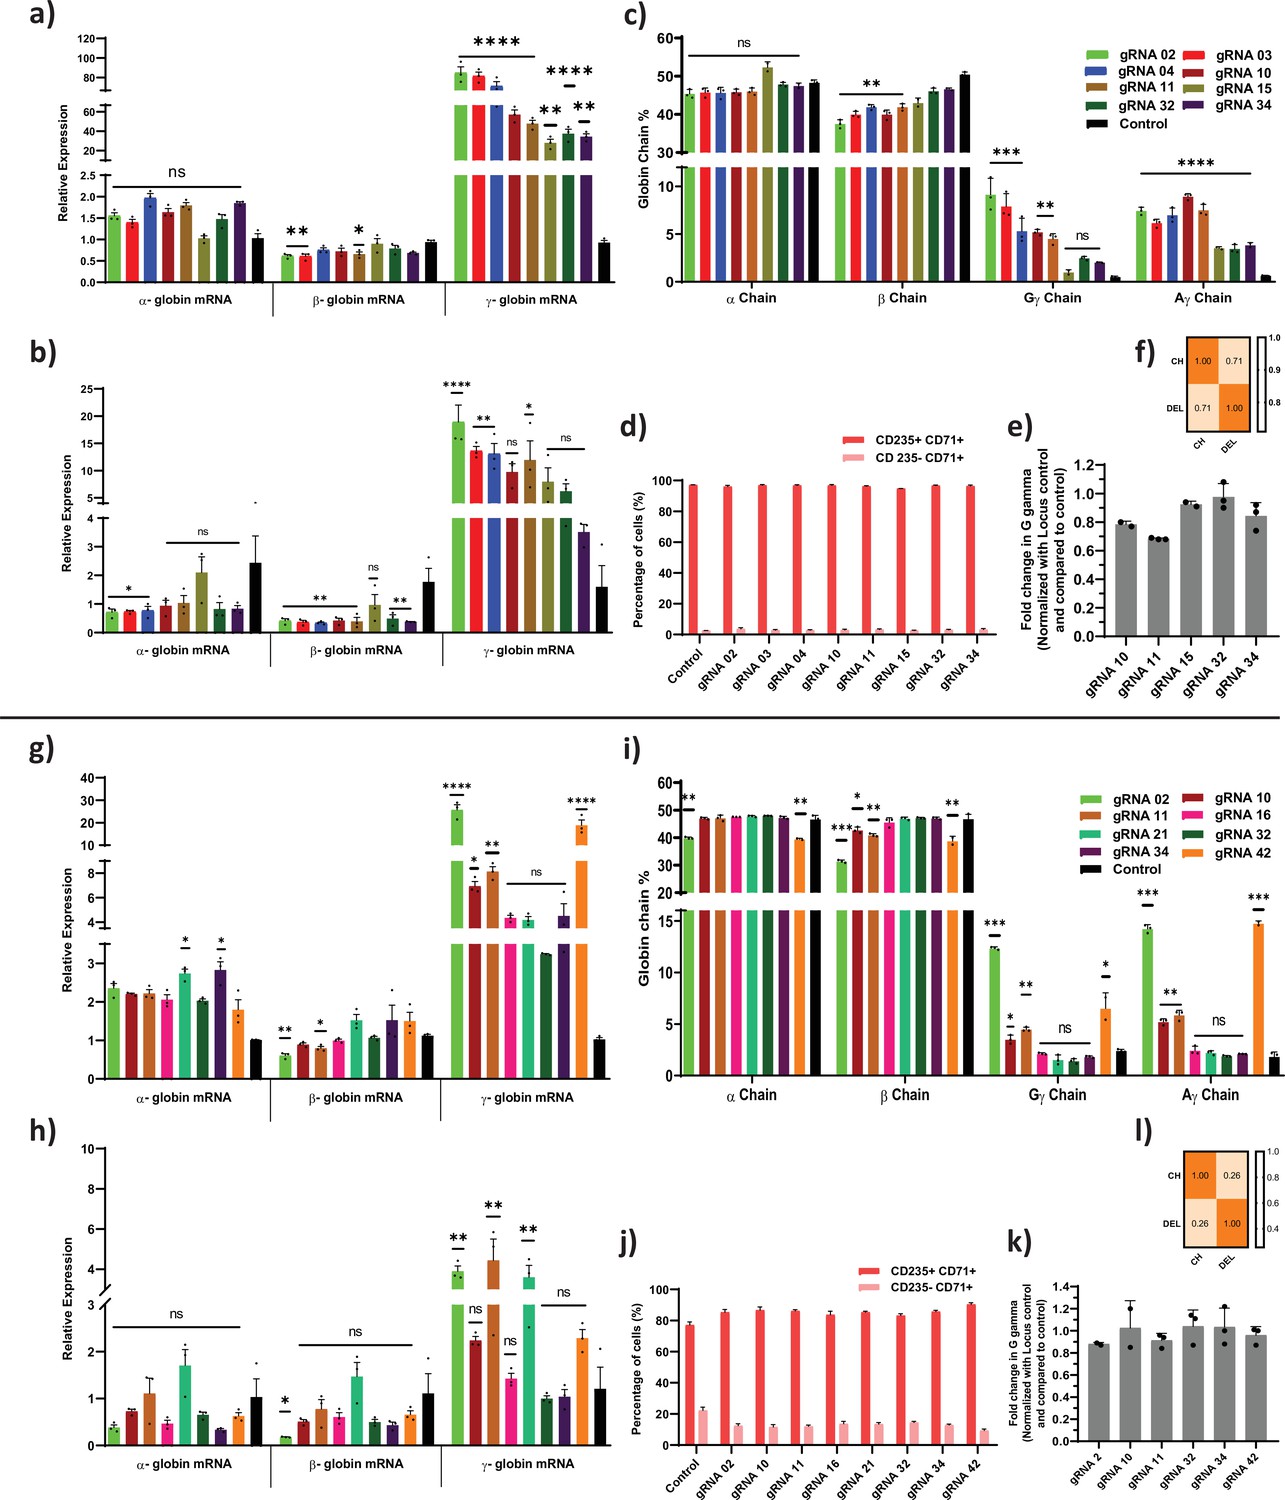
Adenine and cytosine base editing of HBG promoter on globin chain mRNA and protein expression.
Relative expression of globin transcripts in adenine and cytosine base edited samples before (a and g) and after (b and h) erythroid differentiation assessed by qRT-PCR. (c and i) RP-HPLC analysis of globin chains after erythroid differentiation. (d and j) FACS analysis of CD235a and CD71 expression in edited erythroblast derived from HUDEP-2 cells. (e and k) Analysis of HBG2 deletion (4.9 kb deletion) by qRT-PCR in adenine base editor (ABE) edited HUDEP-2 cells. ABE and CBE edited samples that showed significant reduction of G gamma chain in compared to A gamma chain levels in RP-HPLC were analyzed for larger deletion by qRT-PCR. (f and l) Correlation between deletion percentage (DEL) obtained by qRT-PCR and the difference between A and G gamma percentage obtained from HPLC chains. Asterisks indicate levels of statistical significance *p < 0.05, **p < 0.01, ***p < 0.001, ****p < 0.0001. Data are expressed as mean ± SEM from three biological replicates.
Figure 3—figure supplement 4
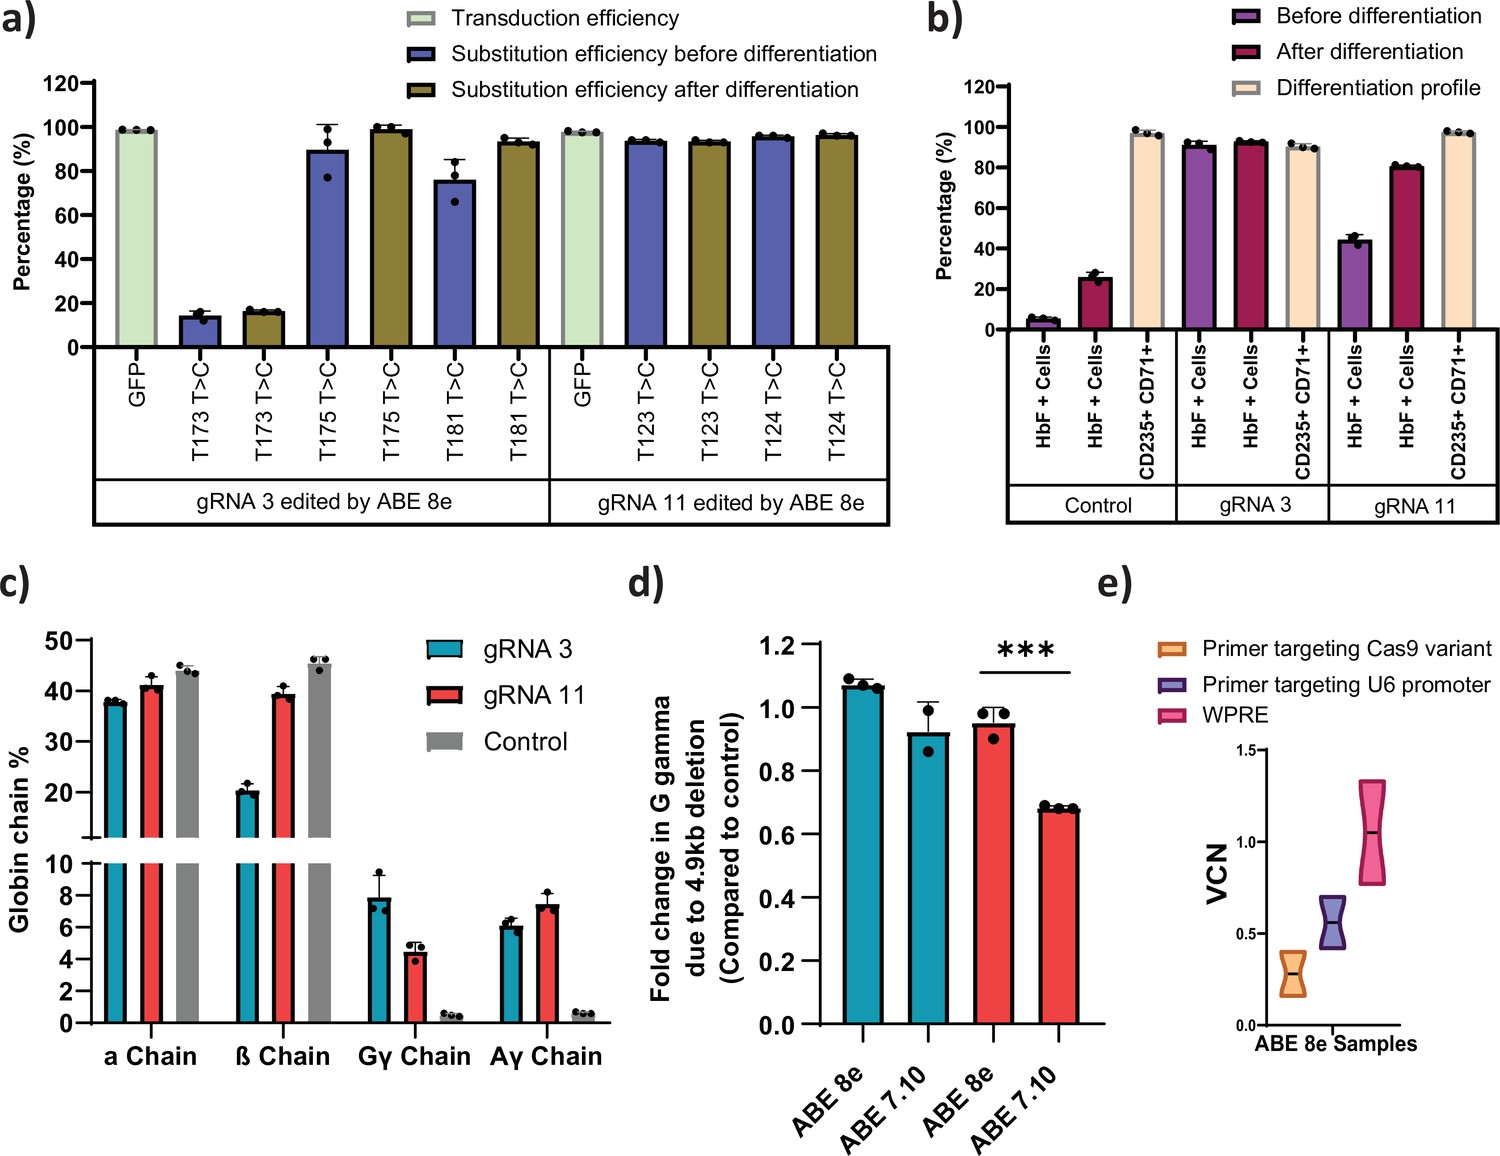
Evaluation of the low efficiency guide RNAs (gRNAs) that induced fetal hemoglobin (HbF) with hyperactive variant adenine base editor (ABE)8e .
(a) Transduction efficiency and percentage of individual base conversion for HUDEP-2 -ABE8e stable cells transduced with gRNA-3 or -11 are represented, before and after erythroid differentiation. The transduction efficiency was analyzed by FACS, the individual base substitutions were analyzed by EditR after Sanger sequencing. (b) Flow cytometry analysis of HbF and erythroid maturation markers (CD71+ CD235a + population) expression in HUDEP-2-ABE8e stable cells transduced with gRNA-3 or -11. The percentage of HbF-expressing cells were analyzed before and after differentiation into erythroblasts. The differentiation profile was analyzed using CD-235 and CD-71 markers at day 7 of erythroid differentiation. (c) RP-HPLC analysis of globin chains after erythroid differentiation. (d) Analysis of HBG2 deletion (due to 4.9 kb deletion) by qRT-PCR in HUDEP-2-ABE8e or ABE7.10 stable cells transduced with gRNA-3 and -11. (e) Vector copy number (VCN) per cell for the integrated gRNA as well as the ABE8e in the respective HUDEP-2 stable cell lines. Primer targeting Cas9 is specific for the gene editor while that targeting U6 promoter is specific for gRNA; primer targeting WPRE is common for both gRNA and gene editor. Asterisks indicate levels of statistical significance ***p < 0.001.
Figure 4
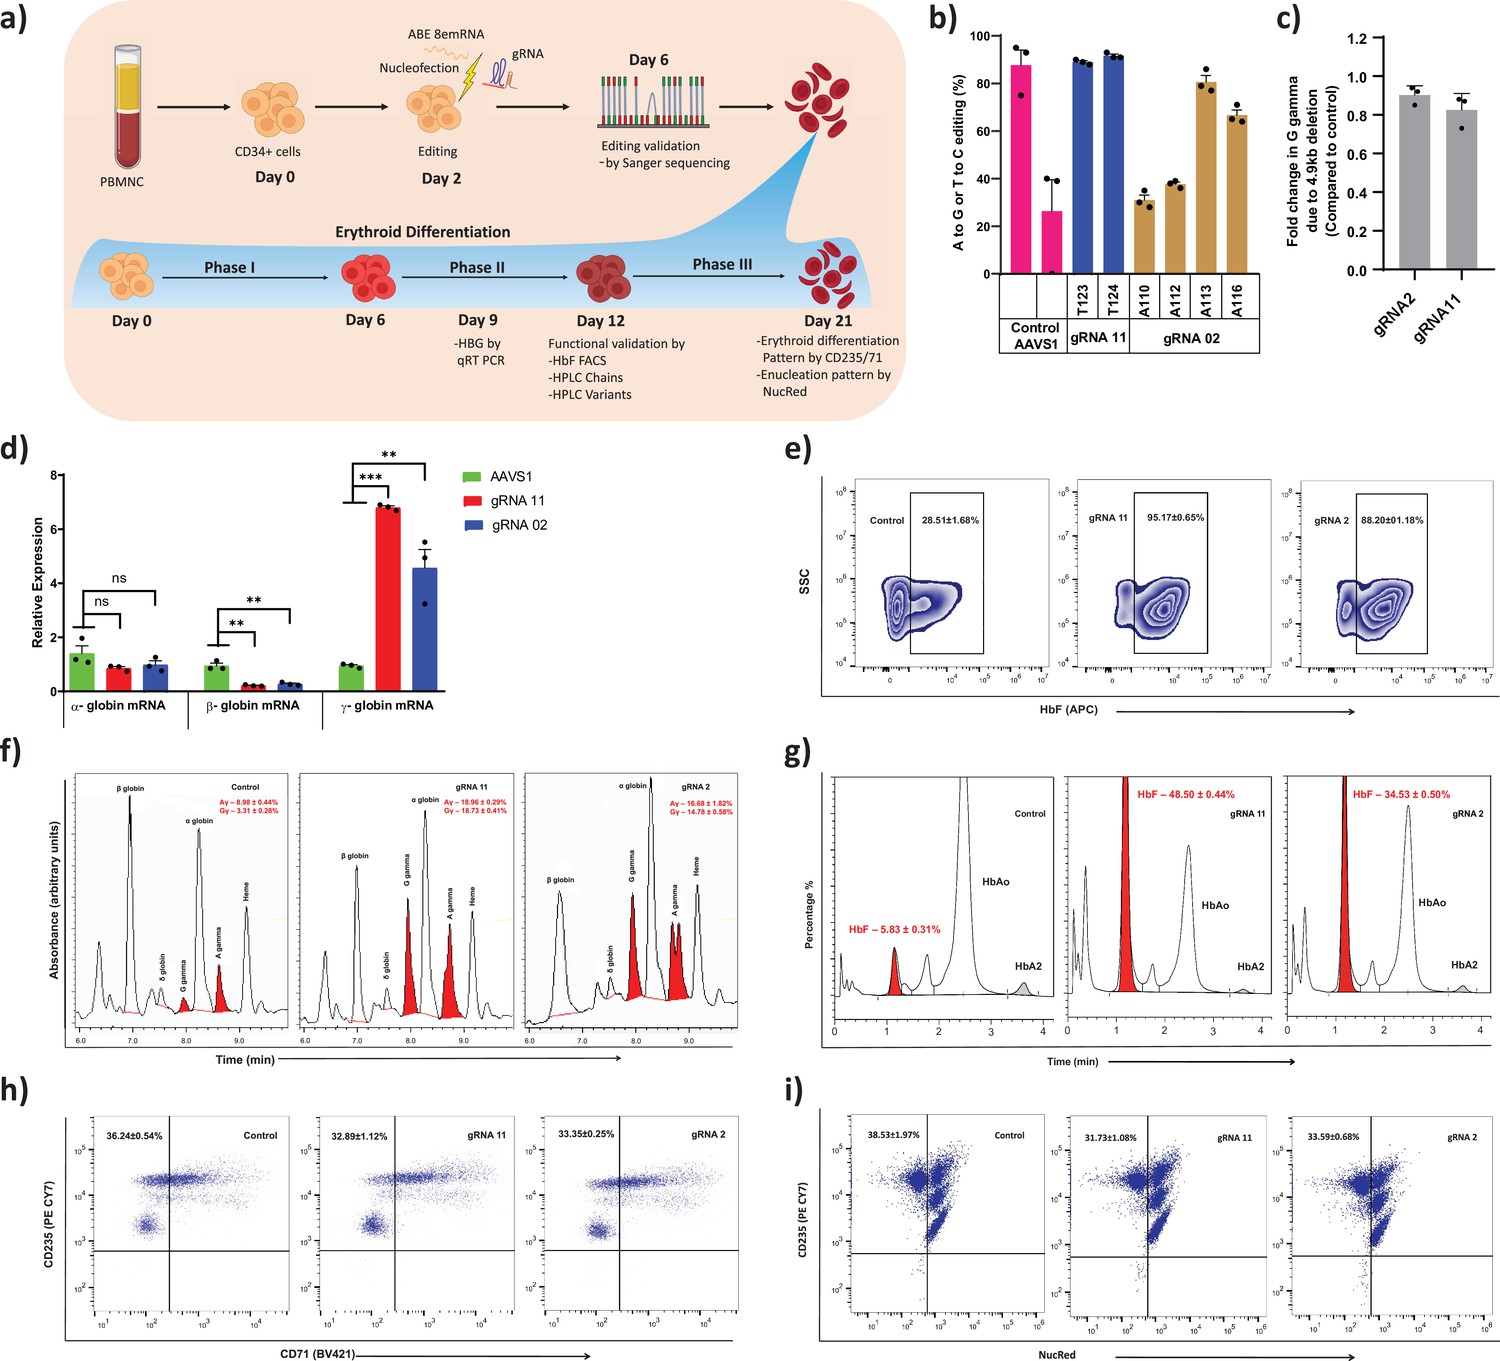
Therapeutic induction of fetal hemoglobin (HbF) in erythroblast derived from healthy donor CD34+ hematopoietic stem and progenitor cells (HSPCs) upon base editing of HBG promoter.
(a) Schematic representation of steps involved in based editing of CD34+ HSPCs. Mobilized CD34+ HSPCs from healthy donor were nucleofected using MaxCyte system with adenine base editor (ABE)8e mRNA and respective guide RNAs (gRNAs) on day 2 of expansion. During expansion, CD34+ HSPCs were analyzed at day 6 for the editing efficiency and 4.9 kb deletion. (b) Efficiency of individual base conversion at the target sites were measured by EditR after Sanger sequencing. (c) Analysis of HBG2 deletion (due to 4.9 kb large deletion) by qRT-PCR. The based edited CD34+ HSPCs were cultured in a three-phase liquid culture system for erythroid differentiation and enucleation. (d) Relative expression of globin transcripts analyzed by qRT-PCR (ΔΔCT) in erythroblasts derived from base edited CD34+ HSPCs on day 9 of differentiation. The functional validation of HbF elevation was analyzed in erythroblasts derived from the indicated samples by FACS, HPLC, and RP-HPLC on day 12 of erythroid differentiation. (e) HbF positive cells analyzed by flow cytometry are represented as zebra plots. (f) RP-HPLC chromatogram profiles of individual globin chains and (g) HPLC chromatogram profile of hemoglobin variants. On the final day of erythroid differentiation, the expression of maturation markers and enucleation fraction were measured by FACS analysis. (h) Flow cytometry for the erythroid maturation markers CD235a+ and CD71+. (i) Enucleation pattern was determined by flow cytometry analysis for CD235a with NucRed in erythroid cells derived from CD34+ HSPCs. Asterisks indicate levels of statistical significance **p < 0.01, ***p < 0.001.
Figure 5 with 1 supplement
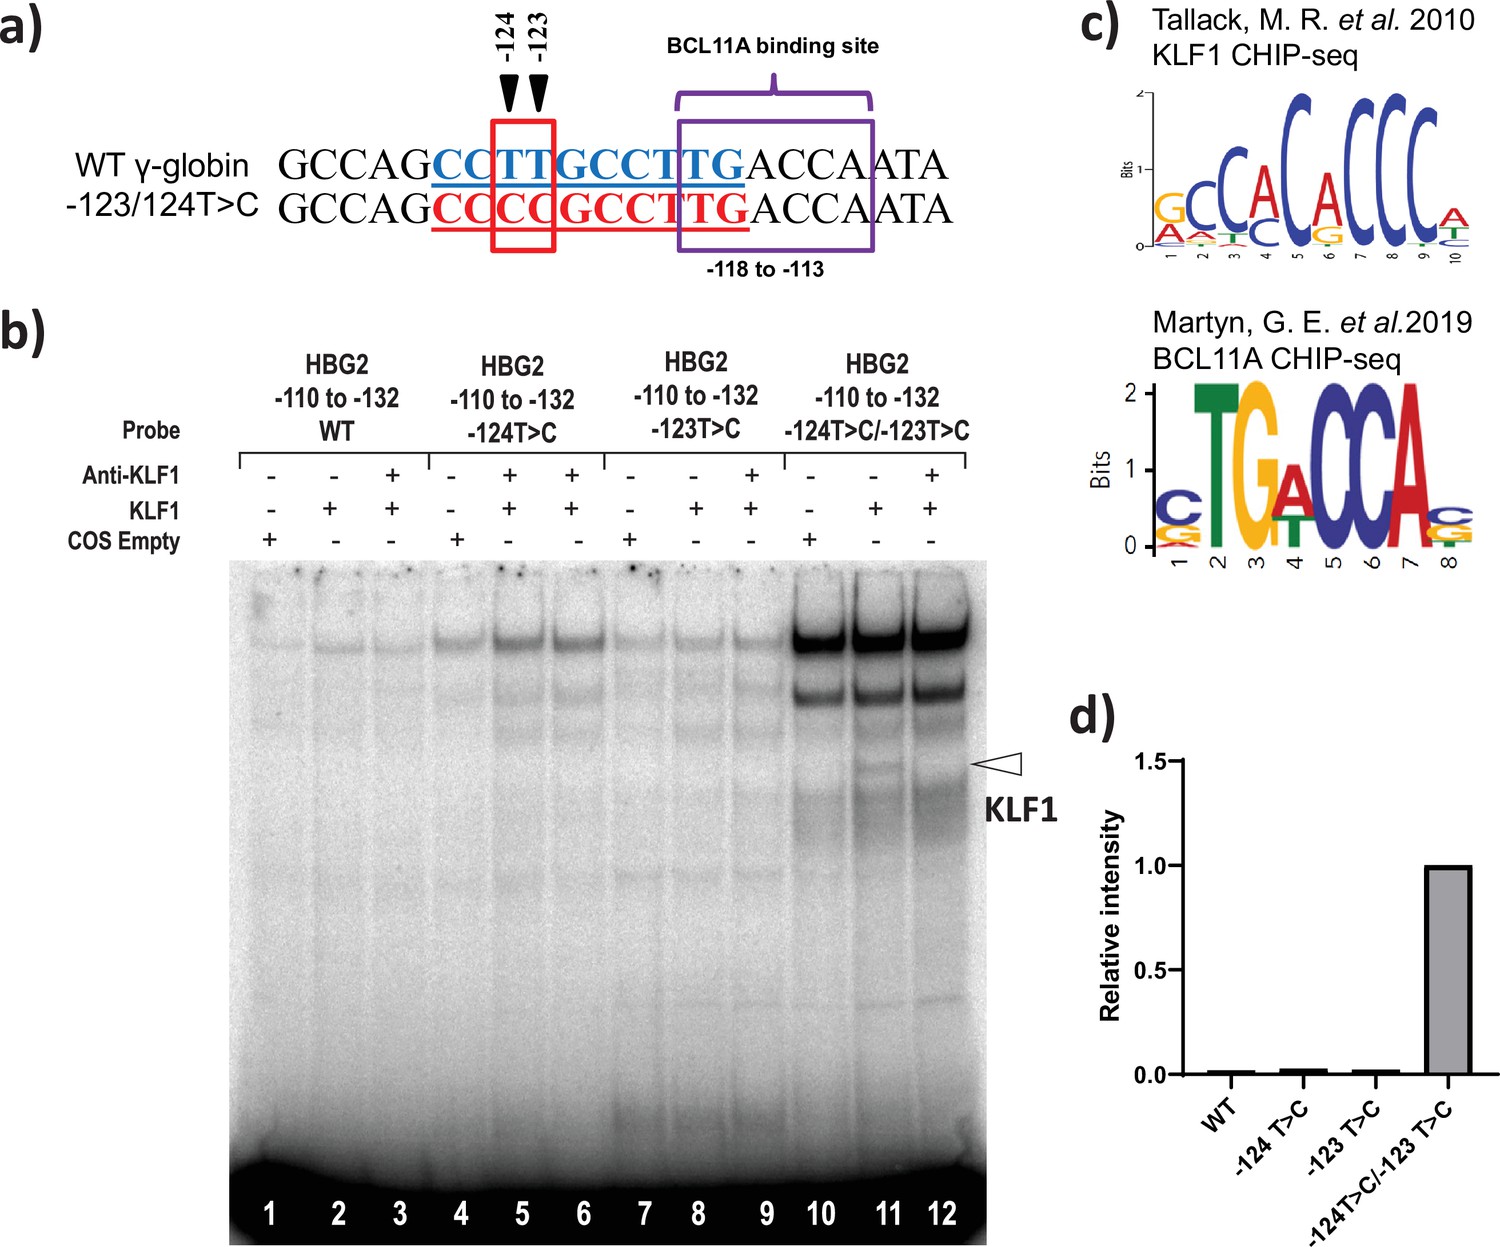
KLF1 binds to the −123T > C and -124T > C region of the HBG proximal promoter in vitro.
(a) Introduction of T-to-C mutation at –123 and –124 of the HBG promoter (–132 to –110 bp) creates the de novo binding site for the KLF1, the wild type and novel KLF binding motif is highlighted in blue and red, respectively. (b) In vivo binding motifs of transcription factors KLF1 and BCL11A as determined by ChIP-Seq as previously reported. (c) Electrophoretic mobility shift assay (EMSA) showing KLF1 binding to –123T > C/–124T > C probe but failing to bind to –124T > C probe, –123T > C probe and WT probe with the –123T/–124T region of the HBG promoter in vitro. Lanes 1, 4,7, and 10 contain nuclear extracts from COS cells transfected with a pcDNA3 empty vector. Lanes 2–3, 5–6, 8–9, and 11–12 contain nuclear extracts from COS cells overexpressing KLF1. Binding of KLF1 to the –123T > C/–124T > C HPFH mutant probe can be observed in lane 11, with a super shift of KLF1 in the presence of anti-KLF1 antibody in lane 12. (d) Quantification of relative intensity of bands (KLF1 binding to the probe) from the EMSA using Image Lab 6.0.1 (Bio-Rad) software.
-
Figure 5—source data 1
Electrophoretic mobility shift assay (EMSA) showing KLF1 binding to –123T > C/–124T > C probe but failing to bind to –124T > C probe, –123T > C probe, and wild type (WT) probe with the –123T/–124T region of the HBG promoter in vitro.
Lanes 1, 4, 7, and 10 contain nuclear extracts from COS cells transfected with a pcDNA3 empty vector. Lanes 2–3, 5–6, 8–9, and 11–12 contain nuclear extracts from COS cells overexpressing KLF1. Binding of KLF1 to the –123T > C/–124T > C hereditary persistence of fetal hemoglobin (HPFH) mutant probe can be observed in lane 11, with a super shift of KLF1 in the presence of anti-KLF1 antibody in lane 12.
- https://cdn.elifesciences.org/articles/65421/elife-65421-fig5-data1-v2.zip
Figure 5—figure supplement 1
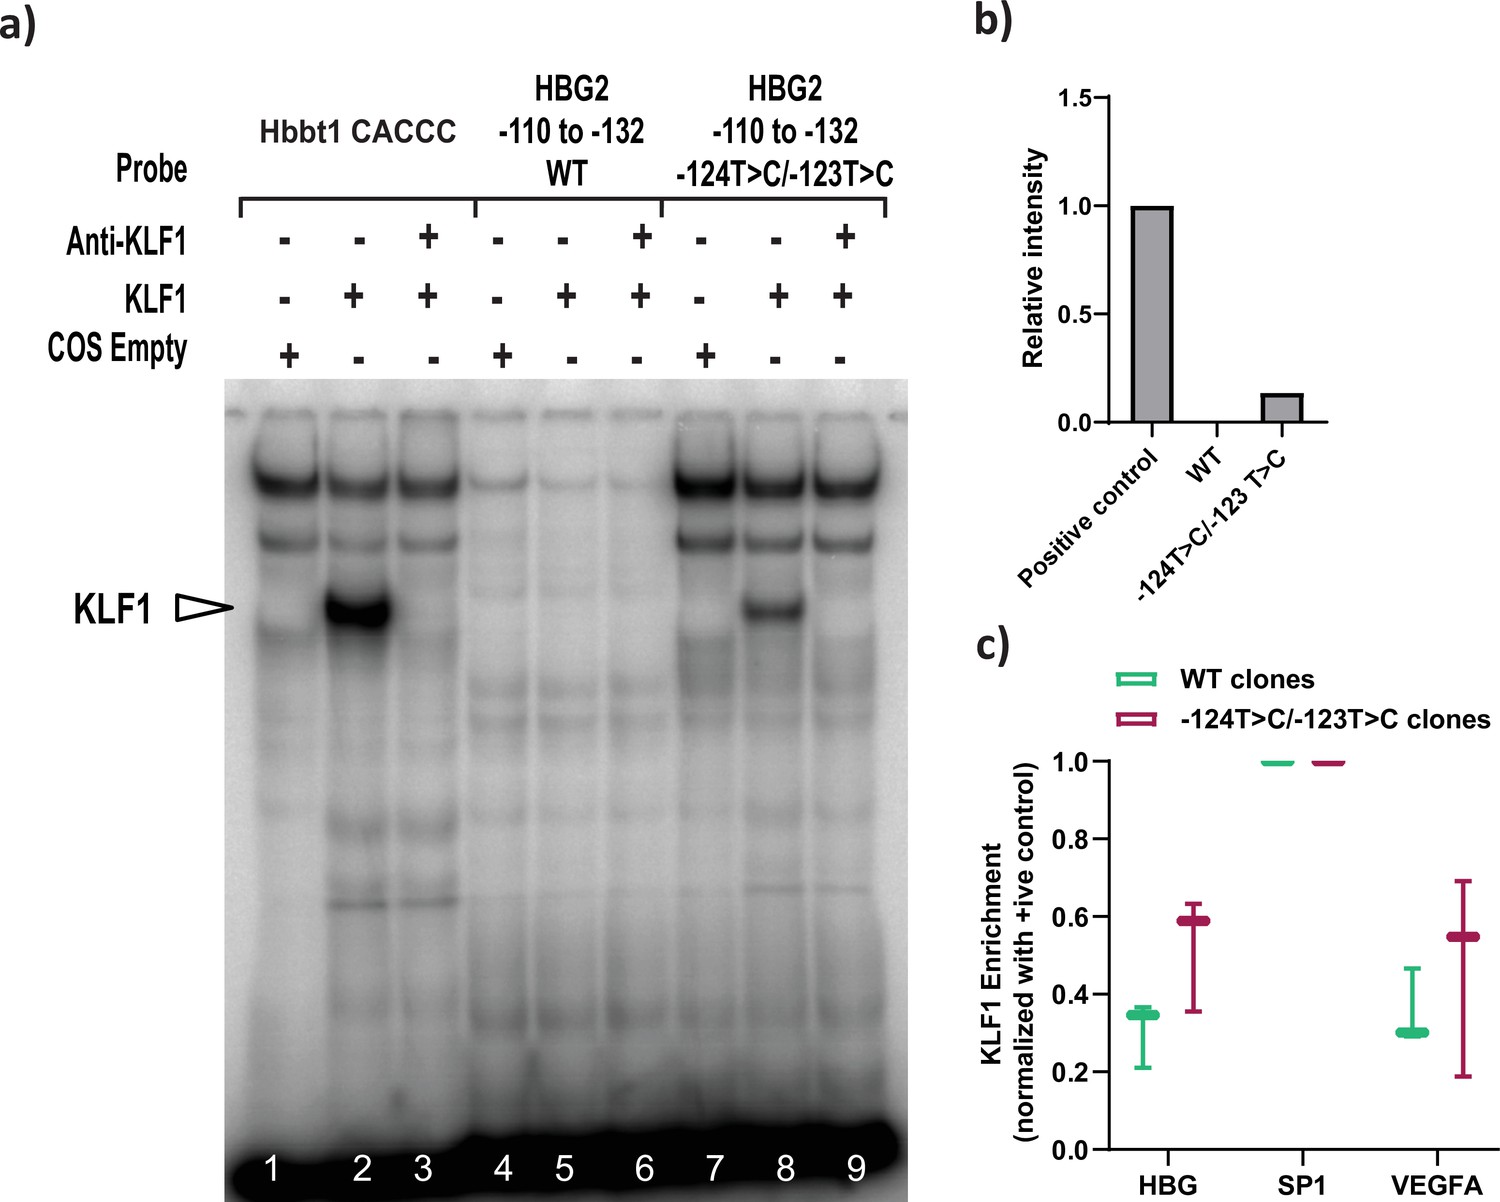
Recruitment of KLF1 to site at –123 bp of HBG proximal promoter were analyzed by electrophoretic mobility shift assay (EMSA) and ChIP-qPCR.
(a) EMSA showing the binding of KLF1 to the –123T > C/–124T > C probe but fails to bind to a wild type (WT) probe containing the −123/–124 region of the HBG promoter in vitro. Lanes 1–3 contain the Hbbt1-CACCC as positive control, lanes 4–6 contain the WT probe for the −123, –124 site (−132 to –110 bp) and lanes 7–9 contain the hereditary persistence of fetal hemoglobin (HPFH) −123/–124T > C mutant probe. Lanes 1, 4, and 7 contain nuclear extracts from COS cells transfected with a pcDNA3 empty vector. Lanes 2–3, 5–6, and 8–9 contain nuclear extracts from COS cells overexpressing KLF1. Binding of KLF1 to the −123/–124T > C HPFH mutant probe can be observed in lane 8, with a super shift of KLF1 with an anti-KLF1 antibody in lane 9. (b) Quantification of relative intensity of bands from the EMSA using Image Lab 6.0.1 (Bio-Rad) software. (c) KLF1ChIP-qPCR in HUDEP-2 WT (n = 3) and –123T > C/–124T > C cells (n = 3) to measure the relative enrichment of KLF1 at indicated genomic loci. The promoters of VEGFA and SP1 were respectively used as the negative and positive control. The values were normalized to the positive control locus (SP1). Data are expressed as mean ± SEM from three biological replicates. Asterisks indicate levels of statistical significance *p < 0.05.
-
Figure 5—figure supplement 1—source data 1
Electrophoretic mobility shift assay (EMSA) showing the binding of KLF1 to the –123T > C/–124T > C probe but fails to bind to a wild type (WT) probe containing the −123/–124 region of the HBG promoter in vitro.
Lanes 1–3 contain the Hbbt1-CACCC as positive control, lanes 4–6 contain the WT probe for the −123,–124 site (−132 to –110 bp) and lanes 7–9 contain the hereditary persistence of fetal hemoglobin (HPFH) −123/–124T > C mutant probe. Lanes 1, 4, and 7 contain nuclear extracts from COS cells transfected with a pcDNA3 empty vector. Lanes 2–3, 5–6, and 8–9 contain nuclear extracts from COS cells overexpressing KLF1. Binding of KLF1 to the −123/–124T > C HPFH mutant probe can be observed in lane 8, with a super shift of KLF1 with an anti-KLF1 antibody in lane 9.
- https://cdn.elifesciences.org/articles/65421/elife-65421-fig5-figsupp1-data1-v2.zip
Figure 6 with 1 supplement
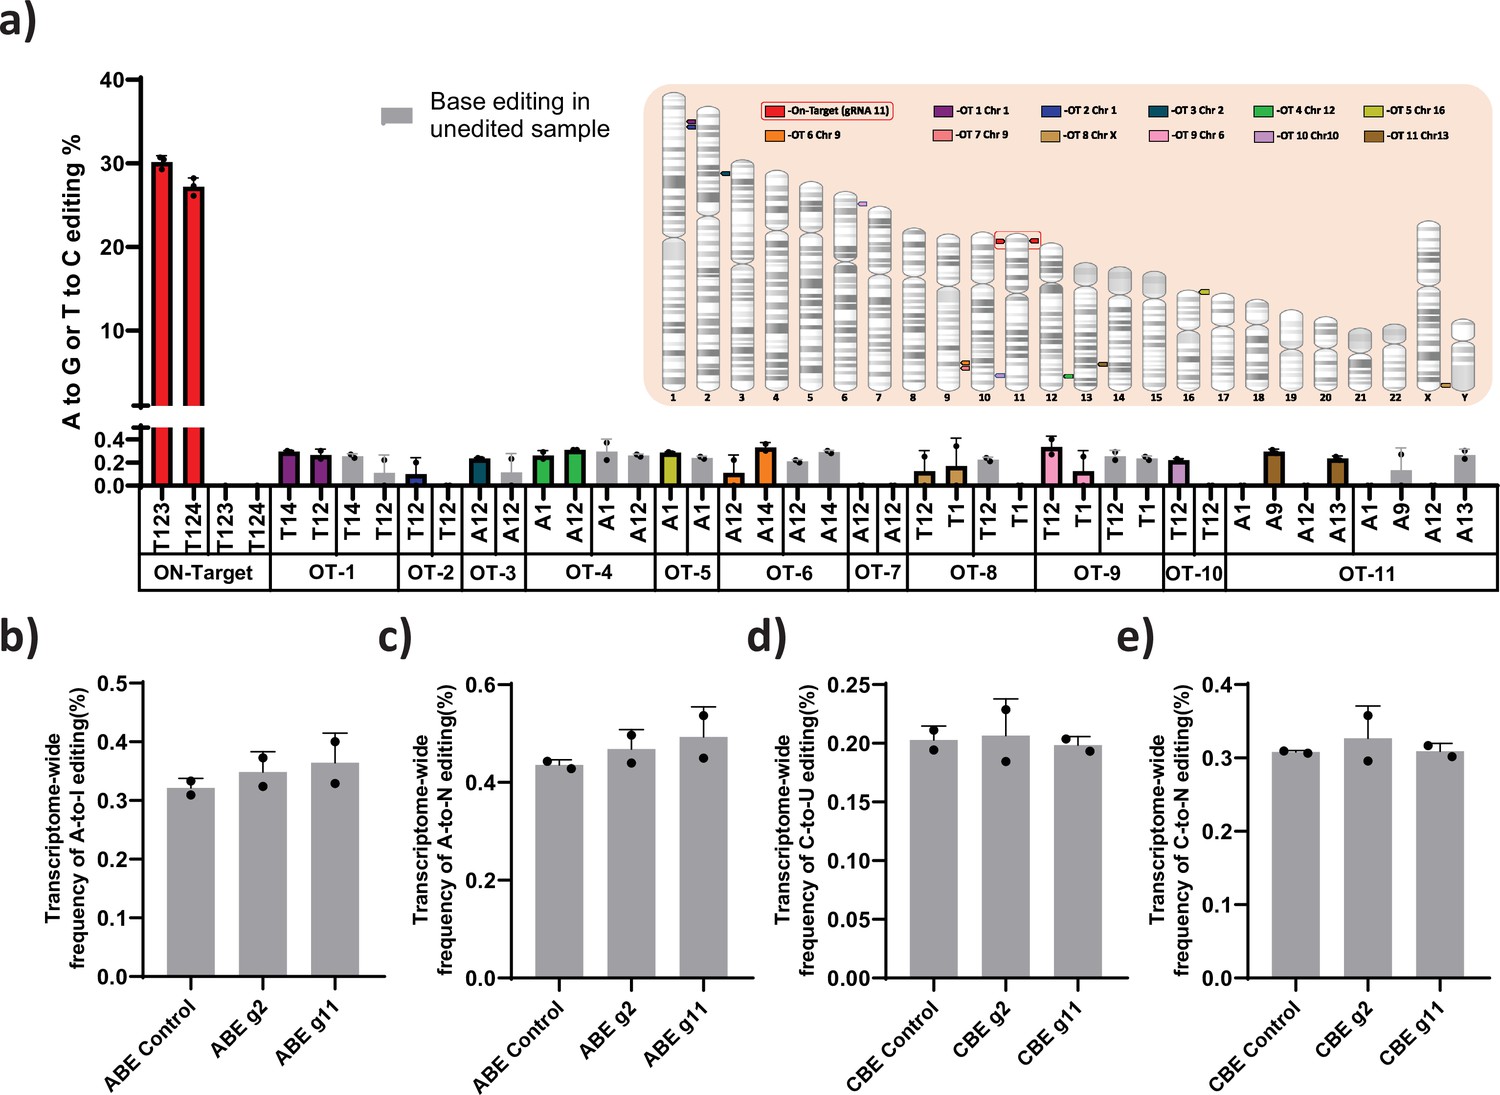
Evaluation of Cas-dependent DNA off-target and Cas-independent RNA off-target editing by adenine base editor.
(a) Base conversions at the top 11 Cas-dependent DNA off-target sites in adenine base editor (ABE) 7.10 stable edited with guide RNA (gRNA)-11, along with the on-target events. The positions of the off-target and on-target loci are represented in their respective chromosome. The frequency of transcriptome-wide cellular levels of A- to- I (b), A- to- N (c), C- to -U (d), and C- to- N (e) RNA editing in BE3 stables (CBE), ABE 7.10 stables (ABE), BE3 stables edited with gRNAs-2 or -11, and ABE edited with gRNAs-2 or -11 are represented. The data are mean ± SD of two technical replicates.
Figure 6—figure supplement 1
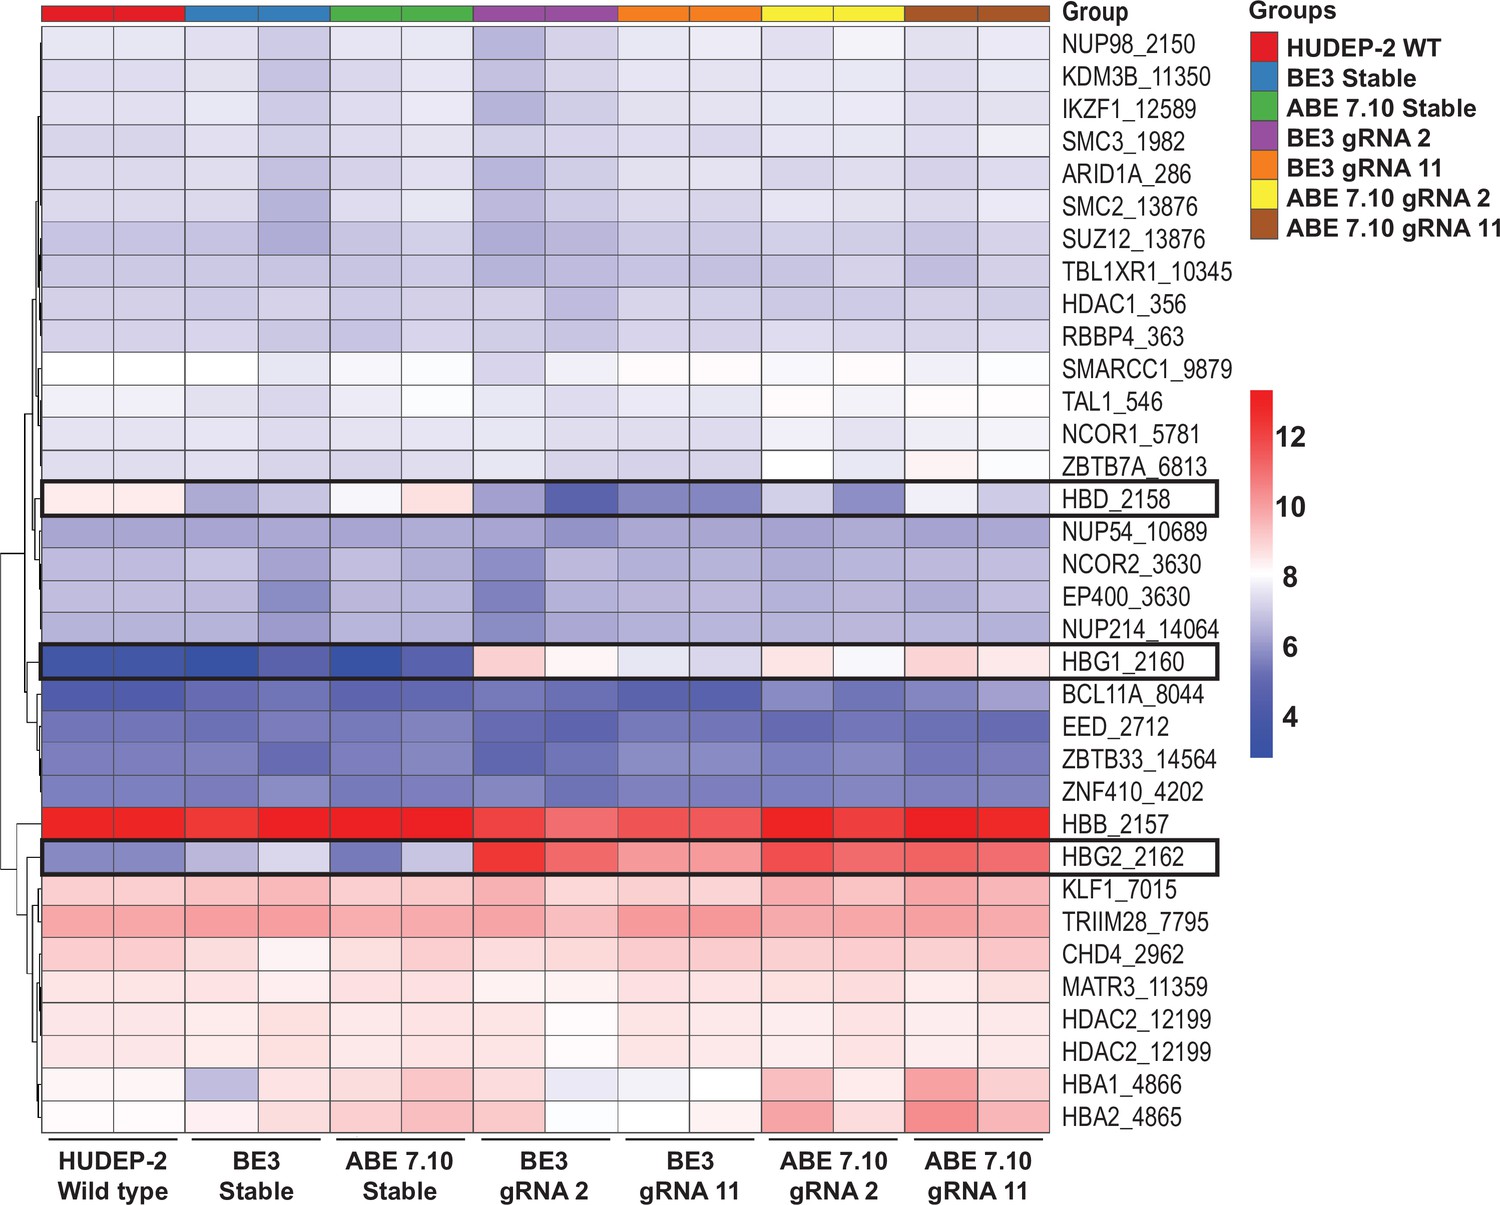
Expression profile of HBG regulators after base editing.
The differential expression of 34 selected genes that are involved in gamma-globin regulation were compared between the unedited HUDEP-2 wild type (WT), cytosine base editor (CBE) control, adenine base editor (ABE) control, edited ABE (guide RNA [gRNA]-2 or -11) and edited CBE (gRNA-2 or -11), and their expressions are represented as heat map.
Figure 7
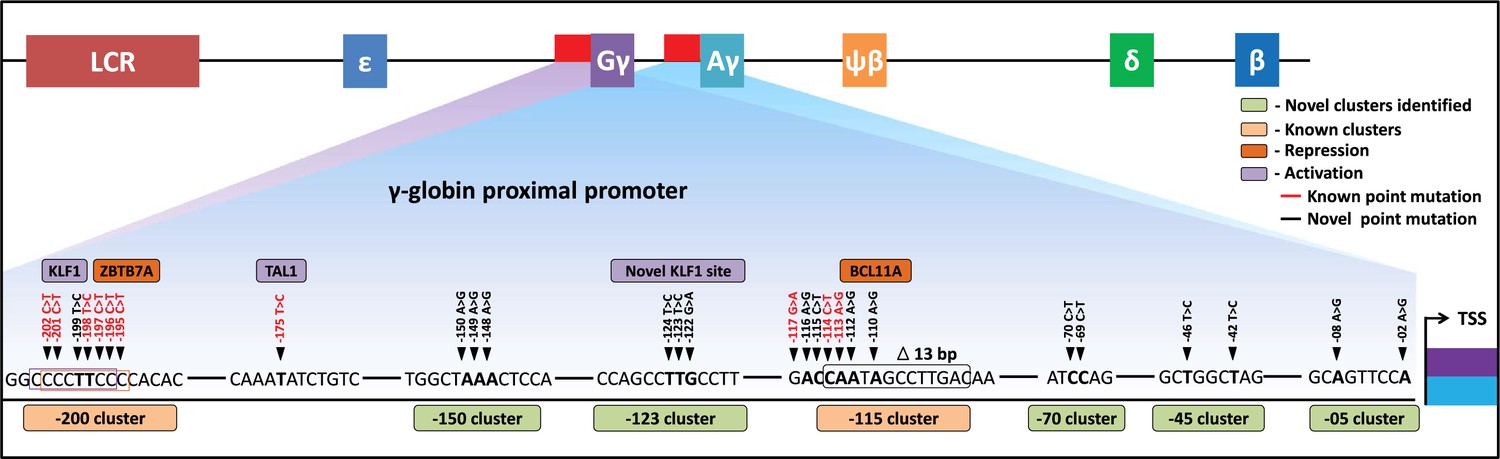
Schematic representation of known and identified point mutations in HBG promoter region that elevates fetal hemoglobin (HbF): The proximal promoter region of HBG2 and HBG1 is represented from transcription start site (TSS) till –205 bases.
Novel clusters identified from this study are highlighted in Sage (five clusters), and known clusters are highlighted in Melon (two clusters). Among these clusters, known base conversions are represented in black and identified hereditary persistence of fetal hemoglobin (HPFH)-like mutations are represented in red text. The novel base conversions from our study are represented in bold font. Transcriptional activators (lavender) and repressors (orange) that bind to the known clusters are also depicted in the figure.
Tables
Appendix 1—key resources table
| Reagent type (species) or resource | Designation | Source or reference | Identifiers | Additional information |
|---|---|---|---|---|
| Genetic reagent (Homo sapiens) | GRCh38 | GenBank | 883148 | |
| Strain, strain background (Escherichia coli) | DH10B | ECOS, Yeastern Biotech | CAT # FYE507-10VL | |
| Recombinant DNA reagent | pLKO5.sgRNA. EFS.GFP | Addgene | Addgene_57822; RRID:Addgene_57822 | |
| Recombinant DNA reagent | pLKO5.sgRNA. EFS.RFP | Addgene | Addgene_57823; RRID:Addgene_57823 | |
| Recombinant DNA reagent | pLenti-FNLS- P2A-Puro | Addgene | Addgene_110841; RRID:Addgene_110841 | |
| Recombinant DNA reagent | pLenti-ABERA-P2A-Puro | Addgene | Addgene_112675; RRID:Addgene_112675 | |
| Recombinant DNA reagent | pMD2.G | Addgene | Addgene_12259; RRID:Addgene_12259 | |
| Recombinant DNA reagent | psPAX2 | Addgene | Addgene_12260; RRID:Addgene_12260 | |
| Recombinant DNA reagent | TadA-8e V106W | Addgene | Addgene_138495; RRID:Addgene_138495 | |
| Recombinant DNA reagent | lentiCRISPR V2 | Addgene | Addgene_52961; RRID:Addgene_52961 | |
| Recombinant DNA reagent | lentiCRISPRV2.1 | This study | Cas9 expressing lentiviral plasmid without gRNA scaffold | |
| Recombinant DNA reagent | pLenti-ABE8e-P2A-Puro | This study | ABE8e expressing lentiviral plasmid | |
| Recombinant DNA reagent | pcDNA-3 | Invitrogen | ||
| Recombinant DNA reagent | pSG5/mKLF | Miller and Bieker, 1993 | ||
| Antibody | PE Mouse Anti-Human CD34 (mouse monoclonal) | BD Pharmingen | CAT # 550761; RRID:AB_393871 | FACS (2 µl/test) |
| Antibody | APC Mouse Anti-Human CD133 (mouse monoclonal) | BD Pharmingen | CAT # 566596; RRID:AB_2744280 | FACS (2 µl/test) |
| Antibody | BV421 Mouse Anti-Human CD90 (mouse monoclonal) | BD Pharmingen | CAT # 562556; RRID:AB_2737651 | FACS (2 µl/test) |
| Antibody | PE-Cy7 Mouse Anti-Human CD235a (mouse monoclonal) | BD Pharmingen | CAT # 563666; RRID:AB_2738361 | FACS (2 µl/test) |
| Antibody | BV421 Mouse Anti-Human CD71 (mouse monoclonal) | BD Pharmingen | CAT # 562995; RRID:AB_2737939 | FACS (2 µl/test) |
| Antibody | PE Mouse Anti-Human CD235a (mouse monoclonal) | BD Pharmingen | CAT # 555570; RRID:AB_395949 | FACS (2 µl/test) |
| Antibody | FITC Mouse Anti-Human CD71 (mouse monoclonal) | BD Pharmingen | CAT # 555536; RRID:AB_395920 | FACS (2 µl/test) |
| Antibody | Fetal Hemoglobin Antibody, APC (mouse monoclonal) | Invitrogen | CAT # MHFH05; RRID:AB_10374595 | FACS (2 µl/test) |
| Antibody | Antibody for KLF1 (rabbit polyclonal) | Crossley et al., 1996 | EMSA (1:30 final dilution) | |
| Antibody | Anti-KLF1 antibody (goat polyclonal) | OriGene | #TA305808 | ChiP (15 µg/IP) |
| Antibody | Normal rabbit IgG | Cell Signaling Technology | #2729S | ChiP (15 µg/IP) |
| Commercial assay or kit | NucRed Live 647 ReadyProbes Reagent | Invitrogen | CAT # R37106 | FACS (2 µl/test) |
| Commercial assay or kit | Zymoclean Gel DNA recovery kit | Zymo Research | CAT # D4001 | |
| Commercial assay or kit | NucleoBond Xtra Midi | MN | REF # 740410 | |
| Commercial assay or kit | NucleoSpin RNA | MN | REF # 740955 | |
| Commercial assay or kit | NucleoSpin Blood – DNA kit | MN | REF # 740951 | |
| Commercial assay or kit | EasySep Human CD34 Positive Selection Kit | STEMCELL Technologies | CAT # 17856 | |
| Commercial assay or kit | T7 mScript Standard mRNA Production System | Cell Script | C-MSC100625 | |
| Commercial assay or kit | Radiolabelled DNA column | Roche | G25DNA-RO | |
| Commercial assay or kit | iScript cDNA Synthesis Kit | Bio-Rad | CAT # 1708891 | |
| Commercial assay or kit | BigDye Terminator v3.1 Cycle Sequencing Kit | Applied Biosystem | CAT # 4337458 | |
| Commercial assay or kit | SsoFast EvaGreen Supermix | Bio-Rad | CAT # 172–5200 | |
| Commercial assay or kit | Universal Mycoplasma detection kit | ATCC | CAT # 30–1012K | |
| Chemical compound, drug | T4 Polynucleotide Kinase | NEB | CAT # M0201 | |
| Chemical compound, drug | T4 DNA Ligase | NEB | CAT # M0202 | |
| Chemical compound, drug | NEBuilder HiFi DNA Assembly Master Mix | NEB | CAT # E2621 | |
| Chemical compound, drug | BamHI-HF | NEB | CAT # R3136 | |
| Chemical compound, drug | NhEI-HF | NEB | CAT # R3131 | |
| Chemical compound, drug | BsmB1 | NEB | CAT # R0580 | |
| Chemical compound, drug | KpnI-HF | NEB | CAT # R3142 | |
| Chemical compound, drug | EcoRI-HF | NEB | CAT # R3101 | |
| Chemical compound, drug | Exonuclease I (E. coli) | NEB | CAT # M0293 | |
| Chemical compound, drug | Pme1 | NEB | CAT # R0560 | |
| Chemical compound, drug | GoTaq Green Master Mix | Promega | CAT # M712B | |
| Chemical compound, drug | PrimeSTAR GXL Premix | Takara Bio | CAT # R051A | |
| Chemical compound, drug | DynaBeads PG | Invitrogen | 10003D | |
| Chemical compound, drug | Formaldehyde | Sigma-Aldrich | F8775 | 1% v/v final concentration |
| Chemical compound, drug | Glycine | Ajax Finechem | AJA1083 | 125 mM final concentration |
| Chemical compound, drug | γ-Kuzminov, 2001P ATP | Perkin-Elmer | BLU502A250UC | 1 µl/15 pmol probe |
| Chemical compound, drug | Insulin | Sigma-Aldrich | CAT # 11061-68-0 | |
| Chemical compound, drug | Heparin | MP Biomedicals | CAT # 9041-08-1 | |
| Chemical compound, drug | Holotransferrin | BBI Solutions | #SKU T101-5 | |
| Chemical compound, drug | SCF | Immuno Tools | CAT # 11343325 | |
| Chemical compound, drug | EPO | Zydus Nephrosciences | Zyrop 4000 IU Injection | |
| Chemical compound, drug | IL6 | Immuno Tools | CAT # 11340066 | |
| Chemical compound, drug | IL3 | Immuno Tools | CAT # 11340035 | |
| Chemical compound, drug | FLT3 | Immuno Tools | CAT # 11343305 | |
| Chemical compound, drug | TPO | Immuno Tools | CAT # 11344863 | |
| Chemical compound, drug | Hydrocortisone | MP Biomedicals | CAT # 2930949 | |
| Chemical compound, drug | AB Serum | MP Biomedicals | CAT # 101996 | |
| Chemical compound, drug | Penstrep | Gibco | CAT # 15140122 | |
| Chemical compound, drug | Dexamethasone | Alfa Aesar | CAS# 1177-87-3 | |
| Chemical compound, drug | Doxycycline | Sigma-Aldrich | CAS# 24390-14-5 | |
| Chemical compound, drug | Glutamine | Gibco | CAT # 25030081 | |
| Chemical compound, drug | FBS | Gibco | CAT # 10270106 | |
| Chemical compound, drug | PBS | Hyclone | CAT # SH30256.02 | |
| Chemical compound, drug | Polybrene | Sigma-Aldrich | CAS # 28728-55-4 | |
| Chemical compound, drug | Hepes | Gibco | CAT # 15630080 | |
| Chemical compound, drug | Puromycin | Gibco | CAT # A1113803 | |
| Chemical compound, drug | Pseudouridine | Jena Bioscience | CAT # NU-1139 | |
| Chemical compound, drug | Lymphoprep | STEMCELL Technologies | CAT # 07851 | |
| Chemical compound, drug | StemSpan SFEM-II | STEMCELL Technologies | CAT # 09655 | |
| Chemical compound, drug | DMEM | Hyclone | CAT # SH30243.01 | |
| Chemical compound, drug | RPMI | Hyclone | CAT # SH30027.01 | |
| Chemical compound, drug | IMDM-Glutamax | Gibco | CAT # 31980030 | |
| Chemical compound, drug | Fugene HD | Promega Corporation | CAT # E2312 | |
| Chemical compound, drug | Lenti-X concentrator | Takara | CAT # 631232 | |
| Chemical compound, drug | Maxcyte buffer | Hyclone | CAT # EPB1 | |
| Chemical compound, drug | LB Agar | HIMEDIA | M1151 | |
| Chemical compound, drug | LB Broth | HIMEDIA | M1245 | |
| Chemical compound, drug | Ampicillin Sodium Salt | SRL | 61,314 | |
| Chemical compound, drug | Triton X-100 | Fisher Scientific | CAS #:9002931 | |
| Chemical compound, drug | Glutaraldehyde | MP Biomedicals | CAT # 198,595 | |
| Biological sample | PBMNCs | CMC | IRB Min. No. 10,549 (others) dated 15/02/2017 | |
| Cell line (Homo sapiens) | HEK 293T | ATCC | ||
| Cell line (Homo sapiens) | HUDEP-2 | Cell Engineering Division, RIKEN BioResource Center | ||
| Cell line (Homo sapiens) | K562 | ATCC | ||
| Cell line (African green monkey) | COS-7 | Gluzman, 1981 | ||
| Sequence-based reagent | gRNAs | This paper | Check Supplementary file 1 | |
| Sequence-based reagent | Probes, RT-qPCR and PCR primers | This paper | Check Supplementary file 2 | |
| Software, algorithm | Reditools 2 | GitHub - BioinfoUNIBA/REDItools2, Giudice, 2022 | RNA off-target | |
| Software, algorithm | Synthego ICE | Synthego | InDel for Sanger sequenced data | |
| Software, algorithm | EditR | EditR: Edit Deconvolution by Inference of Traces in R (shinyapps.io) | Base editing efficiency for Sanger sequenced data | |
| Software, algorithm | IGV | Home | Integrative Genomics Viewer (broadinstitute.org) | Visualize Aligned data | |
| Software, algorithm | CRISPResso-2 | CRISPResso2 (partners.org) | Base editing efficiency for NGS data | |
| Software, algorithm | Snapgene | SnapGene | Software for everyday molecular biology | gRNA designing | |
| Software, algorithm | Benchling | CRISPR gRNA Design Tool | Benchling | gRNA designing | |
| Software, algorithm | FlowJo 10.7.1 | Home | FlowJo, LLC | FACS data analysis | |
| Software, algorithm | Cas off-finder | CRISPR RGEN Tools (rgenome.net) | DNA off-target prediction | |
| Software, algorithm | Cosmid | CRISPR Target Search (gatech.edu) | Primer designing for predicted DNA off-targets | |
| Software, algorithm | Bowtie 2 | Bowtie 2: fast and sensitive read alignment (sourceforge.net) | Sequence alignment | |
| Software, algorithm | TrimGalore | Babraham Bioinformatics - Trim Galore! | FastQ files processing | |
| Software, algorithm | NFCore RNA Seq pipeline | rnaseq » nf-core | RNA sequencing pipeline | |
| Software, algorithm | Interactive Gene Expression Analysis Kit (iGEAK) | iGEAK! (google.com) | ||
| Software, algorithm | GraphPad Prism 8.0.1 | GraphPad Prism (https://graphpad.com) | RRID:SCR_015807 |
Additional files
-
Supplementary file 1
The guide RNAs (gRNAs) used in this study to screen the HBG promoter region and their respective primer for sequencing.
- https://cdn.elifesciences.org/articles/65421/elife-65421-supp1-v2.docx
-
Supplementary file 2
All the PCR, qRT-PCR primers and probes used in this study.
- https://cdn.elifesciences.org/articles/65421/elife-65421-supp2-v2.docx
-
Supplementary file 3
The targets analyzed for DNA off-target.
- https://cdn.elifesciences.org/articles/65421/elife-65421-supp3-v2.docx
-
Transparent reporting form
- https://cdn.elifesciences.org/articles/65421/elife-65421-transrepform1-v2.docx
Download links
A two-part list of links to download the article, or parts of the article, in various formats.
Downloads (link to download the article as PDF)
Open citations (links to open the citations from this article in various online reference manager services)
Cite this article (links to download the citations from this article in formats compatible with various reference manager tools)
Identification of novel HPFH-like mutations by CRISPR base editing that elevate the expression of fetal hemoglobin
eLife 11:e65421.
https://doi.org/10.7554/eLife.65421


