A low Smc flux avoids collisions and facilitates chromosome organization in Bacillus subtilis
- Department of Fundamental Microbiology, Faculty of Biology and Medicine, University of Lausanne, Switzerland
- Université Paris-Saclay, CEA, CNRS, Institute for Integrative Biology of the Cell (I2BC), France
- Max Planck Institute of Biochemistry, Germany
Figures
Figure 1 with 3 supplements

Arm-modified Smc proteins fail to align chromosome arms unless most parS sites are removed.
(A) Upper panel: scheme depicting the natural distribution of parS sites on the B. subtilis genome. Triangles indicate positions of parS sites, size of which is scaled according to ParB occupancy judged by ChIP-seq (Minnen et al., 2016). Lower panel: scheme depicting engineered parS distribution generated in this study. parS sites were either eliminated by mutation or substituted for the parSopt sequence (i.e., the sequence of –9kbparS) as needed. For some experiments, an additional site (+328kbparSopt) was inserted into the amyE locus. (B) Left panel: schemes of Smc coiled coil variants investigated in this study: wild-type (CC334), elongated (CC4xx), and shortened (CC253). Spn hinge+CC100, Streptococcus pneumoniae hinge domain, and 100 amino acids hinge-proximal coiled coil (in orange colors). The coiled coil was shortened or elongated starting from a chimeric protein having the B. subtilis Smc hinge domain replaced by the S. pneumoniae (Spn) Smc hinge domain including an ~100 aa (amino acid) segment of the adjacent coiled coil. Right panel: spotting assay of strains with altered Smc coiled coil in wild-type or sensitized background (ΔparB). 9−2 and 9−5 dilutions were spotted on nutrient-poor (SMG) or nutrient-rich medium (ONA) and imaged after 36 hr and 15 hr, respectively. Note that in the absence of ParB the ParABS system is non-functional and Smc loading is inefficient and untargeted, together putting a strain on chromosome segregation (Minnen et al., 2016; Wilhelm et al., 2015). The expression levels of some of these constructs (CC435, CC253) were previously shown to be close to the levels of the wild-type protein by immunoblotting (Bürmann et al., 2017). The levels of Smc-CC425 are evaluated in Figure 1—figure supplement 1A. (C) Normalized 3C-seq contact maps obtained from exponentially growing cultures. Top row: strains with wild-type parS sites. Bottom row: strains with a single –9kbparSopt (par-S359) site. All 3C-seq maps presented in this study are split into 10 kb bins and have the replication origin placed in the middle. The interaction score is in log10 scale, the darker the color, the more interactions between given loci (see Materials and methods). (D) Normalized 3C-seq contact maps obtained from exponentially growing cultures carrying all the wild-type parS sites and wild-type length Smc (Smc-CC344) with either only hinge replaced by the S. pneumoniae sequence (Spn hinge, left panel) or the hinge together with 100 amino acids of hinge-proximal coiled coil replaced (Spn hinge + CC100, right panel). (E) Scheme for asymmetric loop extrusion starting at –304kbparS (parS-334) due to blockage of translocation towards the replication origin by head-on encounters (with other Smc complexes or RNA polymerase) generating an arc of contacts in the 3C-seq maps. (F) Normalized 3C-seq contact maps of elongated Smc (Smc-CC425) carrying parSopt sites at −304 kb and −9 kb (left panel) or parSopt site at −304 kb only (right panel). Triangles above the contact map point to positions of parS sites (dark gray triangles indicate active parS sites, light gray triangles for reference are parS sites absent in the given experiment).
Figure 1—figure supplement 1
Characterization of Smc variants, #1.
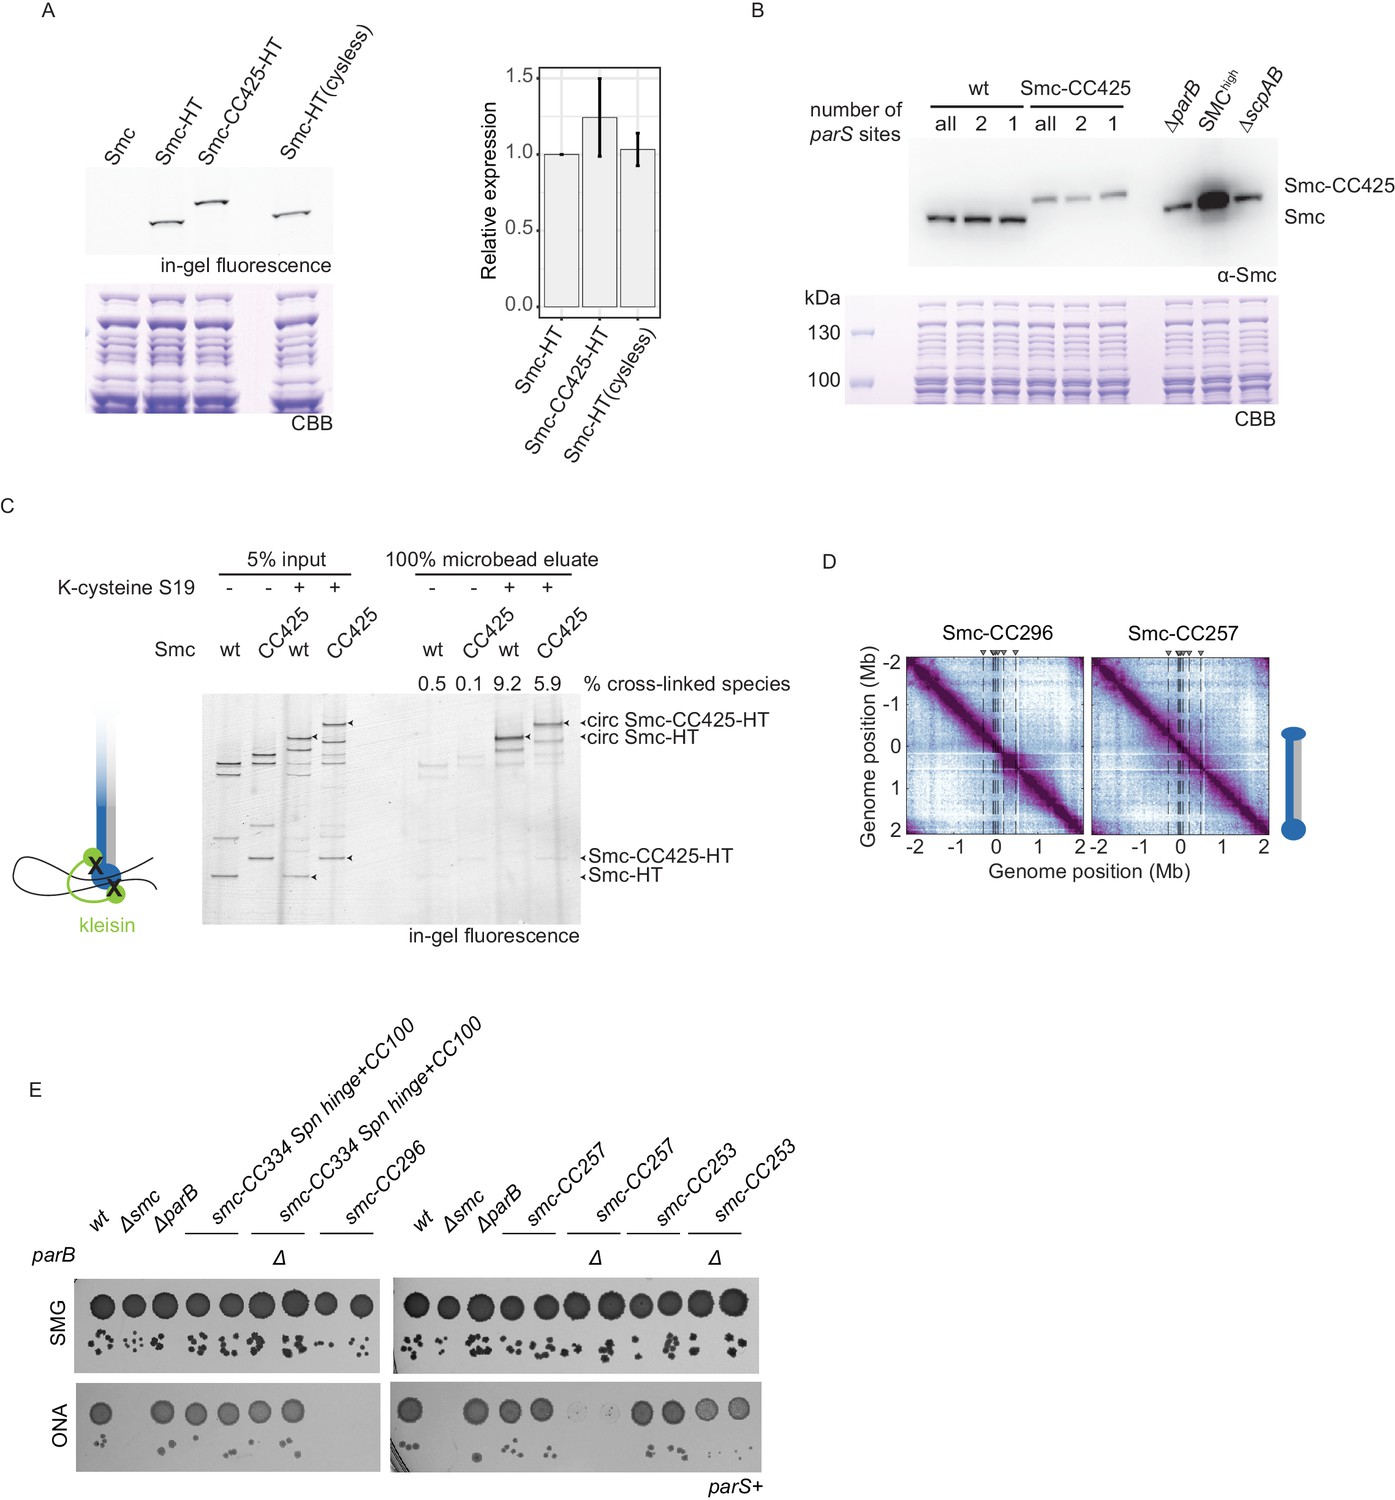
(A) Cellular expression levels of HaloTagged (‘HT’) versions of wild-type and Smc-CC425. Exemplary SDS-PAGE image obtained by in-gel fluorescence detection (top-left panel) and subsequent Coomassie Brilliant Blue (CBB) staining (bottom-left panel). Quantification of relative expression levels (right panel). Mean and standard deviation obtained from three biological replicates are shown. Smc-HT(cysless) refers to a HT variant in which endogenous cysteines were mutated. (B) Immunoblotting using α-Smc (top panel) serum. Protein extracts from wild-type cells and cells with Smc-CC425 (harboring all, two or a single parS site) were analyzed. Note that apparently reduced levels of Smc-CC425 might be due to poor blotting efficiency of the larger protein or poor recognition of the chimeric protein by the polyclonal Smc antiserum. (C) Chromosome co-entrapment assay for HT versions of wild-type and Smc-CC425 with closed Smc-kleisin interface (S152C, S19C, and R1032C in Smc; E52C and H235C in ScpA) and respective control strains lacking one of the two cysteines in ScpA (S19C). Arrowheads indicate the following species: Smc-HT and Smc-CC425-HT as well as the corresponding fully cross-linked, circular species (‘circ’) of Smc-HT and Smc-CC425-HT. Numbers indicate the relative enrichment of the circular species by chromosome co-entrapment (see Materials and methods) for a representative experiment from three biological replicates. (D) Normalized 3C-seq contact maps for strains harboring Smcs with shortened coiled coils that were non-viable (Smc-CC296) or sick on nutrient-rich medium (Smc-CC257). (E) Spotting assay of strains with modified Smc coiled coil in wild-type background or sensitized background (ΔparB). Prepared as described in Figure 1B. Two independent clones for each tested mutant were spotted. Combining ΔparB with Smc-CC296 was unsuccessful. Spn hinge + CC100, Streptococcus pneumoniae hinge and 100 amino acids of hinge-proximal coiled coil.
Figure 1—figure supplement 2
Characterization of Smc variants, #2.
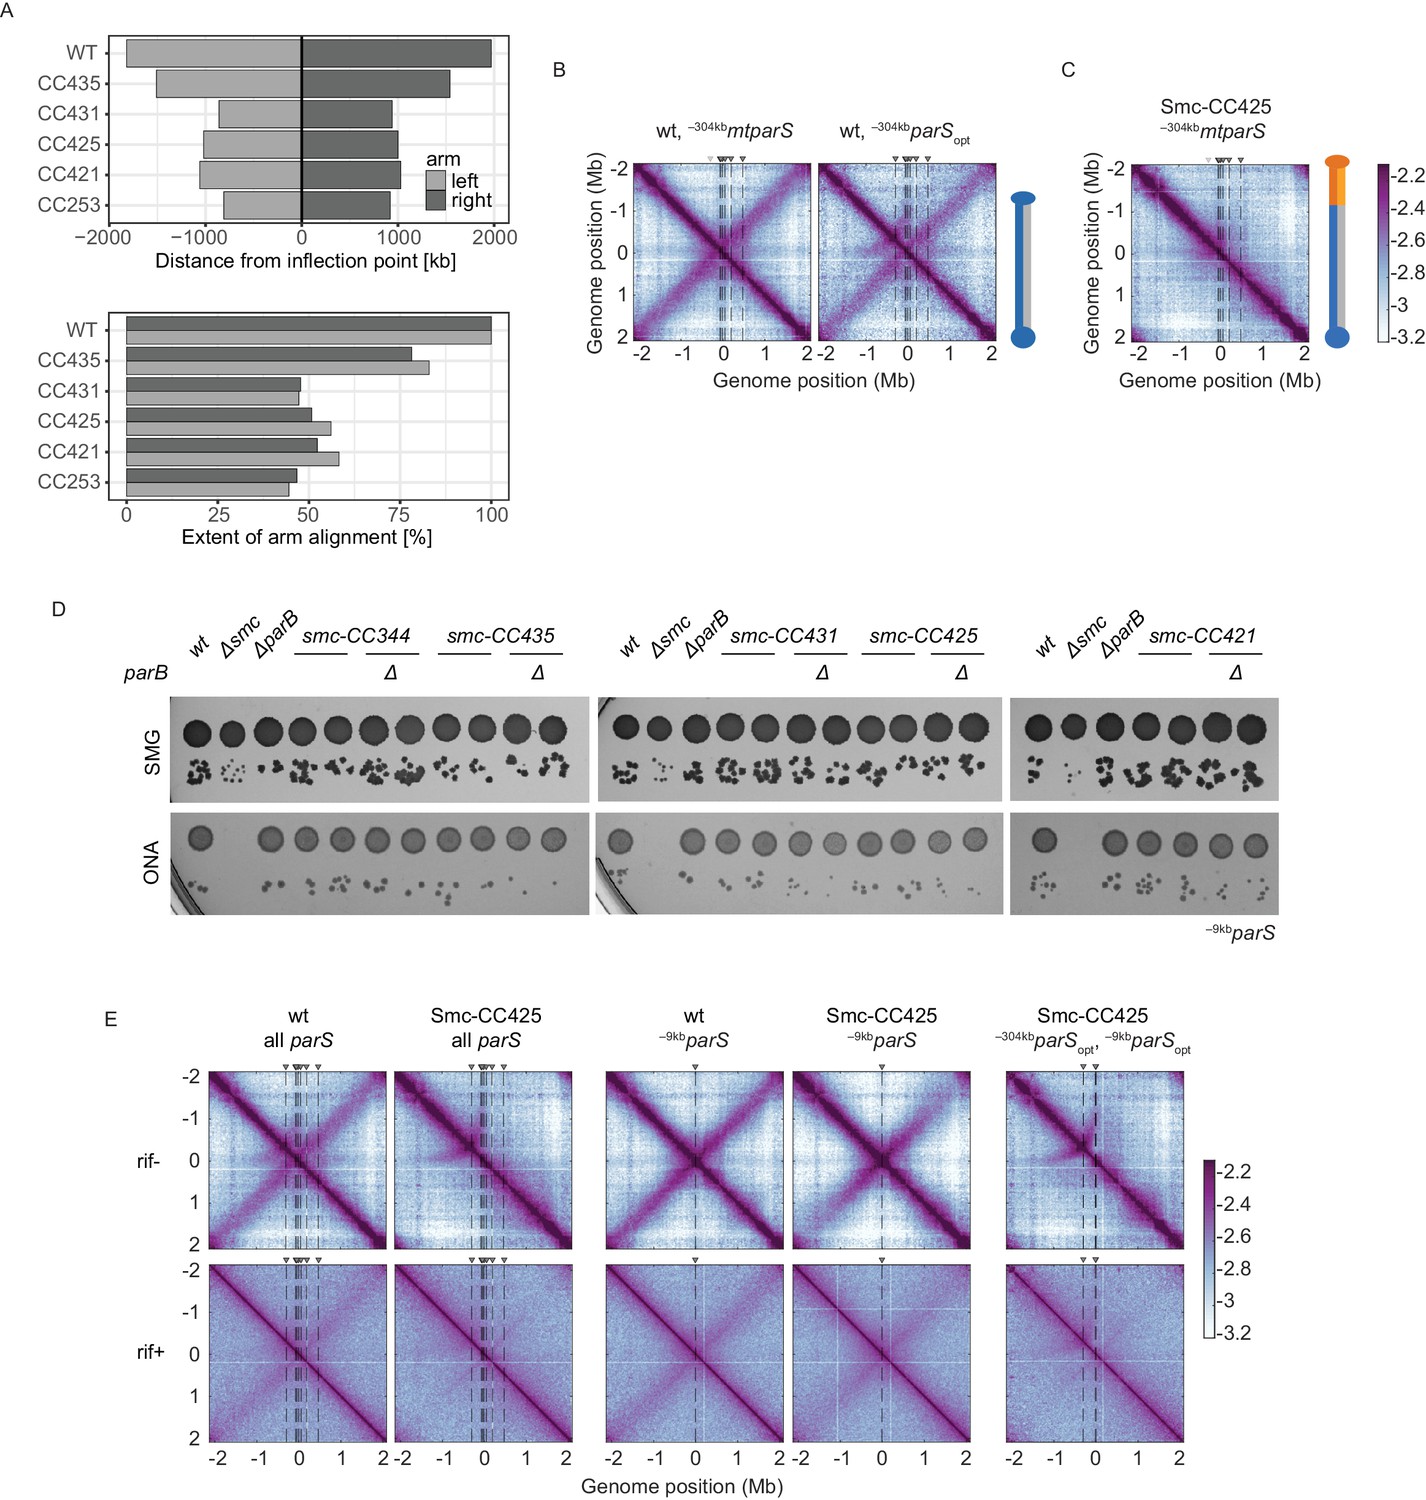
(A) Quantification of the extent of chromosome arm alignment for 3C-seq maps presented in Figure 1C. Plot reporting the extent of juxtaposed arm regions for the right and the left chromosome arm starting from the origin (top panel). Extent of arm alignment relative to wild type (bottom panel). (B) Normalized 3C-seq contact maps for strains with mutated –304kbparS (parS-334) (left panel) or its sequence substituted for the parSopt sequence (parS-359) (right panel). (C) Normalized 3C-seq contact maps for strains with inactivated parS-334 and Smc-CC425. (D) Spotting assay of strains with elongated Smc coiled coil in a genetic background with a single –9kbparSopt (parS-359) site with or without parB. Prepared as described in Figure 1B. Two clones for each tested mutant were tested. (E) RNAP inhibition experiment using rifampicin. Normalized 3C-seq contact maps for strains with all, one, or two parS sites in wild-type Smc or Smc-CC425 backgrounds (mock treatment controls ‘rif-’, top panels) (‘rif+’, bottom panels).
Figure 1—figure supplement 3
Recruitment efficiency of various parS sequences.
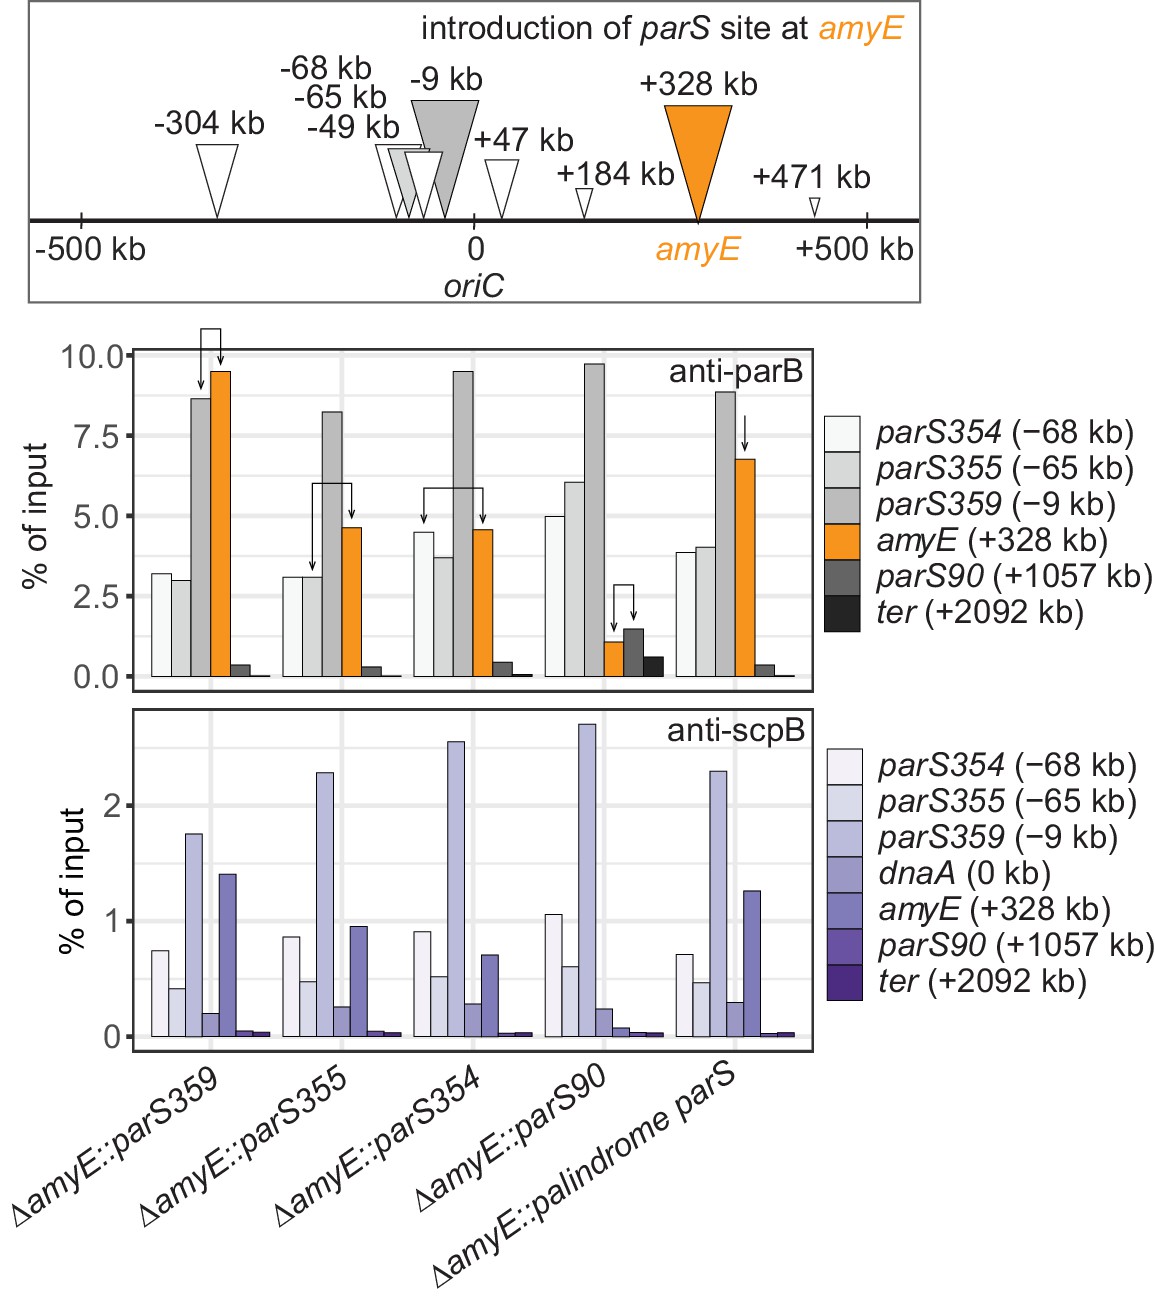
Scheme depicting the experimental setup (top panel): different wild-type parS sequences as well as a perfect palindromic parS sequence were engineered at amyE locus (in orange colors) in an otherwise wild-type background. Chromatin-immunoprecipitation coupled to quantitative PCR (ChIP-qPCR) using α-ParB (middle panel) and α-ScpB serum (bottom panel). Recruitment of ParB to identical parS sequences at the endogenous site (gray colors) and engineered site (in orange colors) are indicated with arrows. The enrichment observed by ectopic integration at amyE was similar to one seen at the respective endogenous loci, demonstrating that the parS sequence determines the efficiency of ParB recruitment largely irrespective of the genomic neighborhood. The strength of natural parS sequences appears to decrease with distance from the replication origin (Figure 1A) as also observed by ChIP-seq (Minnen et al., 2016) and ChIP-chip (Breier and Grossman, 2007).
Figure 2 with 1 supplement

Modified Smc proteins hyper-accumulate in the replication origin region.
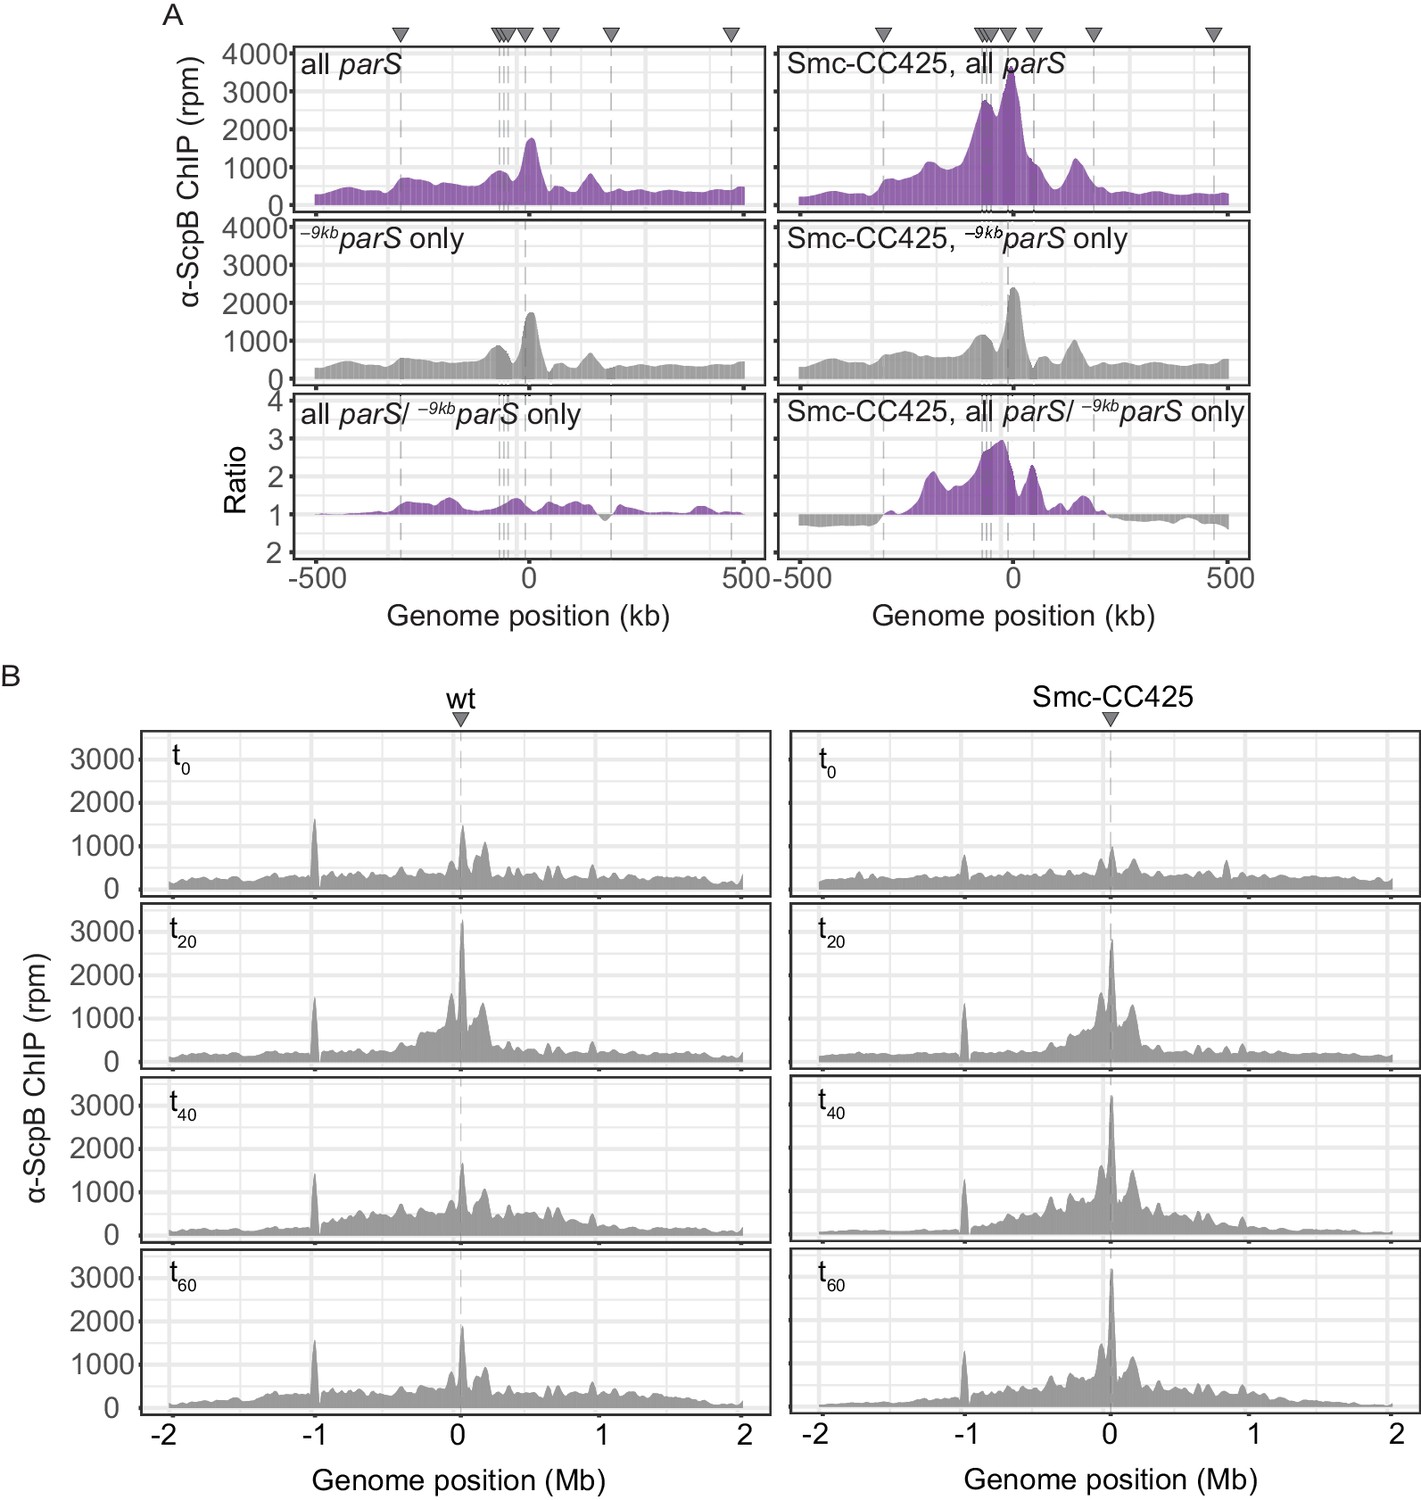
(A) Read count distribution for chromatin immunoprecipitation coupled to deep sequencing (ChIP-seq) using α-ScpB serum. Left panel: strains carrying wild-type Smc with wild-type parS sites (top) or single –9kbparSopt (parS-359) site (bottom). Removal of parS sites results in a slightly reduced enrichment in the origin region and in turn modestly increased signal mainly on the right arm of the chromosome (supposedly due to the presence of the weak +1058kbparS site; parS-90). Right panel: strains carrying Smc with elongated coiled coil (Smc-CC425) with wild-type parS sites (top) or single –9kbparSopt (parS-359) site (bottom). Insets depict corresponding 3C-seq contact maps. All ChIP-seq profiles presented in this study are divided into 1 kb bins and have the replication origin placed in the middle. Dashed lines indicate the position of parS sites. (B) Ratio plots of ChIP-seq read counts for wild-type and elongated Smc (Smc-CC425) shown in (A). For each bin, normalized read counts for single –9kbparSopt were compared with respective wild-type parS values. If the mutant/wild-type ratio was > 1, it was plotted above the genome position axis (in violet colors). If the mutant/wild-type ratio was < 1, the inverse ratio was plotted below the axis (in gray colors). (C) ChIP-seq time-course experiments using α-ScpB serum for strains carrying wild-type (left panel) or elongated Smc (Smc-CC425, right panel). These strains harbor a single loading site, -9kbparSopt (parS-359), and a theophylline-inducible parB gene. Ratios plots of read counts for a given time point (tx) versus t0 are shown. For each bin, normalized read counts were compared with respective t0 value and the higher value was divided by the lower. If the ratio tx/t0 was > 1, it was plotted above the genome position axis (in violet colors). If the ratio t0/tx was > 1, the inverse ratio was plotted below the axis (in gray colors). (D) Normalized 3C-seq contact maps for the time course experiments with strains carrying wild-type (top panel) or elongated Smc (Smc-CC425, bottom panel), corresponding to (C).
Figure 2—figure supplement 1
Enrichment of Smc and Smc-CC425 in the replication origin region.
(A) Closeup view of ChIP-seq profiles shown in Figure 1A, B. Lines indicate parS site positions. (B) Read count distribution for chromatin immunoprecipitation coupled to deep sequencing (ChIP-seq) using α-ScpB serum for the ratio plots presented in Figure 2C. Left panel: strain carrying wild-type Smc. Right panel: strain carrying Smc-CC425. Both strains harbor a single loading site, -9kbparSopt (parS-359), and a parB gene under the control of a theophylline-riboswitch. Triangles indicate positions of parS sites. Dashed lines denote the presence of a parS site in a given strain.
Figure 3 with 1 supplement
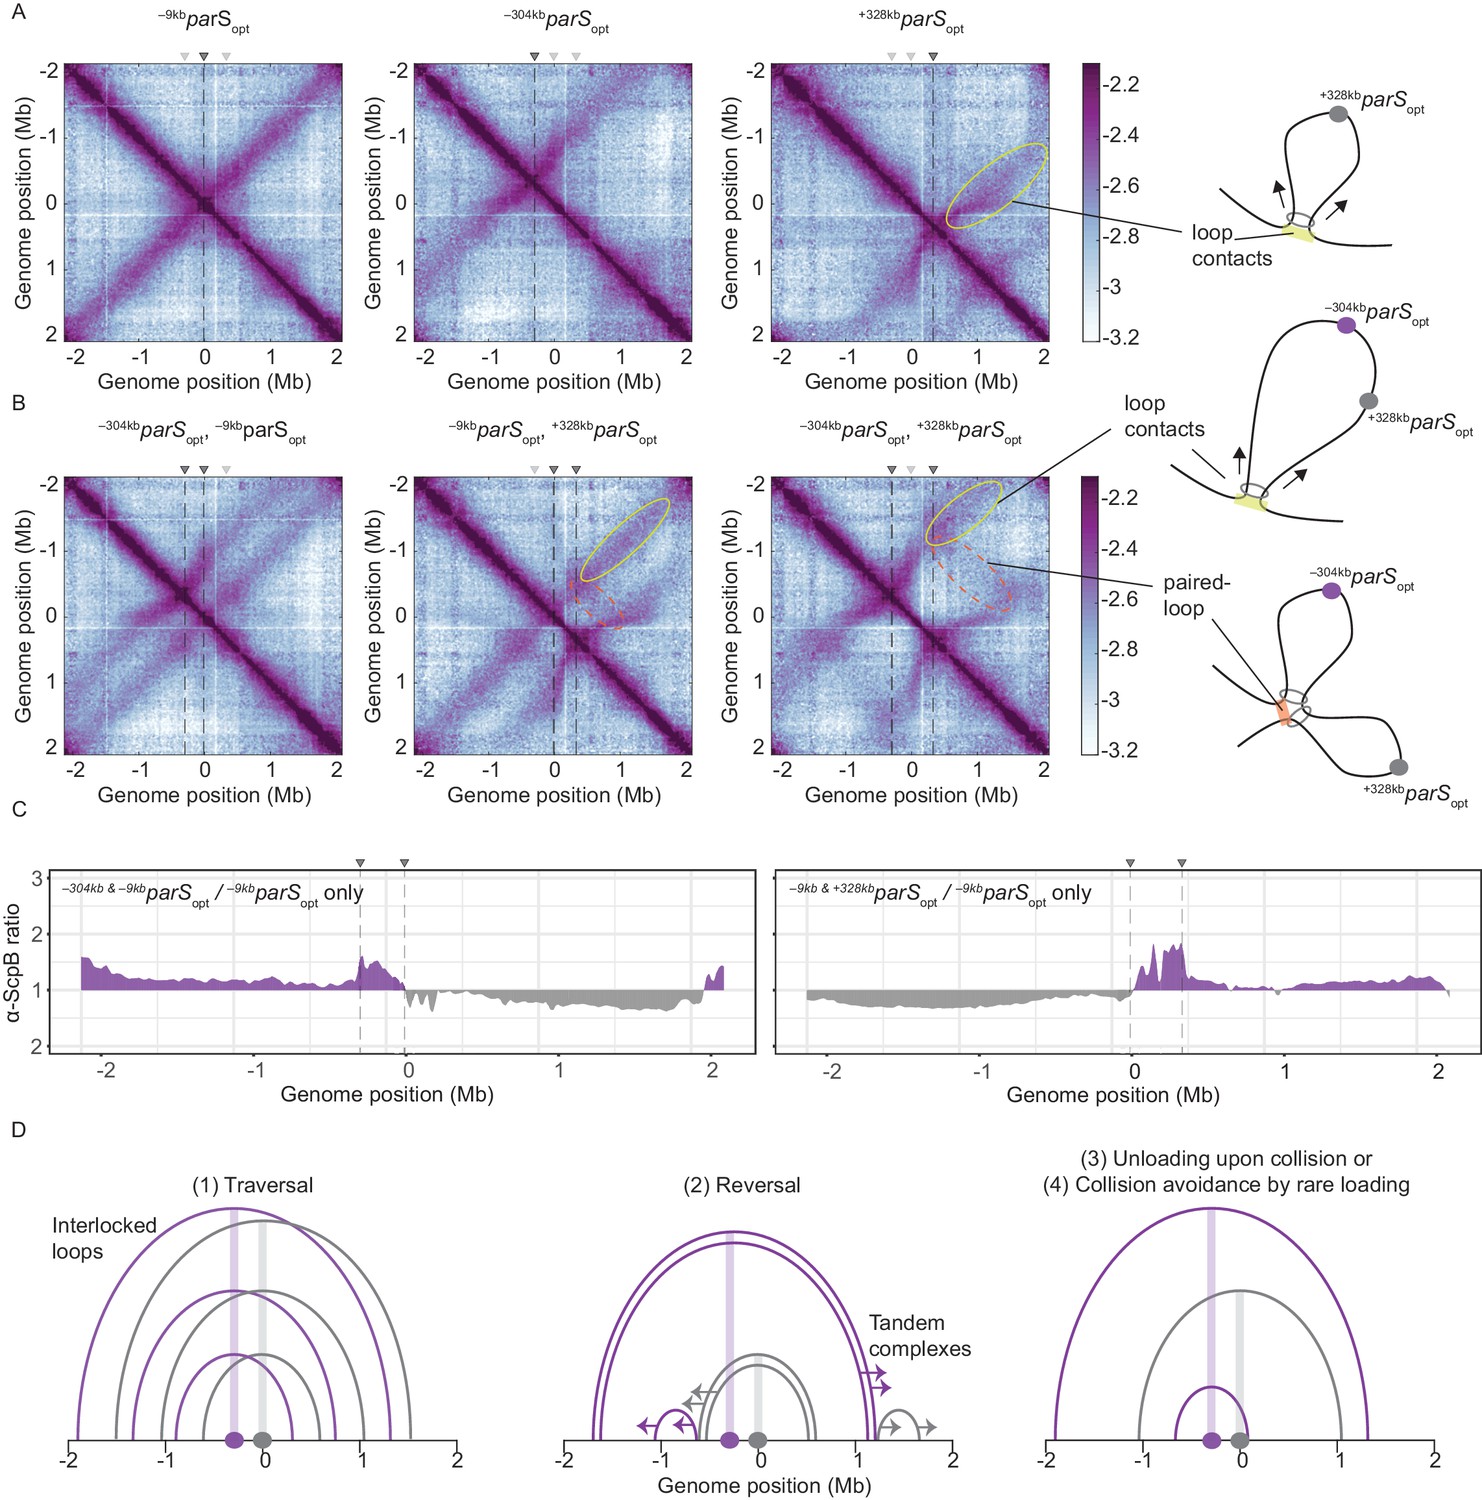
Overlapping chromosome arm alignment patterns for wild-type Smc.
(A) Normalized 3C-seq contact maps for strains with a single parSopt site at −9 kb, −304 kb, or +328 kb. Dark gray triangles above the contact maps indicate the presence of active parS sites. Light gray triangles for reference are parS sites absent in the given experiment. Schemes depict a ‘loop contact’ that emerges by bidirectional translocation of a Smc unit from a single loading site (yellow), here +328kbparSopt. (B) Normalized 3C-seq contact maps for strains with two parSopt sites spaced by ~300 kb (left and middle) or ~600 kb (right). Schemes interpreting interactions in the contact maps: loop contacts (in yellow colors) and ‘paired-loop contacts’ that we presume to emerge by collision of two convergently translocating Smc units loaded at opposite parS sites (in orange colors). (C) Ratio plots for ChIP-seq read counts for a strain with two parS sites (left panel: –304kbparSopt and –9kbparSopt; right panel: –9kbparSopt and +328kbparSopt) and a control strain with a single parS site (–9kbparSopt). Representation as in Figure 2B. (D) Schemes depicting possible scenarios for long-distance contacts emerging by bidirectional Smc translocation with collision avoidance and collision resolution: Smc traversal (1), reversal (2), unloading upon collision (3), or low Smc flux (4).
Figure 3—figure supplement 1
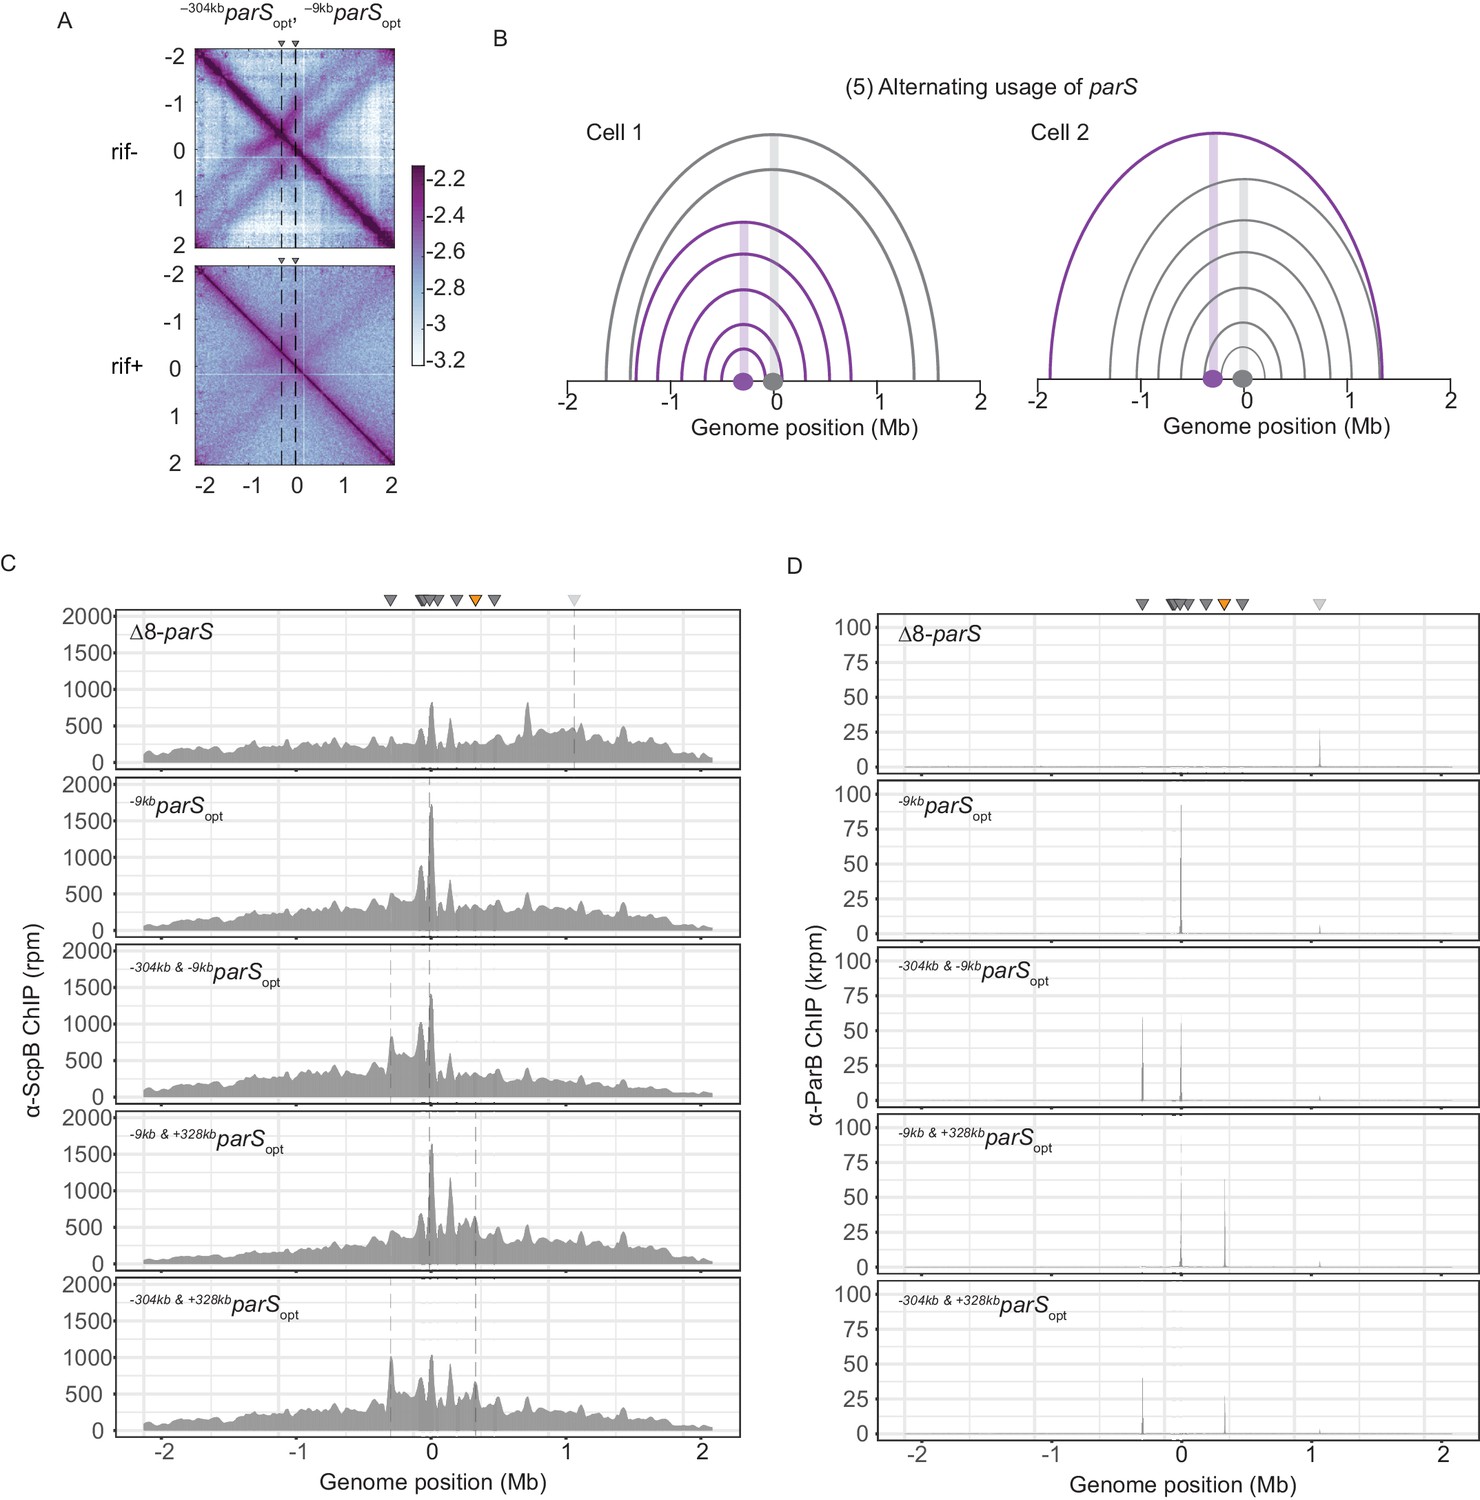
Wild-type Smc protein generates overlapping chromosome folding patterns.
(A) RNAP inhibition experiment using rifampicin. Normalized 3C-seq contact maps for strains with two parSopt sites spaced by ~300 kb (mock treatment control ‘rif-’, top panel) (rif treatment ‘rif+’, bottom panel). (B) Schemes depicting possible scenario for collision avoidance and collision resolution: exclusive usage of a single parS site by SMC complexes as a consequence of temporary inactivation of remaining parS sites. (C) Read count distribution for chromatin immunoprecipitation coupled to deep sequencing (ChIP-seq) using α-ScpB serum for a strain with eight parS sites deleted, single parSopt at −9 kb, two parS sites at −304 kb and −9 kb, −9 kb and +328 kb or −304 kb and +328 kb. Represented as in Figure 2—figure supplement 1B. (D) Read count distribution for chromatin immunoprecipitation coupled to deep sequencing (ChIP-seq) using α-ParB serum as in (C).
Figure 4 with 1 supplement
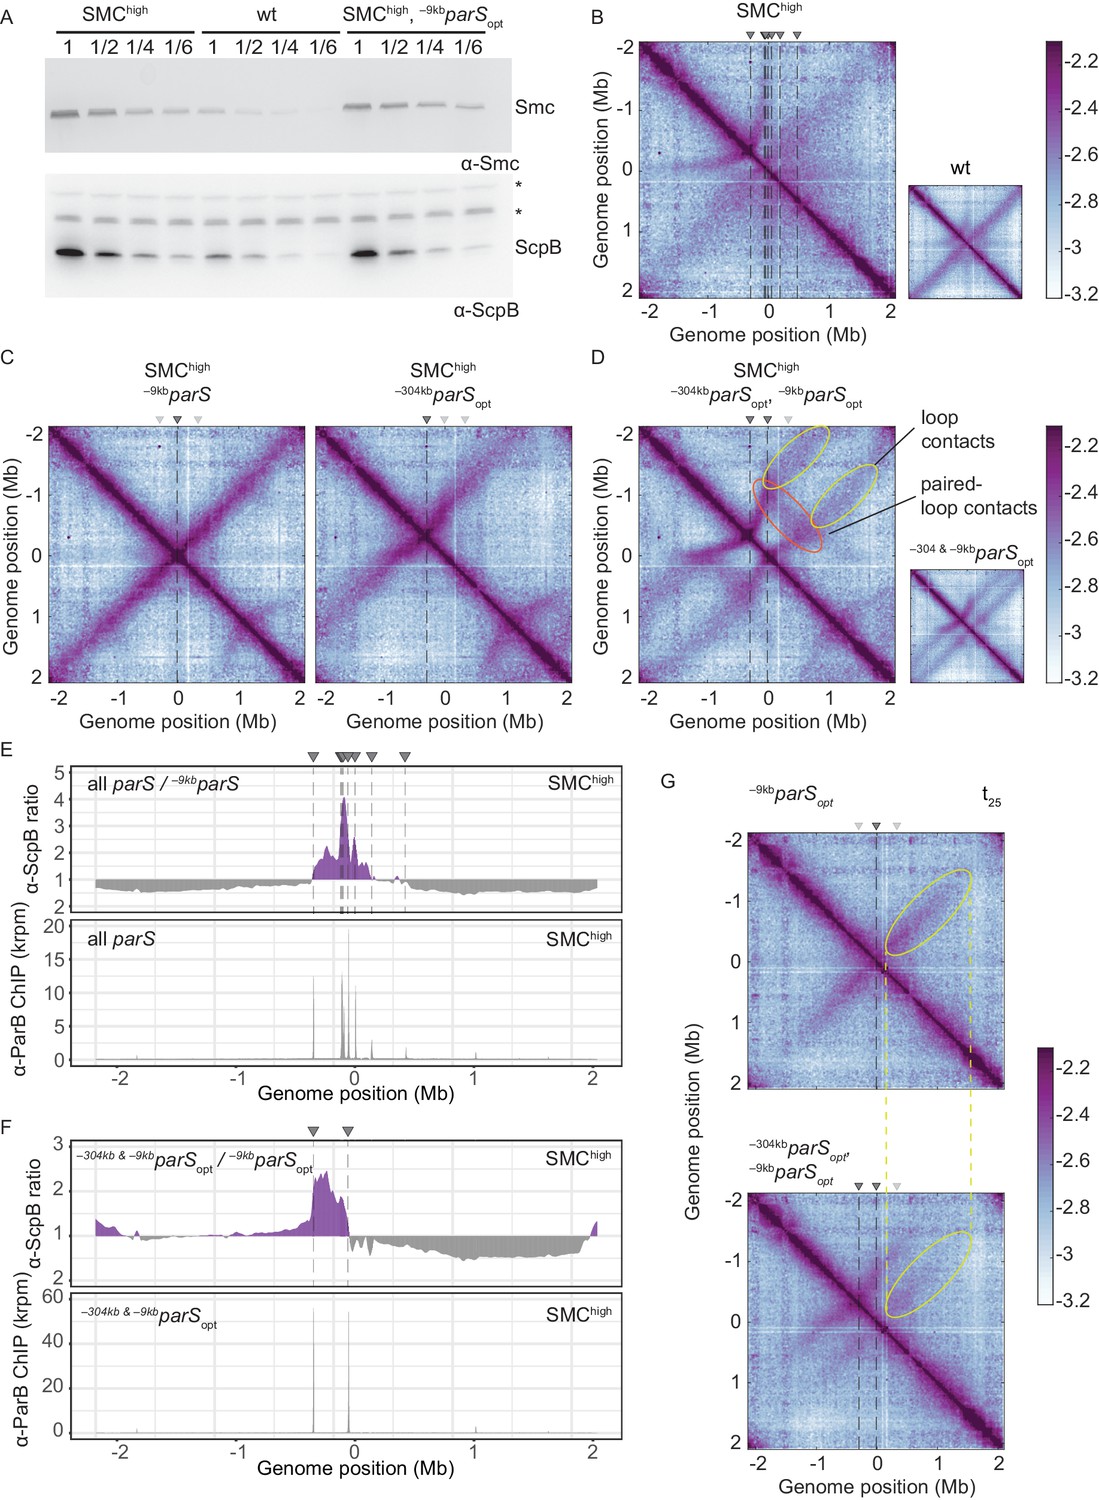
Increasing the cellular pool of Smc hampers chromosome organization.
(A) Immunoblotting using α-Smc (top panel) and α-ScpB serum (bottom panel). SMChigh denotes strains with extra genes for Smc-ScpAB. Protein extracts of wild-type or SMChigh strains (harboring all parS sites or single parS site) were serially diluted with extracts from Δsmc or ΔscpB strains as indicated (see Materials and methods). * indicates unspecific bands generated by the α-ScpB serum. (B) Normalized 3C-seq contact map for SMChigh strain with all parS sites present. Inset shows 3C-seq contact map of a strain with wild-type protein levels (also displayed in Figure 1C) for direct comparison. (C) Normalized 3C-seq contact maps for SMChigh strains with parSopt at −9 kb only or at −304 kb only. (D) Normalized 3C-seq contact map for SMChigh strain with parSopt at positions: −9 kb and −304 kb. As in (B), with inset displaying respective control strain with normal Smc expression levels (also shown in Figure 3B). (E) Ratio plots for ChIP-seq read counts comparing SMChigh strains with all parS sites and a single parS site (–9kbparSopt). Representation as in Figure 2B (top panel). Read count for α-ParB ChIP-seq in SMChigh strain (bottom panel). (F) As in (E) involving a SMChigh strain with two parS sites (–304kbparSopt and –9kbparSopt) instead of all parS sites. (G) Normalized 3C-seq contact maps for time point t25 after IPTG-induced ParB expression with a single parSopt site (top panel) or two parSopt sites (at −9 kb and −304 kb) (bottom panel). Ellipsoids (in yellow colors) mark the position of contacts stemming from loop extrusion originating at –9kbparSopt.
Figure 4—figure supplement 1
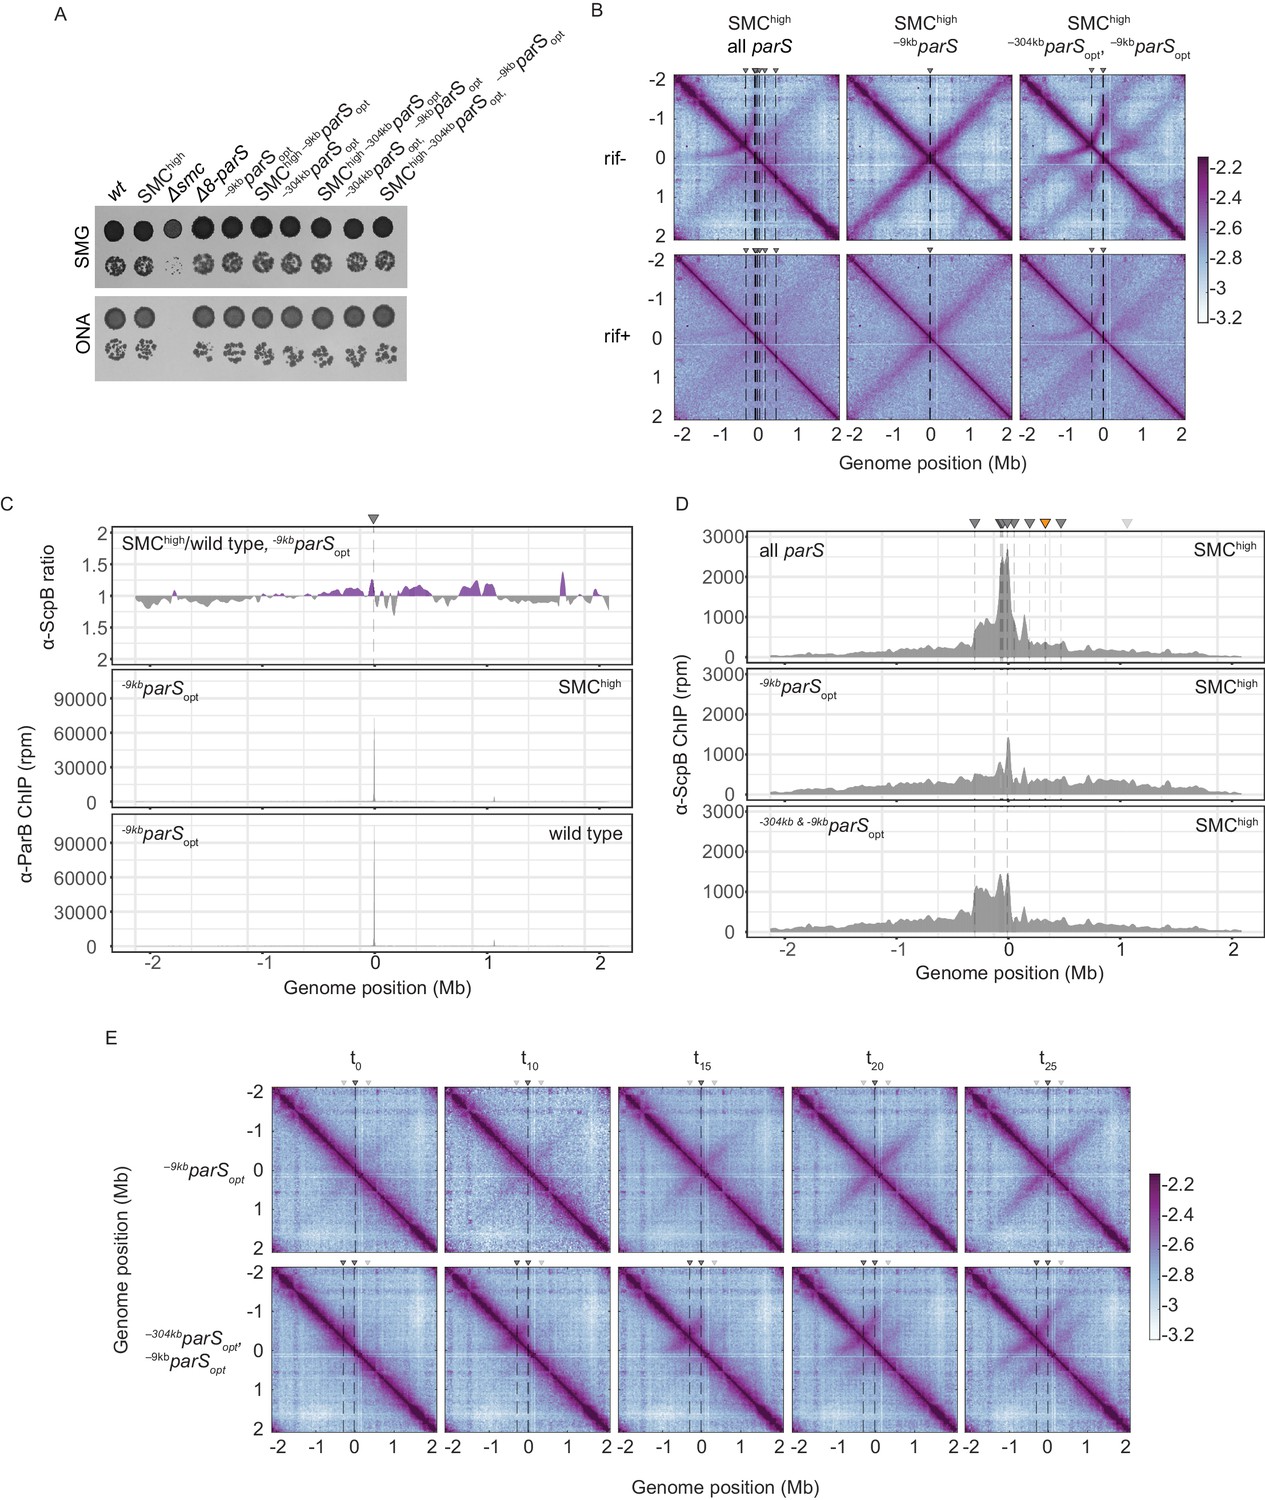
Synchronized loading of SMC hampers chromosome organization.
(A) Spotting assay comparing strains with extra Smc-ScpAB genes to wild-type strains with normal or altered parS site distribution. Prepared as described in Figure 1B. (B) RNAP inhibition experiment using rifampicin. Normalized 3C-seq contact maps for SMChigh strains with all, single –9kbparSopt, or two parSopt sites spaced by ~300 kb (mock treatment controls ‘rif-’, top panels) (rif treatment, ‘rif+’, bottom panels). (C) Ratio plots for ChIP-seq read counts comparing SMChigh strain and wild-type levels of Smc with a single parS site (–9kbparSopt). Representation as in Figure 2B (top panel). Read count for α-ParB ChIP-seq in the SMChigh and wild-type Smc strains (middle and bottom panels, respectively). (D) α-ScpB ChIP-seq read counts for SMChigh strains with all parS sites present (top panel), single parSopt at position −9 kb (middle panel), and two parS sites at positions −304 kb and −9 kb (bottom panel). Represented as in Figure 3—figure supplement 1C. (E) Normalized 3C-seq contact maps for time-course experiments for strains with a single loading site parSopt (at −9 kb, top panels) or two parSopt (at −304 kb and −9 kb, bottom panels) and IPTG-inducible ParB.
Tables
Table 1
List of strains and genotypes used in the study.
| BSG | Genotype | Origin |
|---|---|---|
| 1002 | 1A700, smc ftsY::ermB, trpC2 | The Gruber Laboratory |
| 1007 | 1A700, Δsmc ftsY::ermB, trpC2 | The Gruber Laboratory |
| 1018 | 1A700, smc(Streptococcus pneumoniae hinge) ftsY::ermB, trpC2 | The Gruber Laboratory |
| 1050 | 1A700, ΔparB::kanR, trpC2 | The Gruber Laboratory |
| 1471 | 1A700, smc(E1118Q) ftsY::ermB, ΔamyE::parS-359 + tetO qPCR primer seq::cat, trpC2 | This study |
| 1489 | 1A700, specR::scpA ΔscpB, trpC2 | The Gruber Laboratory |
| 1541 | 1A700, smc(E1118Q) ftsY::ermB, ΔamyE::parS-355 + tetO qPCR primer seq::cat, trpC2 | This study |
| 1542 | 1A700, smc(E1118Q) ftsY::ermB, ΔamyE::parS-354 + tetO qPCR primer seq::cat, trpC2 | This study |
| 1543 | 1A700, smc(E1118Q) ftsY::ermB, ΔamyE::parS-90 + tetO qPCR primer seq::cat, trpC2 | This study |
| 1544 | 1A700, smc(E1118Q) ftsY::ermB, ΔamyE::parS-optimal + tetO qPCR primer seq::cat, trpC2 | This study |
| 1711 | 1A700, specR::scpA ΔscpB, trpC2 | The Gruber Laboratory |
| 2090 | 1A700, smc(1-438, 487-684, 733-1186) ftsY::ermB, trpC2 | Bürmann et al., 2017 |
| 2092 | 1A700, smc(1-399, 487-684, 772-1186) ftsY::ermB, trpC2 | Bürmann et al., 2017 |
| 2093 | 1A700, smc(1-395, 487-684, 776-1186) ftsY::ermB, trpC2 | Bürmann et al., 2017 |
| 2210 | 1A700, smc-HaloTag (C61V, C262A) ftsY::tetL ylqB, trpC2 | The Gruber Laboratory |
| 2352 | 1A700, smc(1-395, SpnSmc(398-768), 776-1186) ftsY::ermB, trpC2 | Bürmann et al., 2017 |
| 2934 | PY79: Δ7-parS, parAB::kanR | This study |
| 3026 | PY79: Δ7-parS(parS359+), ΔparB::kanR, amyE::(PhbsB short 5'UTR-theo E+ -parB (mtparS))::CAT | This study |
| 3216 | PY79: Δ7-parS(parS359+), ΔparB::kanR, smc(1–476 SpnSmc(398-768) 695-1186) ftsY::ermB, amyE::(PhbsB short 5'UTR-theo E+ -parB (mtparS))::CAT | This study |
| 3425 | 1A700, smc(1-488), SpnSmc(398-768), smc(682-1186) ftsY::ermB, trpC2 | This study |
| 3426 | 1A700, smc(1-482), SpnSmc(398-768), smc(689-1186) ftsY::ermB, trpC2 | This study |
| 3427 | 1A700, smc(1-476), SpnSmc(398-768), smc(695-1186) ftsY::ermB, trpC2 | This study |
| 3428 | 1A700, smc(1-472), SpnSmc(398-768), smc(699-1186) ftsY::ermB, trpC2 | This study |
| 3429 | 1A700, ΔparB::kanR, smc(1-488), SpnSmc(398-768), smc(682-1186) ftsY::ermB, trpC2 | This study |
| 3430 | 1A700, ΔparB::kanR, smc(1-482), SpnSmc(398-768), smc(689-1186) ftsY::ermB, trpC2 | This study |
| 3431 | 1A700, ΔparB::kanR, smc(1-476), SpnSmc(398-768), smc(695-1186) ftsY::ermB, trpC2 | This study |
| 3432 | 1A700, ΔparB::kanR, smc(1-482), SpnSmc(398-768), smc(689-1186) ftsY::ermB, trpC2 | This study |
| 3636 | PY79: Δ7-parS, parAB::specR, smc(1-476 SpnSmc(398-768) 695-1186) ftsY::ermB | This study |
| 3674 | 1A700, Δ1-parS(mtparS334) | This study |
| 3770 | PY79: smc::tet, parAB::kanR | This study |
| 3785 | 1A700, ΔparB::kanR, smc(1-395, SpnSmc(398-768), 776-1186) ftsY::ermB, trpC2 | This study |
| 3786 | 1A700, ΔparB::kanR, smc(1-399, 487-684, 772-1186) ftsY::ermB, trpC2 | This study |
| 3787 | 1A700, ΔparB::kanR, smc(1-395, 487-684, 776-1186) ftsY::ermB, trpC2 | This study |
| 3790 | 1A700, Δ7-parS(parS359+), smc::specR | This study |
| 3791 | 1A700, mtparS334 to parS359 | This study |
| 3798 | 1A700, Δ1-parS(mtparS334), smc(1-476), SpnSmc(398-768), smc(695-1186) ftsY::ermB | This study |
| 3801 | 1A700, Δ7-parS, smc(1-488), SpnSmc(398-768), smc(682-1186) ftsY::ermB | This study |
| 3802 | 1A700, Δ7-parS, smc(1-482), SpnSmc(398-768), smc(689-1186) ftsY::ermB | This study |
| 3803 | 1A700, Δ7-parS, smc(1-476), SpnSmc(398-768), smc(695-1186) ftsY::ermB | This study |
| 3804 | 1A700, Δ7-parS, smc(1-472), SpnSmc(398-768), smc(699-1186) ftsY::ermB | This study |
| 3805 | 1A700, Δ6-parS (mtparS334 to parS359), smc::ermB | This study |
| 3815 | 1A700, Δ8-parS, parAB(mtparS359)::kanR, smc::specR | This study |
| 3840 | 1A700, Δ7-parS(parS359+), ΔparB::kanR, smc::specR | This study |
| 3841 | 1A700, Δ7-parS(parS359+), ΔparB::kanR, smc(1-488), SpnSmc(398-768), smc(682-1186) ftsY::ermB | This study |
| 3842 | 1A700, Δ7-parS(parS359+), ΔparB::kanR, smc(1-482), SpnSmc(398-768), smc(689-1186) ftsY::ermB | This study |
| 3843 | 1A700, Δ7-parS(parS359+), ΔparB::kanR, smc(1-476), SpnSmc(398-768), smc(695-1186) ftsY::ermB | This study |
| 3844 | 1A700, Δ7-parS(parS359+), ΔparB::kanR, smc(1-472), SpnSmc(398-768), smc(699-1186) ftsY::ermB | This study |
| 3863 | PY79: smc(1-476), SpnSmc(398-768), smc(695-1186) ftsY::ermB, parAB::kanR | This study |
| 3878 | 1A700, Δ6-parS(parS359+, parS334->359+), smc(1-476), SpnSmc(398-768), smc(695-1186) ftsY::tetR | This study |
| 3879 | 1A700, Δ7-parS(parS334->359+), parAB::kanR, smc::ermB | This study |
| 3882 | 1A700, Δ7-parS(parS334->359+), parAB::kanR, smc(1-476), SpnSmc(398-768), smc(695-1186) ftsY::specR | This study |
| 3932 | 1A700, Δ7-parS(parS359+), smc(1-395, 487-684, 776-1186) ftsY::ermB | This study |
| 4083 | 1A700, Δ6-parS(parS359+), smc::specR, ΔamyE::parS-359 + tetO qPCR primer seq::cat | This study |
| 4090 | 1A700, Δ7-parS, parAB::kanR, smc::specR, ΔamyE::parS-359 + tetO qPCR primer seq::cat | This study |
| 4091 | 1A700, Δ6-parS(parS334->359+), parAB::kanR, smc::ermB, ΔamyE::parS-359 + tetO qPCR primer seq::cat | This study |
| 4100 | 1A700, ΔamyE::smc::CAT, qoxD-specR::scpAB-ywcE, trpC2 | This study |
| 4137 | 1A700, Δ6-parS (mtparS334 to parS359), smc::ermB, ΔamyE::smc::CAT, qoxD-specR::scpAB-ywcE | This study |
| 4143 | 1A700, Δ7-parS(parS359+), smc::ermB, ΔamyE::smc::CAT, qoxD-specR::scpAB-ywcE | This study |
| 4146 | 1A700, Δ7-parS(parS334->359+), parAB::kanR, smc::ermB, ΔamyE::smc::CAT, qoxD-specR::scpAB-ywcE | This study |
| 4152 | 1A700, Δ7-parS(parS359+), ΔparB::kanR, smc::specR, ΔamyE::(Pspank-optRBS-parB(mtparS)-lacI)::CAT | This study |
| 4427 | 1A700, Δ6-parS (mtparS334 to parS359), ΔparB::kanR, smc::specR, ΔamyE::(Pspank-optRBS-parB(mtparS)-lacI)::CAT | This study |
| 4798 | 1A700, smc(1-476), SpnSmc(398-768), smc(695-1186)-TEV-HaloTag ftsY::ermB, specR::scpA(E52C, H235C), trpC2 | This study |
| 4837 | 1A700, smc(S152C, R1032C)-TEV-HaloTag ftsY::ermB, specR::scpA(E52C, H235C), trpC2 | This study |
| 4838 | 1A700, smc(1-476)(S19C, S152C), SpnSmc(398-768), smc(695-1186)(R1032C)-TEV-HaloTag ftsY::ermB, specR::scpA(E52C, H235C), trpC2 | This study |
| 4867 | 1A700, smc(1-476)(S152C), SpnSmc(398-768), smc(695-1186)(R1032C)-TEV-HaloTag, specR::scpA(E52C, H235C), trpC2 | This study |
| 4869 | 1A700, smc(S19C, S152C, R1032C)-TEV-HaloTag ftsY::ermB, specR::scpA(E52C, H235C), trpC2 | This study |
Table 2
List of oligos used for the qPCR.
| Locus | Oligo name1 | Oligo sequence1 | Oligo name2 | Oligo sequence2 |
|---|---|---|---|---|
| parS354 | STG495 | ttgcagctaactgccatttg | STG496 | aaaactgaacaggggtcacg |
| parS355 | STG493 | taattcatcatcgcgctcaa | STG494 | aatgccgattacgagtttgc |
| parS359 | STG097 | aaaaagtgattgcggagcag | STG098 | agaaccgcatctttcacagg |
| parS90 | STI587 | gccattgggcatcagtatg | STI588 | ataagcgacaccttgctcgt |
| dnaA | STG199 | gatcaatcggggaaagtgtg | STG200 | gtagggcctgtggatttgtg |
| amyE | STG220 | aatcgtaatctgggcgtgtc | STG221 | catcatcgctcatccatgtc |
| ter | STG099 | tccatatcctcgctcctacg | STG100 | attctgctgatgtgcaatgg |
Additional files
-
Supplementary file 1
Information about replicates for each relevant figure panel.
- https://cdn.elifesciences.org/articles/65467/elife-65467-supp1-v2.docx
-
Supplementary file 2
List of strains sorted according to relevant figure panels and ordered in the way they are presented.
- https://cdn.elifesciences.org/articles/65467/elife-65467-supp2-v2.docx
-
Supplementary file 3
Details of strain construction.
Key plasmid maps for generating the strains are deposited in Mendeley Data DOI:10.17632/kvjd6nj2bh.2.
- https://cdn.elifesciences.org/articles/65467/elife-65467-supp3-v2.docx
-
Supplementary file 4
Table listing strains for which 3C-seq maps were generated with reference to the figure panels, genotype, and number of valid reads.
- https://cdn.elifesciences.org/articles/65467/elife-65467-supp4-v2.xlsx
-
Transparent reporting form
- https://cdn.elifesciences.org/articles/65467/elife-65467-transrepform-v2.docx
Download links
A two-part list of links to download the article, or parts of the article, in various formats.
Downloads (link to download the article as PDF)
Open citations (links to open the citations from this article in various online reference manager services)
Cite this article (links to download the citations from this article in formats compatible with various reference manager tools)
A low Smc flux avoids collisions and facilitates chromosome organization in Bacillus subtilis
eLife 10:e65467.
https://doi.org/10.7554/eLife.65467


