Archaeal chromatin ‘slinkies’ are inherently dynamic complexes with deflected DNA wrapping pathways
- Department of Biochemistry and Howard Hughes Medical Institute, University of Colorado Boulder, United States
- Department of Physics and Center for the Molecular Study of Condensed Soft Matter, Illinois Institute of Technology, United States
Figures
Figure 1

Comparison of the eukaryotic nucleosome and Arc120, an archaeasome model system containing 120 base pairs of DNA and four histone dimers.
(A) The eukaryotic nucleosome (PDB 1AOI) containing two copies of H3, H4, H2A, and H2B (blue, green, gold, and red, respectively) arranged as H2A-H2B dimers flanking the (H3–H4)2 tetramer and binding 147 base pairs of DNA (gray and light blue). (B) The model Arc120 system, derived from the Arc90 crystal structure (PDB 5T5K), with four HMfB homodimers participating in L1-L1 stacking interactions shown in pink. (C) Enhanced views of both the wild type and G17D mutant interfaces simulated in this study.
Figure 2 with 2 supplements
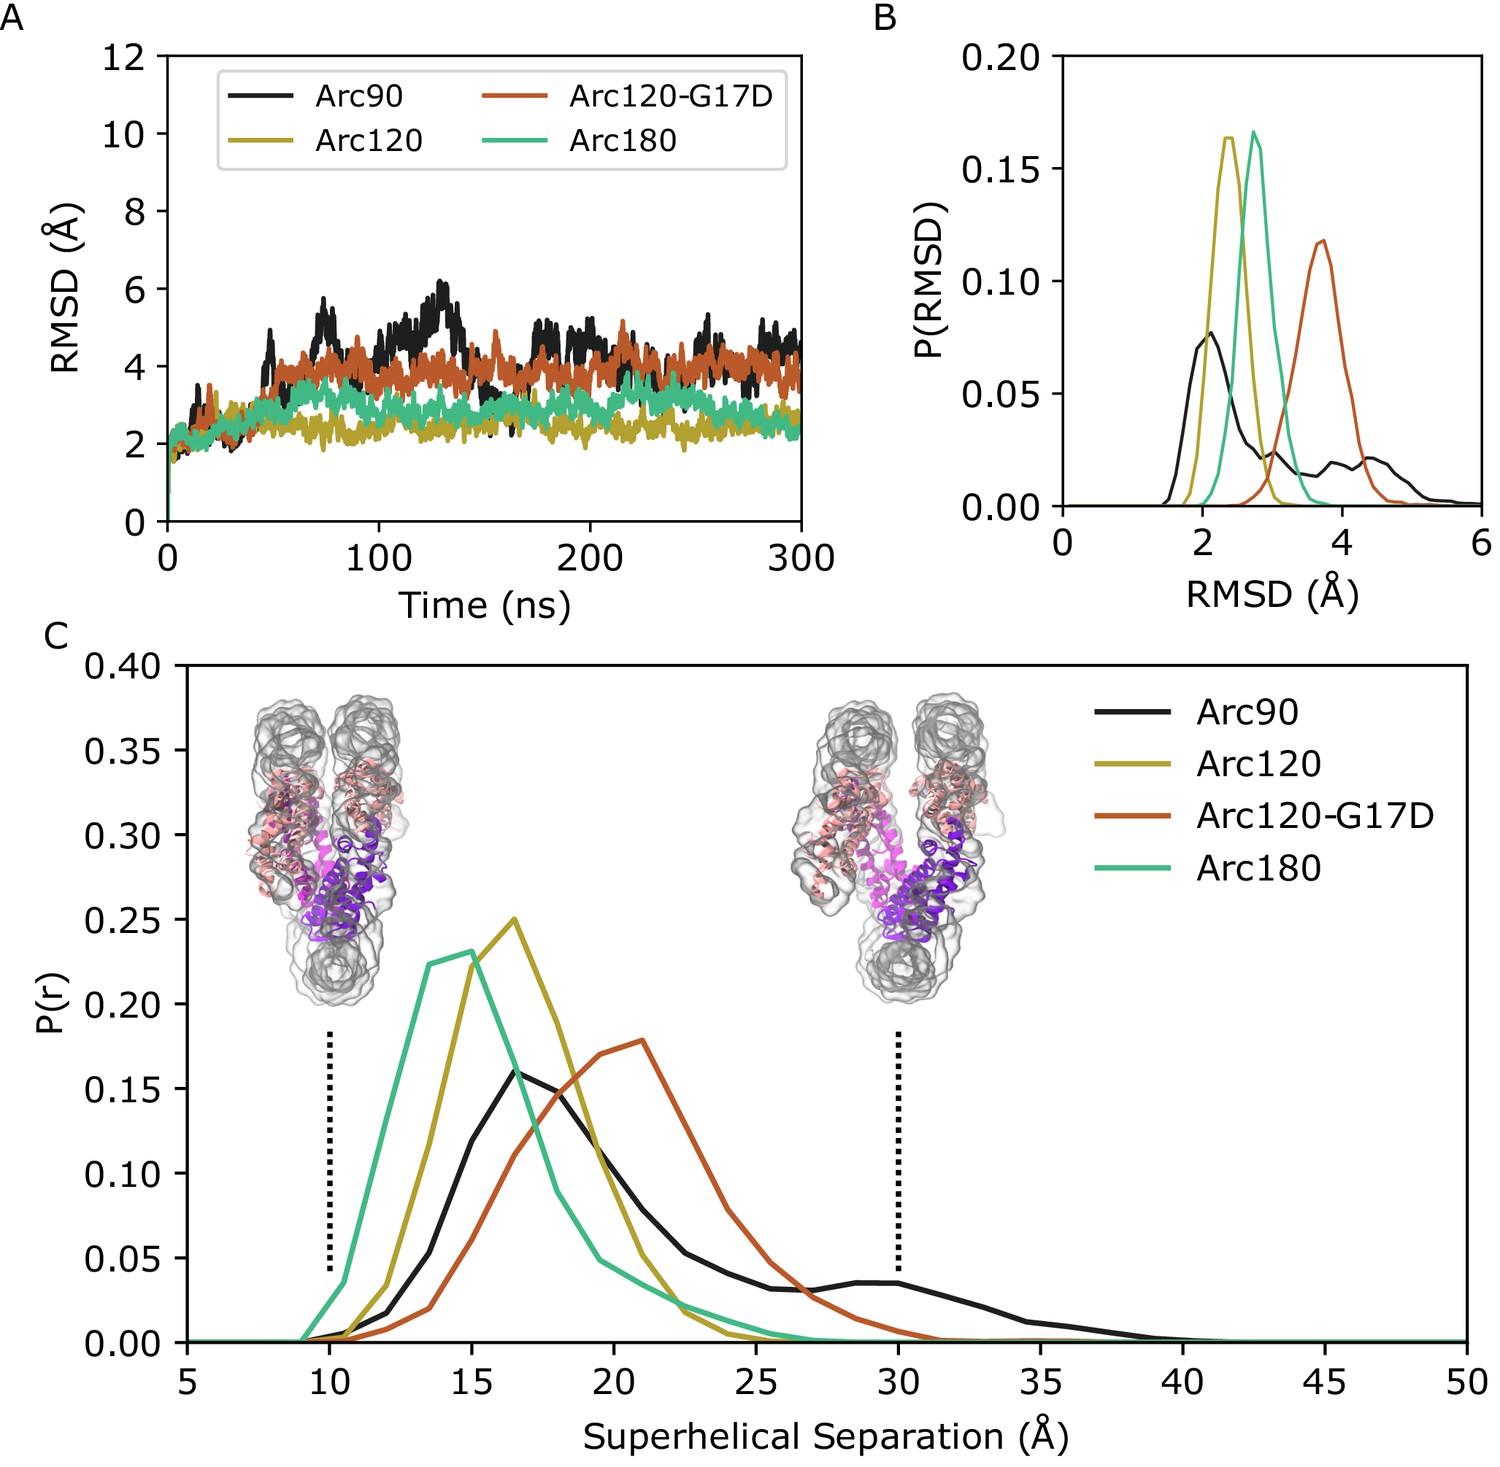
Backbone RMSD for simulated systems compared to their initial conformations.
(A) Representative timeseries from each system demonstrating the largest change in structure from the initial states. The Arc90 trajectory (black) exhibits both a large peak value, as well as wide variances across the timeseries. Arc120 (gold) and Arc180 (teal) systems are significantly less dynamic, and the Arc120-G17D mutant (orange) shows an increased divergence from the initial state when compared to the wild-type Arc120 system. (B) Distribution of RMSD values sampled across all three independent trajectories of each system, post-equilibration (100 ns). Arc90 displays a sampling of two different states, while each of the larger systems are unimodal. (C) Distribution curves for center-of-mass separations between DNA ends and the neighboring superhelical gyre. Representative conformations of fully closed (~10 Å) and open (~30 Å) states identified in the Arc120-G17D simulations are shown. Arc90 simulations (black) show a bimodal distribution between these values, but Arc120 (gold) and Arc180 (teal) systems, containing one and three L1-L1 interactions each, sample unimodal values around the closed state. The Arc120-G17D mutant (orange) samples a unimodal distribution, but indicative of a more open archaeasome than the wild type.
-
Figure 2—source data 1
RMSD timeseries data for replicates of molecular dynamics trajectories for Figure 2A,B.
- https://cdn.elifesciences.org/articles/65587/elife-65587-fig2-data1-v2.csv
Figure 2—figure supplement 1

Root mean-squared fluctuation (RMSF) plots for measured for DNA bases in all four simulated systems.
Average values across the three independent systems are traced by solid lines, and error ranges are calculaged by the standard error of the mean across the three simulations and outlined with shaded regions. RMSF values of the 5’ (top) and 3’ (bottom) leading strands are shown separately. Periodicity in each plot coincides with DNA turns transitioning between solvent- and protein-facing residues.
-
Figure 2—figure supplement 1—source data 1
RMSF vs residue plots for replicate trajectories of simulated systems for Figure 2—figure supplement 1.
- https://cdn.elifesciences.org/articles/65587/elife-65587-fig2-figsupp1-data1-v2.csv
Figure 2—figure supplement 2
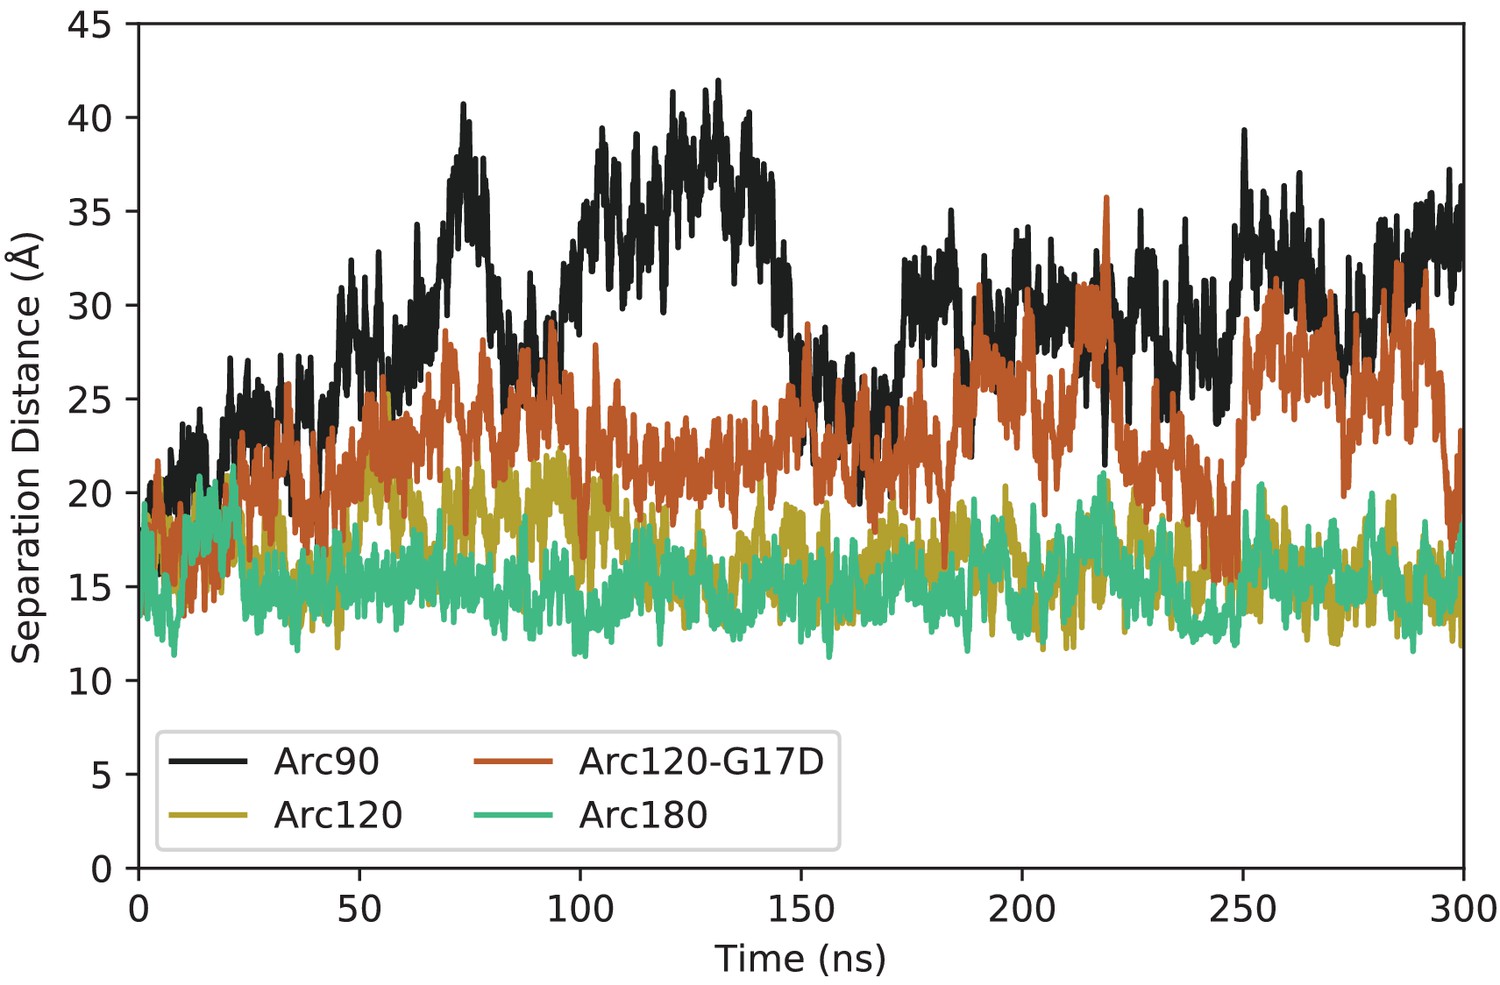
Representative timeseries for DNA end-to-neighbor separation distances from each system.
The Arc90 system (black) shows both the largest maximum separation, as well as the widest variance in values. The next largest separations and fluctuations are observed in the Arc120-G17D mutant (orange), with the Arc120 wild-type (gold) and Arc180 (teal) systems exhibiting the tightest DNA wrapping.
Figure 3
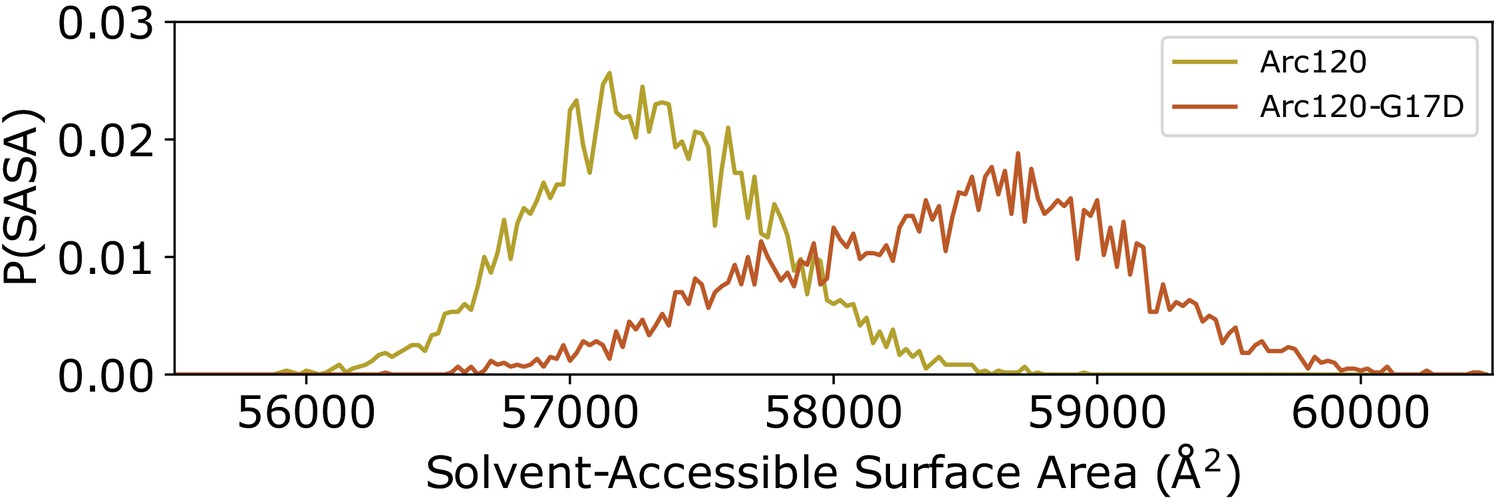
Distribution of solvent-accessible surface areas observed per frame in the Arc120 and Arc120-G17D simulations.
The G17D mutation at the key L1-L1 interaction between stacking dimers significantly increases the surface area by ~1000 Å2.
-
Figure 3—source data 1
Timeseries of solvent-exposed surface area in Arc120 and Arc120-G17D simulations for Figure 3.
- https://cdn.elifesciences.org/articles/65587/elife-65587-fig3-data1-v2.csv
Figure 4 with 1 supplement

Biophysical characterization of archaeasomes in vitro.
(A) van Holde-Weischet plots of Arc207 (circles) and Nuc147 (squares) samples. While Arc207 has a larger mass than the eukaryotic Nuc147, it sediments more slowly, indicative of increased drag caused by extended particle configurations. (B) Representative de-noised cryoEM micrograph of Arc207 sample. Particles are observed with DNA wrapped in a nucleosome-like pattern, but a significant separation between neighboring DNA turns is observed. (C) Two-dimensional classifications of particles extracted from these micrographs. No tightly wrapped DNA is identified, in agreement with our SV-AUC inferences of an extended Arc207 particle shape in comparison to compact Nuc147.
-
Figure 4—source data 1
van Holde-Weischet data extracted from SV-AUC sedimentation profiles for Figure 4A.
- https://cdn.elifesciences.org/articles/65587/elife-65587-fig4-data1-v2.csv
Figure 4—figure supplement 1
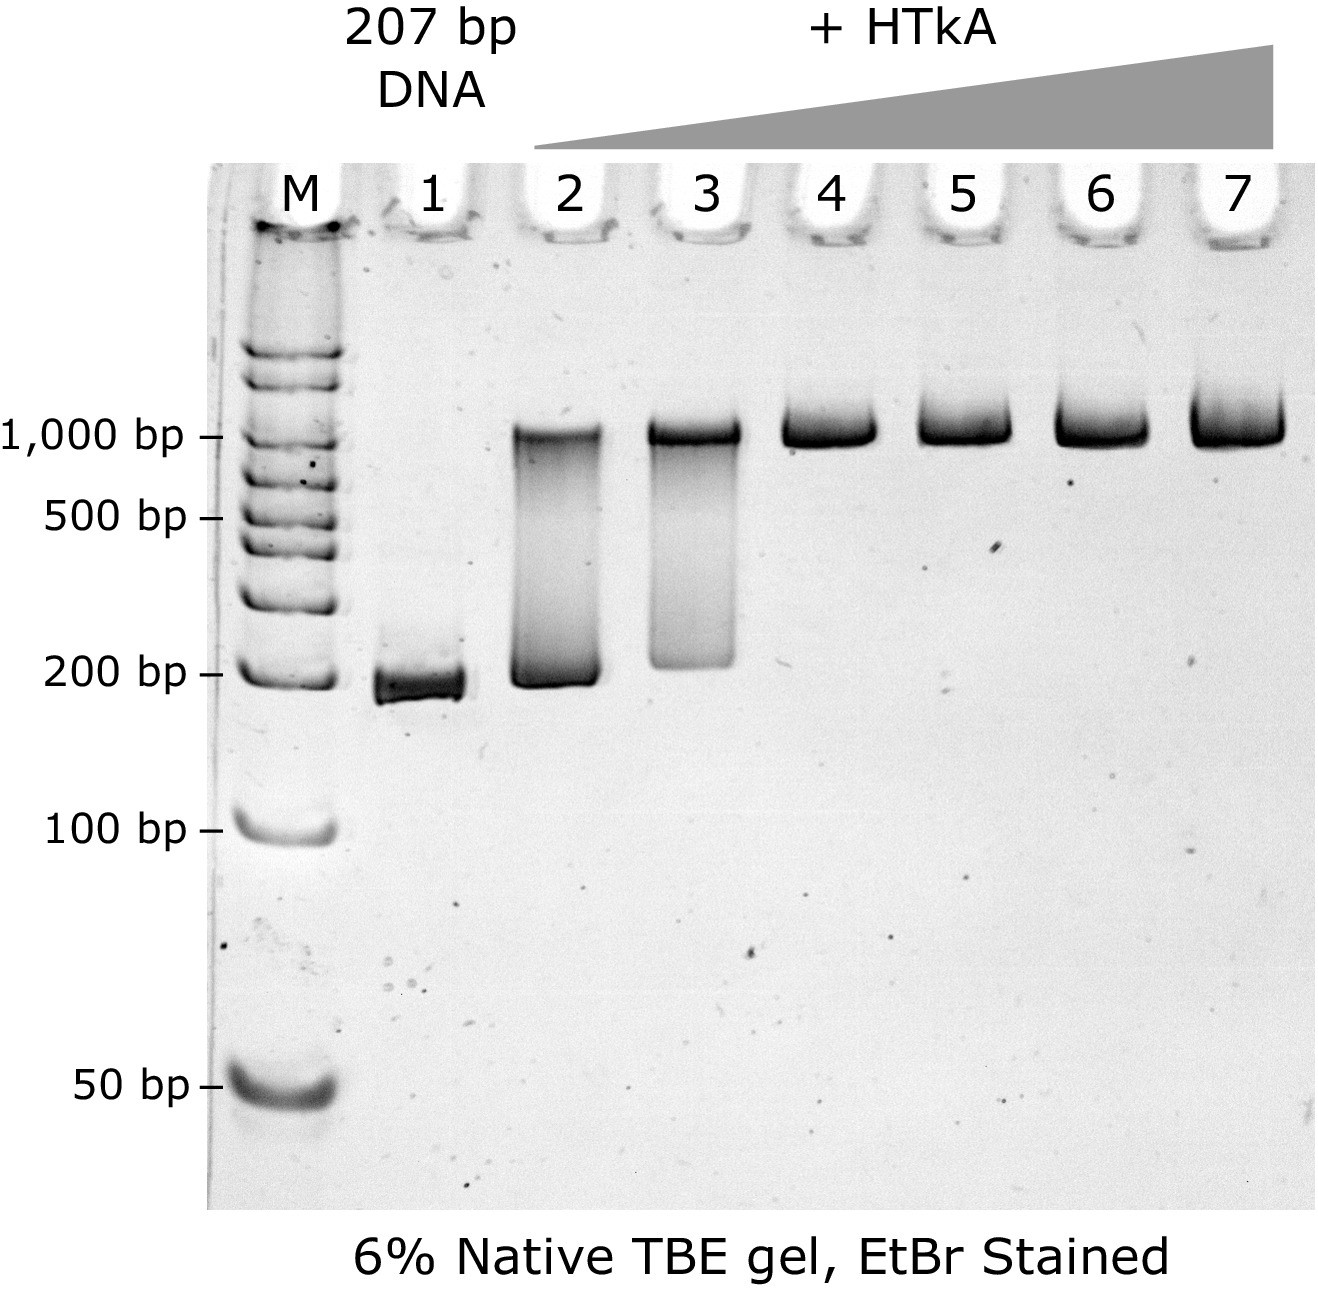
Titration of HTkA histone on to 207 bp DNA strand, observed by native PAGE gel.
M: Marker; 1: Widom 207 DNA fragment (100 ng); Lanes 2–7: 3, 5, 7, 9, 11, and 13 molar equivalents of HTkA histone dimers. Full saturation is observed at the stoichiometric ratio of 7 histone dimers per DNA fragment (lane 4).
Figure 5

Effects of Mg2+ concentration on sedimentation behavior of Arc207 and Nuc147 samples.
(A) van Holde-Weischet plots of (top) Arc207 and (bottom) Nuc147 samples. Increases from 0 to 5 mM MgCl2 results in an increase in Arc207 sedimentation rate, but little change in Nuc147 sedimentation. (B) Effects of MgCl2 concentration on (top) frictional ratio and (bottom) absorbance at 260 nm for Arc207 (circles) and Nuc147 (squares). Frictional ratios of Arc207 samples follow the same profile as sedimentation rate, where samples compact from 0 to 5 mM MgCl2 but with little change from 5 to 10 mM MgCl2. Similarly, Nuc147 samples showed very modest changes in compaction. OD260nm measurements show Nuc147 particles aggregating as a result of increased MgCl2 concentration, but Arc207 samples compact without losses to aggregation.
-
Figure 5—source data 1
van Holde-Weischet data extracted from SV-AUC sedimentation profiles as a function of MgCl2 concentration for Figure 5A, as well as frictional coefficients (as determined by GA-MC analysis) and OD260nm values for Figure 5B.
- https://cdn.elifesciences.org/articles/65587/elife-65587-fig5-data1-v2.csv
Figure 6 with 2 supplements
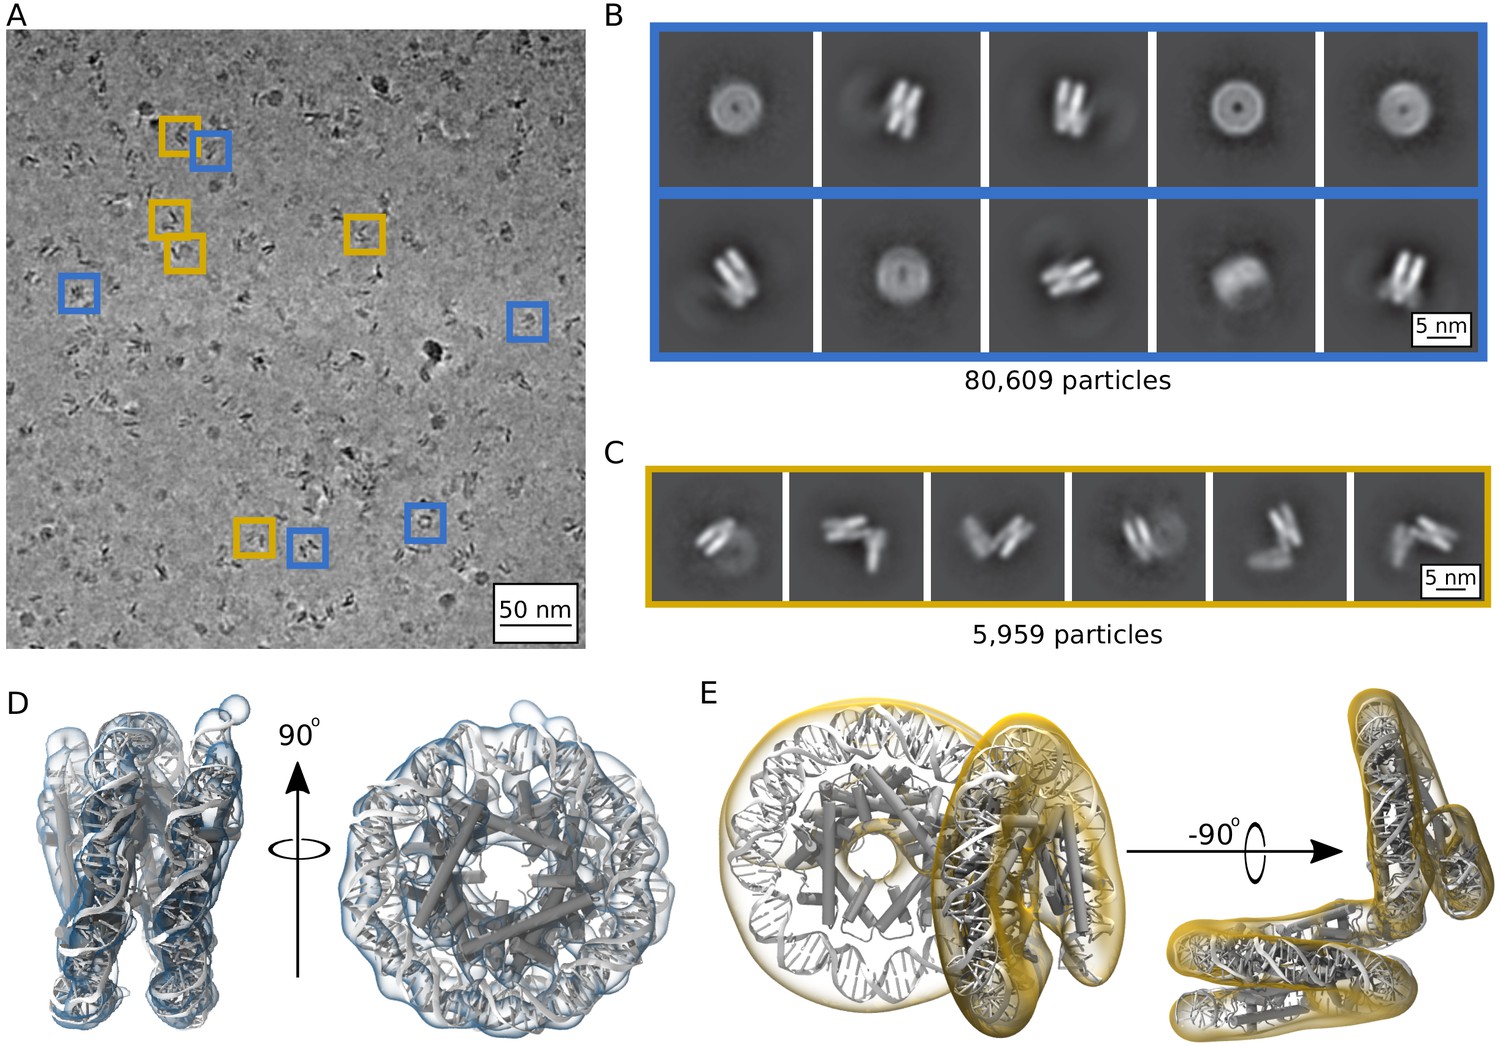
Single particle cryoEM analysis of the Arc207 complex in the presence of 5 mM MgCl2.
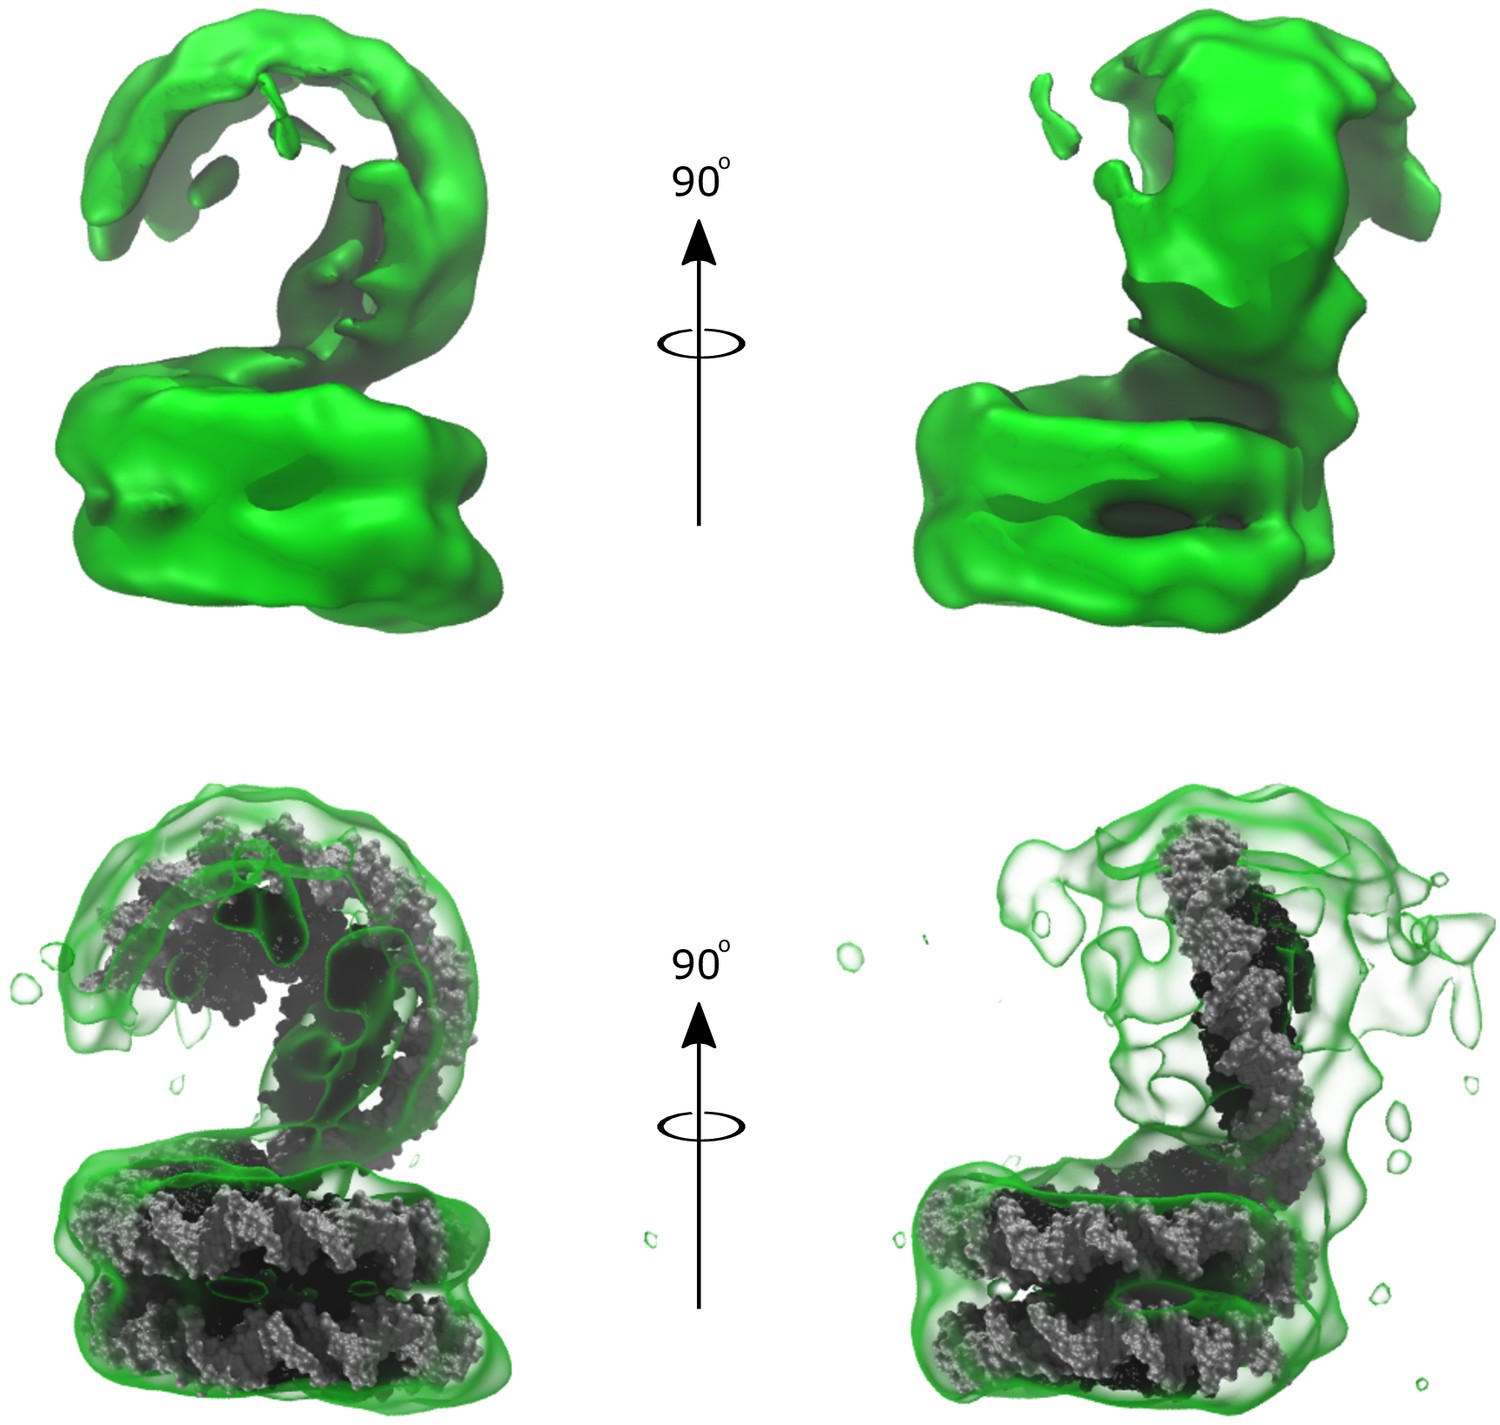
(A) Representative denoised micrograph. Particles are observed with both ‘nucleosome-like’ wrappings of the 207 base pair DNA fragment (blue boxes, Class I) as well as particles showing out-of-plane ‘lid’ extensions of DNA from similarly wrapped ‘cores’ (gold boxes, Class II). Also shown are two-dimensional classes (B, Class I) and (C, Class II). Three-dimensional densities from these classes are shown in (D) and (E), respectively. Class I particles were fit by rigid-body docking of Arc150 coordinates extracted from Arc180 simulations, and Class II particles were fit by rigid-body docking separate Arc90 and Arc120 components and bridging the connecting DNA through energy minimization.
Figure 6—figure supplement 1

DNA parameters of the zero-length linker segment calculated from a 10 ns implicit solvent simulation of the Arc207 system restrained to the ‘Class II’ configuration.
The linker segment is highlighted in blue in the accompanying structure, and blue shaded regions in the plot outline the standard deviation of values across the trajectory, whereas the average values are shown by a dark blue line. Horizontal dotted lines define the 2σ range of values observed in the eukaryotic nucleosome (PDB 1aoi).
Figure 6—figure supplement 2
Low fidelity density of Arc150 volume subclassification, showing a potential Arc60 ‘lid’ oriented out-of-plane with Arc150 ‘base’ reconstructed from the ‘Class I’ particles.
(top) The density shown with no docked model. (bottom) The same density, but with the addition of Arc150 and Arc60 model structures docked within the density. The Arc60 conformation was selected to mimic the complete Arc207 density solved previously (Figure 6E), and this conformation is centered well in the Arc60 extension despite having no a priori information regarding the observed conformation in this classification.
Videos
Video 1
Rotating view of the Arc90 system.
This system contains three histone dimers and no stacking interactions.
Video 2
Rotating view of the Arc120 system.
This system contains four histone dimers and one L1-L1 stacking interaction. Both the wild-type and G17D mutant of this system were simulated.
Video 3
Rotating view of the Arc180 system.
This system contains six histone dimers and three L1-L1 stacking interactions.
Video 4
Face-view of dynamics observed in a single Arc90 trajectory.
While the terminal dimers exhibit large fluctuations around the central histones, four-helix bundle interactions are maintained.
Video 5
Side-view of dynamics observed in a single Arc90 trajectory.
The dynamics of the terminal dimers creates ‘open’ and ‘closed’ states in a ‘clamshell-like’ motion.
Video 6
Derived EM density for the Class I state of the Arc207 complex.
By varying the contour levels of the density, we find that the strongest contributors to the EM volume are around the outside of the molecule (attributed to DNA), as well as overlapping periodic densities in the histone core (attributed to each histone’s α2 helix).
Video 7
EM density for the Class II state of the Arc207 complex (clear blue) docked with Arc150 complex (gray) extracted from MD simulations of Arc180 complex.
Docking of the Arc150 construct shows that this density cannot capture the full complex deposited on the grid but only ~150 base pairs of DNA and five histone dimers. Additional density can be seen to extend along the DNA path beyond the bound core, suggesting a possible continuation of linker DNA that could extend to the potential tetramers observed in the 2D classes (Video 10, see main text for details).
Video 8
EM density of the Class II state of the Arc207 complex (clear gold) docked with two complexes (~Arc120 and ~Arc90) connected by short linker DNA (gray).
The ~Arc90 complex is bent ~90o out of plane of the core Arc117 complex.
Video 9
EM density flaring of the Class II state, showing that the linker DNA portion is continuous along the length of the Arc207 complex.
Video 10
EM density flaring of the Arc150 density sub-classification of Class I particles, identifying weak Arc60-like density that can be associated out-of-plane orientations.
Tables
Table 1
MM-GBSA calculations for DNA binding strength, both as raw values and normalized to the number of dimers in each system.
All values are given in kcal/mol, and results are intended to be interpreted comparatively, rather than as absolute values. When normalized according to dimer count, no significant differences are observed between the wild-type histone systems of varying sizes. The G17D mutation yields a slight reduction in average calculated binding strength, but this difference is not statistically significant (p-value of 0.157). Statistical significance was calculated via t-test, and quoted error values are the standard error of the mean calculated across the three independent trajectories.
| System | ΔGDNA | ΔGDNA (per dimer) |
|---|---|---|
| Arc90 | −459.4 ± 4.7 | −153.1 ± 1.6 |
| Arc120 | −610.5 ± 5.3 | −152.6 ± 1.3 |
| Arc120-G17D | −580.2 ± 15.5 | −145.0 ± 6.7 |
| Arc180 | −906.0 ± 5.6 | −151.0 ± 0.9 |
Table 2
SV-AUC properties of Arc207 and Nuc147 molecules.
Despite the higher mass of the Arc207 complex, it sediments slower than the Nuc147 system due to increased particle elongation (frictional ratio, ‘f/fo’). ‘MWthe’ denotes the theoretical molecular weight, and ‘MWGA-MC’ corresponds to the molecular weight derived via GA-MC analysis. Parenthetical values outline the 95% confidence interval of each GA-MC value.
| Nuc147 | Arc207 | 207 DNA | |
|---|---|---|---|
| MWthe (kDa) | 200.3 | 231.4 | 127.8 |
| MWGA-MC (kDa) | 218.6 (207.2, 229.9) | 266.5 (256.9, 276.1) | 156.6 (152.4, 160.1) |
| f/fo | 1.55 (1.49, 1.61) | 1.94 (1.89, 1.99) | 3.14 (3.08, 3.20) |
| Sedimentation Coefficient (S) | 11.2 (11.1, 11.2) | 10.6 (10.6, 10.7) | 6.1 (6.1, 6.1) |
Additional files
-
Supplementary file 1
Structural model for Class I particles (pdb format).
- https://cdn.elifesciences.org/articles/65587/elife-65587-supp1-v2.pdb
-
Supplementary file 2
Structural model for Class II particles (pdb format).
- https://cdn.elifesciences.org/articles/65587/elife-65587-supp2-v2.pdb
-
Transparent reporting form
- https://cdn.elifesciences.org/articles/65587/elife-65587-transrepform-v2.docx
Download links
A two-part list of links to download the article, or parts of the article, in various formats.
Downloads (link to download the article as PDF)
Open citations (links to open the citations from this article in various online reference manager services)
Cite this article (links to download the citations from this article in formats compatible with various reference manager tools)
Archaeal chromatin ‘slinkies’ are inherently dynamic complexes with deflected DNA wrapping pathways
eLife 10:e65587.
https://doi.org/10.7554/eLife.65587


