Epigenetic analysis of Paget’s disease of bone identifies differentially methylated loci that predict disease status
- Division of Genomic and Translational Biomedicine, College of Health and Life Sciences, Hamad Bin Khalifa University, Qatar
- Centre for Genomic and Experimental Medicine, MRC Institute of Genetics and Molecular Medicine, University of Edinburgh, United Kingdom
Figures
Figure 1
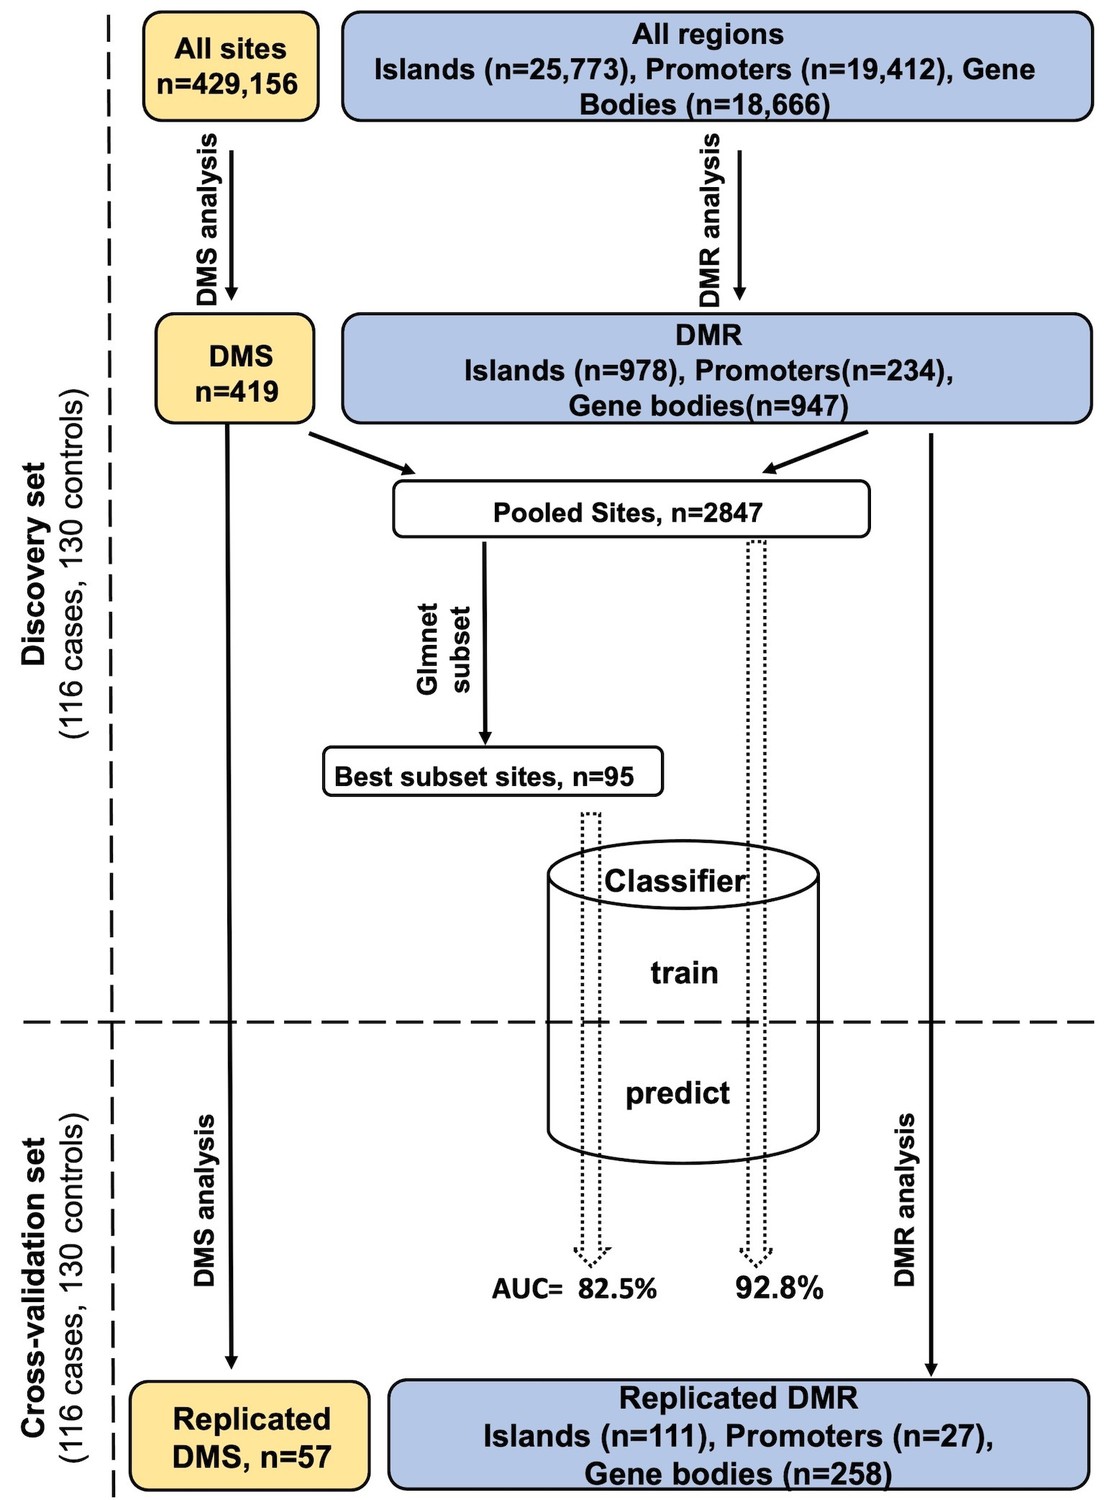
Study design and analysis workflow.
Differentially methylated sites (DMS) and differentially methylated regions (DMR) were analyzed using, the general/generalized linear model, respectively, in the discovery set. Those reaching FDR < 0.05 were tested in the cross-validation set to identify DMS/DMR that replicate at the same significance level. The DMS and the important sites within DMR were pooled together giving rise to the Pooled sites (refer to Materials and methods), of these a best PDB discriminatory subset was obtained using the Lasso and Elastic-Net regression. A multivariate classifier based on the discovery measurement of the Pooled/Best subset sites yielded an AUC value of 92.8% and 82.5%, respectively, when tested in the cross-validation.
Figure 2 with 1 supplement
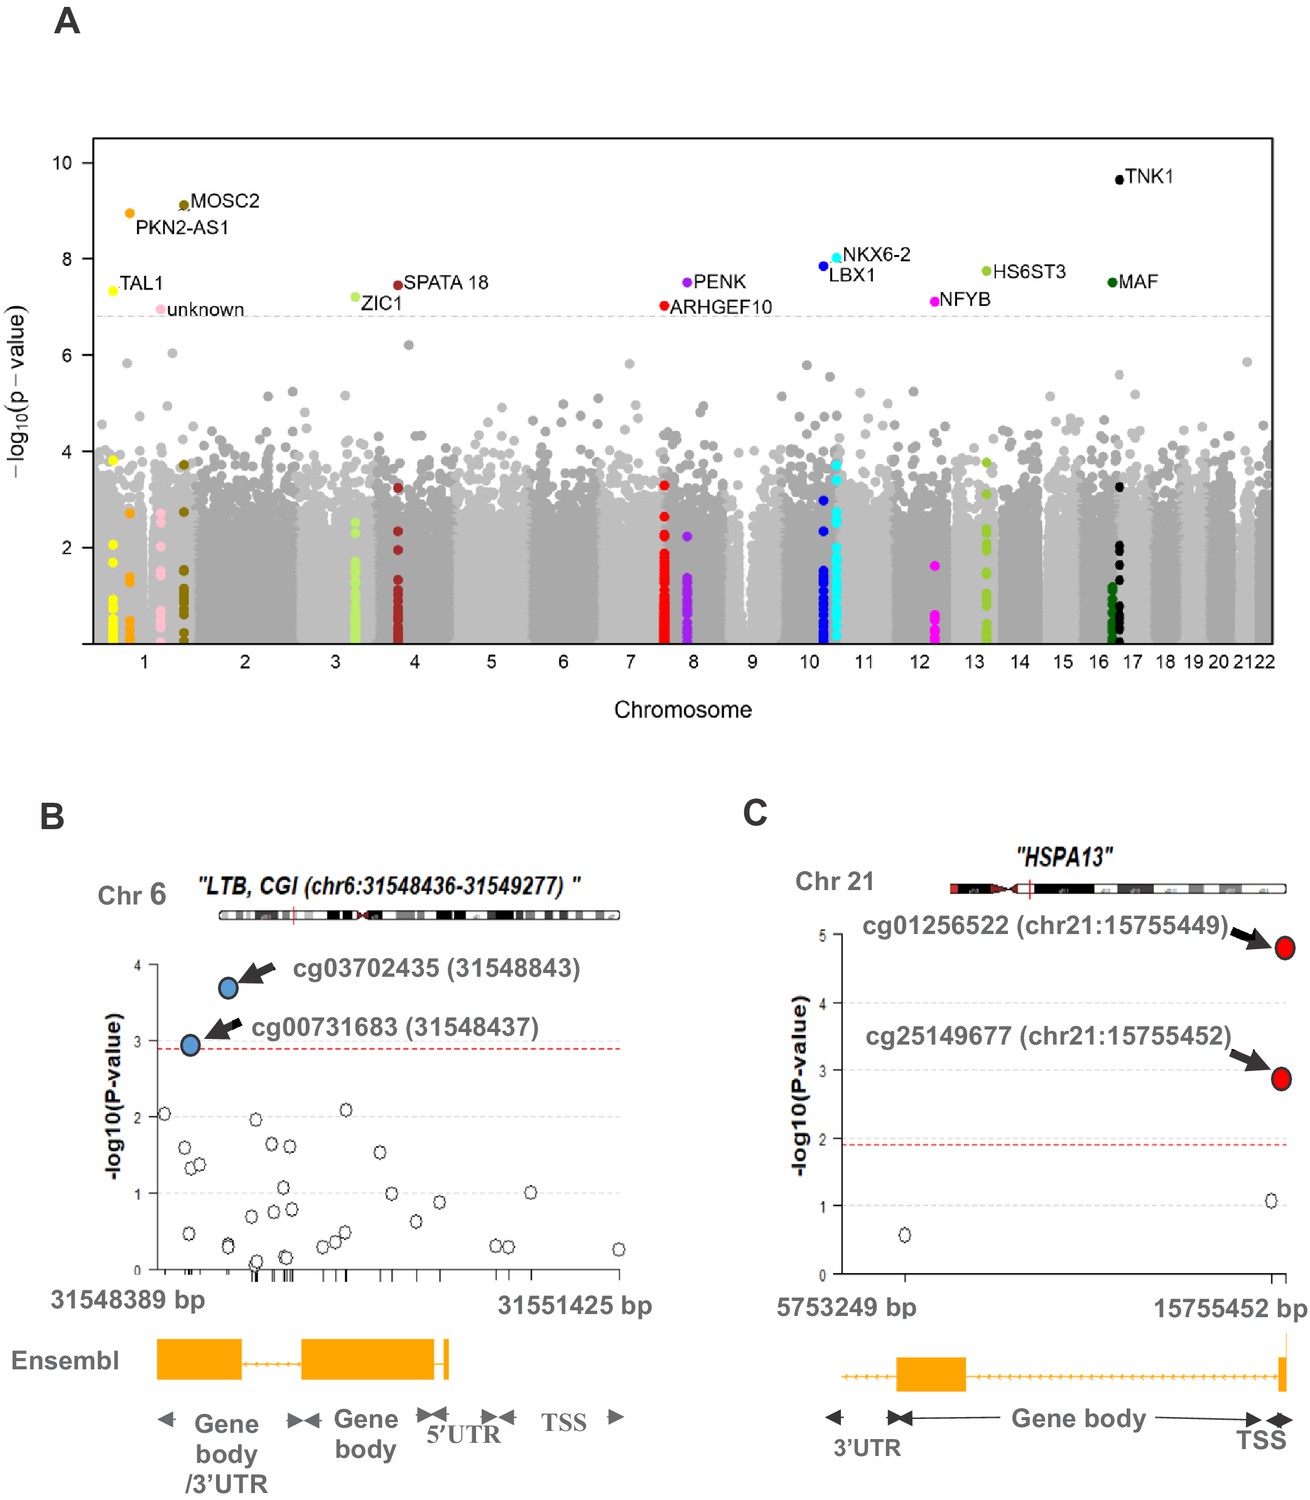
Differential methylation analysis comparing controls to PDB patients (n = 246).
(A) Site analysis, a Manhattan plot showing the chromosomal positions (x-axis) versus the −log10 (p) of significant DMS and adjacent sites. For the Bonferroni significant sites however, the meta-analysis p-values are shown instead and highlighted in color. The horizontal dashed line indicates the Bonferroni corrected significance threshold (p<1.17×10⁻⁷). (B, C) Region analysis, showing the multitude of significantly hyper-methylated (red) and hypo-methylated (blue) sites from LTB (Bonferroni replicated from island analysis) and HSPA13 (Bonferroni replicated from gene body analysis). The dashed lines represent the FDR < 0.05 threshold for each region, which depends on the number of sites within the region (refer to Materials and methods).
Figure 2—figure supplement 1
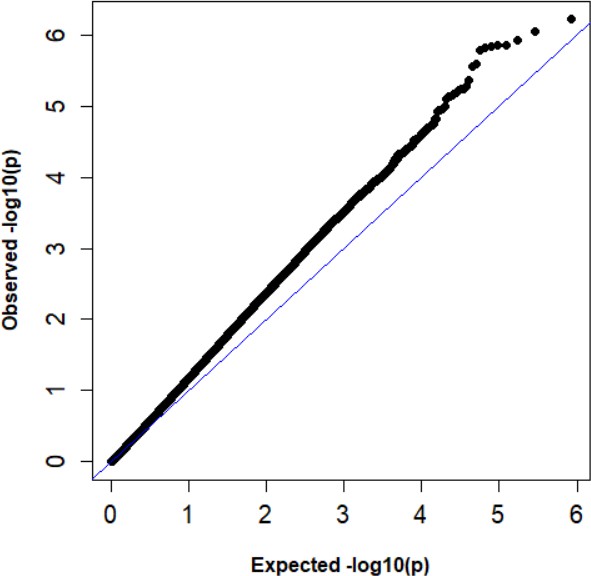
QQ plots of expected versus observed –log10 p-values from site differential methylation analysis.
The genomic inflation factor = 1.23.
Figure 3
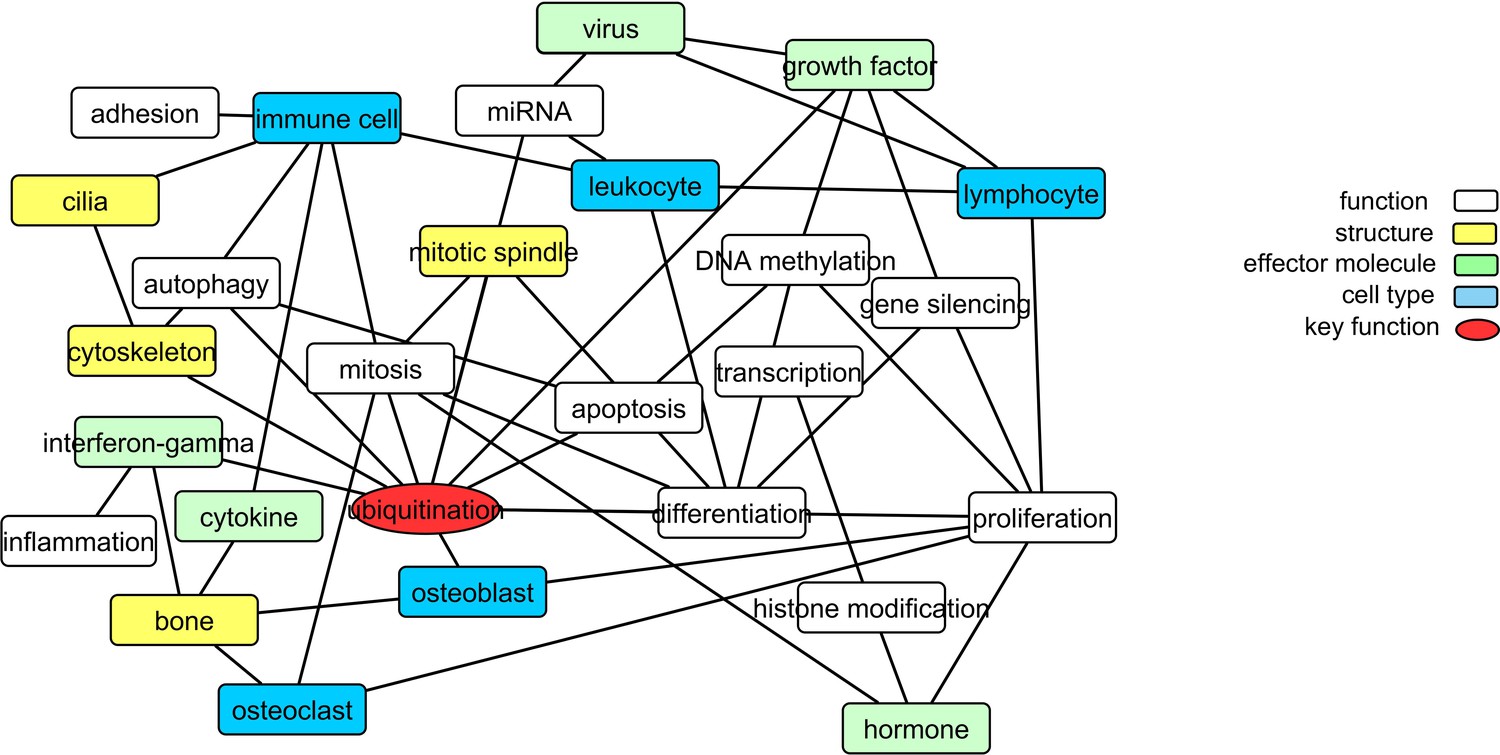
Translating the methylation data into functional networks.
Nodes are functional, cellular, molecular, and sub-cellular keywords from GO annotations enriched amongst the Pooled sites. An edge between two nodes indicates that differentially methylated genes associated with the keyword in node one are significantly partially correlated with their counterparts from node 2 more often than can be accounted for by chance.
Figure 4

The orthogonal partial least squares-discriminant analysis (OPLS-DA) was performed using the Pooled sites identified from the discovery set (n = 246).
(A) Classifier trained on all 2847 pooled sites with FDR < 0.05 (Pooled sites) from the discovery set. (B) Testing the classifier on the replication (or cross-validation) set. (C) ROC curve analysis yielded an overall sensitivity of 0.84, specificity of 0.81, and AUC of 0.928. (D) Classifier trained on the Best subset sites from Glmnet analysis (n = 95) using the discovery set. (E) Testing the classifier on the replication (or cross-validation) set. (F) ROC curve analysis showed an overall sensitivity of 0.77, specificity of 0.74, and AUC of 0.825. The Scatter plots show the predictive component that discriminates PDB cases from controls (x-axis) versus the orthogonal component representing a multivariate confounding effect that is independent of PDB (y-axis).
Figure 5
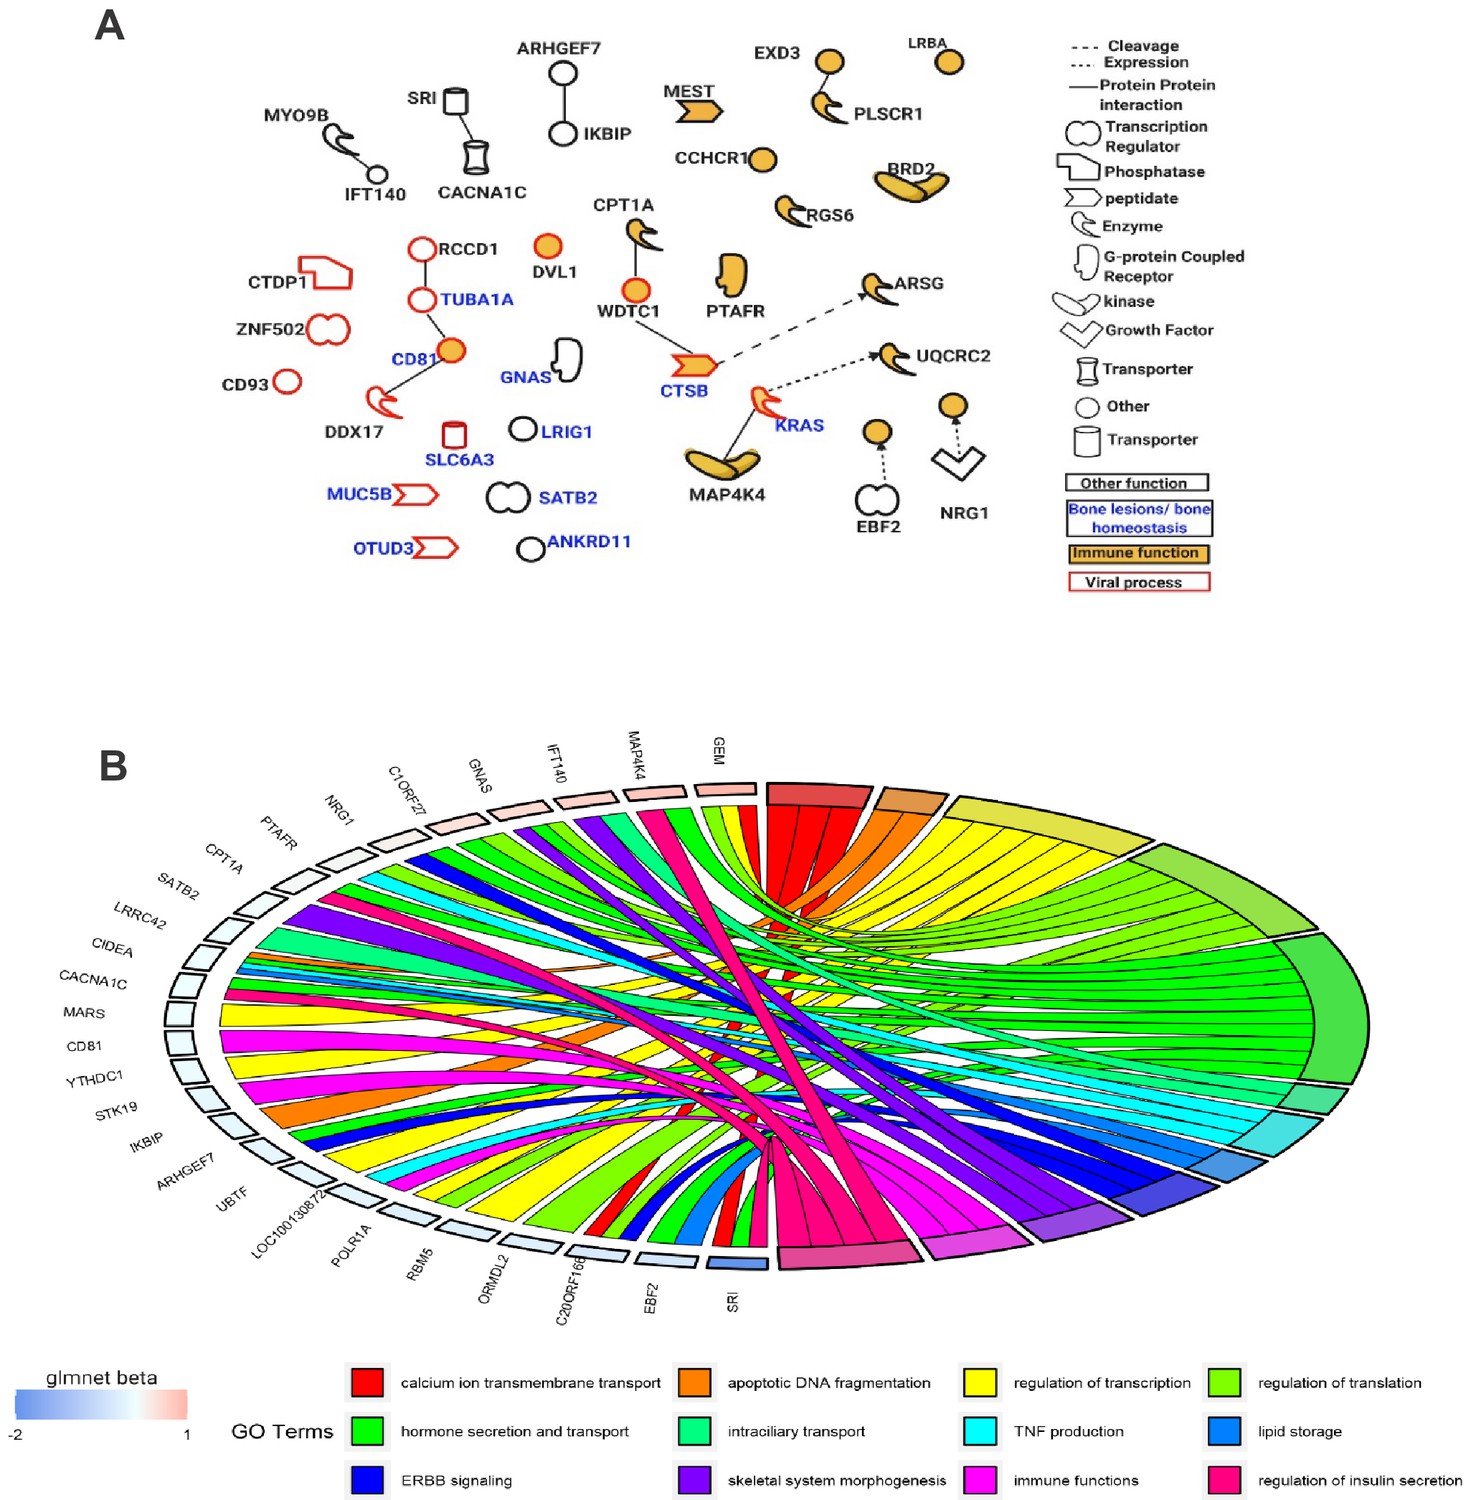
Functions of genes mapped near the Best subset of differentially methylated sites identified through the elastic-net regularization extension of the generalized linear model.
(A) An IPA-based network showing a subset of these genes with functional interactions (edges) or mapping to one of three functional classes: immune, viral, and bone homeostasis. (B) An overview of GO biological processes significantly enriched amongst the Best subset together with their beta values from the Glmnet R package implementing the extended generalized linear model in question.
Tables
Table 1
Descriptive statistics of the study cohort.
| Discovery | Cross-validation | ||||
|---|---|---|---|---|---|
| PDB case | Control | PDB case | Control | ||
| Number | 116 | 130 | 116 | 130 | |
| Age (years), mean ± SD | 72.1 ± 7.5* | 70.0 ± 7.4* | 72.5 ± 8.7 | 72.3 ± 8.2 | |
| Male, n (%) | 65 (56.0)* | 48 (36.9)* | 59 (50.9) | 53 (40.8) | |
| Female, n (%) | 51 (44.0)* | 82 (63.1)* | 57 (49.1) | 77 (59.2) | |
| SQSTM1 mutation, n (%) | 16 (13.8) | 0 (0) | 17 (14.6) | 0 (0) | |
-
*P<0.05 comparing Paget’s disease (PDB) cases to controls.
Table 2
Differentially methylated CpG sites (DMS) in Paget’s disease of bone.
| CpG Site | Discovery | Cross-validation | Meta-analysis | Annotations | |||||
|---|---|---|---|---|---|---|---|---|---|
| Probe ID | Chr | Position | Δ Beta* | p-value | Δ Beta* | p-value | Δ Beta* | p-value | Nearest gene |
| cg10290814 | 17 | 7284330 | −0.018 | 1.2 × 10⁻⁶ | −0.015 | 1.4 × 10⁻⁴ | −0.017 | 2.3 × 10⁻¹⁰ | TNK1 |
| cg19361865 | 1 | 220922163 | −0.014 | 5.4 × 10⁻⁶ | −0.012 | 9.7 × 10⁻⁵ | −0.013 | 7.6 × 10⁻¹⁰ | MOSC2 |
| cg09152582 | 1 | 88928362 | −0.021 | 2.1 × 10⁻⁵ | −0.018 | 3.5 × 10⁻⁵ | −0.019 | 1.1 × 10⁻⁹ | PKN2-AS1 |
| cg09260089 | 10 | 134599860 | −0.024 | 4.6 × 10⁻⁵ | −0.024 | 1.2 × 10⁻⁴ | −0.024 | 9.5 × 10⁻⁹ | NKX6-2 |
| cg24879273 | 10 | 102989645 | −0.026 | 4.9 × 10⁻⁵ | −0.016 | 1.7 × 10⁻⁴ | −0.021 | 1.4 × 10⁻⁸ | LBX1 |
| cg03839709 | 13 | 96743492 | −0.014 | 2.7 × 10⁻⁴ | −0.014 | 3.4 × 10⁻⁵ | −0.014 | 1.8 × 10⁻⁸ | HS6ST3 |
| cg16419235 | 8 | 57360613 | −0.036 | 1.9 × 10⁻⁴ | −0.029 | 8.3 × 10⁻⁵ | −0.032 | 3.1 × 10⁻⁸ | PENK |
| cg04317962 | 16 | 79623625 | −0.017 | 1.4 × 10⁻⁶ | −0.019 | 2.9 × 10⁻³ | −0.018 | 3.1 × 10⁻⁸ | MAF |
| cg01429039 | 4 | 52918065 | −0.023 | 1.8 × 10⁻⁴ | −0.020 | 1.1 × 10⁻⁴ | −0.021 | 3.5 × 10⁻⁸ | SPATA18 |
| cg03885399 | 1 | 47691550 | −0.020 | 4.4 × 10⁻⁶ | −0.014 | 3.6 × 10⁻³ | −0.017 | 4.7 × 10⁻⁸ | TAL1 |
| cg04738965 | 3 | 147127662 | −0.037 | 4.0 × 10⁻⁵ | −0.028 | 7.1 × 10⁻⁴ | −0.033 | 6.2 × 10⁻⁸ | ZIC1 |
| cg10954182 | 12 | 104532377 | −0.016 | 1.9 × 10⁻⁴ | −0.009 | 2.1 × 10⁻⁴ | −0.013 | 7.8 × 10⁻⁸ | NFYB |
| cg10964367 | 8 | 1771973 | −0.025 | 1.3 × 10⁻⁴ | −0.019 | 3.8 × 10⁻⁴ | −0.022 | 9.4 × 10⁻⁸ | ARHGEF10 |
| cg12739454 | 1 | 164290833 | −0.018 | 2.4 × 10⁻⁴ | −0.012 | 2.4 × 10⁻⁴ | −0.015 | 1.1 × 10⁻⁷ | - |
-
*Δ Beta represents the difference in DNA methylation in cases as compared to controls (Beta Control-Beta PDB). Position in base pairs in reference to human genome build 37 (GRCh37). Chr, chromosome; CpG, cytosine-phosphate-guanine. All p-values are genome-wide significant based on Bonferroni corrected p-value < 0.05.
Table 3
Differentially methylated regions (DMR) in Paget’s disease of bone.
| Region | Chr | Number of sites | Discovery p-value* | Cross-validation p-value* | Gene |
|---|---|---|---|---|---|
| Island | 6 | 53 | 1.40 × 10⁻² | 3.25 × 10⁻⁴ | LTB |
| Island | 6 | 59 | 4.11 × 10⁻³ | 2.47 × 10⁻³ | SKIV2L;RDBP |
| Island | 10 | 49 | 2.65 × 10⁻³ | 4.72 × 10⁻³ | EBF3 |
| Island | 11 | 49 | 3.57 × 10⁻³ | 9.52 × 10⁻³ | CCND1 |
| Gene Body | 1 | 52 | 2.01 × 10⁻⁵ | 3.14 × 10⁻⁵ | SDCCAG8 |
| Gene Body | 9 | 36 | 6.09 × 10⁻³ | 1.20 × 10⁻² | CACNA1B |
| Gene Body | 8 | 51 | 2.49 × 10⁻² | 4.39 × 10⁻³ | RBPMS |
| Gene Body | 21 | 5 | 3.19 × 10⁻² | 2.88 × 10⁻³ | HSPA13 |
| Gene Body | 2 | 52 | 3.80 × 10⁻² | 2.39 × 10⁻³ | PARD3B |
| Gene Body | 22 | 34 | 4.49 × 10⁻² | 7.10 × 10⁻³ | BRD1 |
-
*P-values are adjusted for multiple testing using the Bonferroni method.
Key resources table
| Reagent type (species) or resource | Designation | Source or reference | Identifiers | Additional information |
|---|---|---|---|---|
| Other | Infinium HumanMethylation450 BeadChip | Illumina, USA | DNA Methylation array | |
| Software, algorithm | RnBeads | R | Version 1.10.8 | |
| Software, algorithm | SIMCA | Umetrics, Sweden | Version 15 | |
| Software, algorithm | IPA | Qiagen, Germany | ||
| Software, algorithm | GGM | R | Version 2.4 | |
| Software, algorithm | topGO | R | Version 2.4 |
Additional files
-
Supplementary file 1
List of replicated differentially methylated sites with FDR < 0.05.
- https://cdn.elifesciences.org/articles/65715/elife-65715-supp1-v3.xlsx
-
Supplementary file 2
List of replicated DMR at islands with FDR < 0.05.
- https://cdn.elifesciences.org/articles/65715/elife-65715-supp2-v3.xlsx
-
Supplementary file 3
List of replicated DMR at gene bodies with FDR < 0.05.
- https://cdn.elifesciences.org/articles/65715/elife-65715-supp3-v3.xlsx
-
Supplementary file 4
List of replicated DMR at promoters with FDR < 0.05.
- https://cdn.elifesciences.org/articles/65715/elife-65715-supp4-v3.xlsx
-
Supplementary file 5
List of Best subset sites from Glmnet analysis.
- https://cdn.elifesciences.org/articles/65715/elife-65715-supp5-v3.xlsx
-
Supplementary file 6
List of CpG, reported as correlated between bone and blood in Ebrahimi et al. (PMID: 32692944), mapping to the same genes as our significant DMS and DMR in Pagets disease.
- https://cdn.elifesciences.org/articles/65715/elife-65715-supp6-v3.xlsx
-
Supplementary file 7
List of expression quantitative trait-methylation (eQTM) sites from the Pooled sites.
Highlighted in bold are the 8CpGs belonging to the best subset of sites (a subset of sites best explanatory of PDB).
- https://cdn.elifesciences.org/articles/65715/elife-65715-supp7-v3.xlsx
-
Transparent reporting form
- https://cdn.elifesciences.org/articles/65715/elife-65715-transrepform-v3.docx
Download links
A two-part list of links to download the article, or parts of the article, in various formats.
Downloads (link to download the article as PDF)
Open citations (links to open the citations from this article in various online reference manager services)
Cite this article (links to download the citations from this article in formats compatible with various reference manager tools)
Epigenetic analysis of Paget’s disease of bone identifies differentially methylated loci that predict disease status
eLife 10:e65715.
https://doi.org/10.7554/eLife.65715


