Stress resets ancestral heritable small RNA responses
- Department of Neurobiology, Wise Faculty of Life Sciences & Sagol School of Neuroscience, Tel Aviv University, Israel
Figures
Figure 1 with 5 supplements
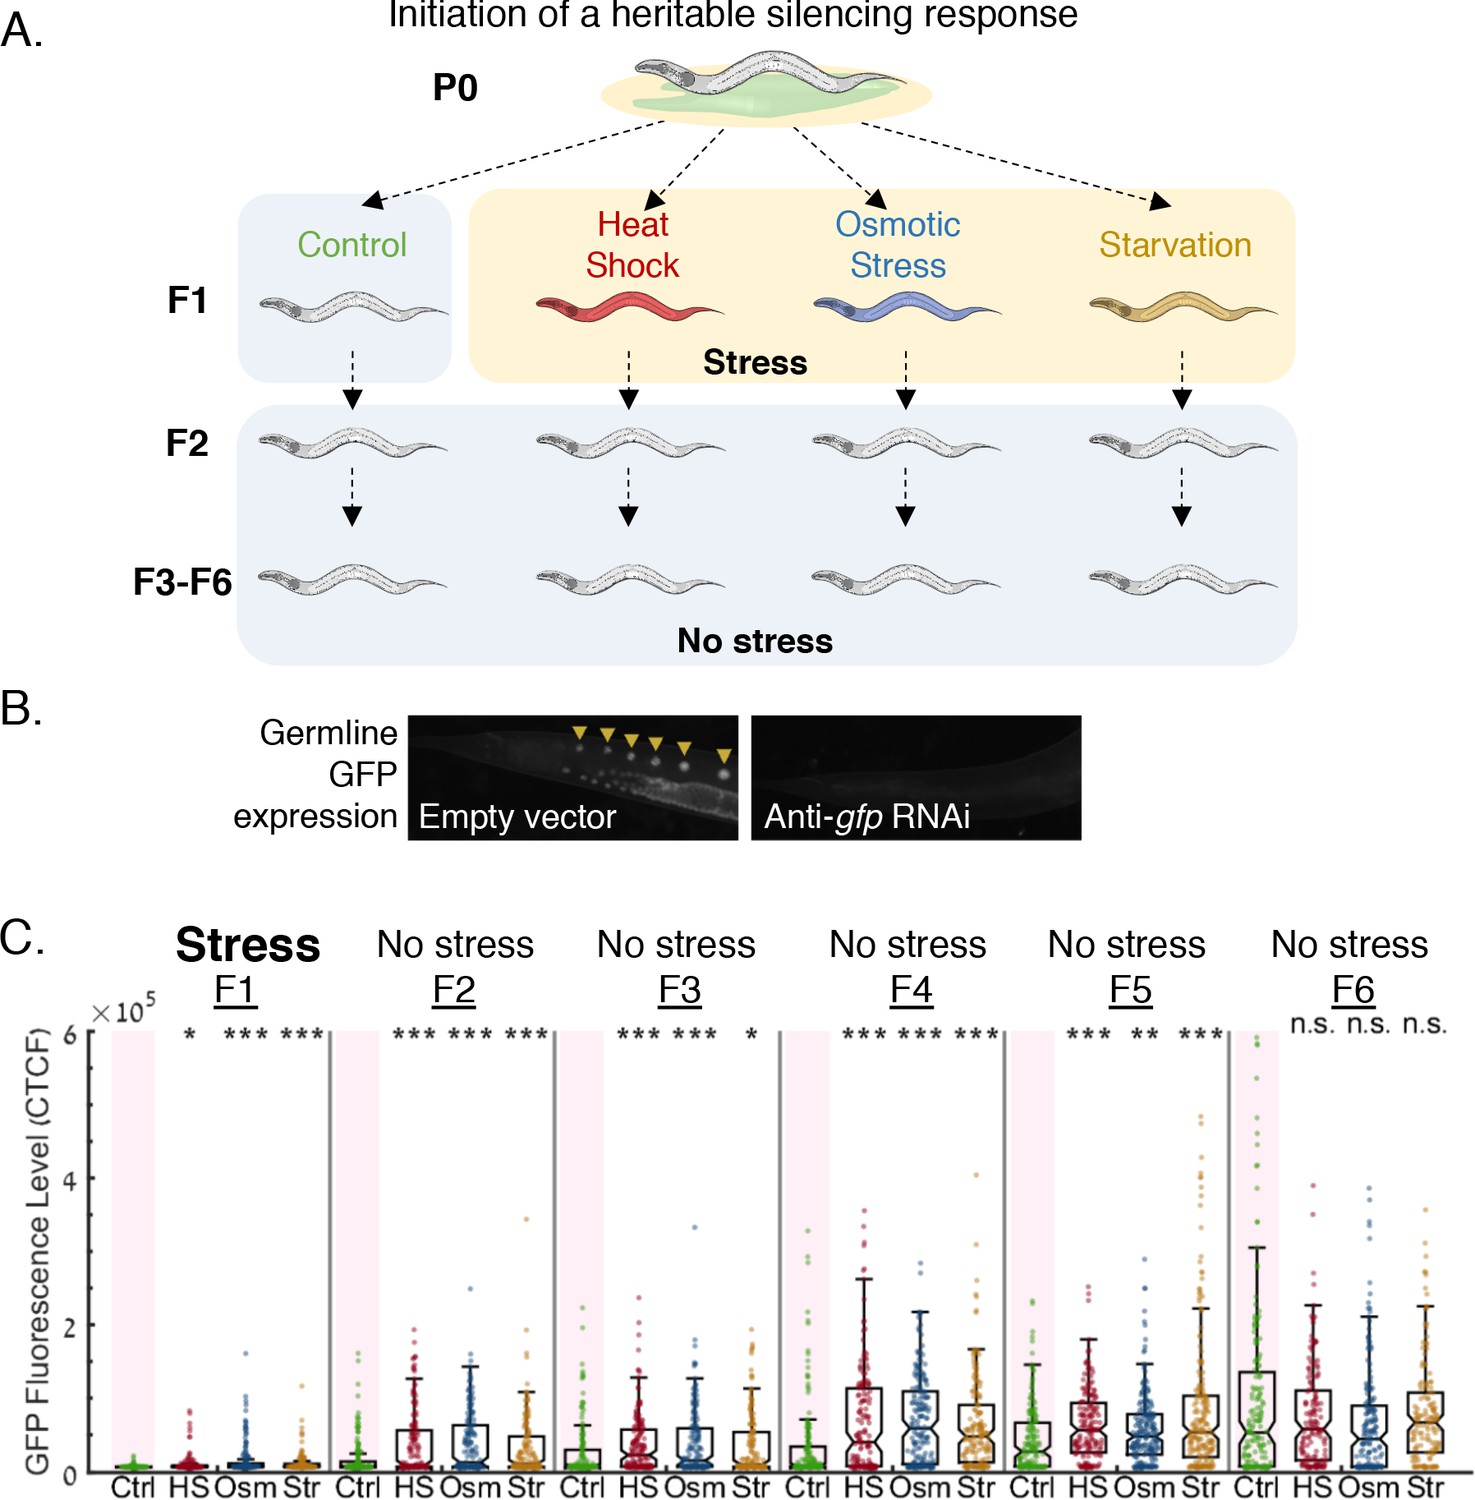
Stress resets heritable small RNA silencing.
(A) Experimental scheme. Heritable small RNA responses are initiated at the first generation, and the F1 progeny are then subjected to three different stress types (heat shock {HS}, hyperosmotic stress {Osm}, starvation {Str}). Inheritance of the ancestral response is scored both in the stressed generation and in the next generations which were grown under regular growth conditions. (B) Representative images of worms containing the Pmex-5::gfp transgene, treated with empty vector containing bacteria (left) or with anti-gfp dsRNA-producing bacteria (right). (C) Heritable exo-siRNAs silencing is reset by stress. The graph displays the measured germline GFP fluorescence levels of individual worms (y-axis) across generations under the indicated condition (x-axis). Each dot represents the value of an individual worm. Shown are the median of each group, with box limits representing the 25th (Q1) and 75th (Q3) percentiles, notch representing a 95% confidence interval, and whiskers indicating Q1-1.5*IQR and Q3+1.5*IQR. FDR-corrected values were obtained using Dunn’s test. (***) indicates q < 0.001 (see Materials and methods).
Figure 1—figure supplement 1

Multiple durations and magnitudes of stress can induce resetting of small RNAs.
(A) Both 3 day long and 6 day long starvation lead to resetting of a heritable RNAi response. Each condition was tested separately, and they are displayed side-by-side for readability. The graph displays the measured germline GFP fluorescence levels of wild-type worms (y-axis) under the indicated condition (x-axis). Each dot represents the value of an individual worm. Shown are the median of each group, with box limits representing the 25th (Q1) and 75th (Q3) percentiles, notch representing a 95% confidence interval, and whiskers indicating Q1-1.5*IQR and Q3+1.5*IQR. FDR-corrected values were obtained using Dunn’s test. Not significant (ns) indicates q ≥ 0.05, (*) indicates q < 0.05, (**) indicates q < 0.01, and (***) indicates q < 0.001 (see Materials and methods). (B) Both 200 mM NaCl and 350 mM NaCl osmotic stresses lead to resetting of a heritable RNAi response. Each condition was tested separately, and they are displayed side-by-side for readability. The graph displays the measured germline GFP fluorescence levels of wild-type worms (y-axis) under the indicated condition (x-axis). Each dot represents the value of an individual worm. Shown are the median of each group, with box limits representing the 25th (Q1) and 75th (Q3) percentiles, notch representing a 95% confidence interval, and whiskers indicating Q1-1.5*IQR and Q3+1.5*IQR. FDR-corrected values were obtained using Dunn’s test. Not significant (ns) indicates q ≥ 0.05, (*) indicates q < 0.05, (**) indicates q < 0.01, and (***) indicates q < 0.001, (see Materials and Methods). (C) Both 75 min 34-degree and 120 min 37-degree heat shock lead to resetting of a heritable RNAi response. Each condition was tested separately, and they are displayed side-by-side for readability. The graph displays the measured germline GFP fluorescence levels of wild-type worms (y-axis) under the indicated condition (x-axis). Each dot represents the value of an individual worm. Shown are the median of each group, with box limits representing the 25th (Q1) and 75th (Q3) percentiles, notch representing a 95% confidence interval, and whiskers indicating Q1-1.5*IQR and Q3+1.5*IQR. FDR-corrected values were obtained using Dunn’s test. Not significant (ns) indicates q ≥ 0.05, (*) indicates q < 0.05, (**) indicates q < 0.01, and (***) indicates q < 0.001 (see Materials and methods).
Figure 1—figure supplement 2
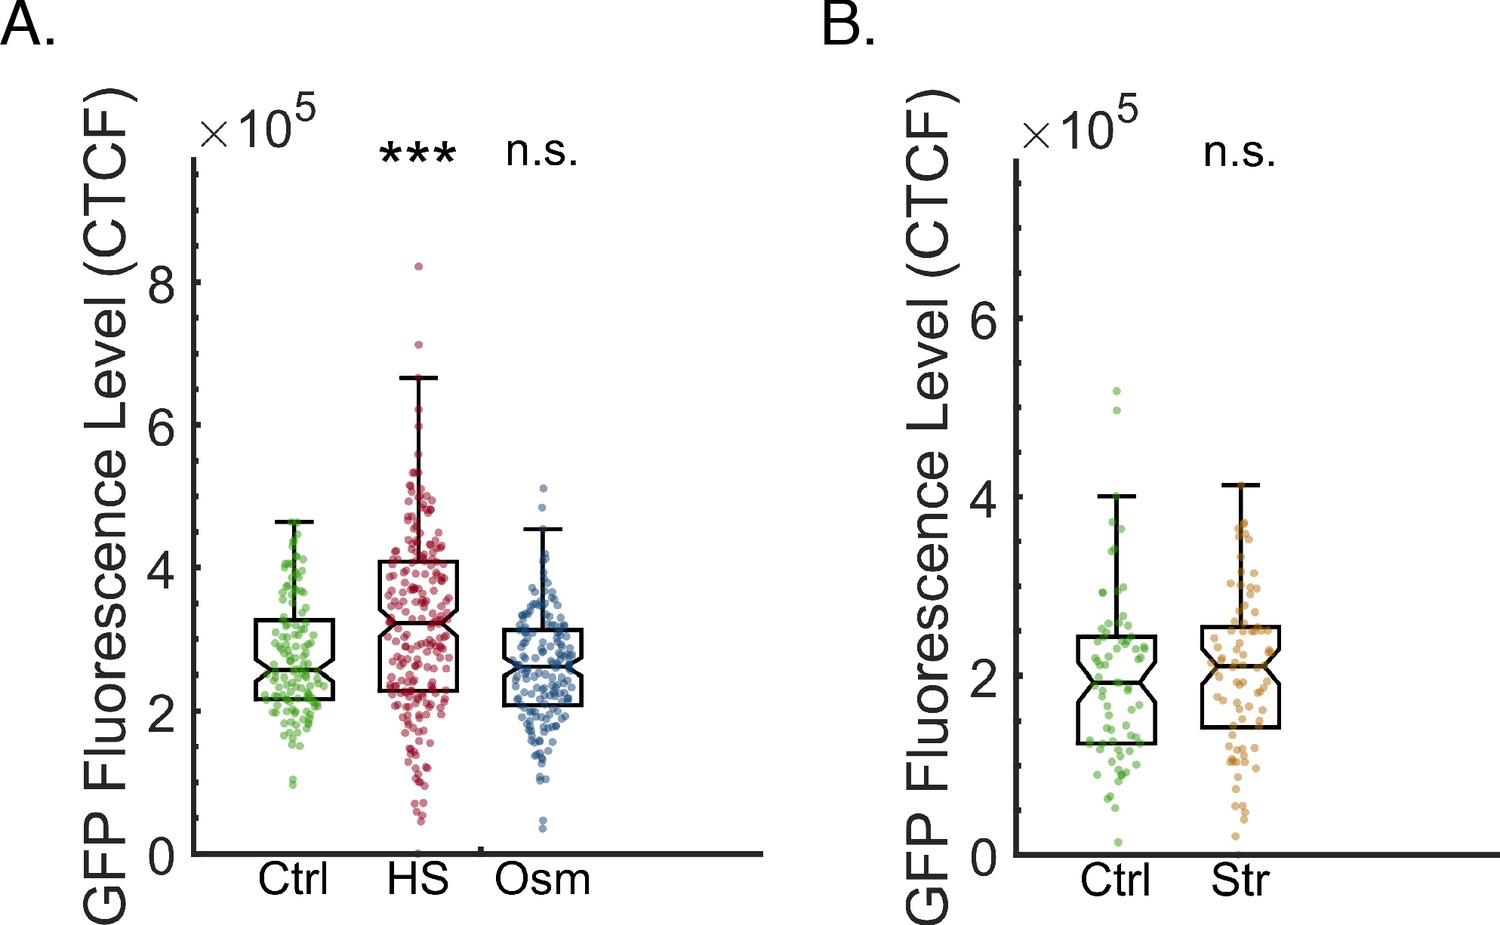
Starvation and hyperosmotic stress do not affect the basal expression level of the GFP reporter.
(A) Hyperosmotic stress does not affect the basal expression level of the GFP reporter. The graph displays the measured germline GFP fluorescence levels of wild-type worms which were not exposed to RNAi (y-axis) under the indicated condition (x-axis). Each dot represents the value of an individual worm. Shown are the median of each group, with box limits representing the 25th (Q1) and 75th (Q3) percentiles, notch representing a 95% confidence interval, and whiskers indicating Q1-1.5*IQR and Q3+1.5*IQR. FDR-corrected values were obtained using Dunn’s test. Not significant (ns) indicates q ≥ 0.05, (*) indicates q < 0.05, (**) indicates q < 0.01, and (***) indicates q < 0.001 (see Materials and methods). (B) Starvation does not affect the basal expression level of the GFP transgene. The graph displays the measured germline GFP fluorescence levels of wild-type worms which were not exposed to RNAi (y-axis) under the indicated condition (x-axis). Each dot represents the value of an individual worm. Shown are the median of each group, with box limits representing the 25th (Q1) and 75th (Q3) percentiles, notch representing a 95% confidence interval, and whiskers indicating Q1-1.5*IQR and Q3+1.5*IQR. FDR-corrected values were obtained using Dunn’s test. Not significant (ns) indicates q ≥ 0.05, (*) indicates q < 0.05, and (***) indicates q < 0.001 (see Materials and methods).
Figure 1—figure supplement 3

stress expedites the typical diminishment of heritable small RNA responses.
(A) Heritable exogenous small RNA silencing is reset by stress. The graph displays the measured germline GFP fluorescence levels of worms (y-axis) across generations (x-axis). Shown are the median of each group, with whiskers indicating the upper limit of a 95% confidence interval. (B) Most worms do not return to baseline expression level of the GFP reporter six generations after the initiation of RNAi. The graph displays the measured germline GFP fluorescence levels of individual worms (y-axis) across generations under the indicated condition (x-axis). Each dot represents the value of an individual worm. Shown are the median of each group, with box limits representing the 25th (Q1) and 75th (Q3) percentiles, notch representing a 95% confidence interval, and whiskers indicating Q1-1.5*IQR and Q3+1.5*IQR. FDR-corrected values were obtained using Dunn’s test. (***) indicates q < 0.001 (see Materials and methods).
Figure 1—figure supplement 4
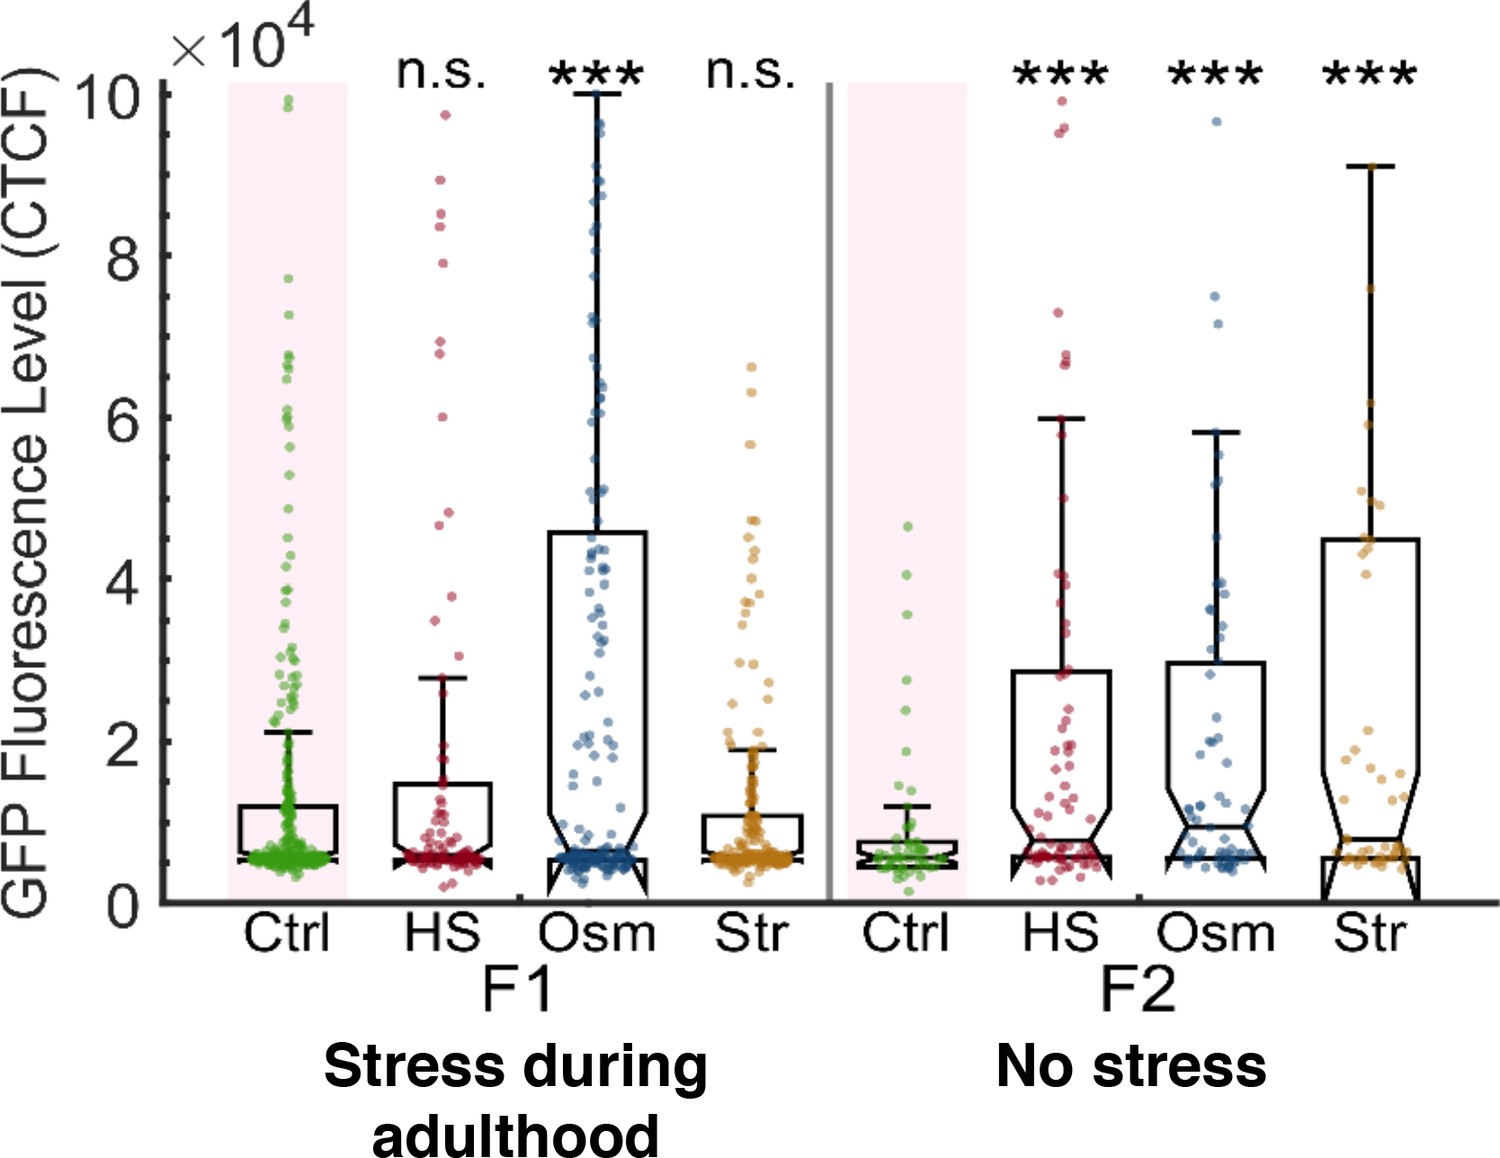
Stress resets heritable small RNAs even when applied during adulthood.
Stress applied during adulthood leads to resetting of heritable silencing in the next generation. The graph displays the measured germline GFP fluorescence levels of individual worms (y-axis) across generations under the indicated condition (x-axis). Each dot represents the value of an individual worm. Shown are the median of each group, with box limits representing the 25th (Q1) and 75th (Q3) percentiles, notch representing a 95% confidence interval, and whiskers indicating Q1-1.5*IQR and Q3+1.5*IQR. FDR-corrected values were obtained using Dunn’s test. Not significant (ns) indicates q ≥ 0.05 and (***) indicates q < 0.001 (see Materials and Methods).
Figure 1—figure supplement 5
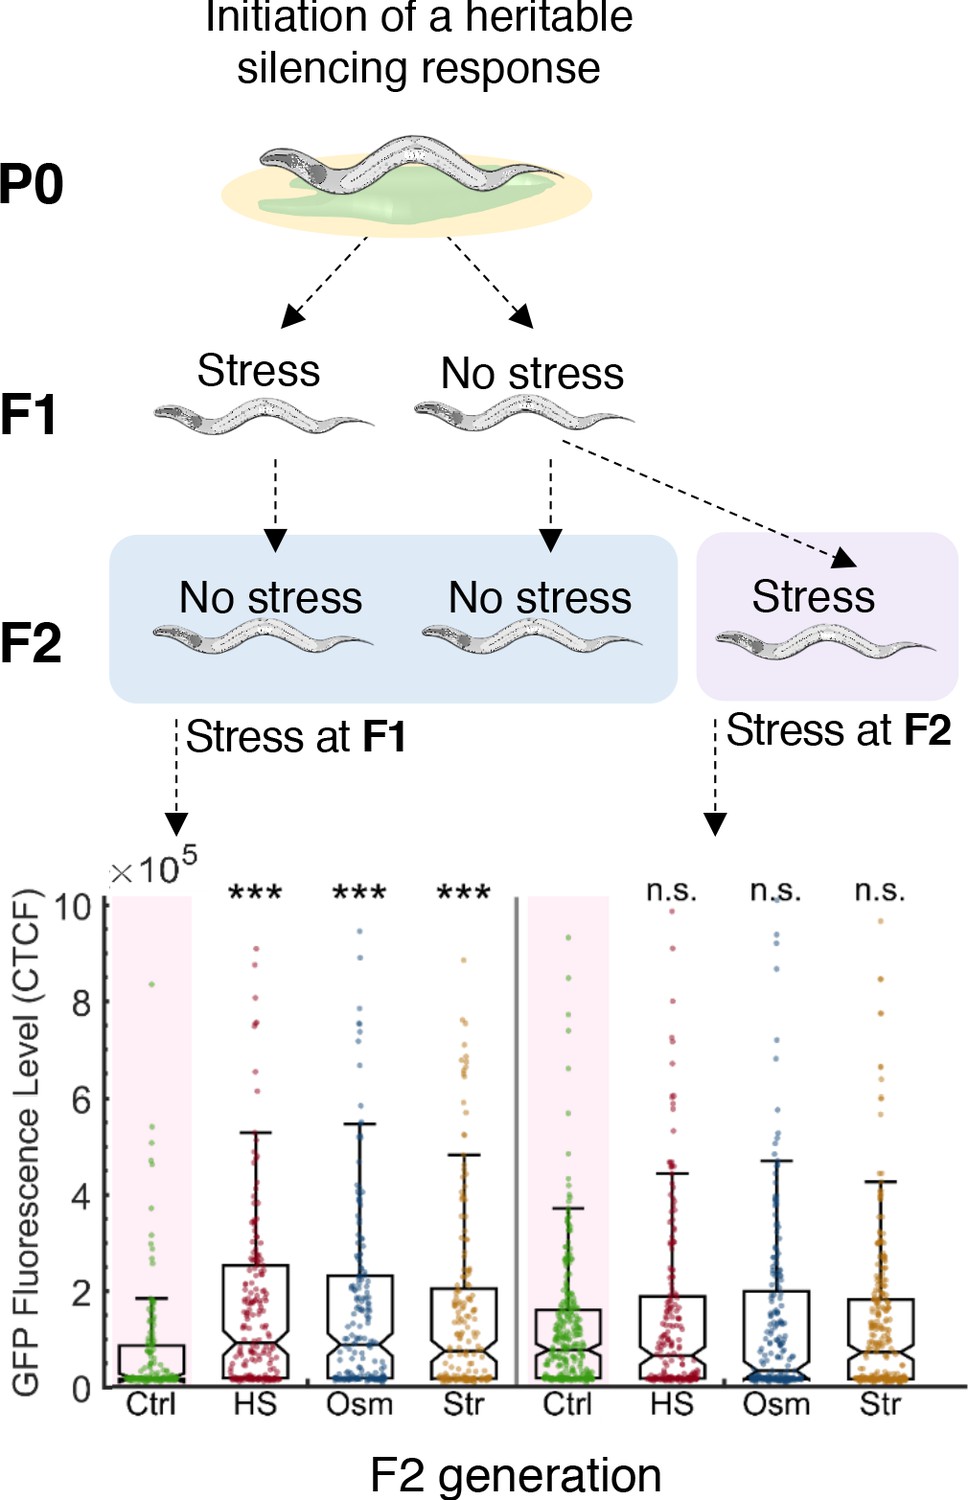
Resetting of heritable small RNA responses can only occur during the F1 generation.
Stress applied two generations after the initiation of the heritable small RNAs response does not reset the inheritance. Upper panel: Experimental scheme. A heritable anti-gfp small RNA response is initiated at the first generation and the progeny are then subjected to three different stress types (heat shock, hyperosmotic stress, starvation). Stress is applied at the first generation (F1) or the second generation (F2) after the initiation of the heritable response. Inheritance of the ancestral response is scored at the F2 generation. Lower panel: The ability of stress to reset heritable small RNAs depends on the generation during which stress is applied. Worms which were stressed two generations after the initiation of RNAi did not show any altered inheritance dynamics. The graph displays the measured GFP fluorescence levels of individual worms (y-axis) across generations under the indicated condition (x-axis). Each dot represents the value of an individual worm. Shown are the median of each group, with box limits representing the 25th (Q1) and 75th (Q3) percentiles, notch representing a 95% confidence interval, and whiskers indicating Q1-1.5*IQR and Q3+1.5*IQR. FDR-corrected values were obtained using Dunn’s test. Not significant (ns) indicates q ≥ 0.05 and (***) indicates q < 0.001 (see Materials and methods).
Figure 2
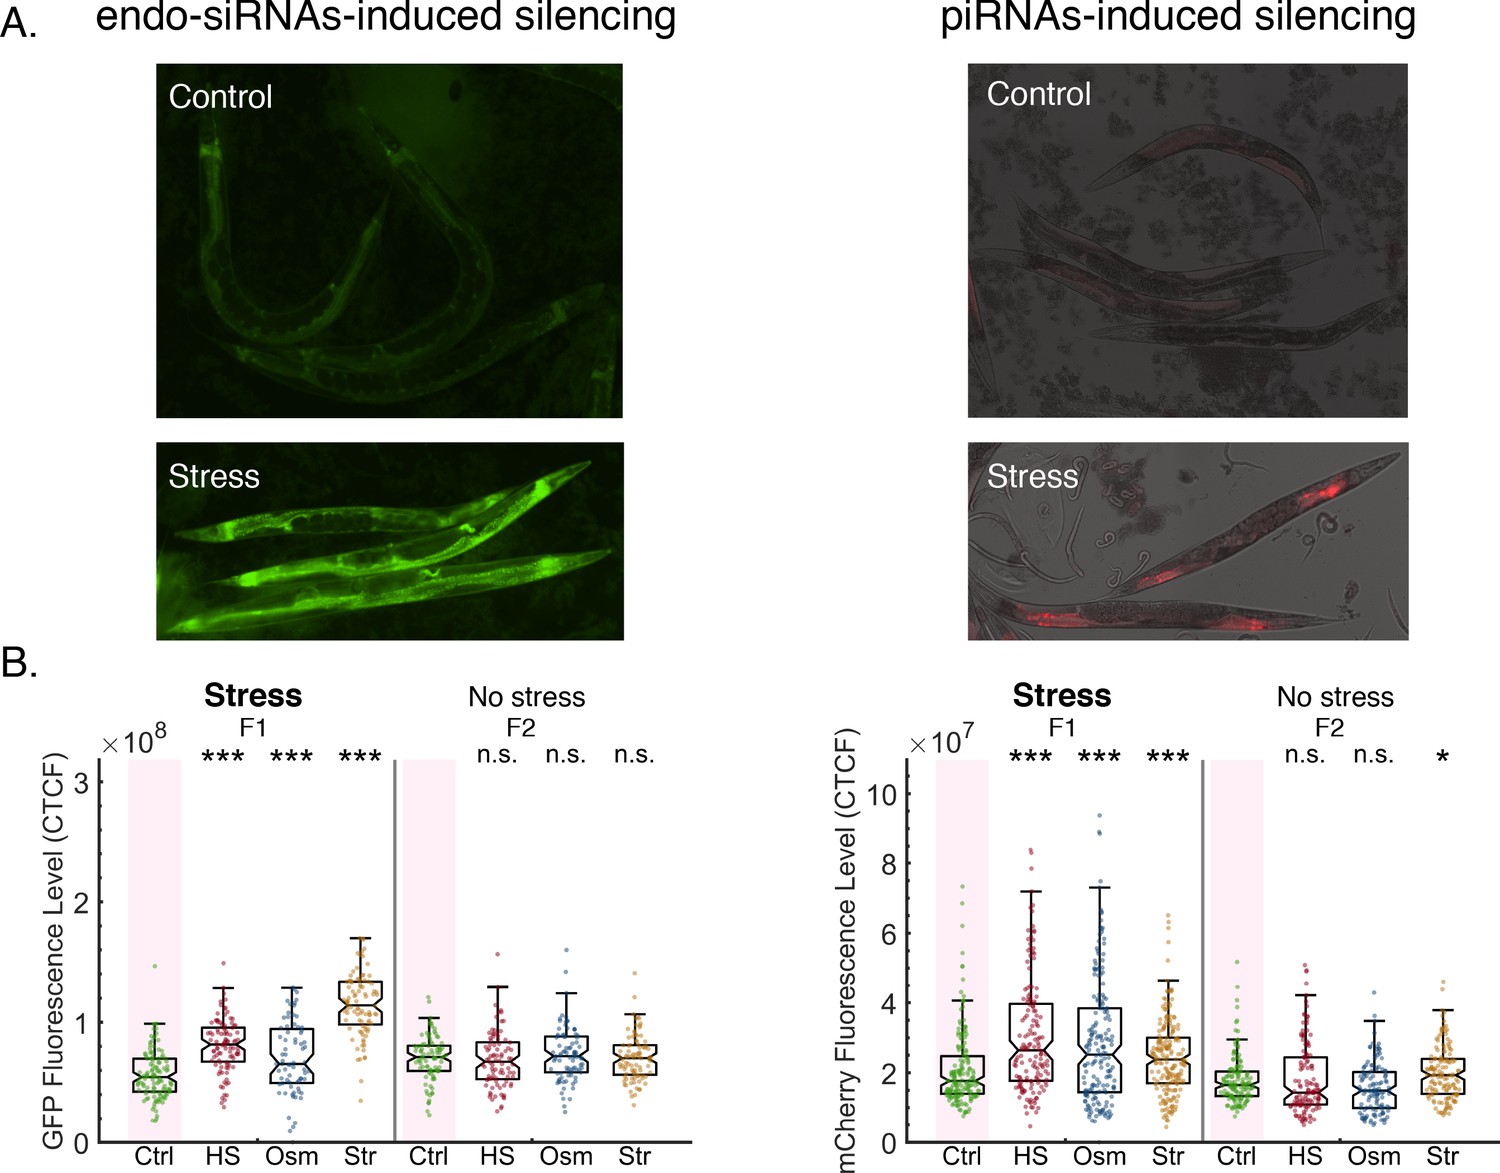
Stress resets endo-siRNAs and piRNAs-induced silencing.
(A) Representative images of worms expressing endo-siRNAs sensor (left) or the piRNAs sensor (right) under control or stress (HS) conditions. (B) The graph displays the measured GFP (left, endo-siRNAs sensor) or mCherry (right, piRNAs sensor) fluorescence levels of individual worms (y-axis) across generations under the indicated condition (x-axis). Each dot represents the value of an individual worm. Shown are the median of each group, with box limits representing the 25th (Q1) and 75th (Q3) percentiles, notch representing a 95% confidence interval, and whiskers indicating Q1-1.5*IQR and Q3+1.5*IQR. FDR-corrected values were obtained using Dunn’s test. Not significant (ns) indicates q ≥ 0.05, (*) indicates q < 0.05, and (***) indicates q < 0.001 (see Materials and methods).
Figure 3

Resetting of heritable small RNA responses is induced specifically by stress, also when experienced prior to initiation of RNAi.
(a) Shifting from stress to non-stress conditions fails to reset small RNA inheritance. Upper panel: Experimental scheme. Worms grown in regular growth conditions (20°C, control) or in high temperatures (25°C, stress) are exposed to an anti-gfp RNAi trigger. The next generation are then grown either in similar conditions (control to control, stress to stress) or transferred to the other growth condition (control to stress, stress to control). Lower panel: Stress, and not any change in the environment, resets heritable small RNAs. Worms which were exposed to high temperatures at the next generation reset the RNAi-induced gfp silencing regardless of the growth conditions at the previous generation. The graph displays the measured GFP fluorescence levels of individual worms (y-axis) under the indicated condition (x-axis). Each dot represents the value of an individual worm. Shown are the median of each group, with box limits representing the 25th (Q1) and 75th (Q3) percentiles, notch representing a 95% confidence interval, and whiskers indicating Q1-1.5*IQR and Q3+1.5*IQR. FDR-corrected values were obtained using Dunn’s test. Not significant (ns) indicates q ≥ 0.05, (**) indicates q < 0.01 and (***) indicate q < 0.001 (see Materials and methods). (b) Worms exposed to stress prior to the initiation of RNAi also reset the heritable response. Upper panel: Experimental scheme. In the generations prior to the RNAi trigger, worms were either grown in regular growth conditions, starved for one generation, or starved for three consecutive generations (P-3 – P-1). The worms were then exposed to an RNAi trigger (P0). The F1 progeny of previously starved worms were grown in regular growth conditions (‘Stress Before RNAi’, ‘Recurring Stress Before RNAi’). The F1 progeny of previously unstressed worms were grown in either regular growth (‘Ctrl’) conditions or were starved (‘Stress After RNAi’). All worms were then grown in regular growth conditions in the F2 generation. Lower panel: Stress, when experienced prior to the initiation of RNAi, also resets the heritable response. Worms which were exposed to starvation one or more generations before the initiation of RNAi reset the RNAi-induced gfp silencing in the next generations. The graph displays the measured GFP fluorescence levels of individual worms (y-axis) under the indicated condition (x-axis). Each dot represents the value of an individual worm. Shown are the median of each group, with box limits representing the 25th (Q1) and 75th (Q3) percentiles, notch representing a 95% confidence interval, and whiskers indicating Q1-1.5*IQR and Q3+1.5*IQR. FDR-corrected values were obtained using Dunn’s test. Not significant (ns) indicates q ≥ 0.05, (**) indicates q < 0.01 and (***) indicate q < 0.001 (see Materials and methods).
Figure 4
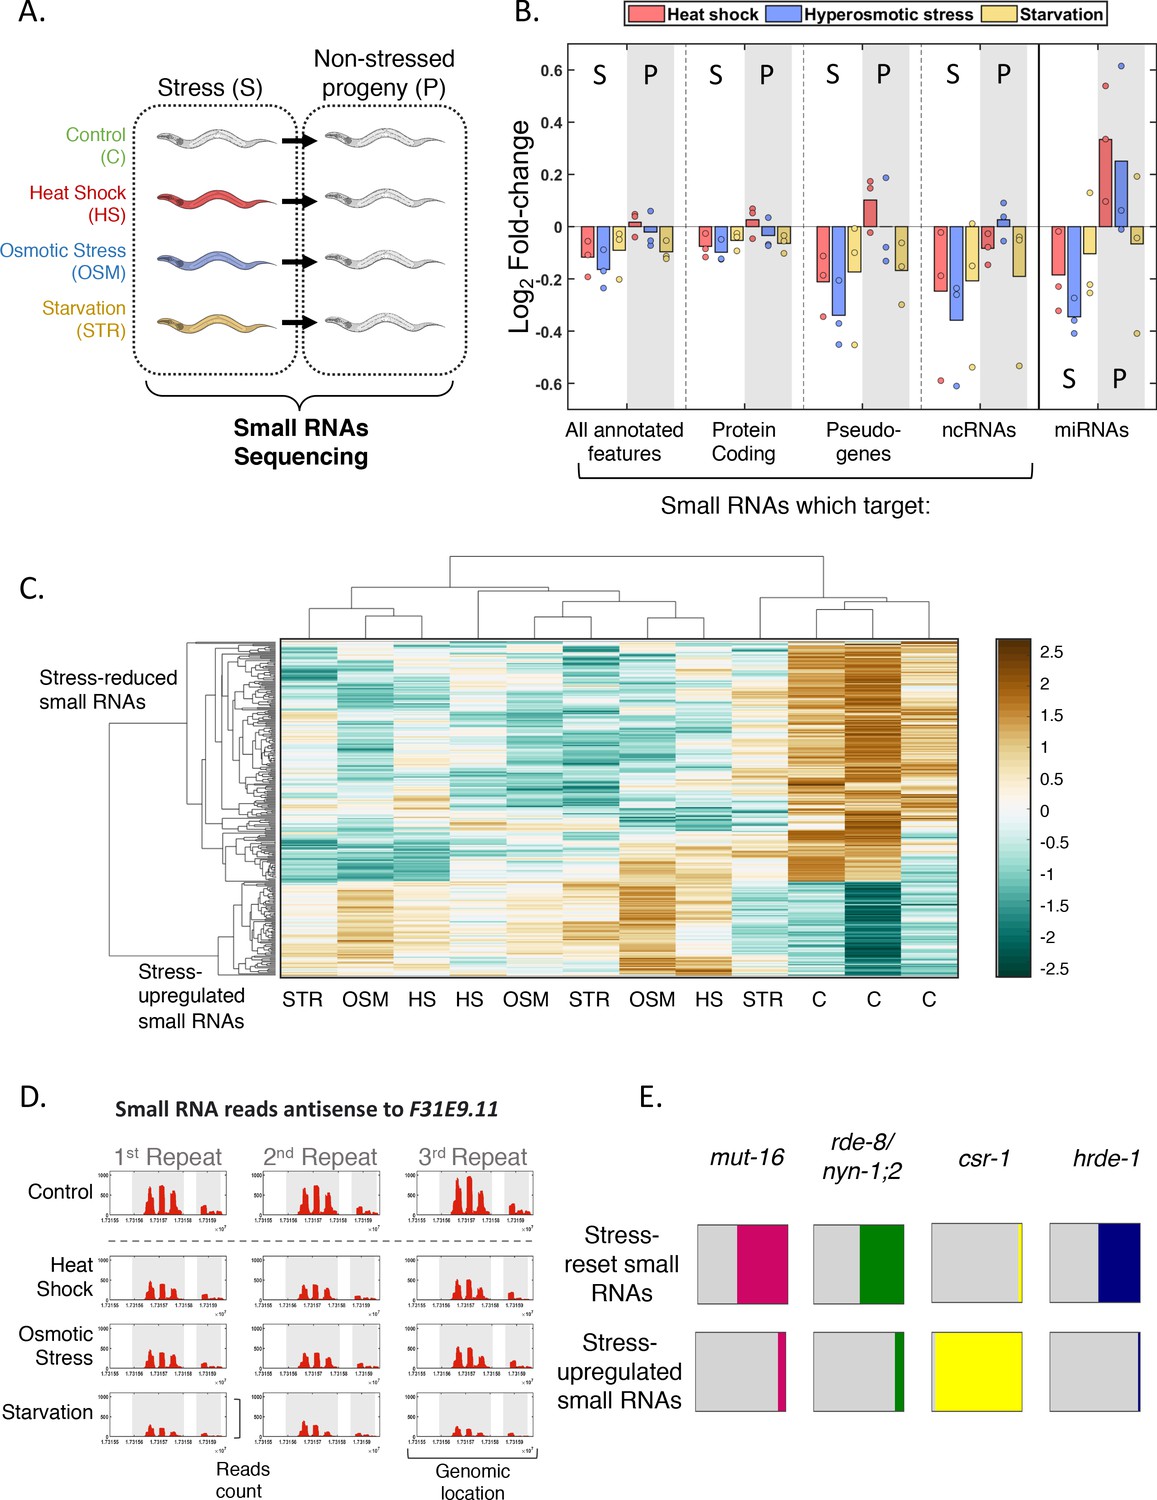
Genome-wide small RNA changes following stress.
(A) Experimental scheme. Worms were exposed to stress during their first larval stage and were collected for RNA extraction and small RNA sequencing on the first day of adulthood. The next generation was grown under normal conditions (see Materials and methods). (B) Changes in total small RNA levels aligning to various genomic features. Presented are the Log2 fold-change values (y-axis) for each condition (color coded) when compared to the control. Each dot represents one independent biological repeat. S = stressed generation. P = progeny (C) Clustering of the 281 stress-affected small RNA targets, based on their normalized total number of reads in each sample (four different conditions in three independent biological repeats). Hierarchical clustering was performed with Spearman's rank correlation as a distance metric and 'average' linkage. The data have been standardized across all columns for each gene, so that the mean is 0 and the standard deviation is 1. (D) An example of a stress-affected small RNAs target. The F31E9.11 gene is covered by small RNAs which are reset across all stress conditions. Shown are the normalized read counts (y-axis) as function of genomic location (x-axis) of small RNAs targeting the F31E9.11 gene. Exons appear on a gray background. (E) Overlap of targets of stress-affected small RNAs with known targets of different small RNA pathways. Each square represents the proportional overlap of reset (upper row) or upregulated (bottom row) small RNA targets with known targets of the indicated small RNA pathways. Shown are results for MUT-16-dependent small RNA targets (Zhang et al., 2011), NYN-1;2/RDE-8-dependent small RNA targets (Tsai et al., 2015), CSR-1-bound small RNA targets (Claycomb et al., 2009) and HRDE-1-bound small RNA targets (Buckley et al., 2012).
Figure 5 with 3 supplements
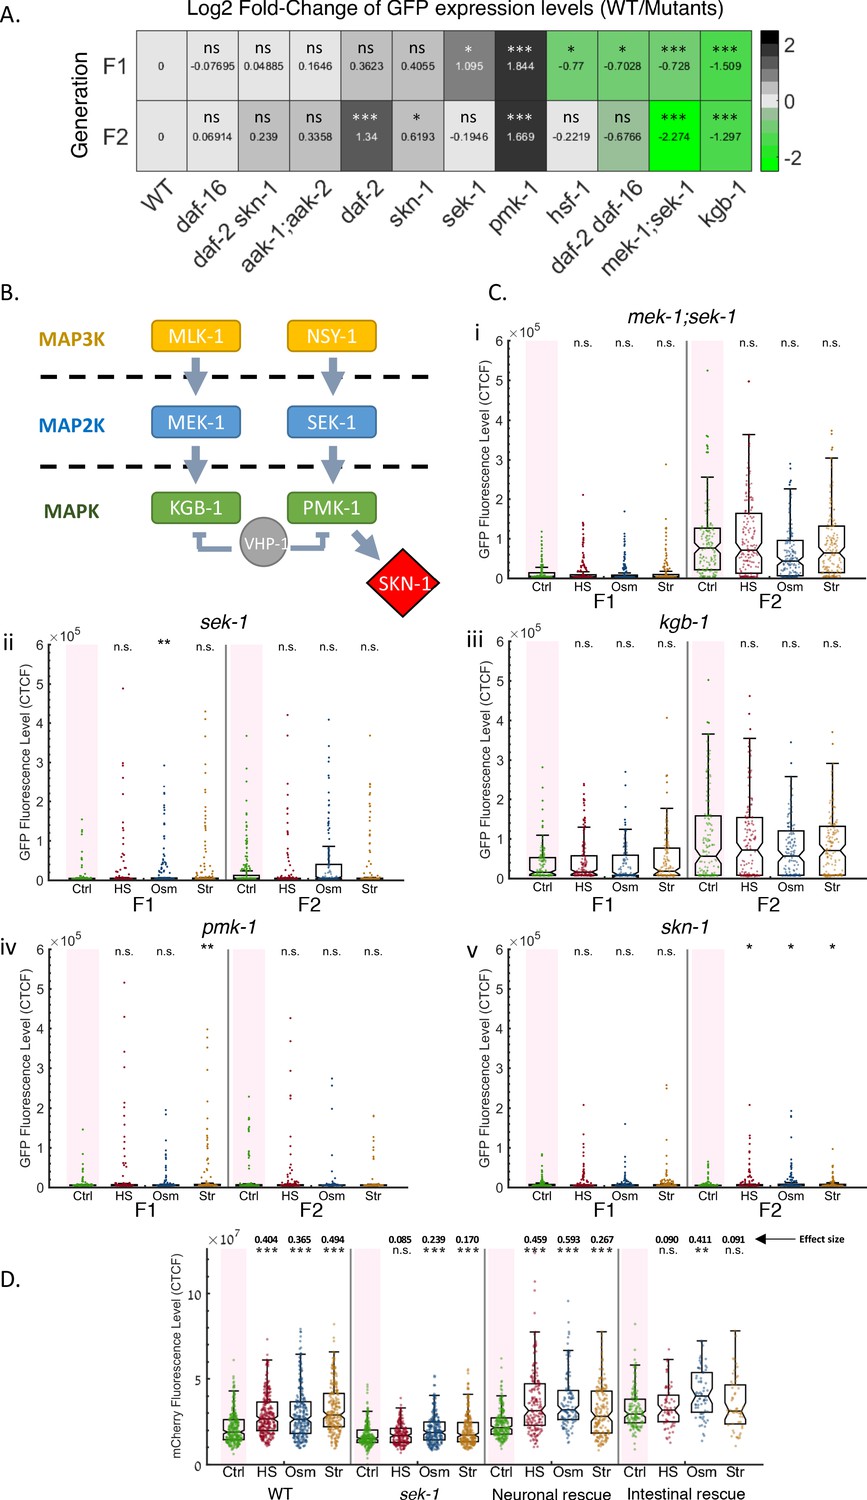
The MAPK pathway and the SKN-1 transcription factor regulate small RNAs resetting in response to stress.
(A) Mutants defective in stress-responsive genes display altered heritable RNAi dynamics. Heatmap representing the log2-fold change of GFP fluorescence levels (color coded and indicated values) in mutants worms compared to WT at the F1 (upper panel) and F2 (lower panel) generations after RNAi. Shown are results under normal conditions (no stress). FDR-corrected values were obtained using Dunn’s test. The comparison values of each mutant were calculated based on its independent experiments (see full results in Figure 5—figure supplements 1 and 2). (B) Members of C. elegans’ MAPK pathway, found to influence resetting of small RNAs. Based on Ewbank, 2006; Inoue et al., 2005; Kim et al., 2004; Mizuno et al., 2008 (C) Mutants defective in the MAPK signaling pathway do not reset heritable RNAi responses following stress. The graphs display the measured germline GFP fluorescence levels of mutant worms (y-axis) across generations under the indicated condition (x-axis). Each dot represents the value of an individual worm. Each mutant was examined in an independent experiment. Shown are the median of each group, with box limits representing the 25th (Q1) and 75th (Q3) percentiles, notch representing a 95% confidence interval, and whiskers indicating Q1-1.5*IQR and Q3+1.5*IQR. FDR-corrected values were obtained using Dunn’s test. Not significant (ns) indicates q ≥ 0.05, (*) indicates q < 0.05, (**) indicates q < 0.01, and (***) indicates q < 0.001, (see Materials and Methods). Full results (including the side-by-side wild-type results of each experiment) can be found in Figure 5—figure supplements 1 and 2. (D) Neuronal rescue of sek-1 is sufficient to restore stress-induced resetting of piRNAs-induced silencing. The graph displays the measured mCherry fluorescence levels of individual worms (y-axis) across generations under the indicated condition (x-axis). Each dot represents the value of an individual worm. Shown are the median of each group, with box limits representing the 25th (Q1) and 75th (Q3) percentiles, notch representing a 95% confidence interval, and whiskers indicating Q1-1.5*IQR and Q3+1.5*IQR. FDR-corrected values were obtained using Dunn’s test. Not significant (ns) indicates q ≥ 0.05, (**) indicates q < 0.01, and (***) indicates q < 0.001 (see Materials and methods). Effect size estimates (shown above the asterisks) were obtained using the Cliff’s Delta estimate (see Materials and methods).
Figure 5—figure supplement 1
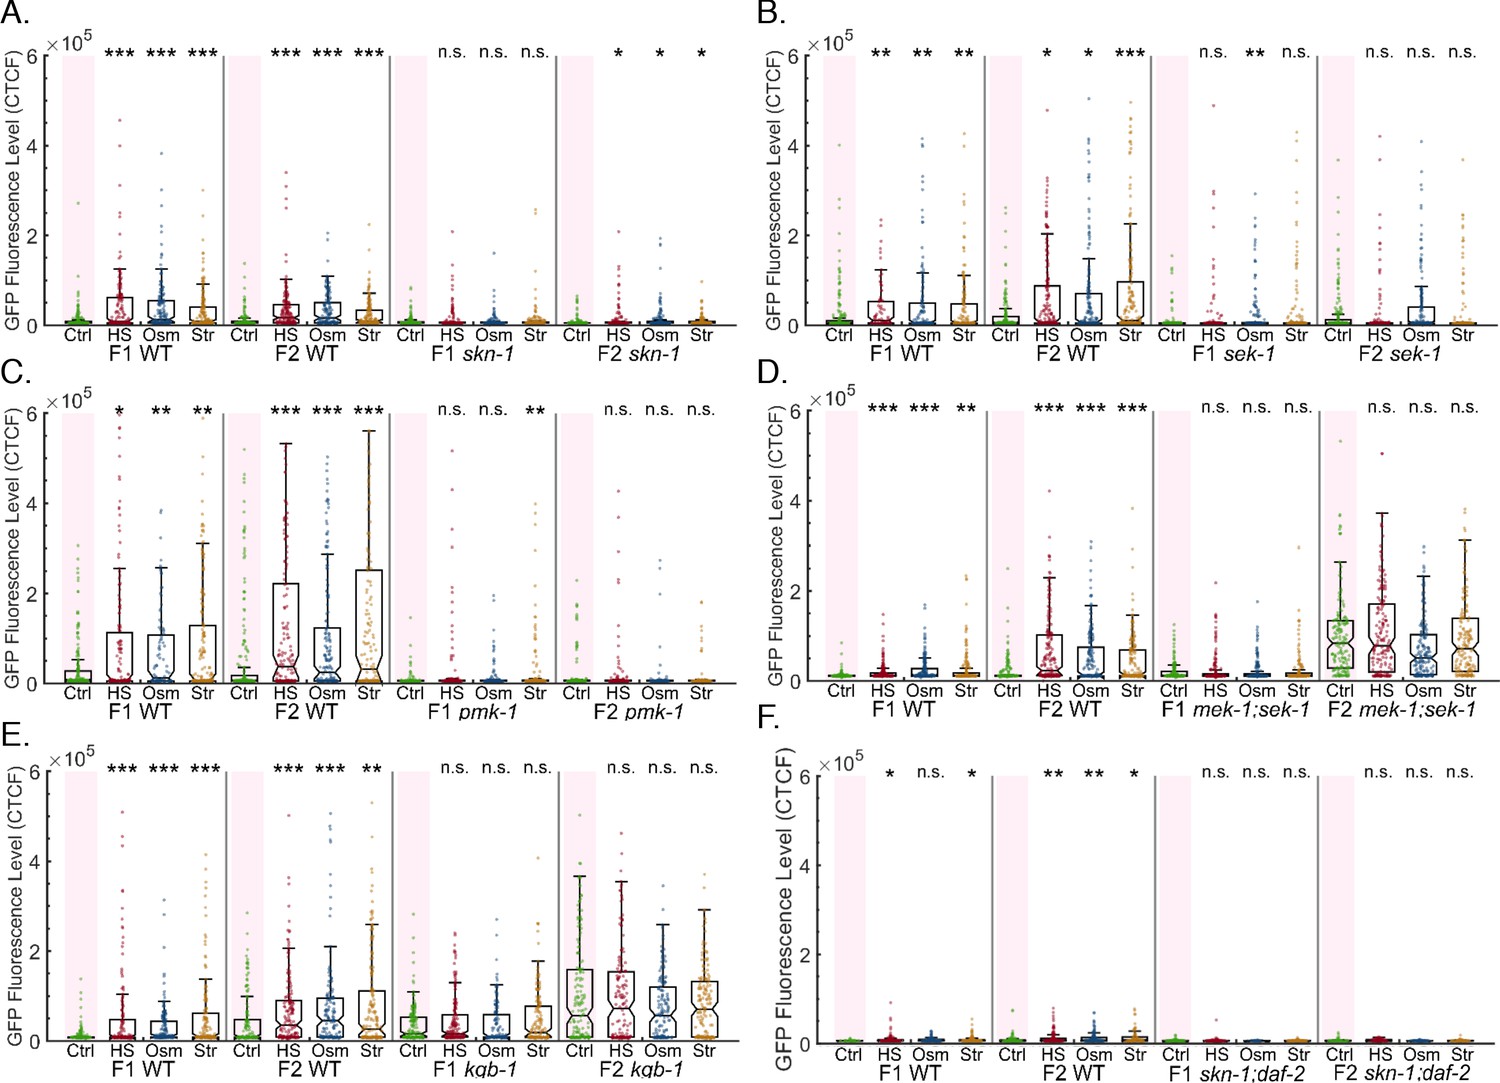
Multiple stress signaling and processing pathways affect heritable RNAi dynamics and stress-induced resetting of heritable silencing.
The graphs display the measured germline GFP fluorescence levels of mutant worms (y-axis) across generations under the indicated condition (x-axis). Each dot represents the value of an individual worm. Each mutant was examined in an independent experiment. Shown are the median of each group, with box limits representing the 25th (Q1) and 75th (Q3) percentiles, notch representing a 95% confidence interval, and whiskers indicating Q1-1.5*IQR and Q3+1.5*IQR. FDR-corrected values were obtained using Dunn’s test. Not significant (ns) indicates q ≥ 0.05, (*) indicates q < 0.05, (**) indicates q < 0.01, and (***) indicates q < 0.001, (see Materials and methods). Each mutant strain was examined side-by-side with WT worms. a.sek-1 mutants do not reset a heritable silencing response following stress b.pmk-1 mutants do not reset a heritable silencing response following stress c.mek/sek-1 mutants do not reset a heritable silencing response following stress d.kgb-1 mutants do not reset a heritable silencing response following stress e.skn-1 hypomorphs do not reset a heritable silencing response following stress f.skn-1;daf-2 double hypomorph mutants do not reset a heritable silencing response following stress.
Figure 5—figure supplement 2
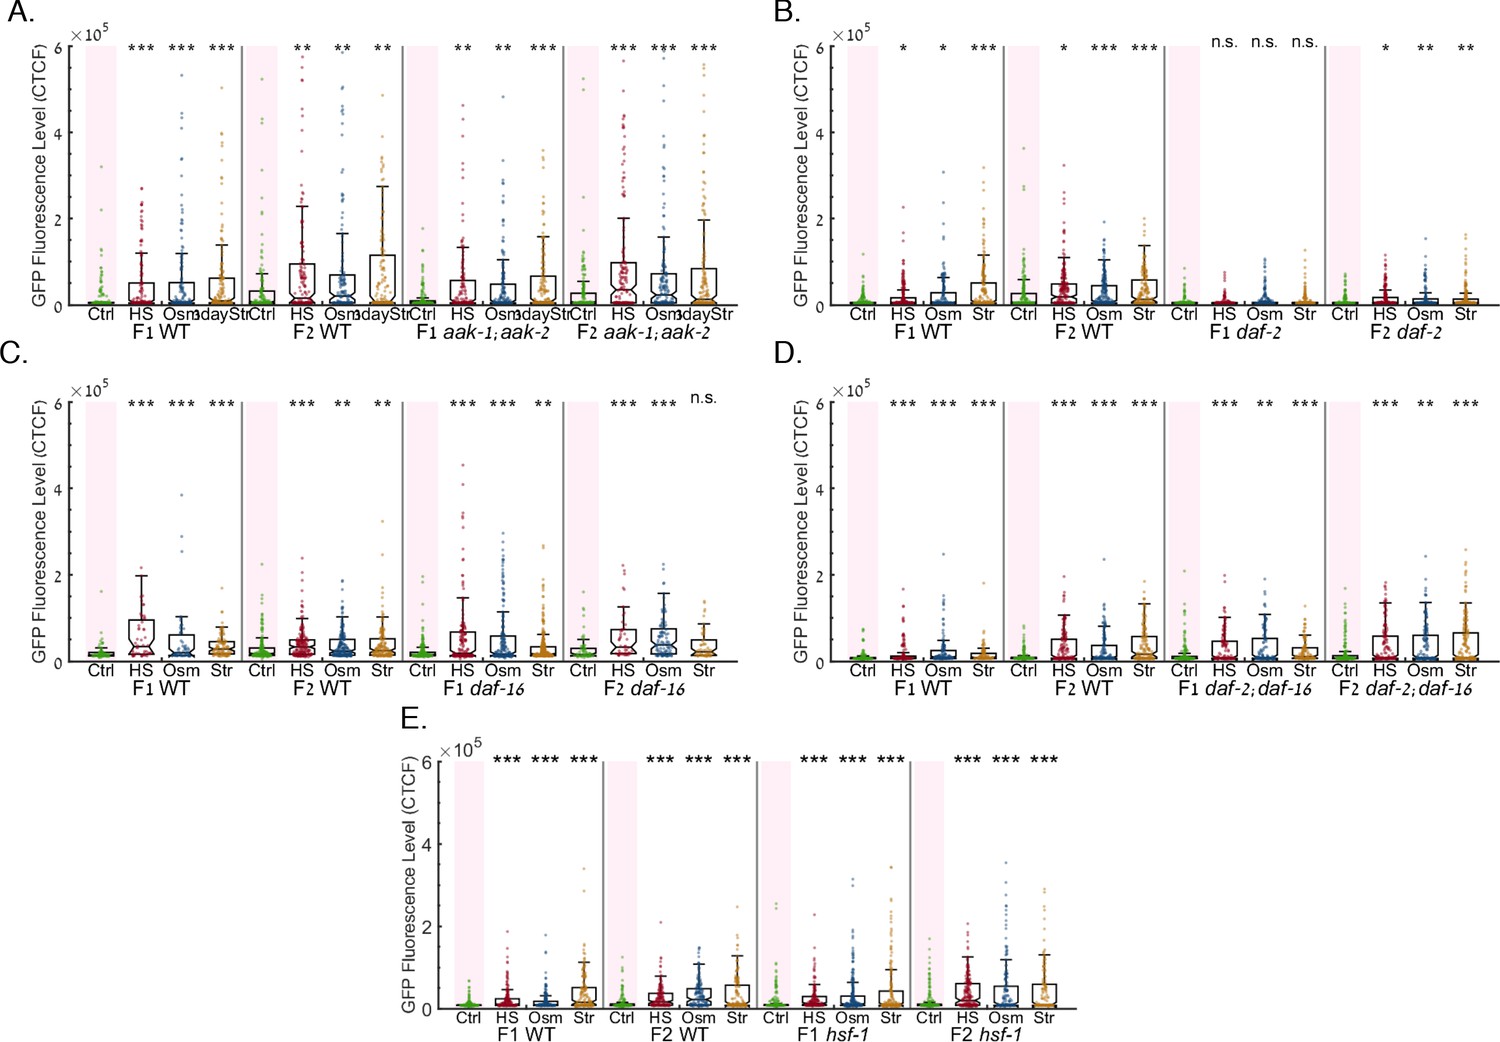
Mutants of the daf-16, aak-1/2 and daf-2 genes are capable of stress-induced resetting of heritable responses.
The graphs display the measured germline GFP fluorescence levels of mutant worms (y-axis) across generations under the indicated condition (x-axis). Each dot represents the value of an individual worm. Each mutant was examined in an independent experiment. Shown are the median of each group, with box limits representing the 25th (Q1) and 75th (Q3) percentiles, notch representing a 95% confidence interval, and whiskers indicating Q1-1.5*IQR and Q3+1.5*IQR. FDR-corrected values were obtained using Dunn’s test. Not significant (ns) indicates q ≥ 0.05, (*) indicates q < 0.05, (**) indicates q < 0.01, and (***) indicates q < 0.001, (see Materials and methods). Each mutant strain was examined side-by-side with WT worms. (a) daf-16 mutants show regular RNAi inheritance dynamics and reset a heritable silencing response following stress. (b) aak-1/2 mutants show regular RNAi inheritance dynamics and reset a heritable silencing response following stress. (c) daf-2 mutants show enhanced RNAi inheritance dynamics and reset a heritable silencing response following stress. (d) daf-2;daf-16 double mutants show defective RNAi inheritance dynamics and reset a heritable silencing response following stress. (e) hsf-1 mutants show defective RNAi inheritance dynamics and reset a heritable silencing response following stress.
Figure 5—figure supplement 3
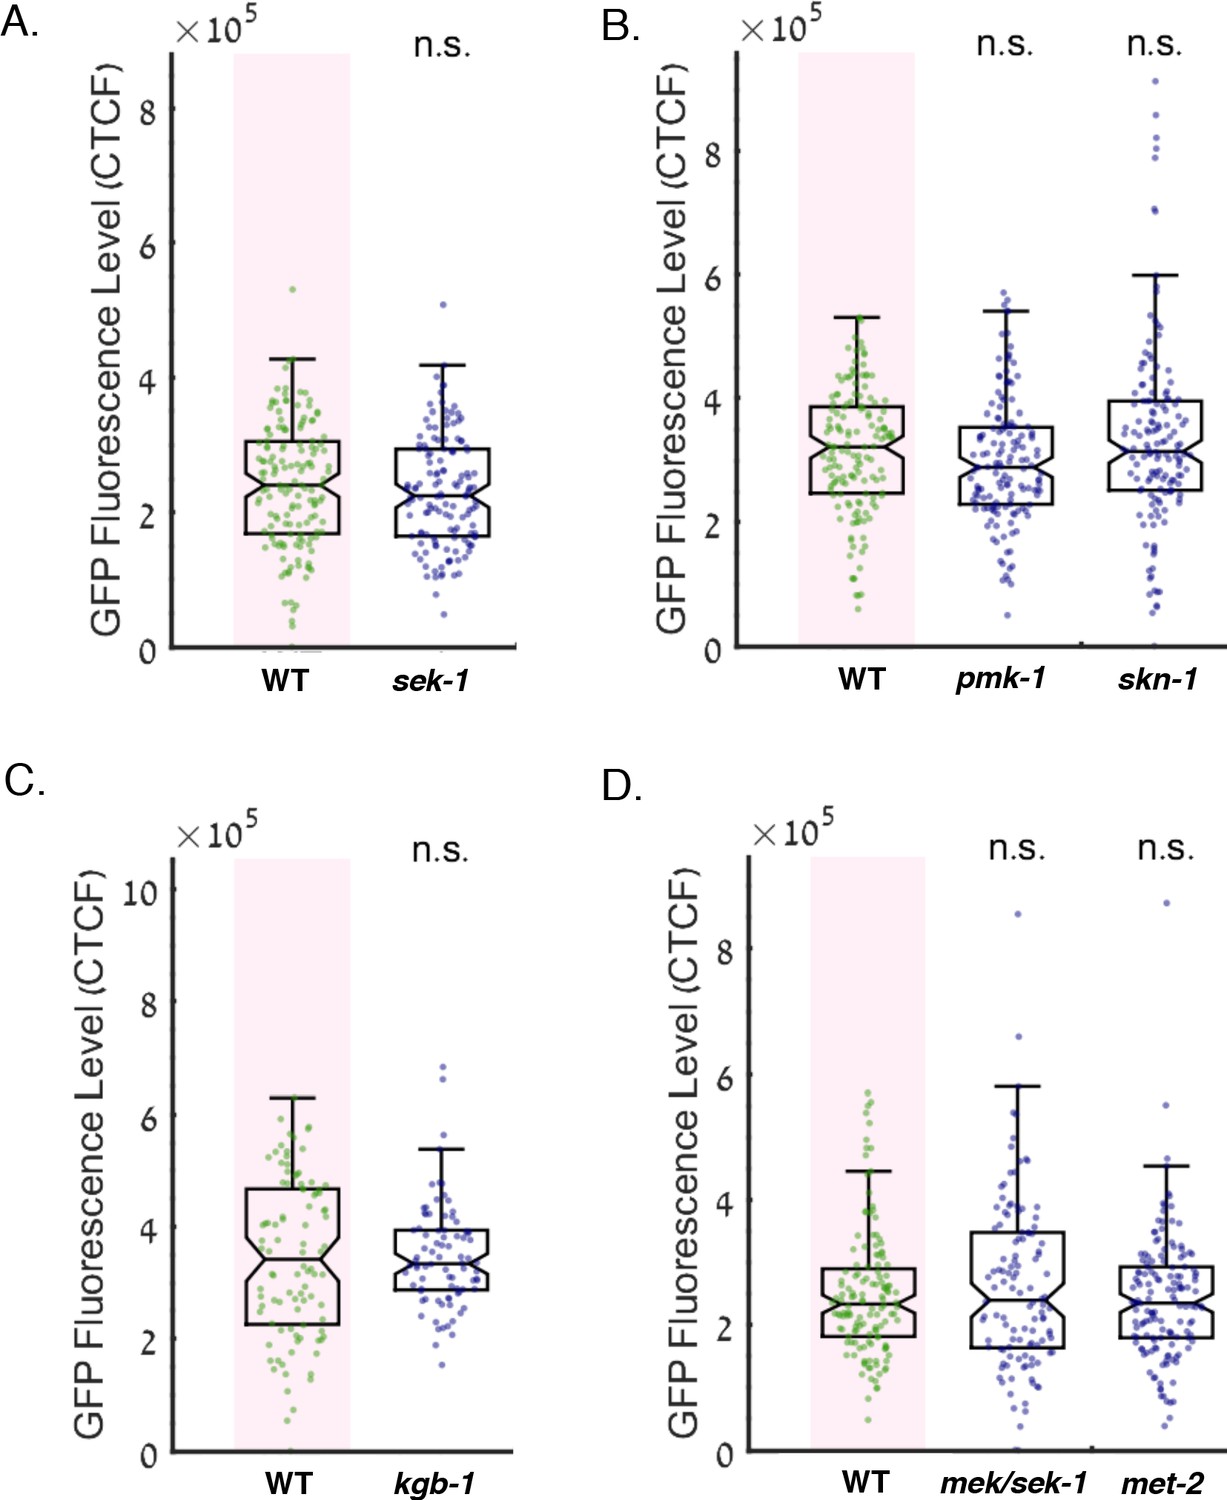
Mutants in the MAPK pathway, the transcription factor SKN-1, and the putative H3K9 methyltransferase MET-2 do not affect the basal expression of the GFP reporter.
The graphs display the measured germline GFP fluorescence levels of worms which were not exposed to RNAi (y-axis) under the indicated genotype (x-axis). Each dot represents the value of an individual worm. Shown are the median of each group, with box limits representing the 25th (Q1) and 75th (Q3) percentiles, notch representing a 95% confidence interval, and whiskers indicating Q1-1.5*IQR and Q3+1.5*IQR. FDR-corrected values were obtained using Dunn’s test. Not significant (ns) indicates q ≥ 0.05 (see Materials and methods). (A) Mutation in the gene sek-1 does not affect the basal expression level of the GFP reporter. (B) Mutation in the genes pmk-1 or skn-1 do not affect the basal expression level of the GFP reporter. (C) Mutation in the gene kgb-1 does not affect the basal expression level of the GFP reporter. (D) Mutation in the gene met-2 or double-mutation in the genes mek/sek-1 do not affect the basal expression level of the GFP reporter.
Figure 6 with 1 supplement
Stress-induced small RNA resetting depends on the H3K9 methyltransferase MET-2.
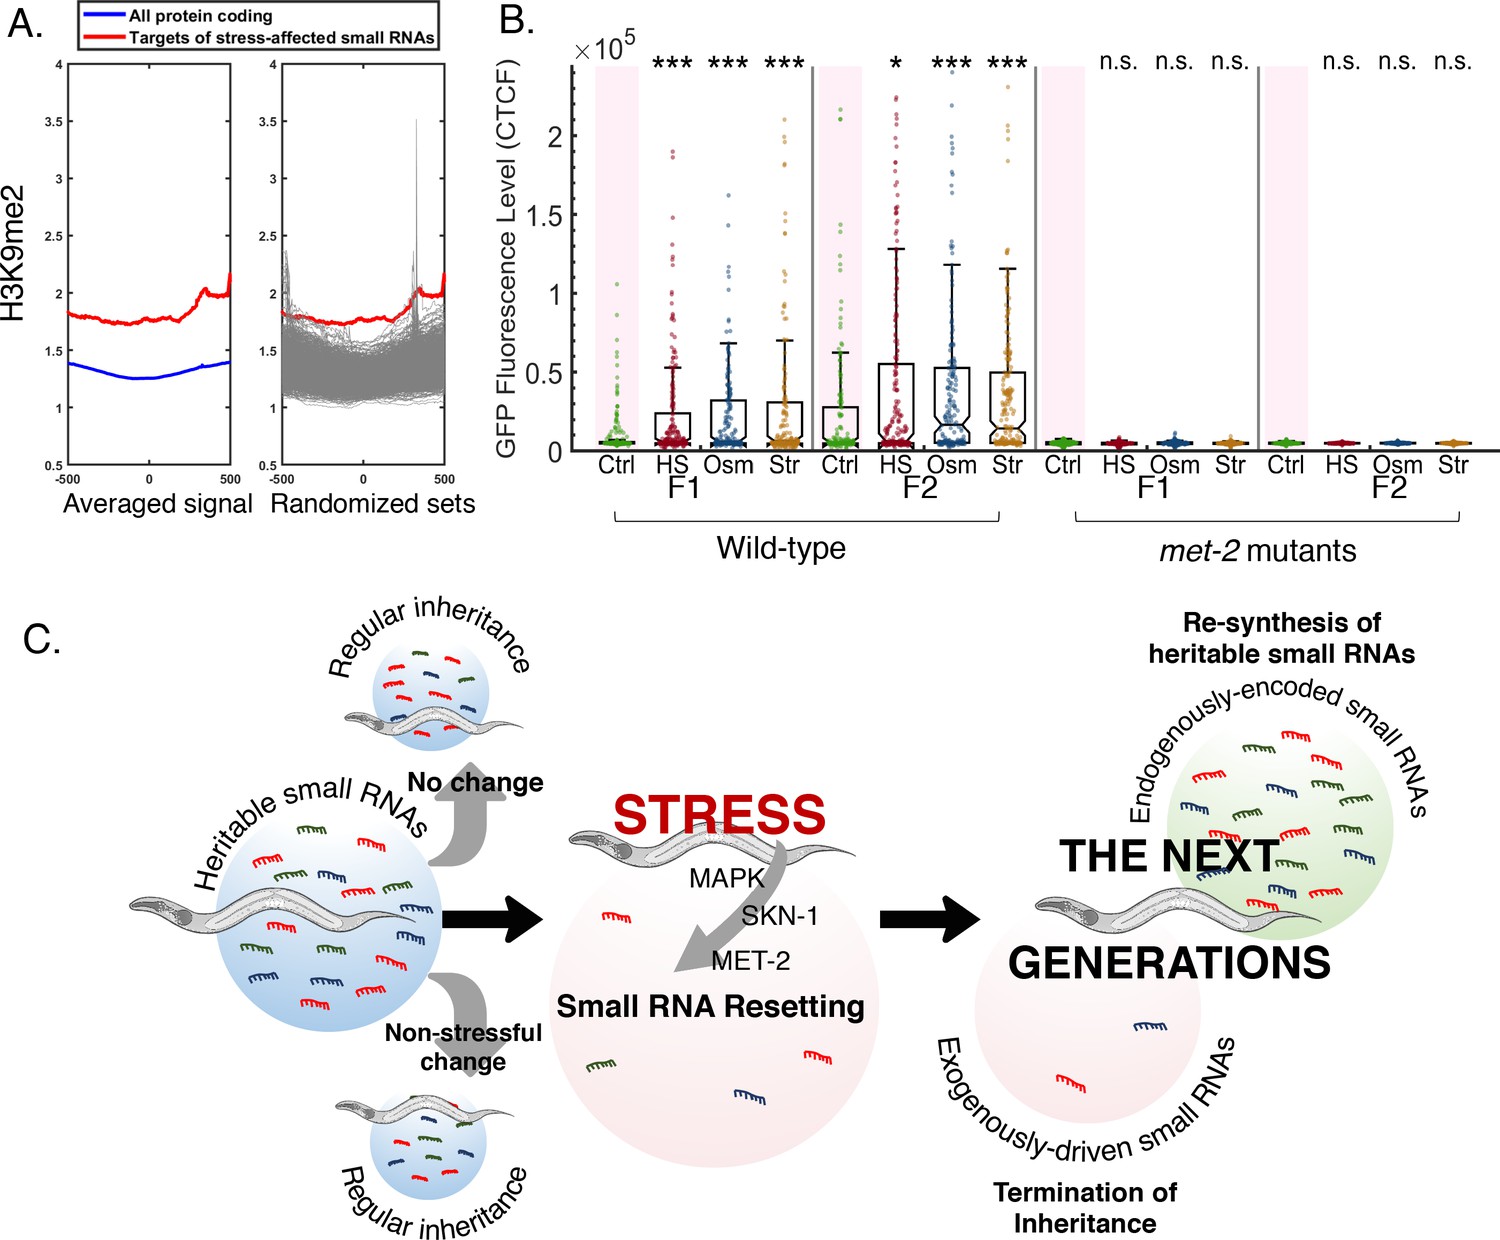
(A) Targets of stress-affected small RNAs show significantly increased H3K9me2 marks. An analysis of H3K9me2 signal (based on published data from McMurchy et al., 2017). Presented is the averaged H3K9me2 signal (y-axis) of all protein coding genes (blue) and target genes of stress-affected small RNAs (red). All genes are aligned according to their Transcription Start Sites (TSS), and the regions of 500 base pairs upstream and downstream of the TSS are shown on the x-axis. Each gray line (right panel) represents the average of a random set of genes (500 iterations) equal in size to the set of target genes of stress-affected small RNAs. (B) met-2 mutant worms do not reset heritable small RNAs in response to stress. The graph displays the measured germline GFP fluorescence levels of wild-type and met-2 mutant worms (y-axis) across generations under the indicated condition (x-axis). Each dot represents the value of an individual worm. Shown are the median of each group, with box limits representing the 25th (Q1) and 75th (Q3) percentiles, notch representing a 95% confidence interval, and whiskers indicating Q1-1.5*IQR and Q3+1.5*IQR. FDR-corrected values were obtained using Dunn’s test. Not significant (ns) indicates q ≥ 0.05, (*) indicates q < 0.05, and (***) indicates q < 0.001 (see Materials and methods). (C) A model summarizing stress-induced resetting of heritable small RNAs. Small RNAs from both endogenous and exogenous sources are reset in response to stress. Resetting is mediated by the MAPK pathway, the SKN-1 transcription factor and the H3K9 methyltransferase MET-2. Endogenous small RNAs which are encoded in the genome are re-synthesized in the next generations, while small RNAs from exogenous sources and transient responses are eliminated.
Figure 6—figure supplement 1
Targets of stress-affected small RNAs show unique H3K9 marks and the H3K9 methyltransferase met-2 is required for the execution of small RNA resetting.
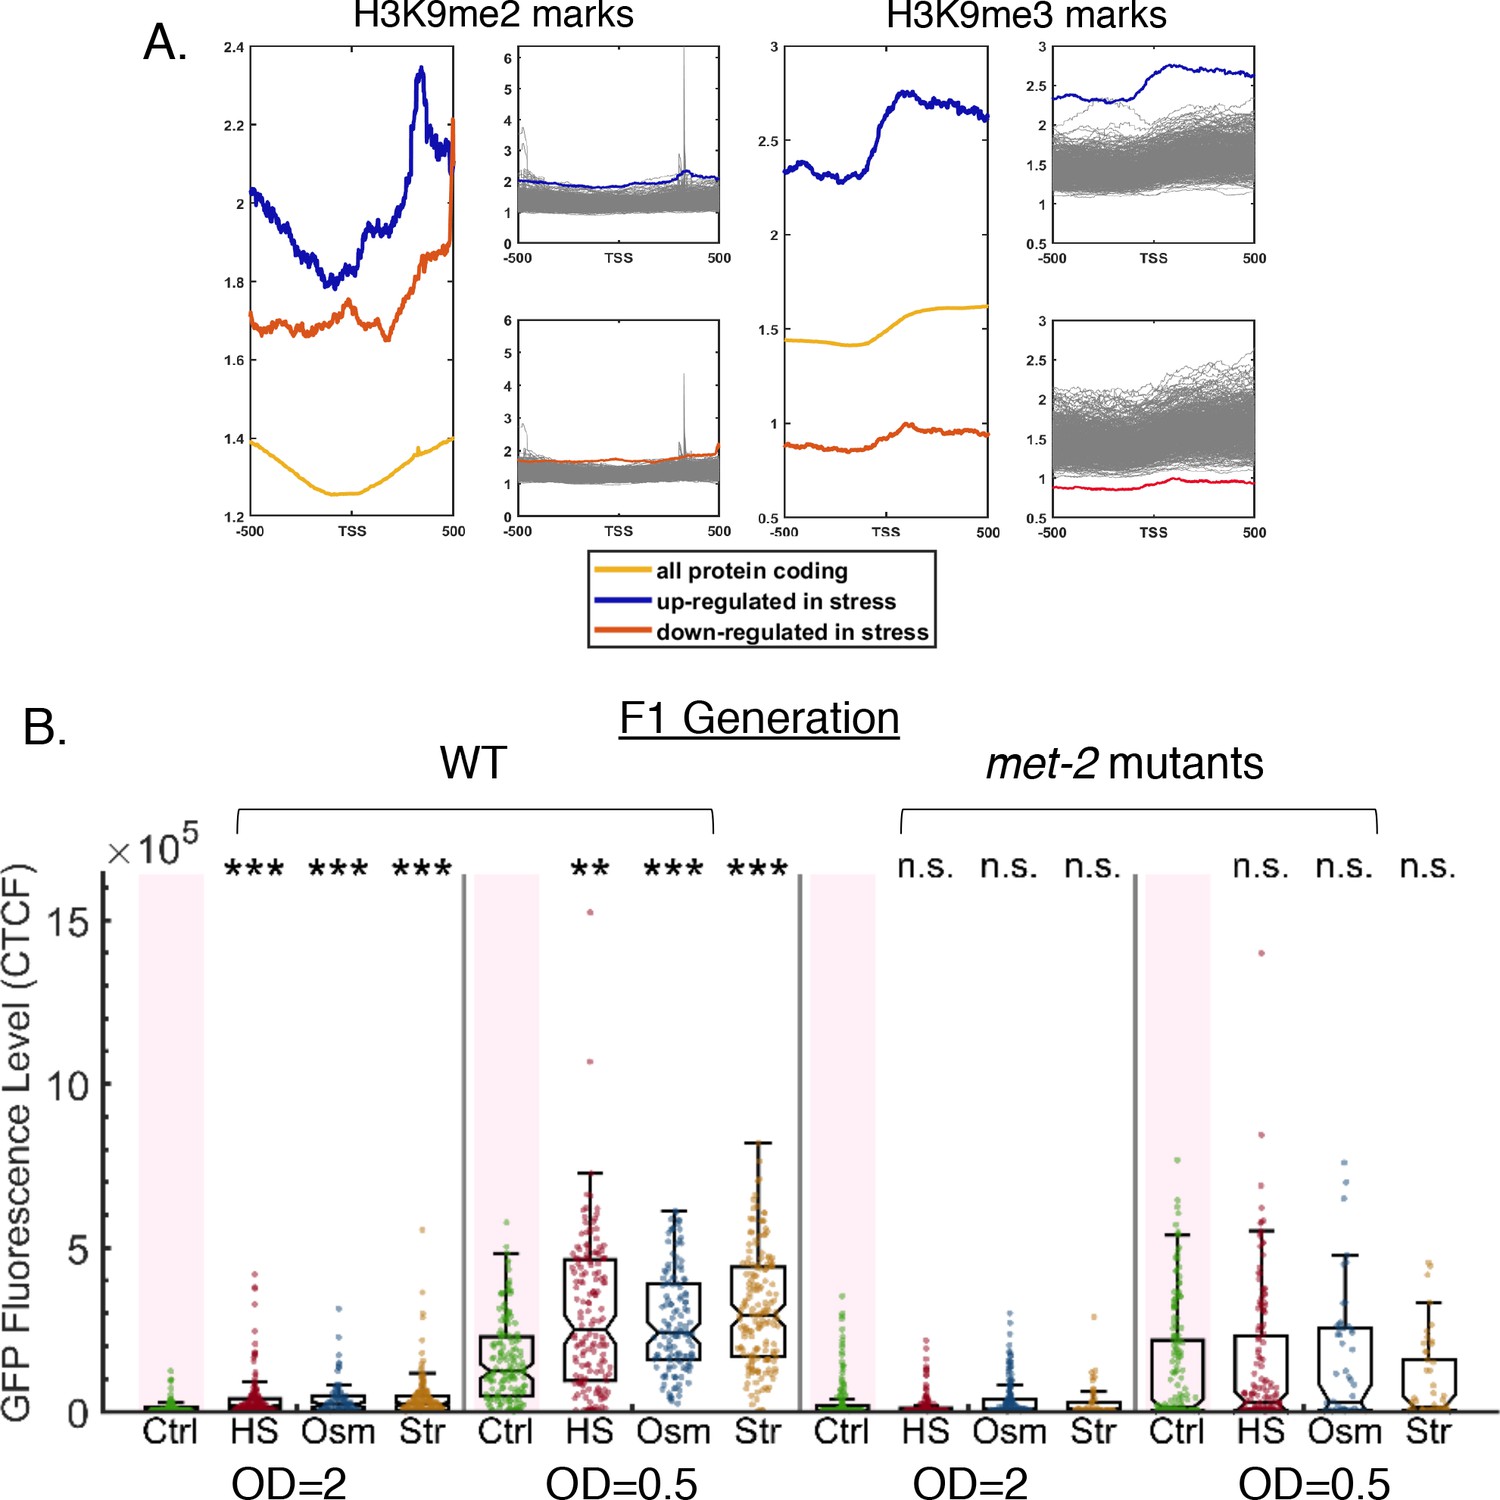
Refers to Figure 6. (A) Targets of stress-affected small RNAs show significantly different H3K9me2 and H3K9me3 marks. An analysis of H3K9me2 and H3K9me3 signals (based on published data from McMurchy et al., 2017). All genes are aligned according to their Transcription Start Sites (TSS), and the regions of 500 base pairs upstream and downstream of the TSS are shown on the x axis. The y axis shows the averaged signal of the H3K9me2 (left panel) and H3K9me3 (right panel) modifications as a function of distance from the TSS. The chromatin modification profile is shown for three genes sets: all protein coding (yellow), set of genes that are up-regulated in stress (blue) and set of genes that are down-regulated in stress (red). Each gray line represents the average of a random set of genes equal in size to the set of up-regulated (upper panels) or down-regulated (lower panels) genes. (B) met-2 mutants do not reset heritable silencing even when weaker RNAi inheritance responses are induced. WT and met-2 worms are exposed at the P0 generation to dsRNA-producing bacteria of varying concentrations (either OD = 2 or OD = 0.5) and examined for stress-induced resetting at the F1 generation. The graphs display the measured germline GFP fluorescence levels of WT and met-2 mutant worms (y-axis) under the indicated condition (x-axis). Each dot represents the value of an individual worm. Shown are the median of each group, with box limits representing the 25th (Q1) and 75th (Q3) percentiles, notch representing a 95% confidence interval, and whiskers indicating Q1-1.5*IQR and Q3+1.5*IQR. FDR-corrected values were obtained using Dunn’s test. Not significant (ns) indicates q ≥ 0.05, (**) indicates q < 0.01, and (***) indicates q < 0.001 (see Materials and methods).
Tables
Appendix 1—key resources table
| Reagent type (species) or resource | Designation | Source or reference | Identifiers | Additional information |
|---|---|---|---|---|
| Chemical compound, drug | Levamisole hydrochloride | Sigma | L0380000 | |
| Chemical compound, drug | Trizol Reagent | Life Technologies | 15596026 | |
| Chemical compound, drug | Phenol Chloroform Isoamyl | Sigma | P2069 | |
| Other | Heavy Phase Lock tube | QuantaBio | 23028330 | |
| Chemical compound, drug | Ultra Pure Glycogen | ThermoFisher | 10814010 | |
| Peptide, recombinant protein | RNA 5' Polyphosphatase | Epicenter | RP8092H | |
| Commercial assay, kit | NEBNext Multiplex Small RNA Library Prep Set for Illumina | New England Biolabs | E7300 | |
| Commercial assay, kit | TapeStation screen tapes | Agilent | 5067–5582 | |
| 5067–5588 | ||||
| Commercial assay, kit | TapeStation reagents | Agilent | 5067–5583 | |
| 5067–5589 | ||||
| Chemical compound, drug | E-Gel 4% agarose | Life Technologies | G401004 | |
| Commercial assay, kit | MinElute DNA purification kit | Qiagen | 28006 | |
| Chemical compound, drug | RNase free Nuclease-free water | Ambion | AM9932 | |
| Peptide, recombinant protein | NlaIII | New Englang BioLabs (NEB) | 631207 | |
| Commercial assay, kit | TG NextSeq 500/550 High Output Kit v2 (75 cycles) | Illumina | TG-160–2005 | |
| Strain, strain background (Caenorhabditis elegans) | C. elegans: Strain SX1263: unc-119(ed3) III; mex-5::gfp::h2b::tbb-2 II | The Eric Miska lab (Sapetschnig et al., 2015) | SX1263 | |
| Strain, strain background (C. elegans) | C. elegans: Strain EG6089: unc-119(ed3) III; oxTi38[cb-unc-119(+) Ppie-1::GFP] IV | The Eric Miska lab (Sapetschnig et al., 2015) | EG6089 | |
| Strain, strain background (C. elegans) | C. elegans: Strain JA1527: weSi14 [Pmex-5::mCherry::(Gly)5Ala/his-58/tbb-2 3′UTR; cb-unc-119(+)] IV | The Julie Ahringer lab (Zeiser et al., 2011) | JA1527 | |
| Strain, strain background (C. elegans) | C. elegans: Strain GR1720: mgSi4 [(pCMP2) ubl-1p::GFP::siR-1-sensor-ubl-1–3'UTR + Cbr-unc-119(+)] IV | Caenorhabditis Genetics Center | WB strain: GR1720 | |
| Strain, strain background (C. elegans) | C. elegans: Strain KB3: kgb-1 (um3) IV | Caenorhabditis Genetics Center | KB3 | |
| Strain, strain background (C. elegans) | C. elegans: Strain KB3: kgb-1 (um3) IV crossed with Strain SX1263 | This study | ||
| Strain, strain background (C. elegans) | C. elegans: Strain FK171: mek-1(ks54); sek-1(qd127) | Caenorhabditis Genetics Center | FK171 | |
| Strain, strain background (C. elegans) | C. elegans: Strain FK171: mek-1(ks54); sek-1(qd127) X crossed with Strain SX1263 | This study | ||
| Strain, strain background (C. elegans) | C. elegans: Strain CF1038: daf-16(mu86) I | Caenorhabditis Genetics Center | CF1038 | |
| Strain, strain background (C. elegans) | C. elegans: Strain CF1038: daf-16(mu86) I, crossed with Strain SX1263 | This study | ||
| Strain, strain background (C. elegans) | C. elegans: Strain KU4: sek-1(km4) X | Caenorhabditis Genetics Center | KU4 | |
| Strain, strain background (C. elegans) | C. elegans: Strain KU4: sek-1(km4) X, crossed with Strain SX1263 | This study | ||
| Strain, strain background (C. elegans) | C. elegans: Strain KU25: pmk-1(km25) IV | Caenorhabditis Genetics Center | KU25 | |
| Strain, strain background (C. elegans) | C. elegans: Strain KU25: pmk-1(km25) IV, crossed with Strain SX1263 | This study | ||
| Strain, strain background (C. elegans) | C. elegans: Strain MR1175: aak-1(tm1944) III, aak-2(ok524) X | The Richard Roy lab (Demoinet et al., 2017) | MR1175 | |
| Strain, strain background (C. elegans) | C. elegans: Strain MR1175: aak-1(tm1944) III, aak-2(ok524) X, crossed with Strain SX1263 | This study | ||
| Strain, strain background (C. elegans) | C. elegans: Strain PS355: hsf-1(sy441) I | Caenorhabditis Genetics Center | PS355 | |
| Strain, strain background (C. elegans) | C. elegans: Strain PS355: hsf-1(sy441) I, crossed with Strain SX1263 | This study | ||
| Strain, strain background (C. elegans) | C. elegans: Strain CB1370: daf-2(e1370) III | Caenorhabditis Genetics Center | CB1370 | |
| Strain, strain background (C. elegans) | C. elegans: Strain CB1370: daf-2(e1370) III, crossed with Strain EG6089 | This study | ||
| Strain, strain background (C. elegans) | C. elegans: Strain QV225: skn-1(zj15) IV | Caenorhabditis Genetics Center | QV225 | |
| Strain, strain background (C. elegans) | C. elegans: Strain QV225: skn-1(zj15) IV, crossed with Strain SX1263 | This study | ||
| Strain, strain background (C. elegans) | C. elegans: Strain MT13293: met-2(n4256) III | Caenorhabditis Genetics Center | MT13293 | |
| Strain, strain background (C. elegans) | C. elegans: Strain MT13293: met-2(n4256) III, crossed with Strain SX1263 | This study | ||
| Strain, strain background (C. elegans) | C. elegans: Strain RB1789: met-2(ok2307) III | Caenorhabditis Genetics Center | RB1789 | |
| Strain, strain background (C. elegans) | C. elegans: Strain RB1789: met-2(ok2307) III, crossed with Strain SX1263 | This study | ||
| Strain, strain background (C. elegans) | C. elegans: Strain KU4: sek-1(km4) X, crossed with strain JA1527 | This study | ||
| Strain, strain background (C. elegans) | C. elegans: Strain ZD202: sek-1(km4) X; qdEx8[unc-119p::sek-1(cDNA)::GFP::unc-54–3' UTR + myo-2p::mStrawberry::unc-54–3' UTR], crossed with strain JA1527 | This study | ||
| Strain, strain background (C. elegans) | C. elegans: Strain ZD193: sek-1(km4) X; qdEx4 [ges-1p::sek-1(cDNA)::GFP::unc-54–3' UTR + myo-2p::mStrawberry::unc-54–3' UTR], crossed with strain JA1527 | This study | ||
| Strain, strain background (C. elegans) | C. elegans: Strain OH14221: met-2(ot861[met-2::mKate2]) III | Caenorhabditis Genetics Center (Patel and Hobert, 2017) | OH14221 | |
| Strain, strain background (C. elegans) | C. elegans: Strain OH14221: met-2(ot861[met-2::mKate2]) III crossed with strain QV225 | This study | ||
| Sequence-based reagent | PCR 1-FWD: mek-1/sek-1 | IDT | TTTCCATCAACTCAGTCGCCG | |
| Sequence-based reagent | PCR 1-REV1: mek-1/sek-1 | IDT | TTCATTAGTCAATTGGGTCAG | |
| Sequence-based reagent | PCR 1-REV2: mek-1/sek-1 | IDT | CACTTTTCAATTAAGGTACAAC | |
| Sequence-based reagent | PCR 2-FWD: kgb-1 | IDT | CCCTACTTTATAATGAGATGC | |
| Sequence-based reagent | PCR 2-REV1: kgb-1 | IDT | TTCATTAGTCAATTGGGTCAG | |
| Sequence-based reagent | PCR 2-REV2: kgb-1 | IDT | CACTTTTCAATTAAGGTACAAC | |
| Sequence-based reagent | PCR 3-FWD: daf-16 | IDT | GTTCAGTAGACGGTGACCATCT | |
| Sequence-based reagent | PCR 3-REV1: daf-16 | IDT | GCTTCGGCTTGAAAGATCAGTG | |
| Sequence-based reagent | PCR 3-REV2: daf-16 | IDT | GTACGCCGTGGTCCGACTA | |
| Sequence-based reagent | PCR 4-FWD: skn-1 | IDT | GAAGAGAATGCTCGATATGAAG | |
| Sequence-based reagent | PCR 4-REV: skn-1 | IDT | TTTCAGTCGTTTATAAGAGAGC | |
| Sequence-based reagent | PCR 5-FWD: aak-1 | IDT | ATCGATACGGAACCAACTG | |
| Sequence-based reagent | PCR 5-REV: aak-1 | IDT | GGGTATGGTAGTACCAATAGG | |
| Sequence-based reagent | PCR 6-FWD: aak-2 | IDT | CGATAGCACAGACAACAGTTCG | |
| Sequence-based reagent | PCR 6-REV: aak-2 | IDT | GATGGTGGCCCTCTTCATC | |
| Sequence-based reagent | PCR 7-FWD1: daf-18 | IDT | AGGGTAATGCATTTCAGCAC | |
| Sequence-based reagent | PCR 7-FWD2: daf-18 | IDT | CCCGCATATAAACTGGAAATGTG | |
| Sequence-based reagent | PCR 7-REV: daf-18 | IDT | CAAATACGTCAGTTTCAACGTG | |
| Sequence-based reagent | PCR 8-FWD: pmk-1 | IDT | CTATAAGTTGCCATGACCTC | |
| Sequence-based reagent | PCR 8-REV: pmk-1 | IDT | GCTCCCATCAACATTGATAC | |
| Sequence-based reagent | PCR 9-FWD1: sek-1 | IDT | CTAGAATAAGTGCTATGCTAG | |
| Sequence-based reagent | PCR 9-FWD2: sek-1 | IDT | GTTGTCTAAGTATAATTGTCC | |
| Sequence-based reagent | PCR 9-REV: sek-1 | IDT | TGATTGATTATAACTACGAGG | |
| Sequence-based reagent | PCR 10-FWD1: met-2 | IDT | TTTACTGTCACATCACCTGC | |
| Sequence-based reagent | PCR 10-FWD2: met-2 | IDT | AAGCAGATGTTTGTCAGAATCC | |
| Sequence-based reagent | PCR 10-REV: met-2 | IDT | AGCAGCATTCATCTTCGC | |
| Software, algorithm | FastQC | Andrews, 2010 | ||
| Software, algorithm | Cutadapt | Martin, 2011 | ||
| Software, algorithm | Shortstack | Shahid and Axtell, 2014 | ||
| Software, algorithm | HTSeq count | Anders et al., 2014 | ||
| Software, algorithm | R Deseq2 | Love et al., 2014 | ||
| Software, algorithm | RNAlysis | Teichman, 2019 | Version 1.3.5 | |
| Software, algorithm | Fiji | Schindelin et al., 2012 | ||
| Software, algorithm | MATLAB R2018b | MATLAB | Version R2018b | |
| Software, algorithm | IoSR-Surry MatlabToolbox (BoxPlot function) | Institute of Sound Recording, University of Surrey | https://github.com/IoSR-Surrey/MatlabToolbox | Version 2.8 |
| Software, algorithm | GraphPad Prism 8 | GraphPad Software | http://www.graphpad.com/ | Version 8.0.0 |
Additional files
-
Supplementary file 1
A total of 281 targets of small RNAs which were affected across all stress conditions at the stress generation.
Table presents DESeq2 comparison of Control vs. Stress samples. Related to Figure 4.
- https://cdn.elifesciences.org/articles/65797/elife-65797-supp1-v2.csv
-
Supplementary file 2
Ten targets of small RNAs which were affected across all stress conditions at the next generation.
Table presents DESeq2 comparison of Control vs. Stress samples. Related to Figure 4.
- https://cdn.elifesciences.org/articles/65797/elife-65797-supp2-v2.csv
-
Supplementary file 3
Enrichment table for the 281 targets of stress-affected genes, generated using WormExp (Yang et al., 2016).
Related to Figure 4.
- https://cdn.elifesciences.org/articles/65797/elife-65797-supp3-v2.csv
-
Supplementary file 4
Seventy-three epigenetic-related genes significantly downregulated under all stress conditions.
- https://cdn.elifesciences.org/articles/65797/elife-65797-supp4-v2.csv
-
Supplementary file 5
Thirty-five epigenetic-related skn-1-dependent stress-dependent genes.
- https://cdn.elifesciences.org/articles/65797/elife-65797-supp5-v2.csv
-
Supplementary file 6
Enrichment table for skn-1-dependent stress-dependent genes, generated using RNAlysis (Teichman, 2019).
- https://cdn.elifesciences.org/articles/65797/elife-65797-supp6-v2.csv
-
Supplementary file 7
Sixty-three epigenetic-related genes whose putative promoter regions contain the binding motif sequence of SKN-1, generated using TF2DNA (Pujato et al., 2014).
- https://cdn.elifesciences.org/articles/65797/elife-65797-supp7-v2.csv
-
Transparent reporting form
- https://cdn.elifesciences.org/articles/65797/elife-65797-transrepform-v2.docx
Download links
A two-part list of links to download the article, or parts of the article, in various formats.
Downloads (link to download the article as PDF)
Open citations (links to open the citations from this article in various online reference manager services)
Cite this article (links to download the citations from this article in formats compatible with various reference manager tools)
Stress resets ancestral heritable small RNA responses
eLife 10:e65797.
https://doi.org/10.7554/eLife.65797


