SARS-CoV-2 requires cholesterol for viral entry and pathological syncytia formation
- Department of Chemical and Biological Engineering, Princeton University, United States
- Princeton University Small Molecule Screening Center, Princeton University, United States
- Department of Chemistry, Princeton University, United States
- Department of Microbiology, Boston University School of Medicine, United States
- National Emerging Infectious Diseases Laboratories, Boston University, United States
- Department of Molecular Physiology and Biological Physics, University of Virginia, United States
- Department of Molecular Biology, Princeton University, United States
- Department of Biochemistry, Boston University School of Medicine, United States
- Department of Biochemistry and Molecular Biophysics, Washington University School of Medicine, United States
- Department of Pathology, Brigham and Women’s Hospital and Harvard Medical School, United States
- Pulmonary and Critical Care Medicine, Brigham and Women’s Hospital and Harvard Medical School, United States
- Howard Hughes Medical Institute, United States
Figures
Figure 1 with 4 supplements
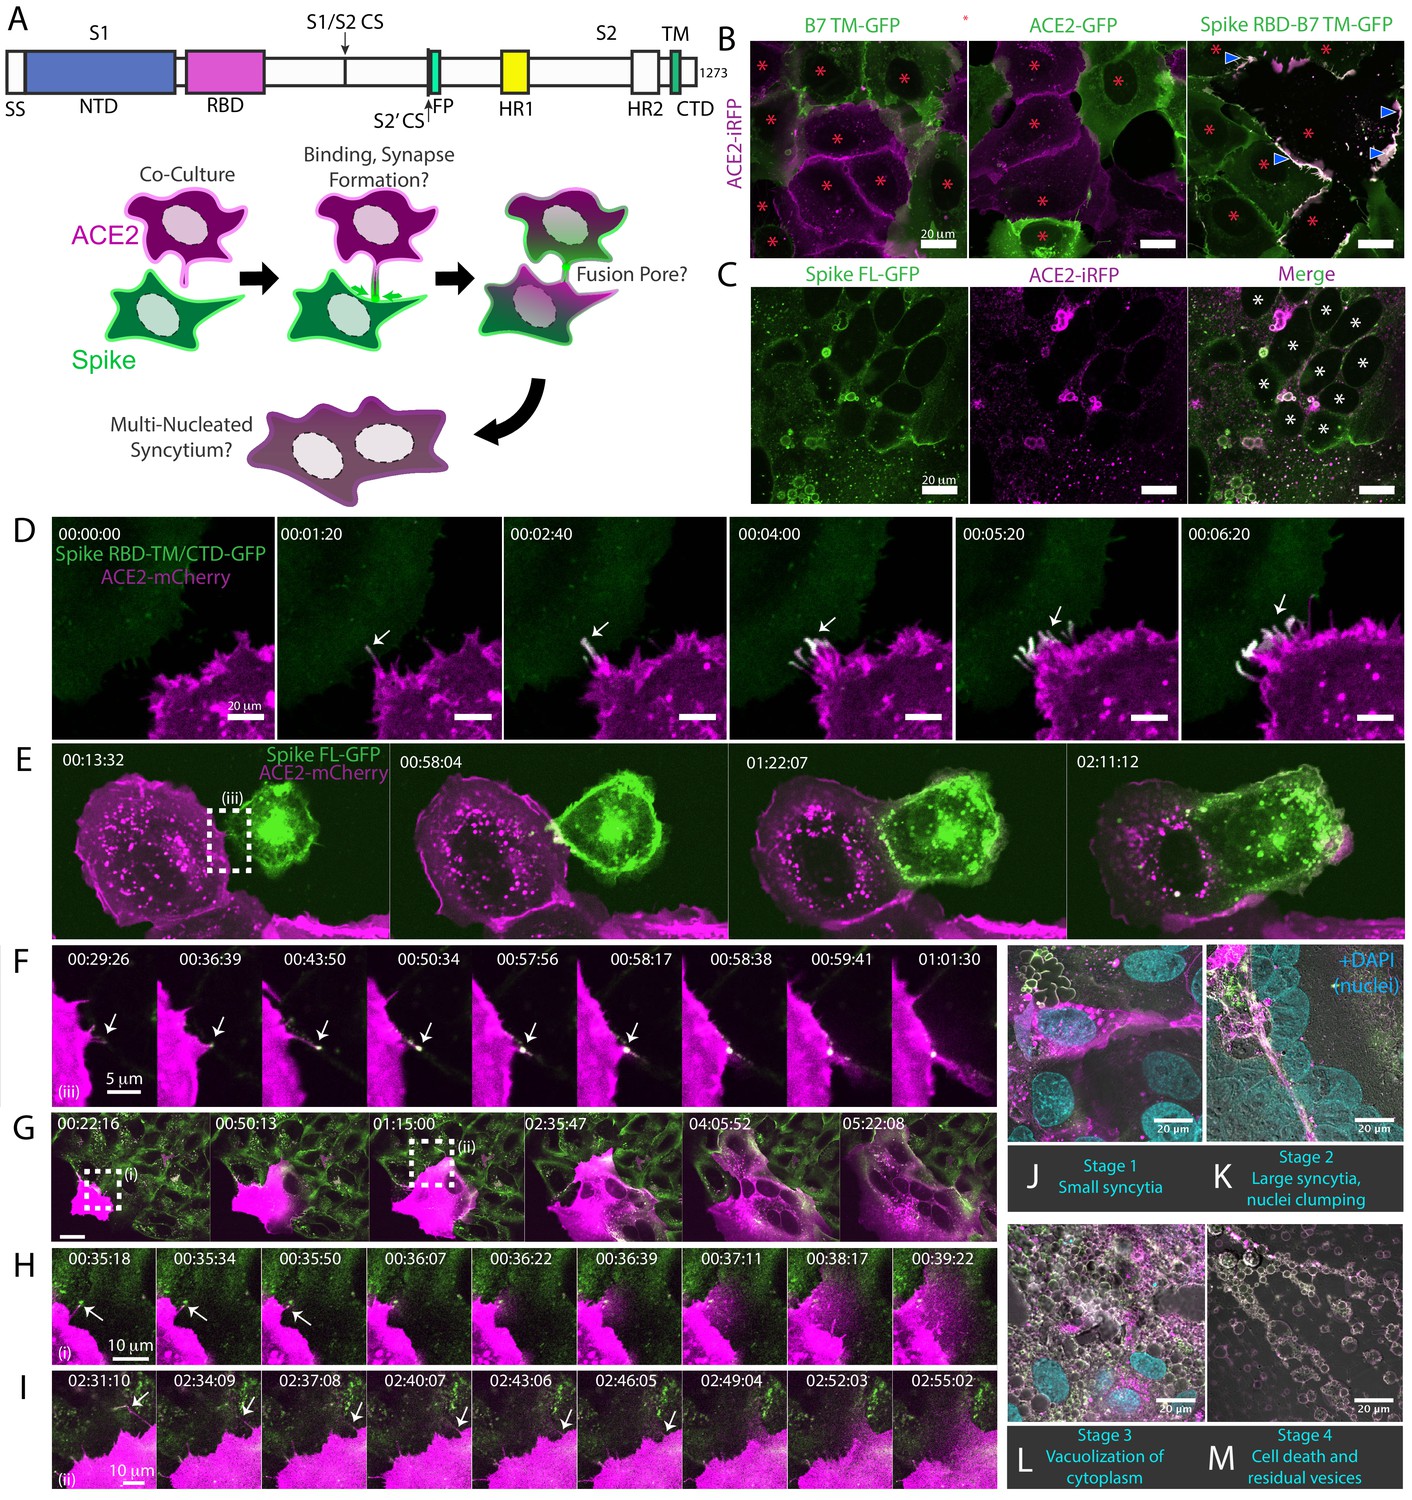
Syncytia derive from fusion events at synapse-like, spike-ACE2 protein clusters.
(A) Top: Domain structure of a single monomer of the SARS-CoV-2 spike trimer. Domains/motifs is from left to right (see KEY RESOURCES table for residue boundaries): SS (signal sequence), NTD (N-terminal domain), RBD (receptor-binding domain), S1/S2 (subdomain-1/2 cleavage site), S2’ (subdomain-2’ cleavage site), FP (fusion peptide), HR1 (heptad repeat 1), HR2 (heptad repeat 2), TM (transmembrane alpha helix), CTD (cytoplasmic domain). Bottom: Cartoon depiction of live cell co-culture assays to detect spike-ACE2 binding and cell-cell fusion. Magenta, acceptor cells (human ACE2-mCherry or ACE2-iRFP); Green, donor cells (GFP-tagged spike variant). (B) ACE2-iRFP U2OS (human osteosarcoma) acceptor cells (magenta) co-cultured for 24 hr with U2OS cells expressing GFP-tagged proteins (green): B7 transmembrane (TM, left), ACE2 (middle), spike receptor-binding domain (RBD-TM/CTD, right). Red asterisks indicate single cell nuclei in isolation (no syncytia); arrowhead, synapses (select examples noted). (C) Co-culture of U2OS acceptor cells expressing ACE2-iRFP (magenta) with spike full-length (‘FL’)-GFP U2OS cells (green). White asterisks: cell nuclei in syncytium. (D) Co-culture of ACE2-mCherry (magenta) and spike RBD-TM/CTD-GFP (green) cells for indicated amount of time (hours:minutes:seconds). Arrow: synapse-like interfaces between cells. Scale-bar, 5 µm. See also Figure 1—video 1 for long-lived ACE2-Spike FL synapses. (E) Similar to (D), but spike FL-GFP and ACE2-mCherry co-culture. Dashed box indicates site of synapse formation and cell-cell fusion. See Figure 1—video 2 for time-lapse movie. (F) Zoom-in on synapse formation (arrow, left image) and fusion event (arrow, sixth image from left) of dashed box in (E). (G) ACE2-mCherry cell added to pre-plated spike FL-GFP U2OS cell monolayer (time since ACE2 cell plating indicated). Syncytium forms by multiple cell-cell fusion events (dashed boxes). See (H,I) for zoom-in events (i) and (ii). See Figure 1—video 3 for time-lapse movie. (H) First cell fusion event (i from G) at spike-ACE2 synapse. Time since ACE2-mCherry cell plating indicated. Arrow: retracting synapse prior to cell fusion. (I) Similar to (H) but second cell-cell fusion event (ii from G). (J) Representative image of small syncytia (stage 1) common at early time points following co-culture of ACE2-mCherry (magenta) and spike-GFP (green) U2OS cells but rare at 24 hr (blue, Hoechst DNA stain). (K) Similar to (J), but representative of more common, larger syncytia (stage 2) at 24 hr. Nuclei (blue) clump in center of syncytium. (L) Similar to (J), but representative of typical syncytium with extensive vacuolization (stage 3) at 48 hr. (M) Similar to (J), but representative of remnants (spherical membranous structures) of dead syncytium at 72 hr (stage 4). See also Figure 1—figure supplement 1; Figure 1—video 1–3.
Figure 1—figure supplement 1

Syncytia derive from fusion events at synapse-like, spike-ACE2 protein clusters.
(A) Indicated non-transduced cells (or ACE2-mCherry/U2OS control) co-cultured with U2OS spike-GFP (green) cells for 24 hr. White asterisks indicate nuclei in syncytia; red, in isolation. (B) Indicated GFP-spike variant (green) U2OS cells co-cultured with U2OS ACE2-mCherry (magenta) cells for 24 hr. White asterisks indicate nuclei in syncytia; red, in isolation; arrowhead, synapses (select examples noted). (C) Similar to (B), but using spike variants that disrupt its two cleavage sites (S1/S2 vs. S2’). (D) U2OS cells expressing spike or ACE2 with indicated fluorescent tag, co-cultured for 24 hr. White asterisks indicate nuclei in syncytia; red, in isolation; arrowhead, synapses (select examples noted).
Figure 1—video 1
Transcellular ACE2-spike synapses are long-lived cellular assemblies.
ACE2-mCherry, magenta; Spike-GFP, green. Twenty min time lapse, human U2OS osteosarcoma cells stably expressing indicated proteins. Time since start of imaging is indicated.
Figure 1—video 2
ACE2-spike synapse formation and cell-cell fusion following co-culture.
ACE2-mCherry, magenta; Spike-GFP, green. Two hr time lapse, human U2OS osteosarcoma cells stably expressing indicated proteins. Time since plating of spike-GFP cells is indicated.
Figure 1—video 3
Building a syncytium: multiple cell-cell fusion events following addition of a single ACE2 cell to a spike cell monolayer.
ACE2-mCherry, magenta; Spike-GFP, green. Five hr time lapse, human U2OS osteosarcoma cells stably expressing indicated proteins. Time since plating of ACE2-mCherry cell is indicated.
Figure 2
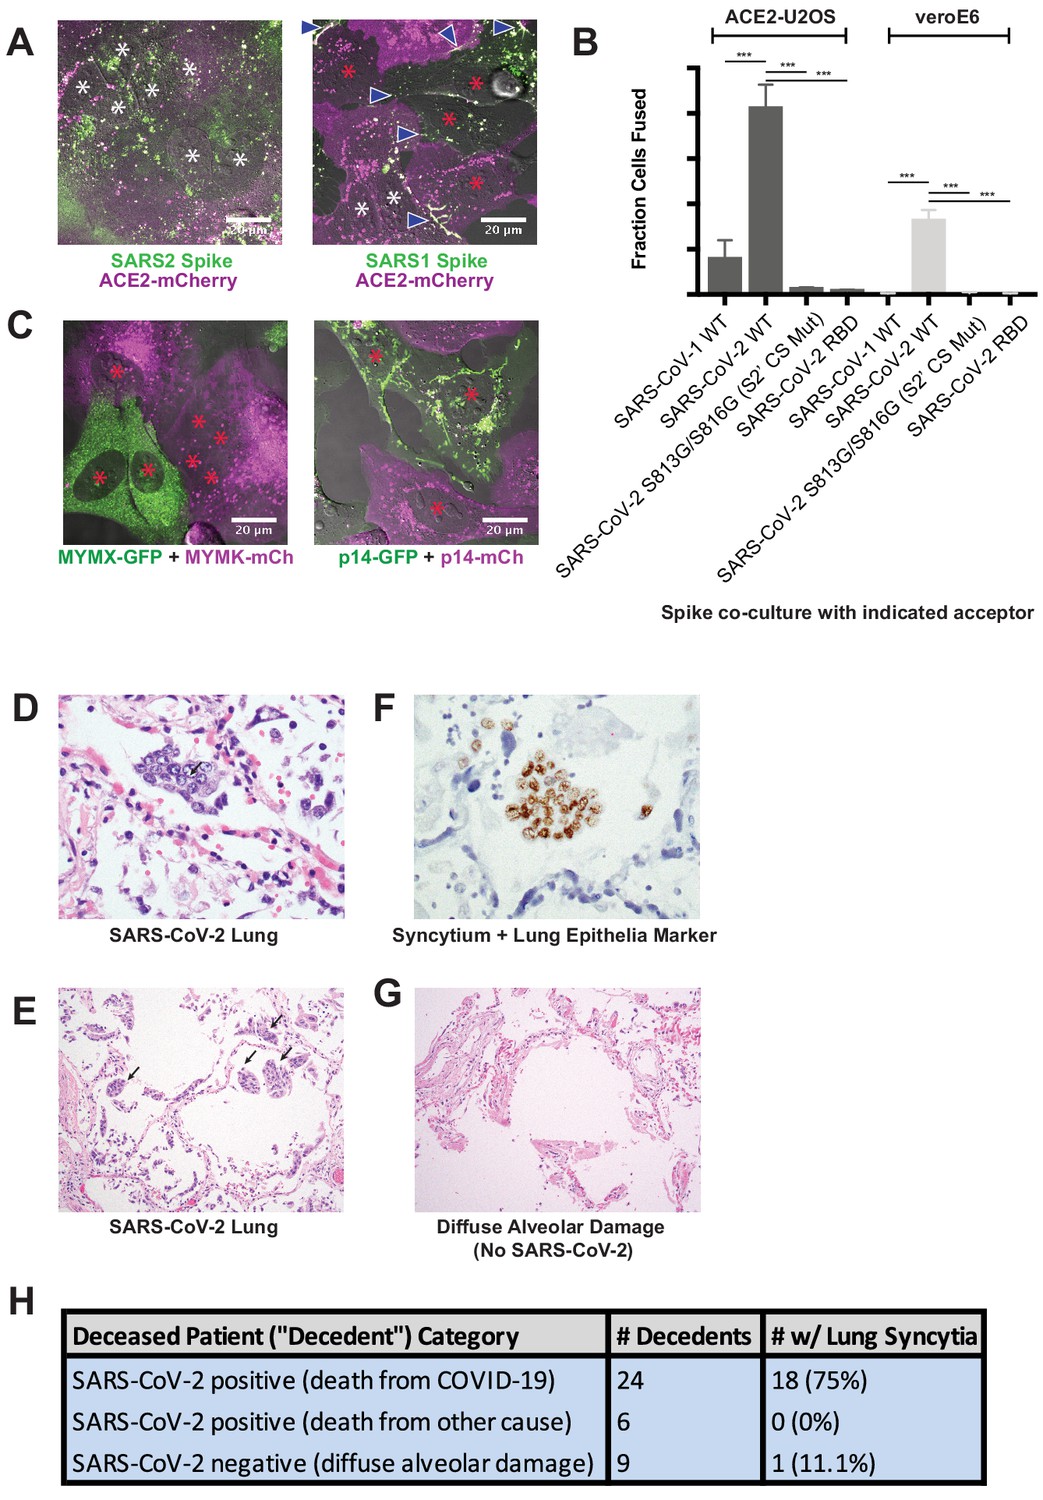
Syncytia are a defining pathological feature of COVID-19.
(A) ACE2-mCherry (magenta) U2OS cells co-cultured with GFP-tagged (green) SARS-CoV-2 spike cells (left) or SARS-CoV-1 spike cells (right) for 24 hr. White asterisks indicate nuclei in syncytia; red, in isolation; arrowhead, synapses (select examples noted). (B) Quantification of (A) by percent cells fused (also tested VeroE6 donor cells, which express endogenous ACE2, and control SARS-CoV-2 spike variants that lack ability to promote fusion). Mean and SEM: n = 4 biological replicates (16 images per). p-Values of <0.01, <0.001, and<0.0001 are represented by *, **, and ***, respectively. (C) Indicated fusogen-expressing cells lines co-cultured for 24 hr. Red asterisk indicates nuclei of single cells (not in syncytia). (D) Lung from SARS-CoV-2 decedent demonstrating syncytia formation (H and E stained section, ×400 original magnification). Syncytium labeled with arrow. (E) Similar to (D), but sample obtained from different deceased COVID-19 patient and at ×100 magnification. Syncytium labeled with arrow. (F) Immunohistochemistry for lung epithelia marker TTF-1 (NKX2-1; brown) showing nuclear positivity in the syncytial cells (×400 original magnification). (G) Lung from control decedent with diffuse alveolar damage unrelated to SARS-CoV-2 infection (died pre-2019), showing hyaline membranes (remnants of dead cells; bright pink) but no syncytia (H and E stained section, ×100 original magnification). (H) Table summarizing decedents examined for syncytia pathology.
Figure 3 with 2 supplements
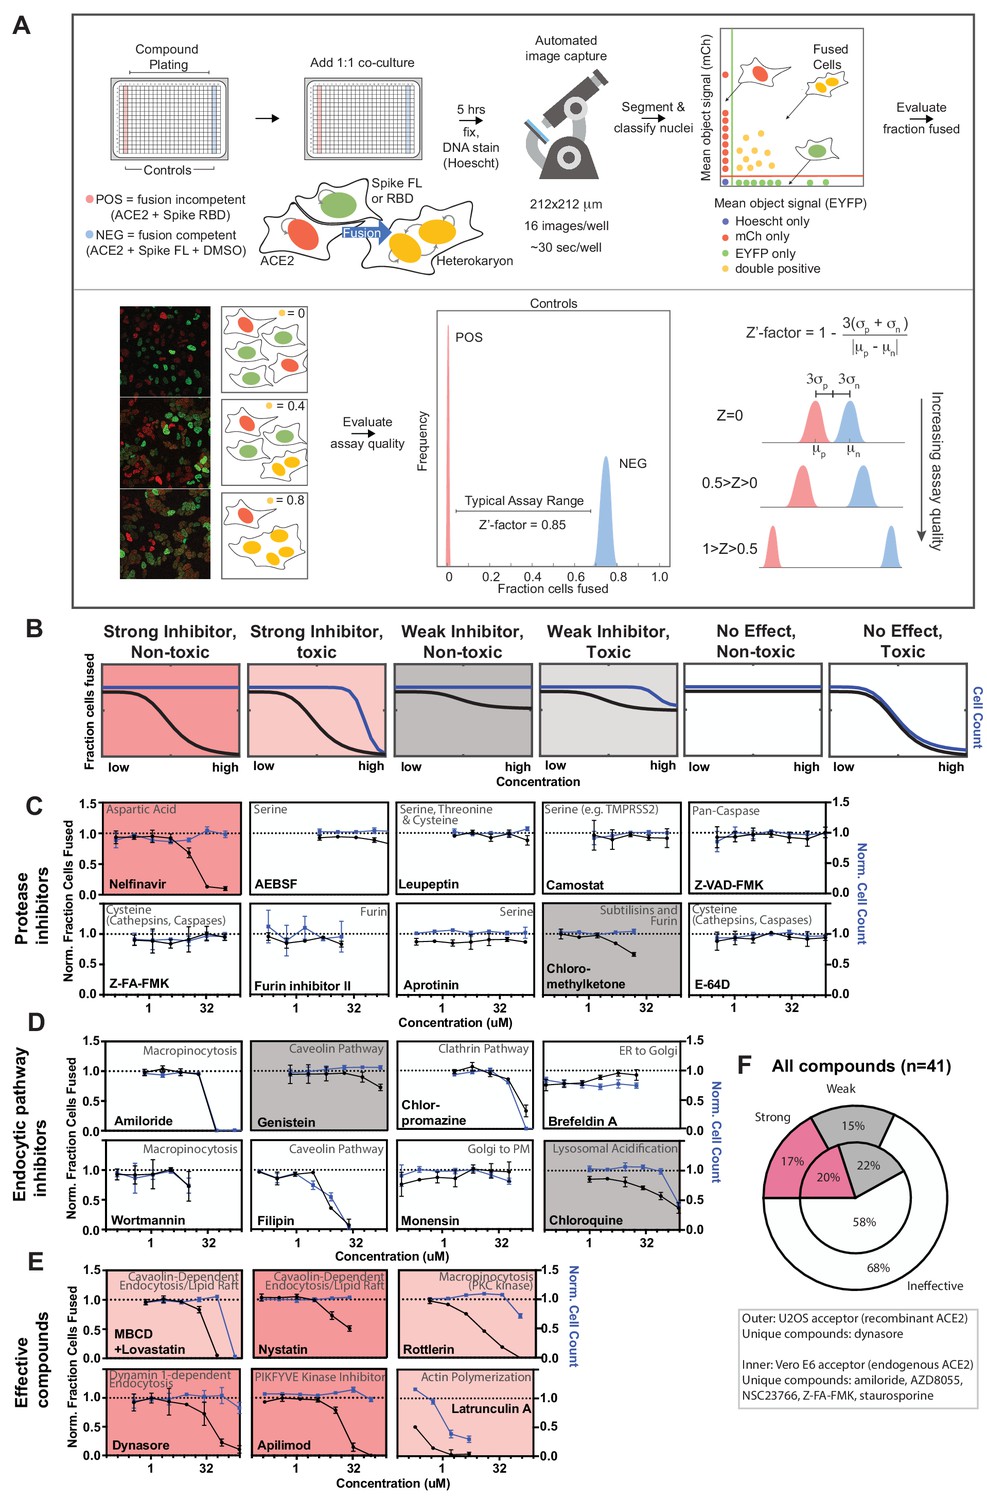
A novel high-throughput screening platform identifies modulators of syncytia formation.
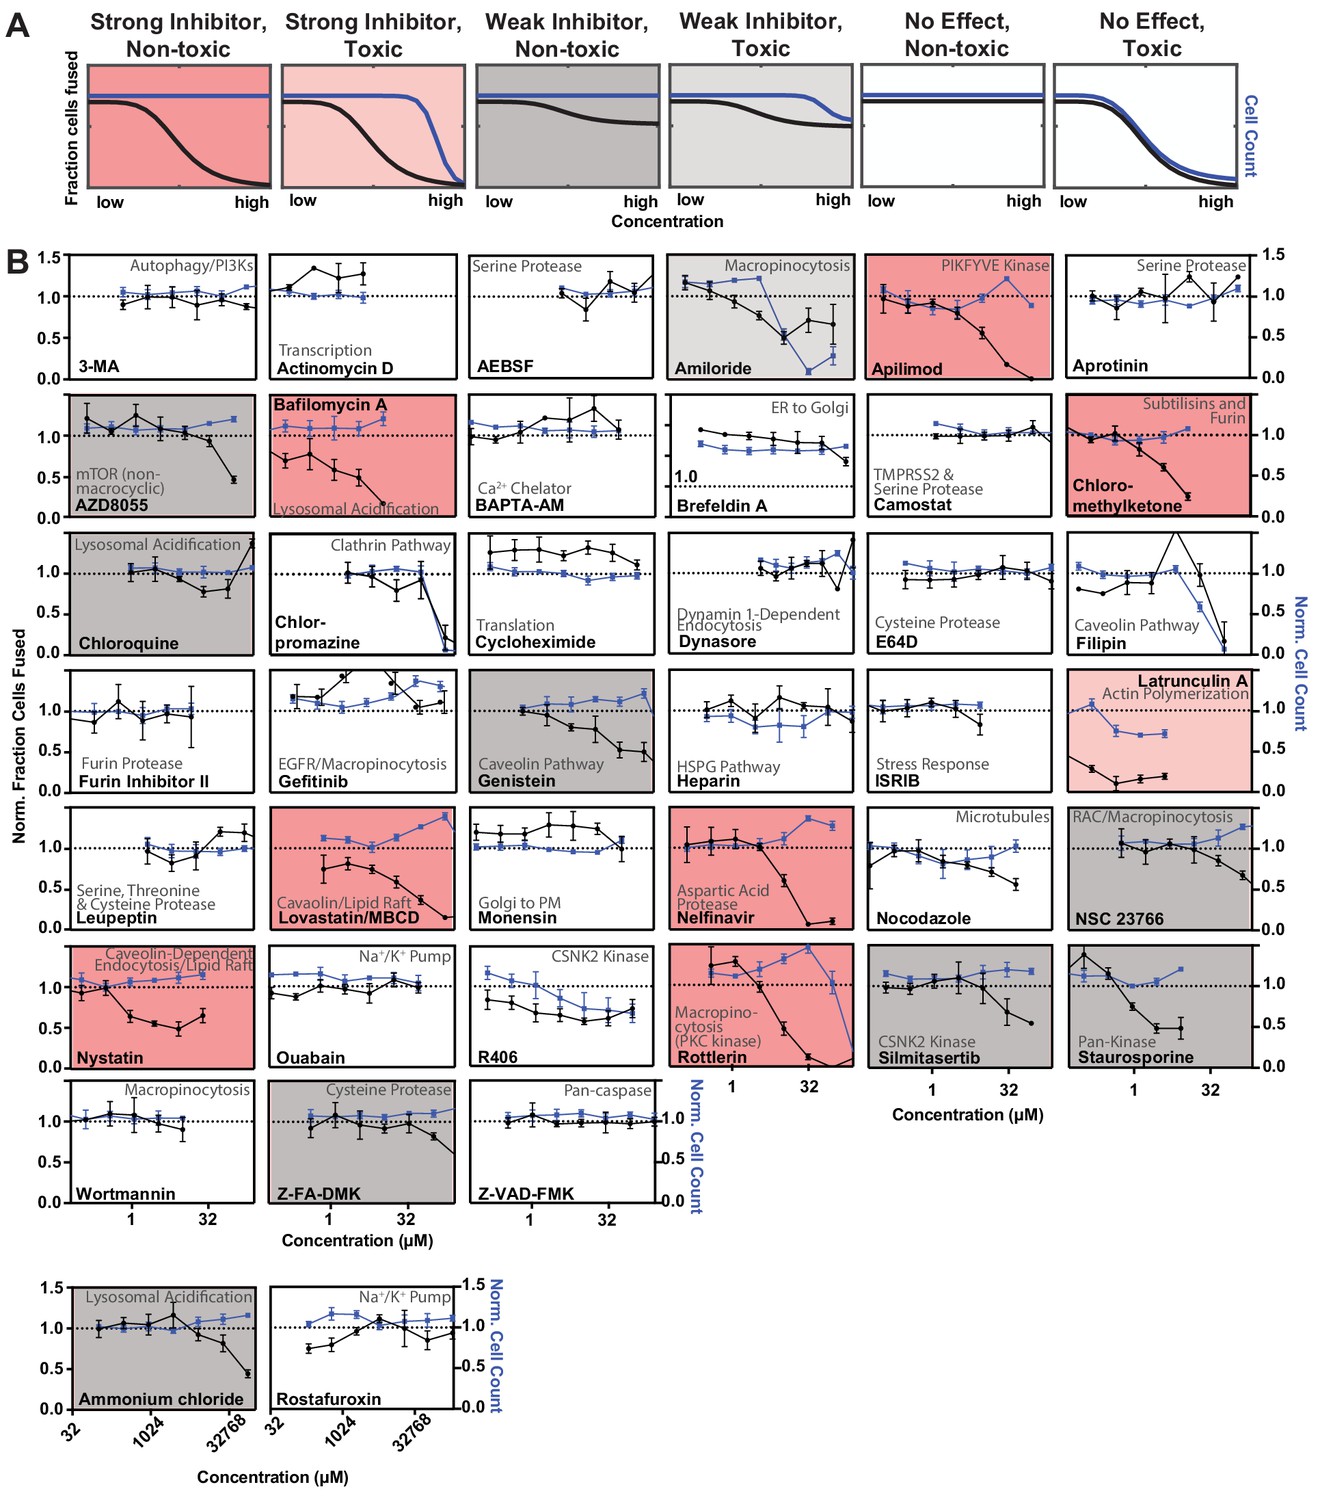
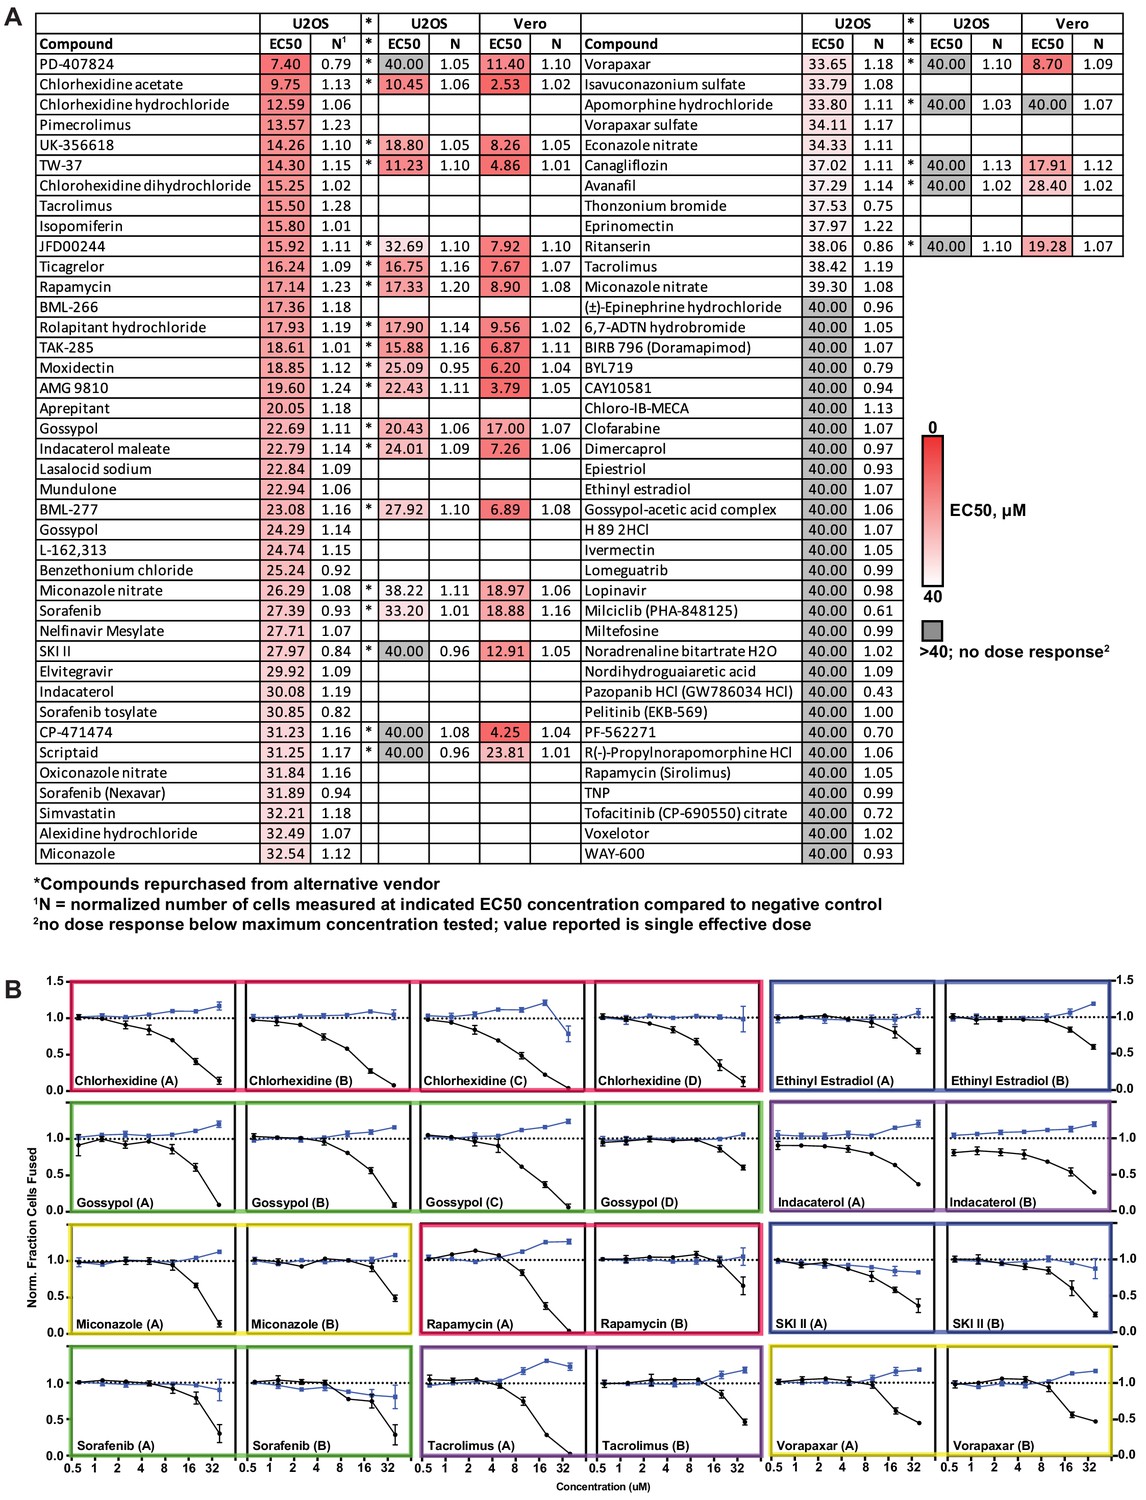
(A) Heterokaryon assay workflow overview (top) and characterization (bottom). Equal parts acceptor cells (express ACE2-iRFP and FUS-mCherry) plus donor cells (express spike FL-iRFP and HNRNPA1-EYFP) are co-cultured in 384-well microtiter plate: positive control (spike RBD, red column), negative control (DMSO, blue column), test compounds (other columns). After 5 hr, cells are fixed and nuclei are stained (Hoechst) then identified/segmented by automated confocal microscopy. Fraction cells fused is determined by percent co-positive (mCherry and EYFP) nuclei. Sample images and schematic interpretation of a positive control well (top), test well with reduced fusion (middle), negative control well (bottom). Z’-factor measures window size with higher score indicating a more robust screening platform. (B) Schematic of assay dose-response and interpretation. Fraction of cells fused (black curve) relative to cell count (toxicity measure, blue curve), both normalized by plate negative control, indicate compound efficacy (pink, strong inhibitor; gray, weak inhibitor; white, no-effect). Compounds are designated as effective if the maximum dose z-score is <-3. Strong vs. weak inhibitor designation is based on an arbitrary cutoff. (C) A panel of spike protease inhibitors (n = 10), which includes antagonists of both established SARS-CoV-2 entry pathways (cathepsin-dependent endocytosis vs. TMPRSS2/furin-mediated direct fusion), was tested. Mean and SEM: n = 4 biological replicates (16 images per). (D) Similar to (C), but displaying dose-response relationships for select inhibitors of indicated routes of endocytosis (e.g. clathrin, macropinocytosis) and steps in secretory pathway (e.g. ER-Golgi transport). See Figure 3—figure supplement 1F for additional tested compounds. (E) Similar to (C), but displaying dose-response relationships for compounds that strongly inhibit cell-cell fusion in ACE2-U2OS heterokaryon assay. See Figure 3—figure supplement 2 for similar effect in VeroE6 assay (no exogenous ACE2 expression). (F) Summary of targeted drugs (n = 41) in U2OS and Vero based co-culture assays. Identified inhibitors are largely similar between cell types. Cell type-specific effects are noted. See also Figure 3—figure supplements 1–2; Supplementary file 4.
Figure 3—figure supplement 1
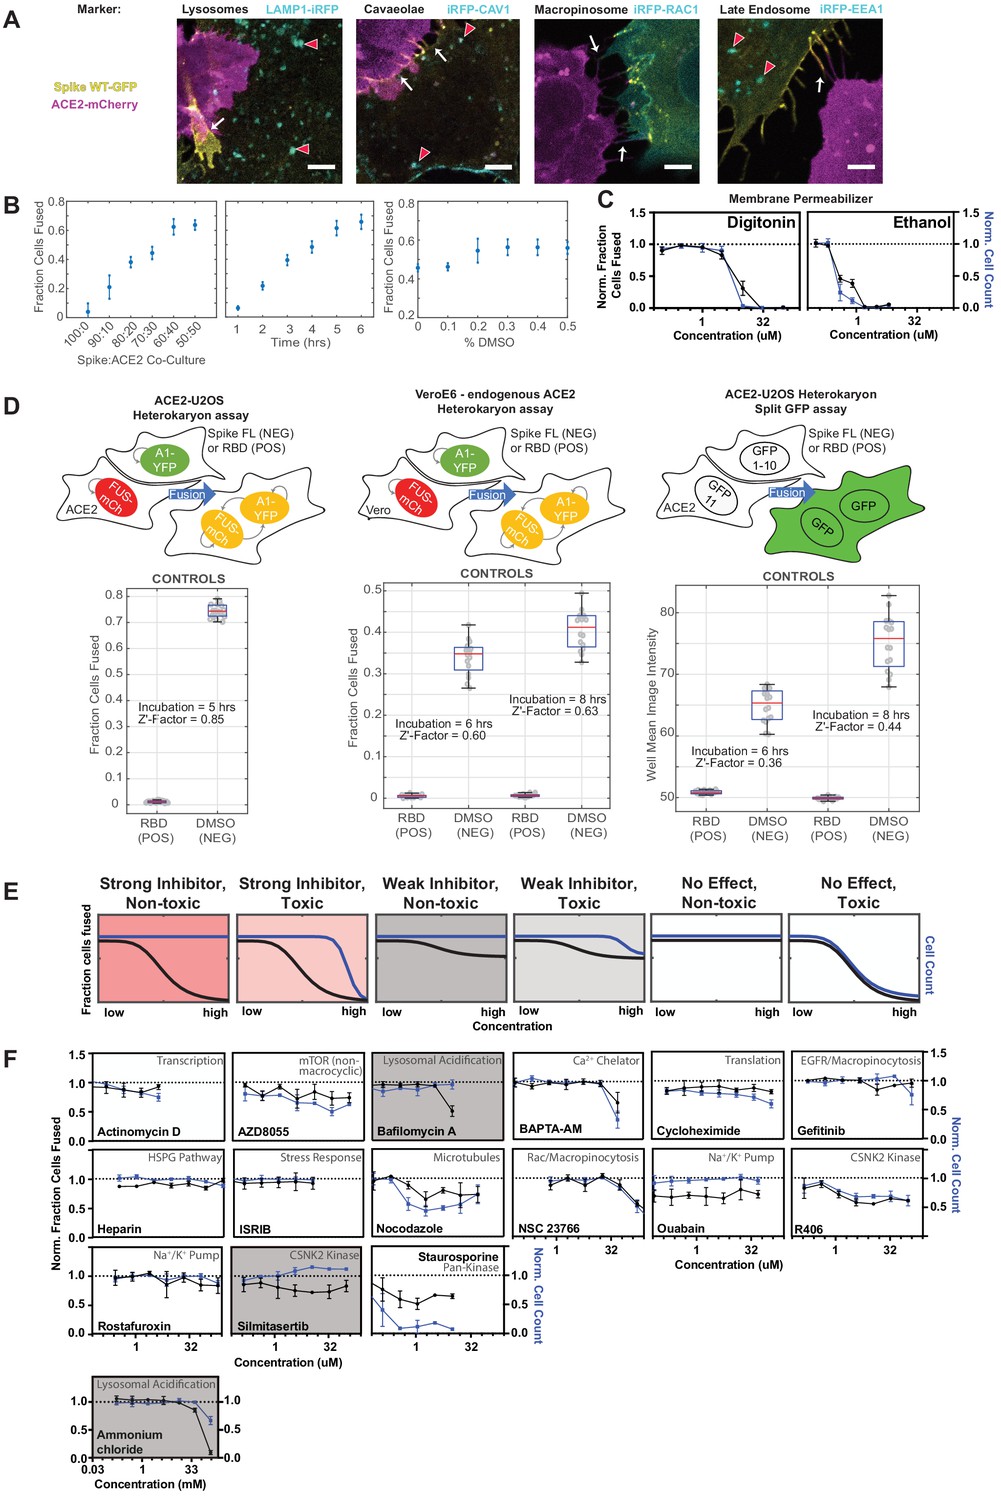
A novel high-throughput screening platform identifies modulators of syncytia formation.
(A) U2OS cells co-expressing spike-GFP (yellow) and iRFP-tagged (cyan) endocytic markers (indicated) co-cultured with ACE2-mCherry (magenta) cells, with cell-cell fusion events assessed by live cell microscopy. Representative images show lack of co-localization between spike and iRFP-tagged proteins at synapses (white arrows) and vesicles (red arrowheads) prior to fusion. Scale-bar, 5 µm. (B) Optimization of ACE2-U2OS heterokaryon assay. Co-cultures were performed and fusion was quantified upon altering: spike to ACE2 cell ratio (left); length of co-culture time prior to fixation (middle); DMSO concentration (right). Default experimental parameters: 1-to-1 ratio, 5 hr, 0.5% DMSO. Mean and SEM: n = 4 biological replicates (16 images per). (C) Dose-response for membrane-permeabilizing compounds in ACE2-U2OS heterokaryon assay. Cell count (blue) and fraction fused (black) curves are similar, indicating lack of toxicity-independent inhibition of cell-cell fusion. Mean and SEM: n = 4 biological replicates (16 images per). (D) Comparison of three different heterokaryon microscopy assays, each of which use fluorescent proteins as readouts for fusion. Bottom: relative fusion for positive (spike RBD donor cells; fusion-incompetent) and negative (spike full-length donor cells + DMSO; fusion-competent) controls for indicated assay (top, with graphical depiction) with measured Z’-factor, which indicates assay strength (higher = more robust). Mean and SEM: n = 4 biological replicates (16 images per). (E) Schematic of ACE2-U2OS assay dose-response and interpretation. Fraction of cells fused (black curve) relative to cell count (toxicity measure; blue curve), both normalized by plate negative control, indicates compound efficacy (pink, strong inhibitor; gray, weak inhibitor; white, no-effect). (F) Dose-response relationships for additional compounds tested in ACE2-U2OS heterokaryon assay. Mean and SEM: n = 4 biological replicates (16 images per). See Figure 3—figure supplement 2 for same compounds in VeroE6 heterokaryon assay.
Figure 3—figure supplement 2
A novel high-throughput screening platform identifies modulators of syncytia formation.
(A) Schematic of VeroE6 heterokaryon assay (no exogenous ACE2 overexpression) dose-response and interpretation. Fraction of cells fused (black curve) relative to cell count (toxicity measure; blue curve), both normalized by plate negative control, indicates compound efficacy (pink, strong inhibitor; gray, weak inhibitor; white, no-effect). (B) Dose-response relationships for all compounds (n = 41) tested in VeroE6 heterokaryon assay. Mean and SEM: n = 4 biological replicates (16 images per). See Figure 3 and Figure 3—figure supplement 1 for effect of same compounds in ACE2-U2OS heterokaryon assay.
Figure 4 with 2 supplements
A drug repurposing screen implicates membrane lipid composition in cell-cell fusion.
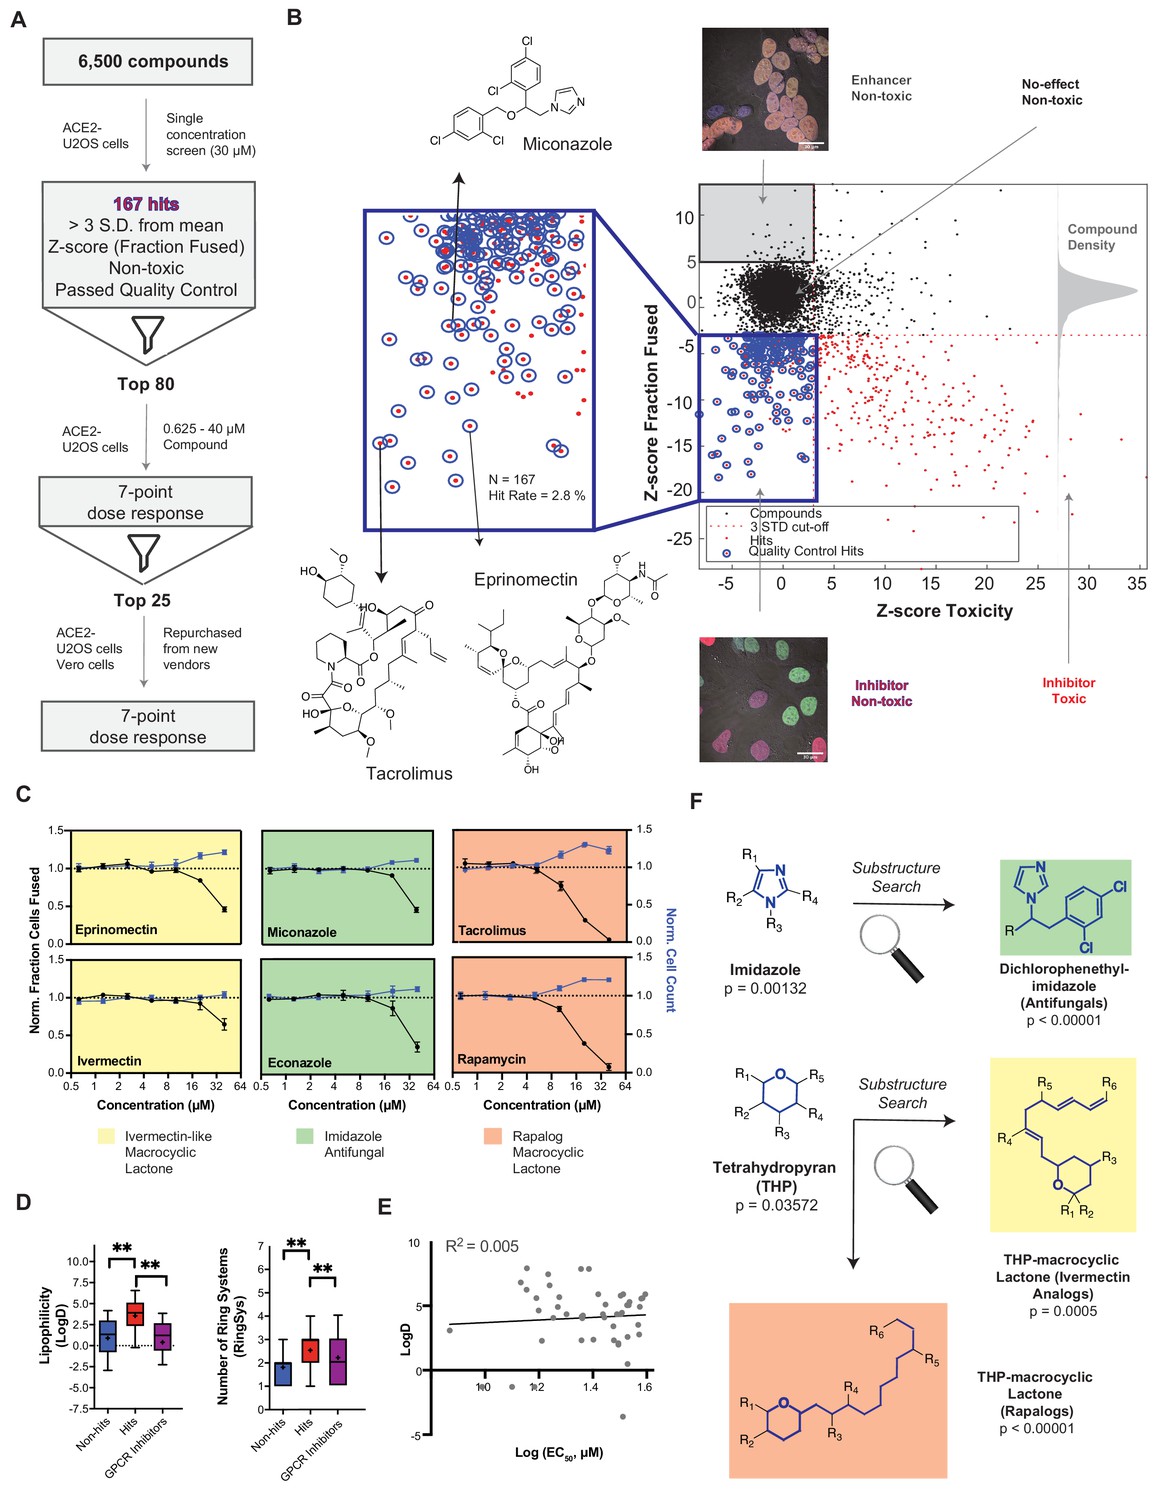
(A) High-throughput pipeline and workflow of small molecule screen (~6000 compounds, 30 µM) in ACE2-U2OS heterokaryon assay. ‘Hits’ refer to non-toxic compounds with a decrease in fusion of >3 standard deviations relative to plate negative control. 7-point dose-response was determined for top-80 inhibitors, followed by validation of select compounds (n = 24; obtained from different vendors) in both ACE2-U2OS and VeroE6 heterokaryon assays. (B) Results of compound screen. Plot: fraction fused vs. toxicity z-score. Red dots indicate compounds with decreased fusion (z-score<-3); blue inset, potential hits following toxicity filtering (z-score <3); blue circles, quality-controlled hits (inhibitory, non-toxic compounds with normal fluorescence); gray inset, compounds with increase in fraction cells fused (z-score >5) but no toxicity (‘enhancers’, see Figure 6J); right histogram, compound density as function of fraction fused z-score. Chemical structures are displayed for select validated hits. See Supplementary file 1 for raw data. (C) Dose-responses for select hits in enriched substructure classes (see F): imidazoles (e.g. azole antifungals, green) and macrocyclic lactones (ivermectin-like, yellow; rapalogs, pink). Mean and SEM: n = 3 biological replicates (16 images per). (D) Box-and-whisker plots of select physicochemical properties (lipophilicity, logD; ring systems) for non-hits (blue), inhibitory hits (red), and GPCR inhibitors (purple) as calculated in ChemAxon. Boxes encompass 25–75% of variance; whiskers, 10–90%. Mean values are indicated by ‘+”; median values, lines. Statistical significance was assessed by Mann-Whitney U test: p-values of <0.05 and<0.001 are represented by * and **, respectively. (E) Lack of correlation between inhibitory hit EC50 (see Figure 4—figure supplement 1A) and lipophilicity according to linear regression analysis conducted in GraphPad Prism. (F) Three substructure classes based on two scaffolds were identified to have high statistical enrichment in hits over non-hits: dicholorophenethyl-imidazoles (found in azole antifungals, green) and tetrahydropyrans with alkyl moieties (found in macrocyclic lactones; yellow and pink indicate ivemectin-like and rapalog compounds, respectively). See also Figure 4—figure supplements 1–2; Supplementary file 1.
Figure 4—figure supplement 1
A drug repurposing screen implicates membrane lipid composition in cell-cell fusion.
(A) Summary of 7-point dose-response for top-80 inhibitors in indicated heterokaryon assay (ACE2-U2OS vs. VeroE6). Asterisks reference compounds tested and validated by re-purchase from independent manufacturers. Heat-map indicates relative compound potency (bright red = higher). (B) Dose-response relationships for compounds (grouped by colored box) present in multiple small molecule libraries, each of whose replicates were identified as top-80 inhibitory hits. Mean and SEM: n = 3 biological replicates (16 images per).
Figure 4—figure supplement 2
A drug repurposing screen implicates membrane lipid composition in cell-cell fusion.
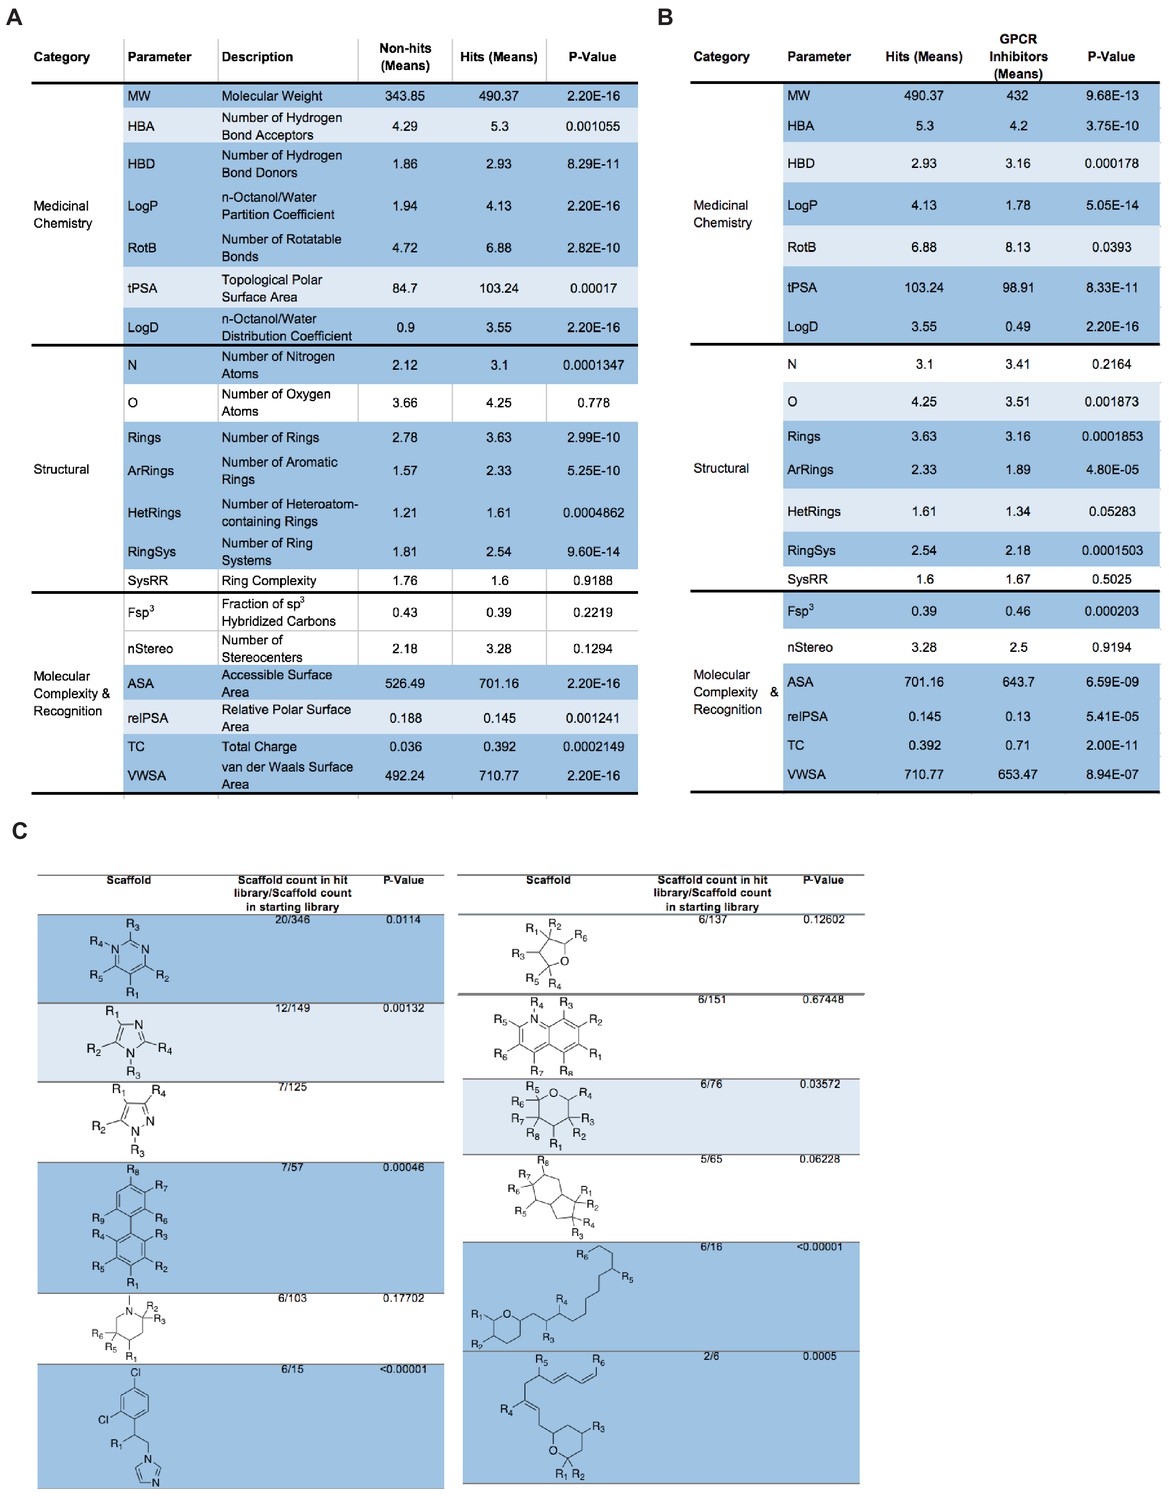
(A) Analysis and comparison of 20 physicochemical properties for non-hit and hit libraries. P-values assessed with a Mann-Whitney U test. Dark and light blue represent p-values<0.001 and<0.05, respectively. White indicates no significant differences. (B) Similar to (A), but inhibitory hits vs. a control GPCR inhibitor library obtained from literature. (C) List of top-10 most frequent scaffolds and substructures in the hit library as analyzed by Scaffold Hopper and RDKit Substructure Search, respectively. Enrichment significance relative to the starting library was assessed with two-tailed Z-scores used to calculate p-values. Dark and light blue represent p-values<0.001 and<0.05, respectively. White indicates no significant differences.
Figure 5 with 1 supplement
Highly unusual membrane-proximal regions of spike are needed for fusion.
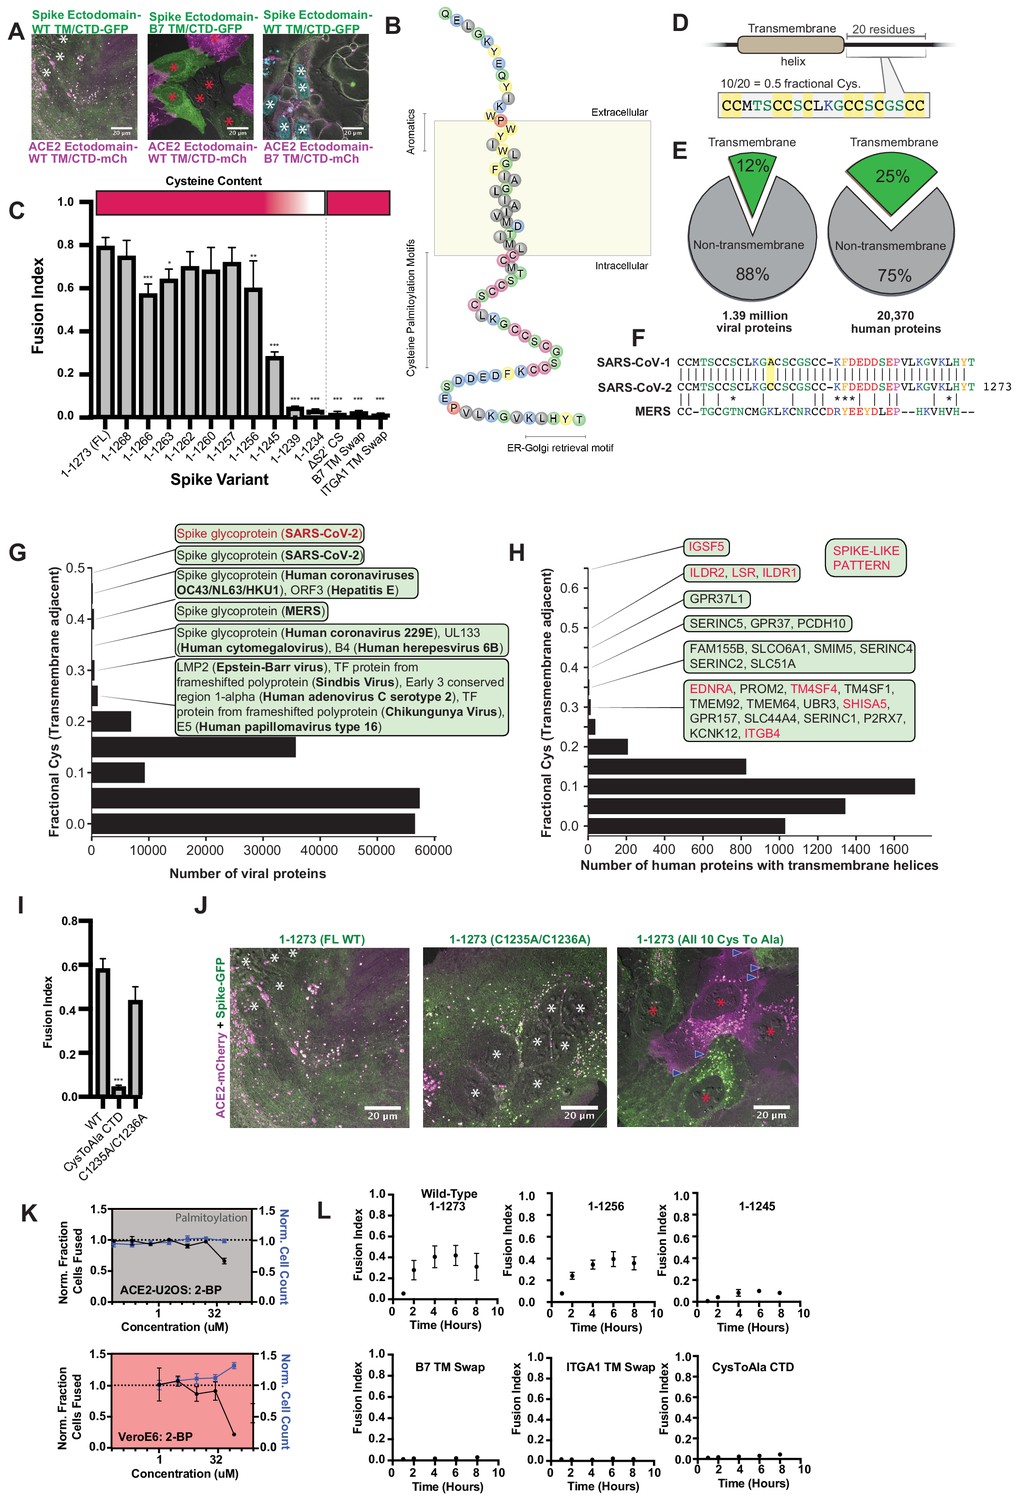
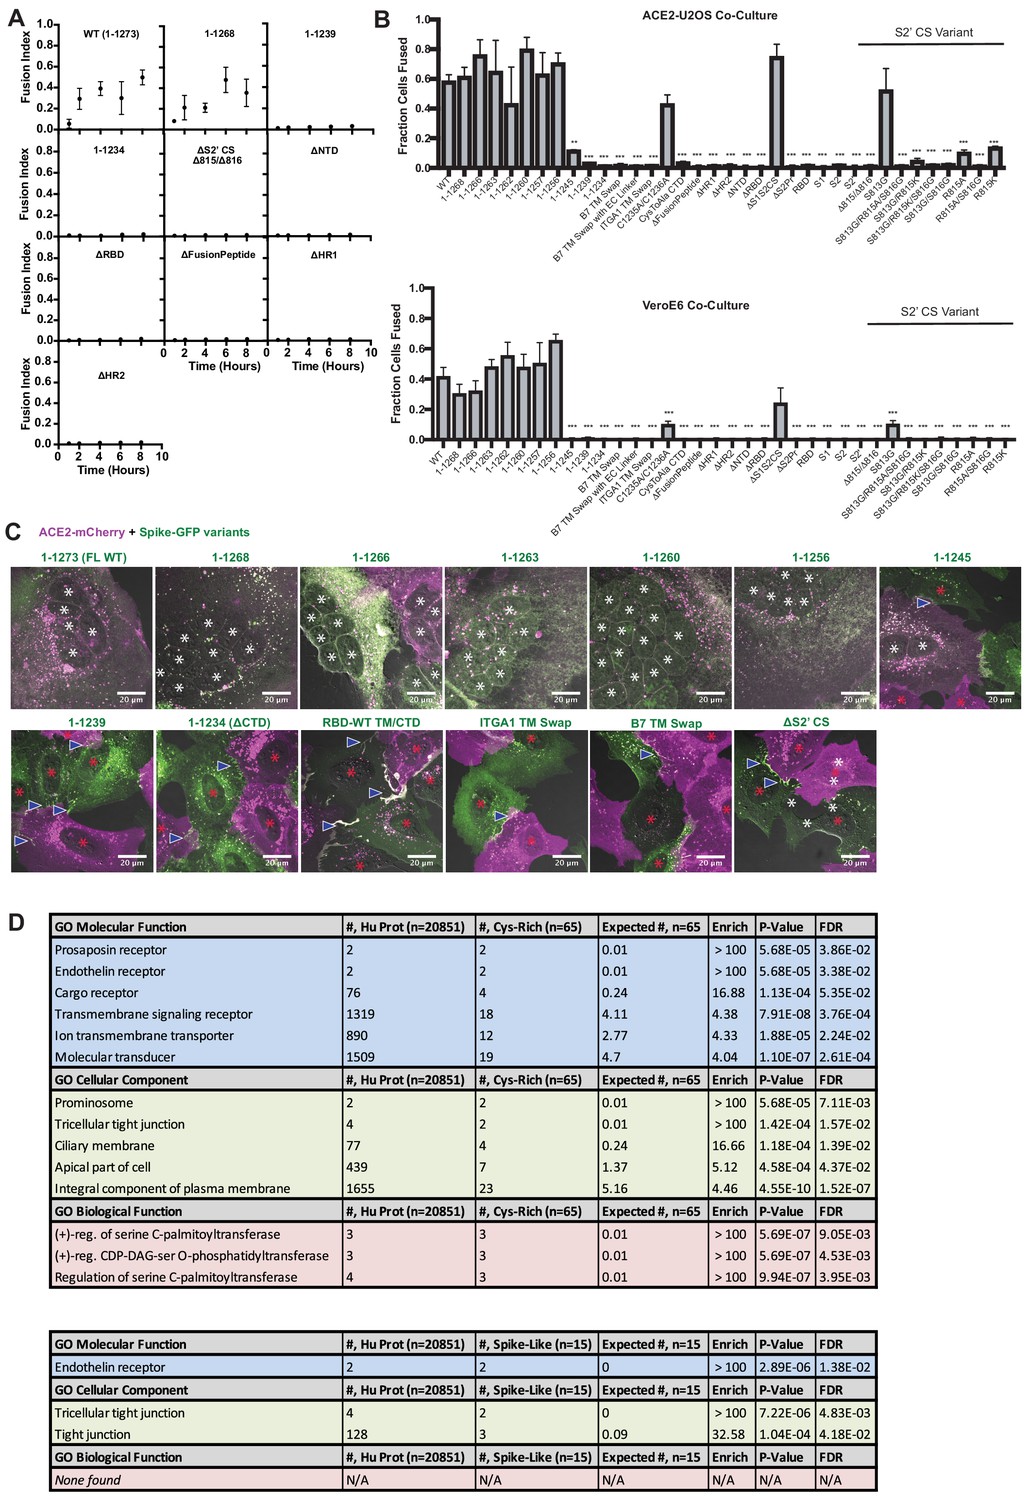
(A) Representative images of co-cultured (24 hr) U2OS cell lines, stably expressing indicated fluorescently tagged ACE2 or spike. ‘B7 TM’ indicates swap of endogenous transmembrane (TM) and cytoplasmic domain (CTD) of spike or ACE2 with that of the monomeric, single-pass, B7 transmembrane protein, along with its membrane-proximal extracellular region (30-amino acid spacer). White asterisks indicate nuclei in syncytia; red, in isolation. Note lack of arrowheads (synapses) in middle condition. See Supplementary file 4 for residue composition of such ‘chimeric’ proteins. (B) Graphical representation of SARS-CoV-2 spike’s TM alpha-helix and membrane-proximal regions, with residues colored by chemical properties (yellow, aromatic; cysteine, magenta; hydrophobic, gray; non-charged hydrophilic, green; charged hydrophilic; blue; proline, red). Of note: aromatic-rich region at ectodomain-TM interface, cysteine-rich cytoplasmic domain (CTD). (C) ACE2-U2OS heterokaryon assay but with co-cultured HNRNPA1-EYFP cells expressing spike variants (indicated). Relative CTD cysteine content for variants is depicted with heat map (top; dark red = more cysteines, white = none). Mean and SEM: n = 4 biological replicates (16 images per). See Figure 5—figure supplement 1B for all tested spike variants in both ACE2-U2OS and VeroE6 heterokaryon assays; Figure 5—figure supplement 1C, for representative images of ACE2-mCherry U2OS cells co-cultured with GFP-tagged spike variants. p-values of <0.01, <0.001, and <0.0001 are represented by *, **, and ***, respectively. (D) Cartoon representation of SARS-CoV-2 spike with highest cysteine content in a 20-amino acid sliding window, which guided bioinformatic analyses shown in (E–H). (E) Schematic of bioinformatic analysis performed, whereby 20-residue windows around the N- and C-terminal sides of transmembrane helices were scanned for local cysteine density. Pie charts: summary of total set of viral proteins retrieved and analyzed for the human virus proteome (left) and human proteome (right); green slice references proportion of proteins with one or more predicted transmembrane helixes. (F) Conservation of cysteine-rich CTD between spike proteins of highly pathogenic human coronaviruses. The only difference between the CTD of SARS-CoV-1 and SARS-CoV-2 is acquisition of an additional cysteine in the latter. MERS is substantially different, yet retains enrichment of cysteines. (G) Histogram of fractional cysteine scores for viral proteins, with high-fraction hits explicitly annotated. SARS-CoV-2 spike protein has the highest local cysteine density of any viral protein, closely followed by spike proteins from other coronaviruses. (H) Similar to (G), but for human proteins with one or more predicted transmembrane helix. Red: ‘spike-like’ transmembrane proteins with high cytoplasmic cysteine content and aromatic residues at ectodomain-membrane interface. (I) Similar to (C), but using spike variants with cysteines mutated to alanine (2 of 10 vs. 10 of 10). (J) Representative images for 24 hr co-culture of ACE2-mCherry (magenta) U2OS cells with those expressing GFP-tagged spike variant (green). White asterisks indicate nuclei in syncytia; red, those in isolation; arrowhead, synapses (select examples noted). (K) Dose-response relationship for 2-bromopalmitate (2-BP, inhibitor of cysteine palmitoylation), in both ACE2-U2OS (top) and VeroE6 (bottom) heterokaryon assays. Blue indicates number of nuclei (proxy for toxicity); black, percent cells fused; both normalized to DMSO control. Mean and SEM: n = 4 biological replicates (16 images per). (L) Similar to (C), but assesses kinetics of fusion by varying co-culture time prior to fixation. See Figure 5—figure supplement 1A for other tested spike variants. See also Figure 5—figure supplement 1; Supplementary files 2–4.
Figure 5—figure supplement 1
Highly unusual membrane-proximal regions of spike are needed for fusion.
(A) ACE2-U2OS heterokaryon assay, but assesses kinetics of fusion by varying length of co-culture with spike variant (indicated)-expressing HNRNPA1-EYFP cells. Mean and SEM: n = 4 biological replicates (16 images per). (B) Similar to (A) but for all studied spike variants at a single time-point (5 hr) and examined in both ACE2-U2OS (top) and VeroE6 (bottom) heterokaryon assays. Mean and SEM: n = 4 biological replicates (16 images per). p-values of <0.01, <0.001, and <0.0001 are represented by *, **, and ***, respectively. (C) Representative images of ACE2-mCherry (magenta) cells co-cultured for 24 hr with U2OS cells expressing GFP-tagged spike variant (green, labeled). White asterisks indicate nuclei in syncytia; red, in isolation; arrowhead, synapses between cells (select examples noted). (D) Top: Gene ontology (PantherDB) for cysteine-rich human transmembrane (TM) proteins, assessing significance of enrichment relative to the entire human proteome. Bottom: similar but for ‘spike-like’ human proteins (aromatics at TM interface, high cysteine content in cytoplasm CTD).
Figure 6 with 1 supplement
Spike requires membrane cholesterol for fusion but via a raft-independent mechanism.
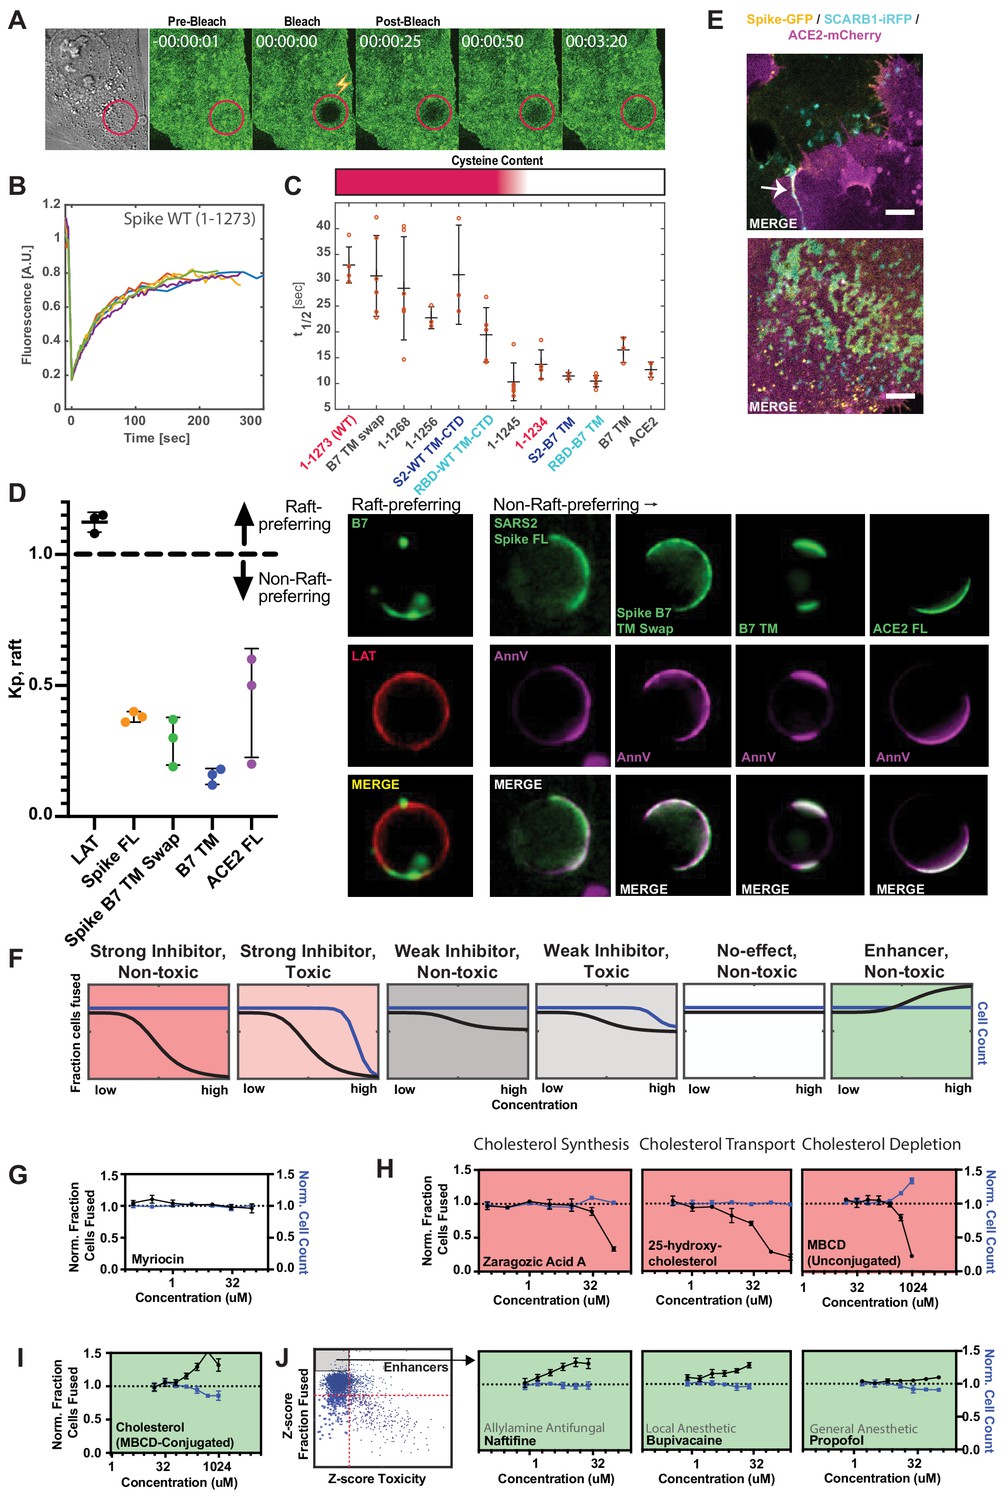
(A) Representative trial for fluorescence recovery after photobleaching (FRAP) of spike FL-GFP (green) on U2OS cell plasma membrane. Time since bleach (lightning bolt) of region of interest (red circle) is indicated. (B) Quantification of (A) and related trials, with each colored line specifying a separate FRAP experiment (n = 6 total). (C) Calculated half maximal fluorescence recovery (t1/2) for indicated GFP-tagged spike variants. Each hollow red dot indicates the t1/2 for a single FRAP trial. Mean and SEM: n = 4–6 technical replicates (one per cell). Heat map (top): relative cysteine content of tested spike variant (dark red = high cysteine content, white = none). (D) Ex vivo phase separation assay for relative partitioning (Kp) into lipid raft ordered phase (Lo) of giant plasma membrane vesicles (GPMVs). Left: quantification of GFP-tagged protein Kp with DHPE serving as lipid raft/Lo marker; AnnV, non-raft/Ld protein marker; LAT, raft/Lo protein marker. Mean and SEM: n = 3 biological replicates (colored dot;>10 GPMV technical replicates per). Right: representative images. (E) U2OS cells expressing spike-GFP (yellow) and SCARB1-iRFP (cyan) were co-cultured with ACE2-mCherry (magenta) cells and cell-cell fusion events were captured with live cell microscopy. Representative images show co-localization between spike and SCARB1 at synapses that precede fusion (top, arrow); and in extracellular deposits (bottom). Scale-bar, 5 µm. See Figure 6—figure supplement 1A,B for individual fluorescence channels. (F) Graphical schematic for ACE2-U2OS assay dose-response and interpretation. Fraction of cells fused (black curve) relative to cell count (blue curve), both normalized by the plate negative control, indicates compound effectiveness (pink, strong inhibitor; gray, weak inhibitor; white, no-effect; green, enhancer). (G) Lack of dose-dependent inhibition of fusion by sphingolipid-depleting, and raft-disrupting drug, myriocin, in ACE2-U2OS heterokaryon assay. Mean and SEM: n = 4 biological replicates (16 images per). (H) Similar to (G), but measuring effect of cholesterol-lowering drugs in ACE2-U2OS heterokaryon assay. Mean and SEM: n = 4 biological replicates (16 images per). (I) Similar to (G), but with MBCD-conjugated cholesterol, which increases plasma membrane cholesterol content. See Figure 6—figure supplement 1E for controls (i.e. other MBCD-conjugated lipids). (J) Similar to (G), but testing potential fusion-enhancing compounds (see Figure 4B, gray inset), which include allylamine antifungals (e.g. naftifine) and anesthetics (e.g. bupivacaine, propofol). See Figure 6—figure supplement 1F for similar effects by other small molecules belonging to these compound classes. See also Figure 6—figure supplement 1; Supplementary file 4.
Figure 6—figure supplement 1

Spike requires membrane cholesterol for fusion via a raft-independent mechanism.
(A) Individual fluorescence channels for merge image shown in Figure 6E (top). Arrow indicates co-localization between cholesterol-binding protein SCARB1-iRFP (cyan) and spike-GFP (yellow) at transcellular synapses. (B) Individual fluorescence channels for merge image shown in Figure 6E (bottom). (C) Representative images of extracellular membrane deposits that contain both cholesterol (CholEsteryl-BODIPY stain, orange) and spike-GFP (green). (D) Graphical schematic for ACE2-U2OS assay dose-response and interpretation. Fraction of cells fused (black curve) relative to cell count (blue curve), both normalized by the plate negative control, indicates compound effectiveness (pink, strong inhibitor; gray, weak inhibitor; white, no-effect; green, enhancer). (E) Dose-response analysis of control MBCD-conjugated lipids in ACE2-U2OS heterokaryon assay. Black line indicates fraction of cells fused; blue, cell count (toxicity measure); both of which are normalized to DMSO negative control. Mean and SEM: n = 4 biological replicates (16 images per). (F) Similar to (E), but with compounds predicted by drug repurposing screen to enhance fusion. Drug class indicated.
Figure 7
SARS-CoV-2 infection depends on membrane cholesterol of the virus but not the host cell.
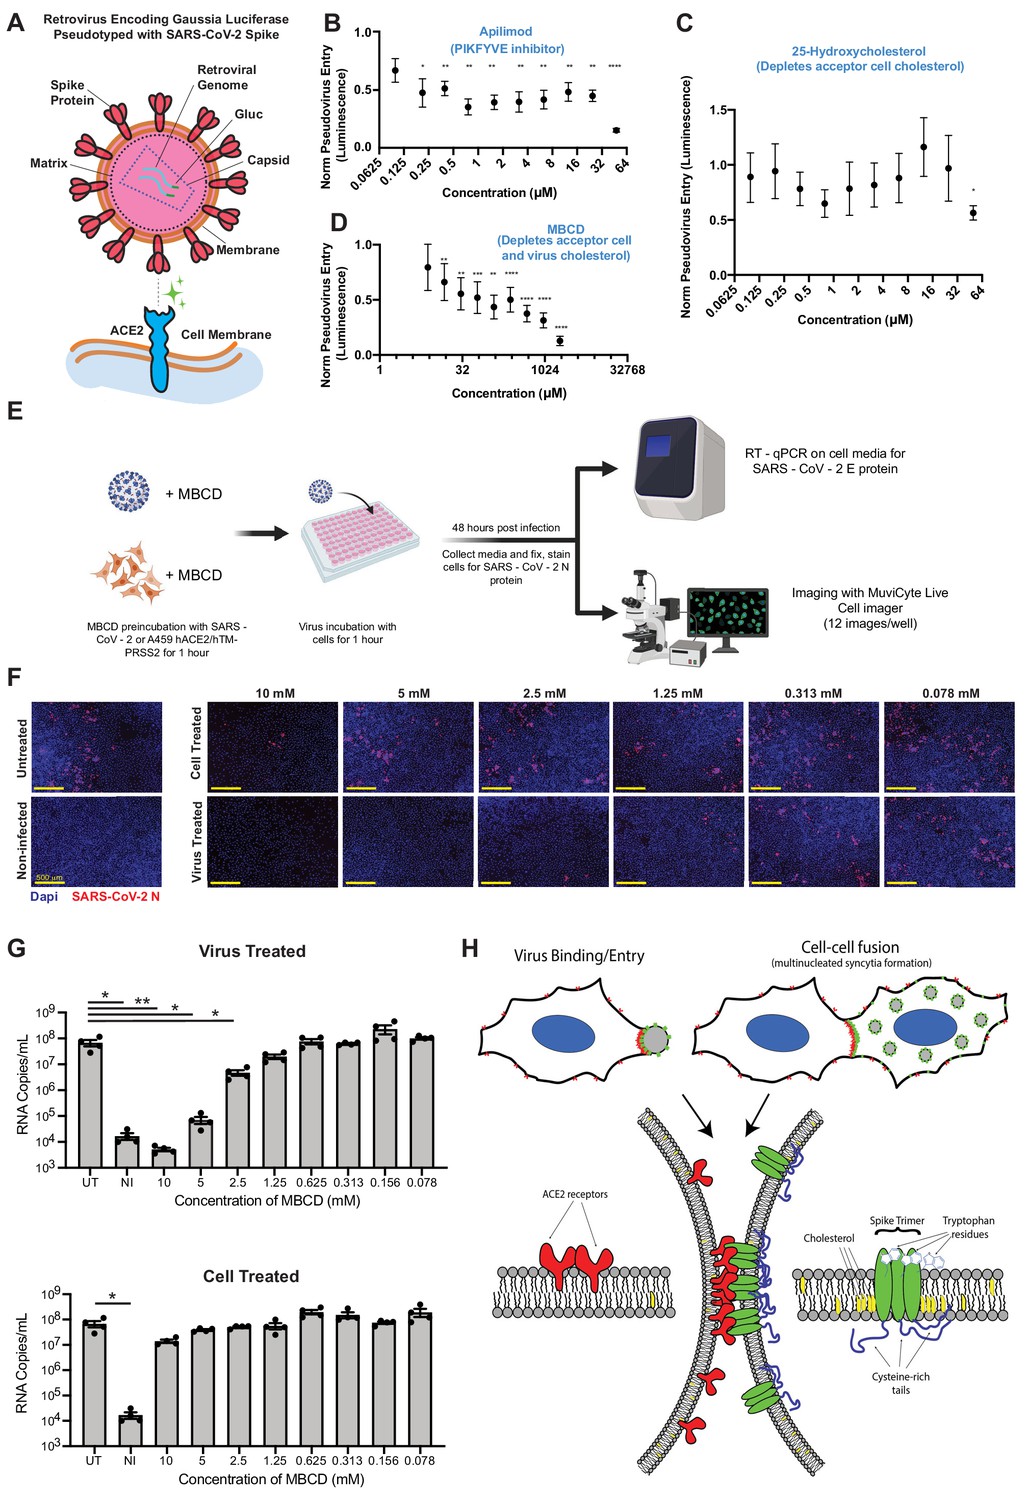
(A) Schematic representation of pseudotyped virus entry assay in ACE2/TMPRSS2-expressing A549 acceptor cells, which are primarily infected via direct fusion pathway. Pseudovirus encodes Gaussia luciferase gene, which allows luminescence-based measure of relative entry as a function of compound concentration. (B) Dose-dependent inhibition of pseudovirus entry (luminescence, arbitrary units) for a positive control compound (apilimod, PIKFYVE inhibitor), relative to control (1 = no effect; 0 = complete block). Mean and SEM indicated for six replicates. P-values of <0.05, <0.01, <0.001, and <0.0001 are represented by *, **, *** and ****, respectively. (C) Similar to (B), but for cholesterol-transport disrupting drug, 25-hydroxycholesterol. (D) Similar to (B), but for plasma membrane cholesterol-stripping compound, MBCD. (E) Schematic of SARS-CoV-2 infection assays in ACE2/TMPRSS2 A549 acceptor cells. Relative infection is determined by RT-qPCR or immunohistochemistry of the SARS-CoV-2 nucleocapsid protein (N). (F) Representative immunofluorescence (nucleocapsid protein, red; nuclei/DAPI, blue) of A549 cells, 48 hr post-infection by SARS-CoV-2. Top: cells pre-treated with indicated dose of MBCD, followed by wash; bottom: pre-treatment of virus. (G) Similar to (F), but using RT-qPCR to quantify viral titer (RNA copies per mL cell media) following MBCD-treatment of virus (top) or cells (bottom). Identical controls plotted on both graphs for visualization purposes: UT = untreated cells, NI = non infected cells. Mean and SEM indicated for n = 4 independent biological replicates (black dots). p-values of <0.05 and<0.01 are represented by * and **, respectively. (H) Graphical model of the biomolecular interactions required for SARS-CoV-2 spike-mediated membrane fusion. Bottom: palmitoylated cysteines (blue) act as multivalent membrane contacts, anchoring trimeric spike peplomers (green) to the phospholipid bilayer (black) and potentially allowing transient higher order assemblies of trimers. Aromatic residues (e.g. tryptophans) at the spike ectodomain-membrane interface associate with accessible cholesterol (yellow) to promote synapse-like clusters with ACE2 receptors (red) on apposing membranes. Without these collective interactions, spike’s fusion machinery (e.g. fusion peptide and heptad repeats) is unable to surmount the energetically costly barrier to lipid bilayer mixing, both in virus-cell (top, left) and cell-cell fusion (top, right).
Tables
Key resources table
| Reagent type (species) or resource | Designation | Source or reference | Identifiers | Additional information |
|---|---|---|---|---|
| Antibody | Mouse monoclonal anti-TTF-1 (clone 8G7G3/1) | Agilent Dako | IR05661-2 | (1:200) |
| Antibody | Rabbit polyclonal anti-SARS-CoV nucleocapsid (N) protein | Rockland | 200–401-A50 | (1:2000) |
| Antibody | Goat polyclonal anti-rabbit IgG- Alexafluor 568 | Thermo Fisher | A11011 | (1:1000) |
| Biological sample (virus) | 2019-nCoV (SARS-CoV-2)/USA-WA1/2020 | Center for Disease Control, BEI | MN985325 | |
| Biological sample (Homo sapiens) | Formalin-fixed, paraffin-embedded, autopsy lung tissue (39 deceased patients or ‘decedents’) | Brigham and Women’s Hospital, Autopsy Division | N/A | |
| Chemical compound, drug | Dulbecco’s Modified Eagle Medium (DMEM), High Glucose, Pyruvate | Thermo Fisher Scientific | 11995065 | |
| Chemical compound, drug | Eagle’s Minimum Essential Media (EMEM) | ATCC | ATCC 30–2003 | |
| Chemical compound, drug | Opti-MEM Reduced Serum Medium | Thermo Fisher | 31985062 | |
| Chemical compound, drug | Penicillin-Streptomycin (10,000 U/mL) | Thermo Fisher | 15140122 | |
| Chemical compound, drug | Fetal Bovine Serum, Inactivated | Atlanta Biologicals | S11150H | |
| Commercial assay or kit | In-Fusion HD Cloning Plus | Takara Bio | 638910 | |
| Chemical compound, drug | Lipofectamine 3000 Transfection Reagent | Thermo Fisher Scientific | L3000008 | |
| Chemical compound, drug | Polybrene | Sigma-Aldrich | TR-1003-G | |
| Chemical compound, drug | Paraformaldehyde (16%) | Electron Microscopy Services | 15710 | |
| Chemical compound, drug | Phusion High-Fidelity DNA Polymerase | New England Biolabs | M0530L | |
| Chemical compound, drug | Texas Red DHPE | Thermo Fisher | T1395MP | |
| Recombinant protein | Annexin V 647 | Thermo Fisher | A13204 | |
| Chemical compound, drug | Small molecule library: LOPAC-1280 (1278 compounds, 96-well) | Sigma-Aldrich | LO1280-1KT | |
| Chemical compound, drug | Small molecule library: LOPAC-Pfizer (90 Pfizer-drugs, 96-well) | Sigma-Aldrich | LO5100 | |
| Chemical compound, drug | Small molecule library: L1200 (355 kinase inhibitors, 96-well) | Selleck Chemicals | L1200 | |
| Chemical compound, drug | Small molecule library: L1900 (120 epigenetic compounds, 96-well) | Selleck Chemicals | L1900 | |
| Chemical compound, drug | Small molecule library: L2300 (378 cancer compounds, 96-well) | Selleck Chemicals | L2300 | |
| Chemical compound, drug | Small molecule library: L4200 (1364 FDA-approved drugs, 96-well) | TargetMol | L4200 | |
| Chemical compound, drug | Small molecule library: Spectrum collection (2400 bioactive compounds, 96-well) | Microsource Discovery | N/A | |
| Chemical compound, drug | Nelfinavir mesylate | R and D Systems | 3766/10 | |
| Chemical compound, drug | Heparin | Sigma-Aldrich | H3393\ | |
| Chemical compound, drug | Nocodazole | Sigma-Aldrich | 487928 | |
| Chemical compound, drug | Amiloride/EIPA | Sigma-Aldrich | A3085 | |
| Chemical compound, drug | Wortmannin | Sigma-Aldrich | W1628-1MG | |
| Chemical compound, drug | Chlorpromazine | Sigma-Aldrich | 215921–500 MG | |
| Chemical compound, drug | Filipin | Sigma-Aldrich | F4767-1MG | |
| Chemical compound, drug | Nystatin | Thermo Fisher | BP29495 | |
| Chemical compound, drug | Leupeptin | Sigma-Aldrich | L2884-5MG | |
| Chemical compound, drug | AEBSF | Sigma-Aldrich | A8456 | |
| Chemical compound, drug | Furin inhibitor II (polyarginine) | Sigma-Aldrich | 344931 | |
| Chemical compound, drug | Decanoyl-RVKR-CMK (chloromethylketone) | Tocris | 3501 | |
| Chemical compound, drug | Methyl-Beta-cyclodextrin (MBCD) | Sigma-Aldrich | C4555-1G | |
| Chemical compound, drug | Lovastatin | Sigma-Aldrich | 438185 | |
| Chemical compound, drug | Camostat mesylate | Sigma-Aldrich | SML0057 | |
| Chemical compound, drug | E-64D (EST) | Sigma-Aldrich | 33000 | |
| Chemical compound, drug | Ammonium chloride | Sigma-Aldrich | A9434 | |
| Chemical compound, drug | Chloroquine diphosphate | Sigma-Aldrich | C6628 | |
| Chemical compound, drug | Gefitinib | Sigma-Aldrich | SML1657 | |
| Chemical compound, drug | BAPTA-AM | Sigma-Aldrich | 196419 | |
| Chemical compound, drug | Latrunculin A | Invitrogen | 428026 | |
| Chemical compound, drug | Rottlerin | Sigma-Aldrich | 557370- | |
| Chemical compound, drug | Dynasore | Sigma-Aldrich | 324410 | |
| Chemical compound, drug | Sodium chlorate | Sigma-Aldrich | 403016 | |
| Chemical compound, drug | Protease inhibitor cocktail | Sigma-Aldrich | P1860-1ML | |
| Chemical compound, drug | Ouabain | Sigma-Aldrich | 4995–1 GM | |
| Chemical compound, drug | Rostafuroxin/PST2238 | Sigma-Aldrich | SML1139 | |
| Chemical compound, drug | Silmitasertib | Selleck Chemicals | S2248 | |
| Chemical compound, drug | R-406 | Selleck Chemicals | .S2194 | |
| Chemical compound, drug | Apilimod | Selleck Chemicals | S6414 | |
| Chemical compound, drug | Bafilomycin A | Enzo | BML-CM110 | |
| Chemical compound, drug | 2-Bromopalmitic acid (2 BP) | Sigma-Aldrich | 238422–10G | |
| Chemical compound, drug | MG132 | Sigma-Aldrich | M8699 | |
| Chemical compound, drug | Monensin | Sigma-Aldrich | M5273 | |
| Chemical compound, drug | Brefeldin A | Sigma-Aldrich | B5936 | |
| Chemical compound, drug | Cycloheximide | Sigma-Aldrich | C4859-1ML | |
| Chemical compound, drug | Dimethyl sulfoxide (DMSO) | Sigma-Aldrich | D2650 | |
| Chemical compound, drug | Actinomycin D | Sigma-Aldrich | A5156-1VL | |
| Chemical compound, drug | Staurosporine | AbCam | ab120056 | |
| Chemical compound, drug | ISRIB | Sigma-Aldrich | SML0843 | |
| Chemical compound, drug | 3-Methyladenine | Sigma-Aldrich | M9281 | |
| Chemical compound, drug | Z-FA-FMK | Selleck Chemicals | S7391 | |
| Chemical compound, drug | NSC 23766 | Selleck Chemicals | S8031 | |
| Chemical compound, drug | Z-VAD-FMK | Selleck Chemicals | S7023 | |
| Chemical compound, drug | AZD8055 | Selleck Chemicals | S1555 | |
| Chemical compound, drug | 25-Hydroxycholesterol | Sigma-Aldrich | H1015 | |
| Chemical compound, drug | Aprotinin (BPTI) | Selleck Chemicals | .S7377 | |
| Chemical compound, drug | Genistein | Selleck Chemicals | S1342 | |
| Chemical compound, drug | Oleic acid (MBCD-conjugated) | Sigma-Aldrich | O1257 | |
| Chemical compound, drug | Cholesterol (MBCD-conjugated) | Sigma-Aldrich | C4951 | |
| Chemical compound, drug | Linoleic acid (MBCD-conjugated) | Sigma-Aldrich | L5900 | |
| Chemical compound, drug | Myriocin | Sigma-Aldrich | M1177-5MG | |
| Chemical compound, drug | Zaragozic Acid A | Cayman | 17452 | |
| Chemical compound, drug | Digitonin | Sigma-Aldrich | D141 | |
| Chemical compound, drug | Bortezomib | Selleck Chemicals | S1013 | |
| Chemical compound, drug | Bupivacaine hydrochloride | Sigma-Aldrich | PHR1128 | |
| Chemical compound, drug | Ropivacaine hydrochloride | Selleck Chemicals | S4058 | |
| Chemical compound, drug | Naftifine hydrochloride | Cayman | 19234 | |
| Chemical compound, drug | Terbinafine hydrochloride | Cayman | 10011619 | |
| Chemical compound, drug | Propofol | Sigma-Aldrich | P-076–1 ML | |
| Chemical compound, drug | Puromycin | Sigma-Aldrich | P7255 | |
| Chemical compound, drug | Blasticidin S | VWR | 1859–25 | |
| Chemical compound, drug | DAPI | Sigma-Aldrich | D9542 | |
| Chemical compound, drug | Hoechst 33342 Solution | Thermo Fisher | 62249 | |
| Chemical compound, drug | AMG 9810 | Cayman | 14715 | |
| Chemical compound, drug | Apomorphine hydrochloride | ApexBio | B6936 | |
| Chemical compound, drug | Avanafil | Cayman | 23024 | |
| Chemical compound, drug | BML-277 | Cayman | 17552 | |
| Chemical compound, drug | Canagliflozin | Cayman | 11575 | |
| Chemical compound, drug | Chlorohexidine | Targetmol | T1147 | |
| Chemical compound, drug | CP-471474 | Cayman | 29442 | |
| Chemical compound, drug | Gossypol | ApexBio | N2135 | |
| Chemical compound, drug | Indacaterol maleate | ApexBio | B1369 | |
| Chemical compound, drug | JFD00244 | Cayman | 14648 | |
| Chemical compound, drug | Miconazole nitrate | Cayman | 15420 | |
| Chemical compound, drug | Moxidectin | ApexBio | B3611 | |
| Chemical compound, drug | PD-407824 | Cayman | 25989 | |
| Chemical compound, drug | Rapamycin | Targetmol | T1537 | |
| Chemical compound, drug | Ritanserin | Tocris | 1955 | |
| Chemical compound, drug | Rolapitant hydrochloride | Targetmol | T3724 | |
| Chemical compound, drug | Scriptaid | ApexBio | A4106 | |
| Chemical compound, drug | SKI II | Cayman | 10009222 | |
| Chemical compound, drug | Sorafenib | Cayman | 10009644 | |
| Chemical compound, drug | TAK-285 | MCE | HY-15196 | |
| Chemical compound, drug | Ticagrelor | Cayman | 15425 | |
| Chemical compound, drug | TW-37 | Cayman | 20999 | |
| Chemical compound, drug | UK-356618 | ApexBio | A4440 | |
| Chemical compound, drug | Vorapaxar | ApexBio | A8809 | |
| Chemical compound, drug | CholEsteryl BODIPY (FL C12) | Thermo Fisher | C3927MP | |
| Chemical compound, drug | Fibronectin from bovine plasma | Sigma-Aldrich | F1141-5MG | |
| Cell line (Homo sapiens, female) | HEK293T | Marc Diamond, UTSW | N/A | |
| Cell line (H. sapiens, female) | U2OS | Tom Muir, Princeton | N/A | |
| Cell line (H. sapiens, male) | Beas2B | Celeste Nelson, Princeton | N/A | |
| Cell line (H. sapien, males) | A549 (ACE2/TMPRSS2) | This study | N/A | |
| Cell line (H. sapiens, male) | Calu3 | ATCC | HTB-55 | |
| Cell line (Cercopithecus aethiops, female) | VeroE6 (monkey) | ATCC | CRL-1586 | |
| Cell line (H. sapiens, female) | U2OS, various | This study | N/A | |
| Cell line (C. aethiops, female) | VeroE6 (monkey), various | This study | N/A | |
| Recombinant DNA reagent | SCARB1-GFP | Addgene | #86979 | |
| Recombinant DNA reagent | GFP1-10 | Addgene | #80409 | |
| Recombinant DNA reagent | GFP11 × 7-mCherry-a-tubulin | Addgene | #70218 | |
| Recombinant DNA reagent | LAMP1-mCherry | Addgene | #45147 | |
| Recombinant DNA reagent | mCherry-CAV1 | Addgene | #55008 | |
| Recombinant DNA reagent | GFP-EEA1 | Addgene | #42307 | |
| Recombinant DNA reagent | SARS-CoV-1-Spike | Addgene | #145031 | |
| Recombinant DNA reagent | RAC1 (H. sapiens) in pANT7_cGST | DNASU | CD00632727 | |
| Recombinant DNA reagent | ACE2 cDNA in pcDNA3.1 | Genscript | OHu20260 | |
| Recombinant DNA reagent | SARS-CoV-2 (2019-nCoV) Spike ORF (Codon Optimized) | Sino Biological | VG40589-UT | |
| Recombinant DNA reagent | pCAGGS-SARS-CoV2-S | BEI Resources, NIH | N/A | |
| Recombinant DNA reagent | pMLV gag-pol | Ploss Lab, Princeton | N/A | |
| Recombinant DNA reagent | pLMN8-Gluc | This study | N/A | |
| Recombinant DNA reagent | p-LAT Transmembrane-mRFP | This study | N/A | |
| Recombinant DNA reagent | PSP (lentivirus packaging plasmid) | Marc Diamond, UTSW | N/A | |
| Recombinant DNA reagent | VSVG (lentivirus packaging plasmid) | Marc Diamond, UTSW | N/A | |
| Recombinant DNA reagent | FM5 lentiviral vector (Ubiquitin C promoter) | Sanders et al., 2014 | N/A | |
| Recombinant DNA reagent | FM5-mGFP-Standardized glycine-serine (GS) Linker-AscI Site-STOP | Sanders et al., 2020 | N/A | |
| Recombinant DNA reagent | FM5-mCherry-Standardized GS Linker-AscI Site-STOP | Sanders et al., 2020 | N/A | |
| Recombinant DNA reagent | FM5-miRFP670-Standardized GS Linker-AscI Site-STOP | Sanders et al., 2020 | N/A | |
| Recombinant DNA reagent | FM5-NheI Site-Standardized GS Linker-mGFP | Sanders et al., 2020 | N/A | |
| Recombinant DNA reagent | FM5-NheI Site-Standardized GS Linker-mCherry | Sanders et al., 2020 | N/A | |
| Recombinant DNA reagent | FM5-NheI Site-Standardized GS Linker-miRFP670 | Sanders et al., 2020 | N/A | |
| Recombinant DNA reagent | FM5-NheI Site-Standardized GS Linker-EYFP | This study | N/A | |
| Recombinant DNA reagent | FM5-HNRNPA1-EYFP | This study | N/A | |
| Recombinant DNA reagent | FM5-FUS-mCherry | This study | N/A | |
| Recombinant DNA reagent | FM5-GFP1-10 | This study | N/A | |
| Recombinant DNA reagent | FM5-GFP11 × 7 | This study | N/A | |
| Recombinant DNA reagent | FM5-mGFP-EEA1 | This study | N/A | |
| Recombinant DNA reagent | FM5-miRFP670-EEA1 | This study | N/A | |
| Recombinant DNA reagent | FM5-mGFP-RAC1 | This study | N/A | |
| Recombinant DNA reagent | FM5-miRFP670-RAC1 | This study | N/A | |
| Recombinant DNA reagent | FM5-mGFP-CAV1 | This study | N/A | |
| Recombinant DNA reagent | FM5-miRFP670-CAV1 | This study | N/A | |
| Recombinant DNA reagent | FM5-LAMP1-mGFP | This study | N/A | |
| Recombinant DNA reagent | FM5-LAMP1- miRFP670 | This study | N/A | |
| Recombinant DNA reagent | FM5-SCARB1-mGFP | This study | N/A | |
| Recombinant DNA reagent | FM5-SCARB1-miRFP670 | This study | N/A | |
| Recombinant DNA reagent | FM5-MYMK-mGFP | This study | N/A | |
| Recombinant DNA reagent | FM5-MYMK-mCherry | This study | N/A | |
| Recombinant DNA reagent | FM5-MYMK-miRFP670 | This study | N/A | |
| Recombinant DNA reagent | FM5-MYMX-mGFP | This study | N/A | |
| Recombinant DNA reagent | FM5-MYMX-mCherry | This study | N/A | |
| Recombinant DNA reagent | FM5-MYMX-miRFP670 | This study | N/A | |
| Recombinant DNA reagent | FM5-p14 (Reptilian orthoreovirus)-mGFP | This study | N/A | |
| Recombinant DNA reagent | FM5-p14 (Reptilian orthoreovirus)-mCherry | This study | N/A | |
| Recombinant DNA reagent | FM5-p14 (Reptilian orthoreovirus)- miRFP670 | This study | N/A | |
| Recombinant DNA reagent | FM5-Albumin signal sequence (SS)−8 amino acid GS Linker-B7 Transmembrane (TM)-mGFP | This study | N/A | |
| Recombinant DNA reagent | FM5-Albumin SS-8 amino acid GS Linker-B7 TM-mCherry | This study | N/A | |
| Recombinant DNA reagent | FM5-Albumin SS-8 amino acid GS Linker-B7 TM-miRFP670 | This study | N/A | |
| Recombinant DNA reagent | FM5-ACE2-mGFP | This study | N/A | |
| Recombinant DNA reagent | FM5-ACE2-mCherry | This study | N/A | |
| Recombinant DNA reagent | FM5-ACE2-miRFP670 | This study | N/A | |
| Recombinant DNA reagent | FM5-ACE2 Ectodomain-8 amino acid GS Linker-B7 TM/CTD-mGFP | This study | N/A | |
| Recombinant DNA reagent | FM5-ACE2 Ectodomain-8 amino acid GS Linker-B7 TM-mCherry | This study | N/A | |
| Recombinant DNA reagent | FM5-ACE2 Ectodomain-8 amino acid GS Linker-B7 TM-miRFP670 | This study | N/A | |
| Recombinant DNA reagent | FM5-SARS-CoV-1 Spike-mGFP | This study | N/A | |
| Recombinant DNA reagent | FM5-SARS-CoV-1 Spike-mCherry | This study | N/A | |
| Recombinant DNA reagent | FM5-SARS-CoV-1 Spike-miRFP670 | This study | N/A | |
| Recombinant DNA reagent | FM5-Spike Full-length (FL) (1–1273)-mGFP | This study | N/A | |
| Recombinant DNA reagent | FM5-Spike Full-length (FL) (1–1273)-mCherry | This study | N/A | |
| Recombinant DNA reagent | FM5-Spike Full-length (FL) (1–1273)-miRFP670 | This study | N/A | |
| Recombinant DNA reagent | FM5-Spike SS (1-12)-RBD (319-541)−8 amino acid GS Linker-B7 TM/CTD-mGFP | This study | N/A | |
| Recombinant DNA reagent | FM5-Spike SS (1-12)-RBD (319-541)−8 amino acid GS Linker-B7 TM/CTD-mCherry | This study | N/A | |
| Recombinant DNA reagent | FM5-Spike SS (1-12)-RBD (319-541)−8 amino acid GS Linker-B7 TM/CTD-miRFP670 | This study | N/A | |
| Recombinant DNA reagent | FM5-Spike SS (1-12)-RBD (319-541)-WT TM/CTD (1203–1273)-mGFP | This study | N/A | |
| Recombinant DNA reagent | FM5-Spike SS (1-12)-RBD (319-541)-WT TM/CTD (1203–1273)-mCherry | This study | N/A | |
| Recombinant DNA reagent | FM5-Spike SS (1-12)-RBD (319-541)-WT TM/CTD (1203–1273)-miRFP670 | This study | N/A | |
| Recombinant DNA reagent | FM5-Spike Ectodomain (1–1213)−8 amino acid GS Linker-B7 TM/CTD-mGFP | This study | N/A | |
| Recombinant DNA reagent | FM5-Spike Ectodomain (1–1213)−8 amino acid GS Linker-B7 TM/CTD-mCherry | This study | N/A | |
| Recombinant DNA reagent | FM5-Spike Ectodomain (1–1213)−8 amino acid GS Linker-B7 TM/CTD-miRFP670 | This study | N/A | |
| Recombinant DNA reagent | FM5-Spike B7 TM Swap with Extracellular Linker (1-1213-8 amino acid GS linker-B7 TM-1235–1273)-mGFP | This study | N/A | |
| Recombinant DNA reagent | FM5-Spike B7 TM Swap with Extracellular Linker (1-1213-8 amino acid GS linker-B7 TM-1235–1273)-miRFP670 | This study | N/A | |
| Recombinant DNA reagent | FM5-Spike B7 TM Swap (1–1213-B7 TM-1235–1273)-mGFP | This study | N/A | |
| Recombinant DNA reagent | FM5-Spike B7 TM Swap (1–1213-B7 TM-1235–1273)-miRFP670 | This study | N/A | |
| Recombinant DNA reagent | FM5-Spike ITGA1 TM Swap (1–1213-ITGA1 TM-1235–1273)--mGFP | This study | N/A | |
| Recombinant DNA reagent | FM5-Spike ITGA1 TM Swap (1–1213-ITGA1 TM-1235–1273)-miRFP670 | This study | N/A | |
| Recombinant DNA reagent | FM5-Spike 1–1268-mGFP | This study | N/A | |
| Recombinant DNA reagent | FM5-Spike 1–1268-miRFP670 | This study | N/A | |
| Recombinant DNA reagent | FM5-Spike 1–1266-mGFP | This study | N/A | |
| Recombinant DNA reagent | FM5-Spike 1–1266-miRFP670 | This study | N/A | |
| Recombinant DNA reagent | FM5-Spike 1–1263-mGFP | This study | N/A | |
| Recombinant DNA reagent | FM5-Spike 1–1263-miRFP670 | This study | N/A | |
| Recombinant DNA reagent | FM5-Spike 1–1260-mGFP | This study | N/A | |
| Recombinant DNA reagent | FM5-Spike 1–1260-miRFP670 | This study | N/A | |
| Recombinant DNA reagent | FM5-Spike 1–1256-mGFP | This study | N/A | |
| Recombinant DNA reagent | FM5-Spike 1–1256-miRFP670 | This study | N/A | |
| Recombinant DNA reagent | FM5-Spike 1–1245-mGFP | This study | N/A | |
| Recombinant DNA reagent | FM5-Spike 1–1245-miRFP670 | This study | N/A | |
| Recombinant DNA reagent | FM5-Spike 1–1239-mGFP | This study | N/A | |
| Recombinant DNA reagent | FM5-Spike 1–1239-miRFP670 | This study | N/A | |
| Recombinant DNA reagent | FM5-Spike 1–1234 (ΔCTD)-mGFP | This study | N/A | |
| Recombinant DNA reagent | FM5-Spike 1–1234 (ΔCTD)-miRFP670 | This study | N/A | |
| Recombinant DNA reagent | FM5-Spike CysAlaMutant (C1235A/C1236A/C1240A/C1241A/C1243A/C1247A/C1248A/C1250A/C1253A/C1254A)-mGFP | This study | N/A | |
| Recombinant DNA reagent | FM5-Spike CysAlaMutant (C1235A/C1236A/C1240A/C1241A/C1243A/C1247A/C1248A/C1250A/C1253A/C1254A)-miRFP670 | This study | N/A | |
| Recombinant DNA reagent | FM5-Spike C1235A/C1236A-mGFP | This study | N/A | |
| Recombinant DNA reagent | FM5-Spike C1235A/C1236A-miRFP670 | This study | N/A | |
| Recombinant DNA reagent | FM5-Spike SS (1-12)-ΔNTD (319–1273)-mGFP | This study | N/A | |
| Recombinant DNA reagent | FM5-Spike SS (1-12)-ΔNTD (319–1273)-miRFP670 | This study | N/A | |
| Recombinant DNA reagent | FM5-Spike ΔRBD (1–318, 540–1273)-mGFP | This study | N/A | |
| Recombinant DNA reagent | FM5-Spike ΔRBD (1–318, 540–1273)-miRFP670 | This study | N/A | |
| Recombinant DNA reagent | FM5-Spike ΔFusionPeptide (1–787, 807–1273)-mGFP | This study | N/A | |
| Recombinant DNA reagent | FM5-Spike ΔFusionPeptide (1–787, 807–1273)-miRFP670 | This study | N/A | |
| Recombinant DNA reagent | FM5-Spike ΔHR1 (1–919, 971–1273)-mGFP | This study | N/A | |
| Recombinant DNA reagent | FM5-Spike ΔHR1 (1–919, 971–1273)-miRFP670 | This study | N/A | |
| Recombinant DNA reagent | FM5-Spike ΔHR2 (1–1162, 1203–1273)-mGFP | This study | N/A | |
| Recombinant DNA reagent | FM5-Spike ΔHR2 (1–1162, 1203–1273)-miRFP670 | This study | N/A | |
| Recombinant DNA reagent | FM5-Spike ΔBothCleavageSites (‘CS’) (Δ685/Δ686/Δ815/Δ816)-mGFP | This study | N/A | |
| Recombinant DNA reagent | FM5-Spike ΔBothCS (Δ685/Δ686/Δ815/Δ816)-miRFP670 | This study | N/A | |
| Recombinant DNA reagent | FM5-Spike ΔS1/S2CS (Δ685/Δ686)-mGFP | This study | N/A | |
| Recombinant DNA reagent | FM5-Spike ΔS1/S2CS (Δ685/Δ686)-miRFP670 | This study | N/A | |
| Recombinant DNA reagent | FM5-Spike ΔS2’CS (Δ815/Δ816)-mGFP | This study | N/A | |
| Recombinant DNA reagent | FM5-Spike ΔS2’CS (Δ815/Δ816)-miRFP670 | This study | N/A | |
| Recombinant DNA reagent | FM5-Spike S813G-mGFP | This study | N/A | |
| Recombinant DNA reagent | FM5-Spike S813G-miRFP670 | This study | N/A | |
| Recombinant DNA reagent | FM5-Spike S816G-mGFP | This study | N/A | |
| Recombinant DNA reagent | FM5-Spike S816G-miRFP670 | This study | N/A | |
| Recombinant DNA reagent | FM5-Spike R815A-mGFP | This study | N/A | |
| Recombinant DNA reagent | FM5-Spike R815A-miRFP670 | This study | N/A | |
| Recombinant DNA reagent | FM5-Spike R815K-mGFP | This study | N/A | |
| Recombinant DNA reagent | FM5-Spike R815K-miRFP670 | This study | N/A | |
| Recombinant DNA reagent | FM5-Spike R815A/S816G-mGFP | This study | N/A | |
| Recombinant DNA reagent | FM5-Spike R815A/S816G-miRFP670 | This study | N/A | |
| Recombinant DNA reagent | FM5-Spike R815K/S816G-mGFP | This study | N/A | |
| Recombinant DNA reagent | FM5-Spike R815K/S816G-miRFP670 | This study | N/A | |
| Recombinant DNA reagent | FM5-Spike S813G/R815A-mGFP | This study | N/A | |
| Recombinant DNA reagent | FM5-Spike S813G/R815A-miRFP670 | This study | N/A | |
| Recombinant DNA reagent | FM5-Spike S813G/R815K-mGFP | This study | N/A | |
| Recombinant DNA reagent | FM5-Spike S813G/R815K-miRFP670 | This study | N/A | |
| Recombinant DNA reagent | FM5-Spike S1 (1–685)-WT TM/CTD (1203–1273)-mGFP | This study | N/A | |
| Recombinant DNA reagent | FM5-Spike S1 (1–685)-WT TM/CTD (1203–1273)-miRFP670 | This study | N/A | |
| Recombinant DNA reagent | FM5-Spike S1 (1–685)−8 amino acid GS Linker-B7 TM/CTD-mGFP | This study | N/A | |
| Recombinant DNA reagent | FM5-Spike S1 (1–685)−8 amino acid GS Linker-B7 TM/CTD-miRFP670 | This study | N/A | |
| Recombinant DNA reagent | FM5-Spike SS (1-12)-S2 (686–1273)-mGFP | This study | N/A | |
| Recombinant DNA reagent | FM5-Spike SS (1-12)-S2 (686–1273)-miRFP670 | This study | N/A | |
| Recombinant DNA reagent | FM5-Spike SS (1-12)-S2 (686–1213)−8 amino acid GS Linker-B7 TM/CTD Swap-mGFP | This study | N/A | |
| Recombinant DNA reagent | FM5-Spike SS (1-12)-S2 (686–1213)−8 amino acid GS Linker B7 TM/CTD Swap-miRFP670 | This study | N/A | |
| Software, algorithm | ChemAxon Physicochemical Property Analysis | Morgan et al., Angew. Chem. Int. Ed., 2018 | https://chemaxon.com/ | |
| Software, algorithm | R Software Mann-Whitney U Statistical Analysis | Morgan et al., Angew. Chem. Int. Ed., 2018 | https://www.r-project.org/ | |
| Software, algorithm | NCGC Scaffold Hopper | NCATS Chemical Genomics Centre (NCGC) | https://tripod.nih.gov | |
| Software, algorithm | RDKit Substructure Analysis | RDKit | https://www.rdkit.org/ | |
| Software, algorithm | Python Software | Python | https://www.python.org/ | |
| Software, algorithm | GraphPad Prism Nonlinear Regression | GraphPad | https://www.graphpad.com/ | |
| Software, algorithm | MATLAB R2017b | Mathworks | https://www.mathworks.com/ | |
| Software, algorithm | ImageJ | Schneider et al., Nature Methods, 2012 | https://imagej.nih.gov/ij/ | |
| Software, algorithm | PANTHER v14.0 Gene Ontology | Mi et al., Nature Protocols, 2019 | https://pantherdb.org | |
| Software, algorithm | BioRender (Paid Academic Plan) | BioRender | https://bio-render.com |
Additional files
-
Supplementary file 1
Related to Figure 4.
Raw data from unbiased drug repurposing screen.
- https://cdn.elifesciences.org/articles/65962/elife-65962-supp1-v2.xlsx
-
Supplementary file 2
Related to Figure 5.
Viral transmembrane proteins with proximal cysteine-rich regions.
- https://cdn.elifesciences.org/articles/65962/elife-65962-supp2-v2.xlsx
-
Supplementary file 3
Related to Figure 5.
Human transmembrane proteins with spike-like membrane proximal regions.
- https://cdn.elifesciences.org/articles/65962/elife-65962-supp3-v2.xlsx
-
Supplementary file 4
Amino acid composition of transmembrane proteins used in this study and cellular targets associated with extensively tested compounds.
- https://cdn.elifesciences.org/articles/65962/elife-65962-supp4-v2.xlsx
-
Transparent reporting form
- https://cdn.elifesciences.org/articles/65962/elife-65962-transrepform-v2.docx
Download links
A two-part list of links to download the article, or parts of the article, in various formats.
Downloads (link to download the article as PDF)
Open citations (links to open the citations from this article in various online reference manager services)
Cite this article (links to download the citations from this article in formats compatible with various reference manager tools)
SARS-CoV-2 requires cholesterol for viral entry and pathological syncytia formation
eLife 10:e65962.
https://doi.org/10.7554/eLife.65962


