Single-cell analysis of mosquito hemocytes identifies signatures of immune cell subtypes and cell differentiation
- Department of Entomology, Iowa State University, United States
- Department of Molecular Biosciences, The Wenner-Gren Institute, Stockholm University, Sweden
- Integrated Cardio Metabolic Centre, Department of Medicine, Karolinska Institutet, Novum, Sweden
- Microbial Single Cell Genomics facility, SciLifeLab, Biomedical Center (BMC) Uppsala University, Sweden
Figures
Figure 1 with 4 supplements
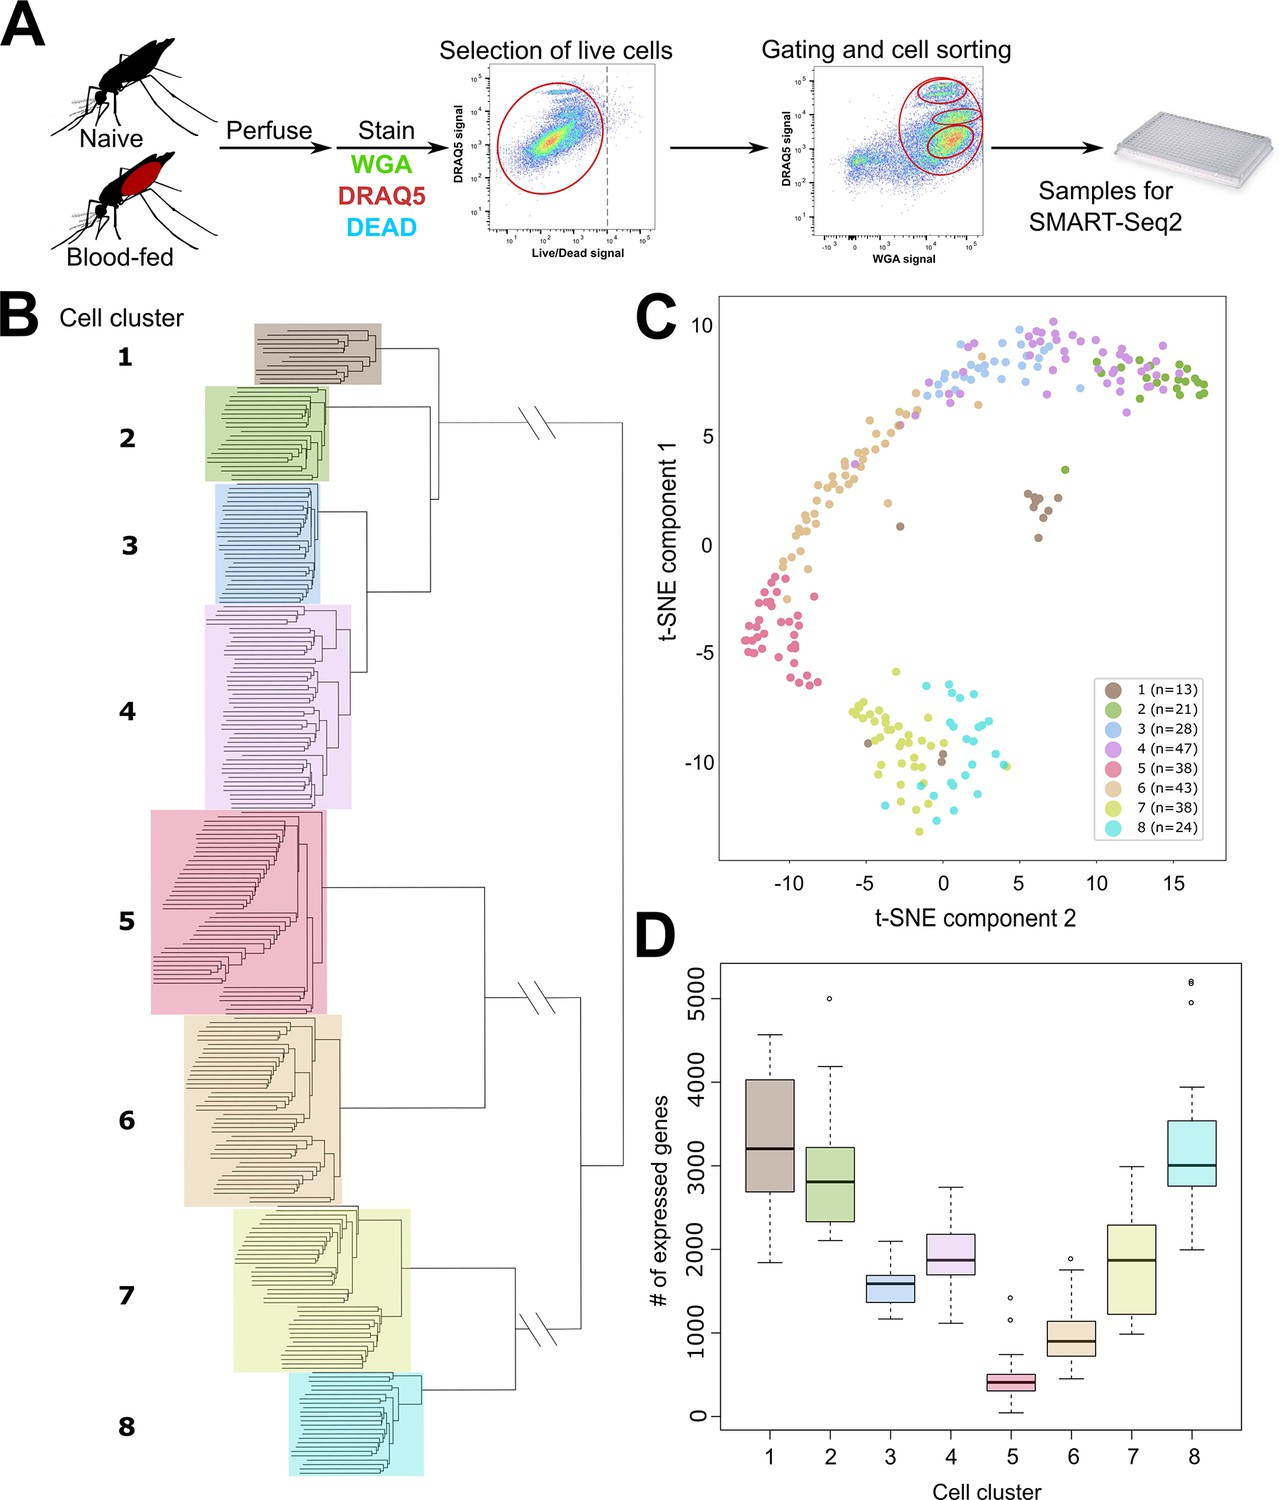
scRNA-seq of An. gambiae immune cells.
(A) Graphical overview of the isolation of mosquito immune cells from naive and blood-fed mosquitoes. Following perfusion, cells were stained to enable processing by fluorescent activated cell sorting (FACS) and isolation for scRNA-seq. Resulting immune cells data were separated into eight-cell clusters based on hierarchical clustering analysis (B) and visualized using a t-Distributed Stochastic Neighbor Embedding (t-SNE) plot (C). The number of expressed genes per cluster are displayed as a boxplot (D).
Figure 1—figure supplement 1
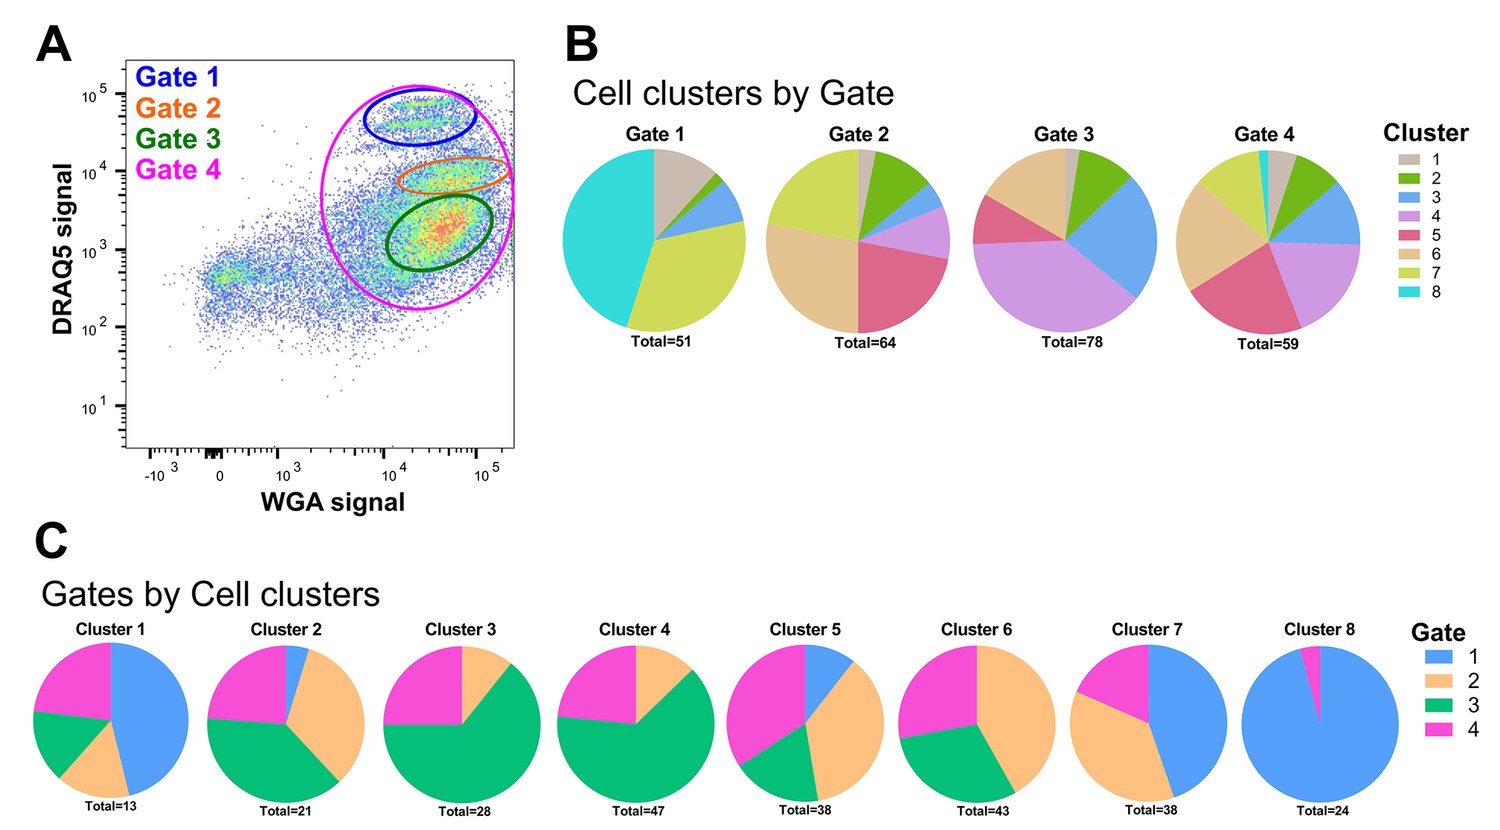
FACS sorting of mosquito immune cell populations.
(A) Representative image of An. gambiae immune cell populations examined by flow cytometry. Distinct sub-populations of cells were separated into four gates: Gates 1–3 as unique populations based on WGA and DRAQ5 signal and Gate four to sample a mixed cell population. (B) The unique cell clusters identified in our RNA-seq analysis are visualized by the FACS gating from which they originated. (C) An additional breakdown of immune cell clusters by gate.
Figure 1—figure supplement 2
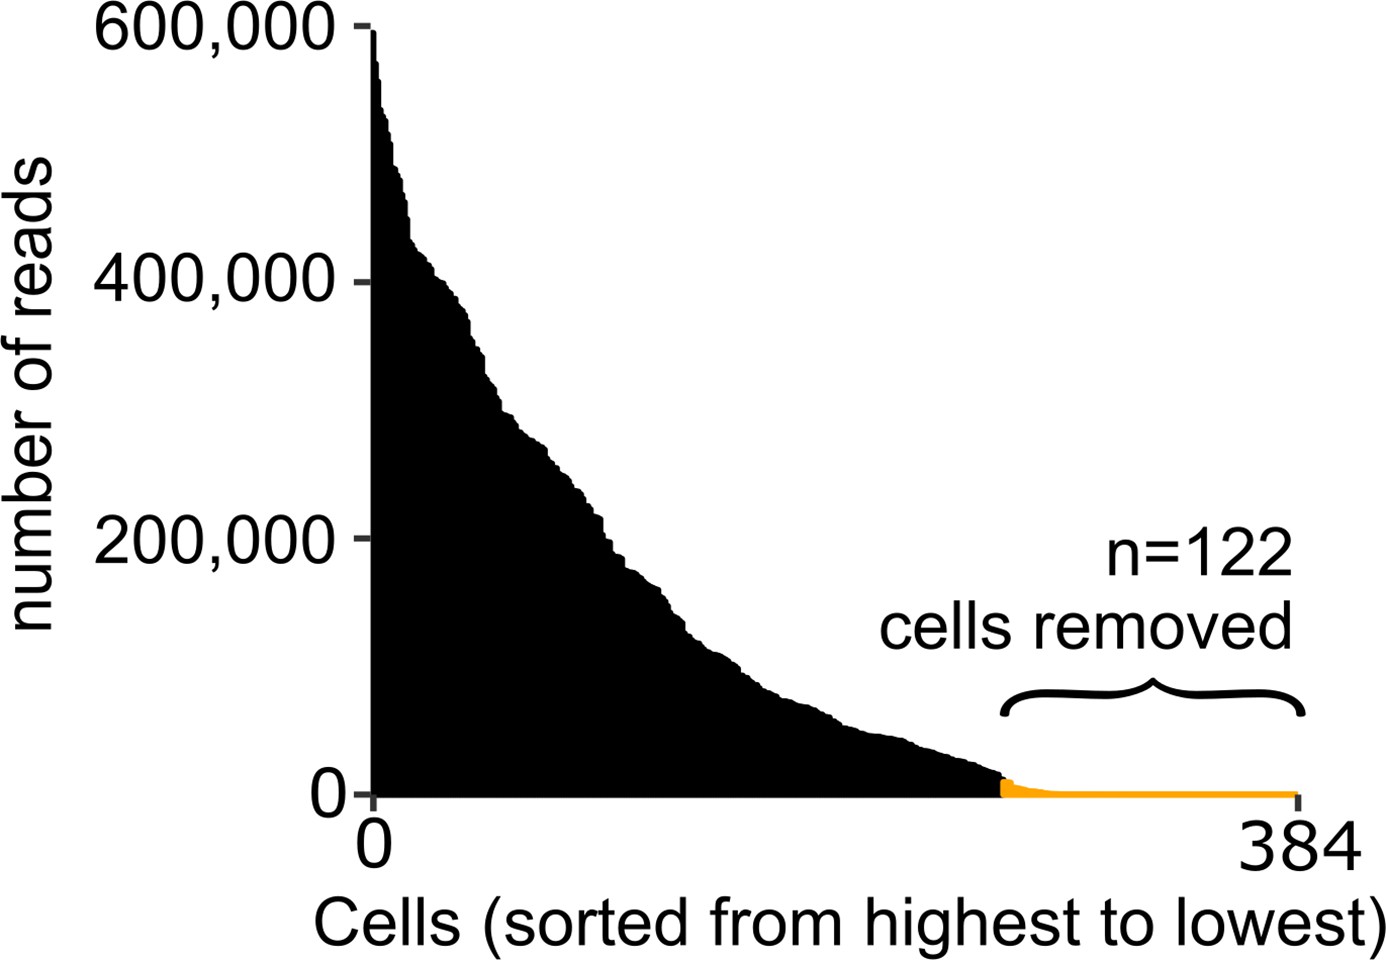
Quality assessment of scRNA-seq analysis on mosquito immune cells.
The number of transcript reads per cell was used to determine the quality of single-cell data. Using a cutoff of 10,000 reads/cell, we removed 122 cells from our analysis, resulting in a total of 262 cells.
Figure 1—figure supplement 3
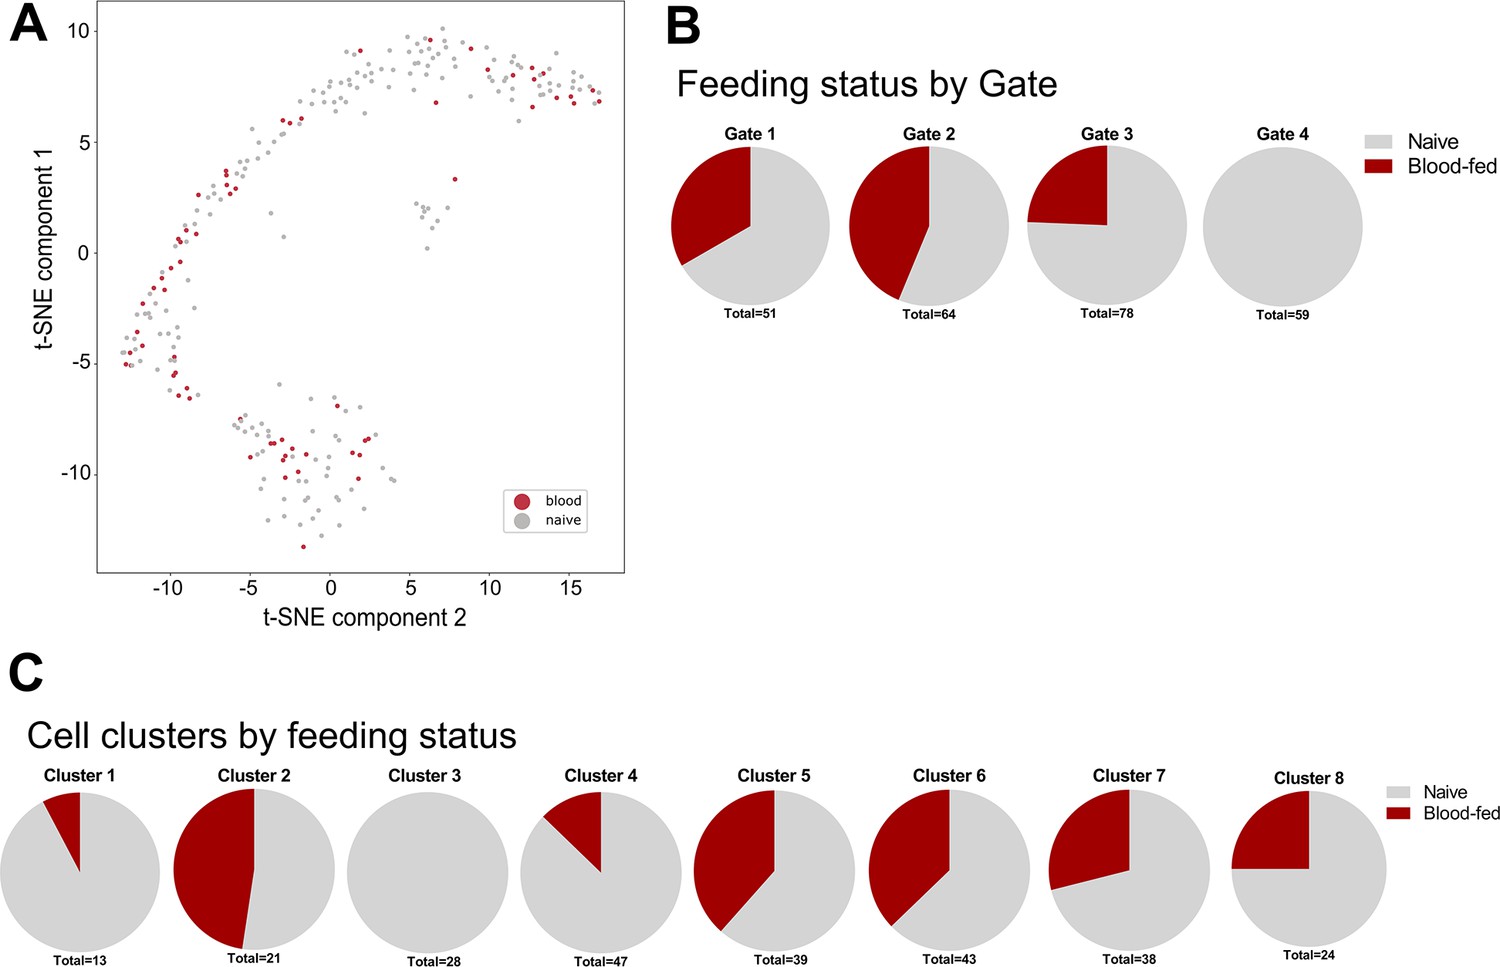
Naive and blood-fed immune cells isolated in FACS analysis.
(A) Mosquito immune cells isolated from naive or blood-fed conditions visualized by t-SNE. (B) Cells from naive and blood-fed conditions were isolated in each of the FACS gatings, except for the presence of blood-fed samples in Gate 4 which were not included in our methodology. (C) An additional breakdown of immune cell clusters by feeding status reveals the presence of these immune cell populations under both naive and blood-fed conditions, with the exception of Cluster 3 that was only identified under naive conditions. In the isolation of cells blood-fed conditions, samples were not collected using the Gate 4 in our FACS gating methodology.
Figure 1—figure supplement 4
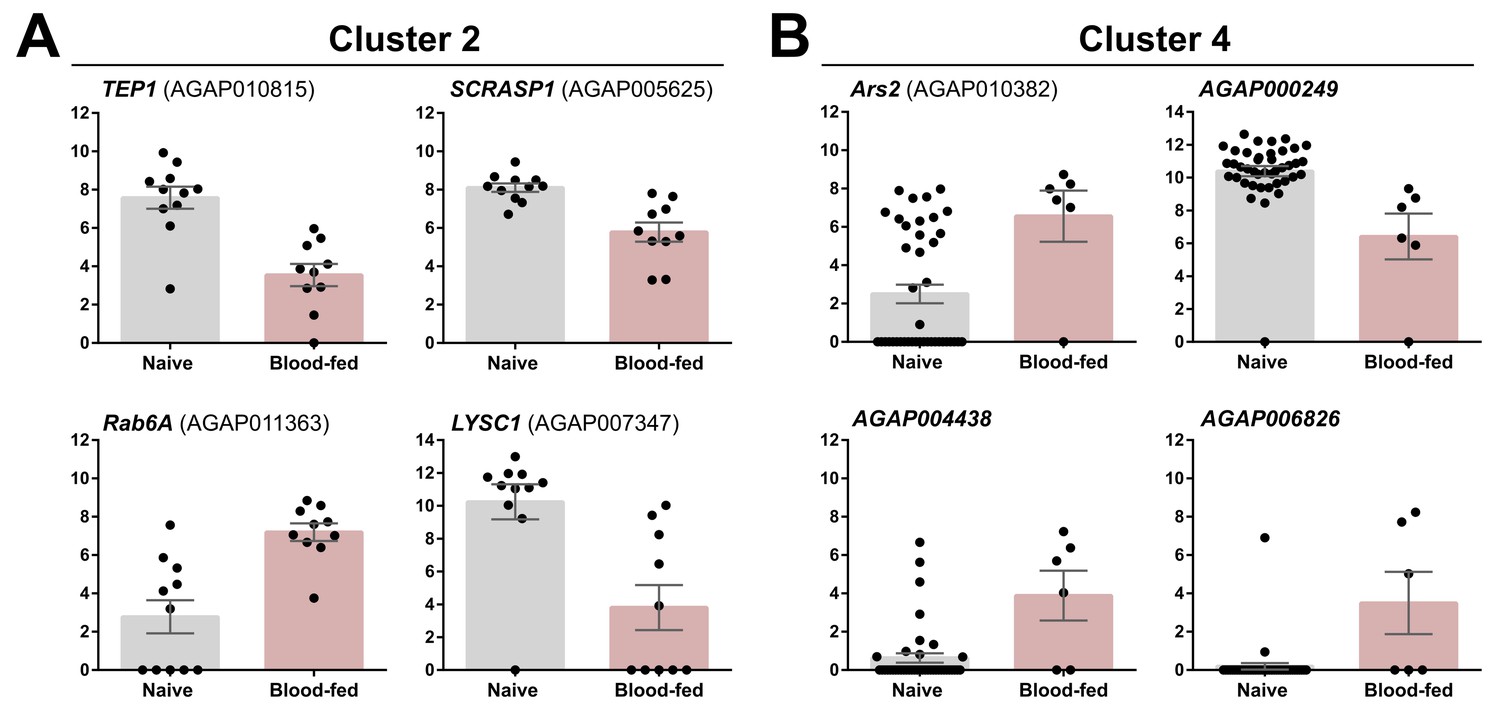
Examination of differentially regulated genes in Clusters 2 and 4 under naive and blood-fed conditions.
Transcripts with significant differences in gene expression between naive and blood-fed conditions are displayed for Cluster 2 (A) and Cluster 4 (B). Black dots represent FKPM values obtained from individual cells within each cluster and physiological condition. Data are displayed as the mean +/- SEM.
Figure 2 with 8 supplements
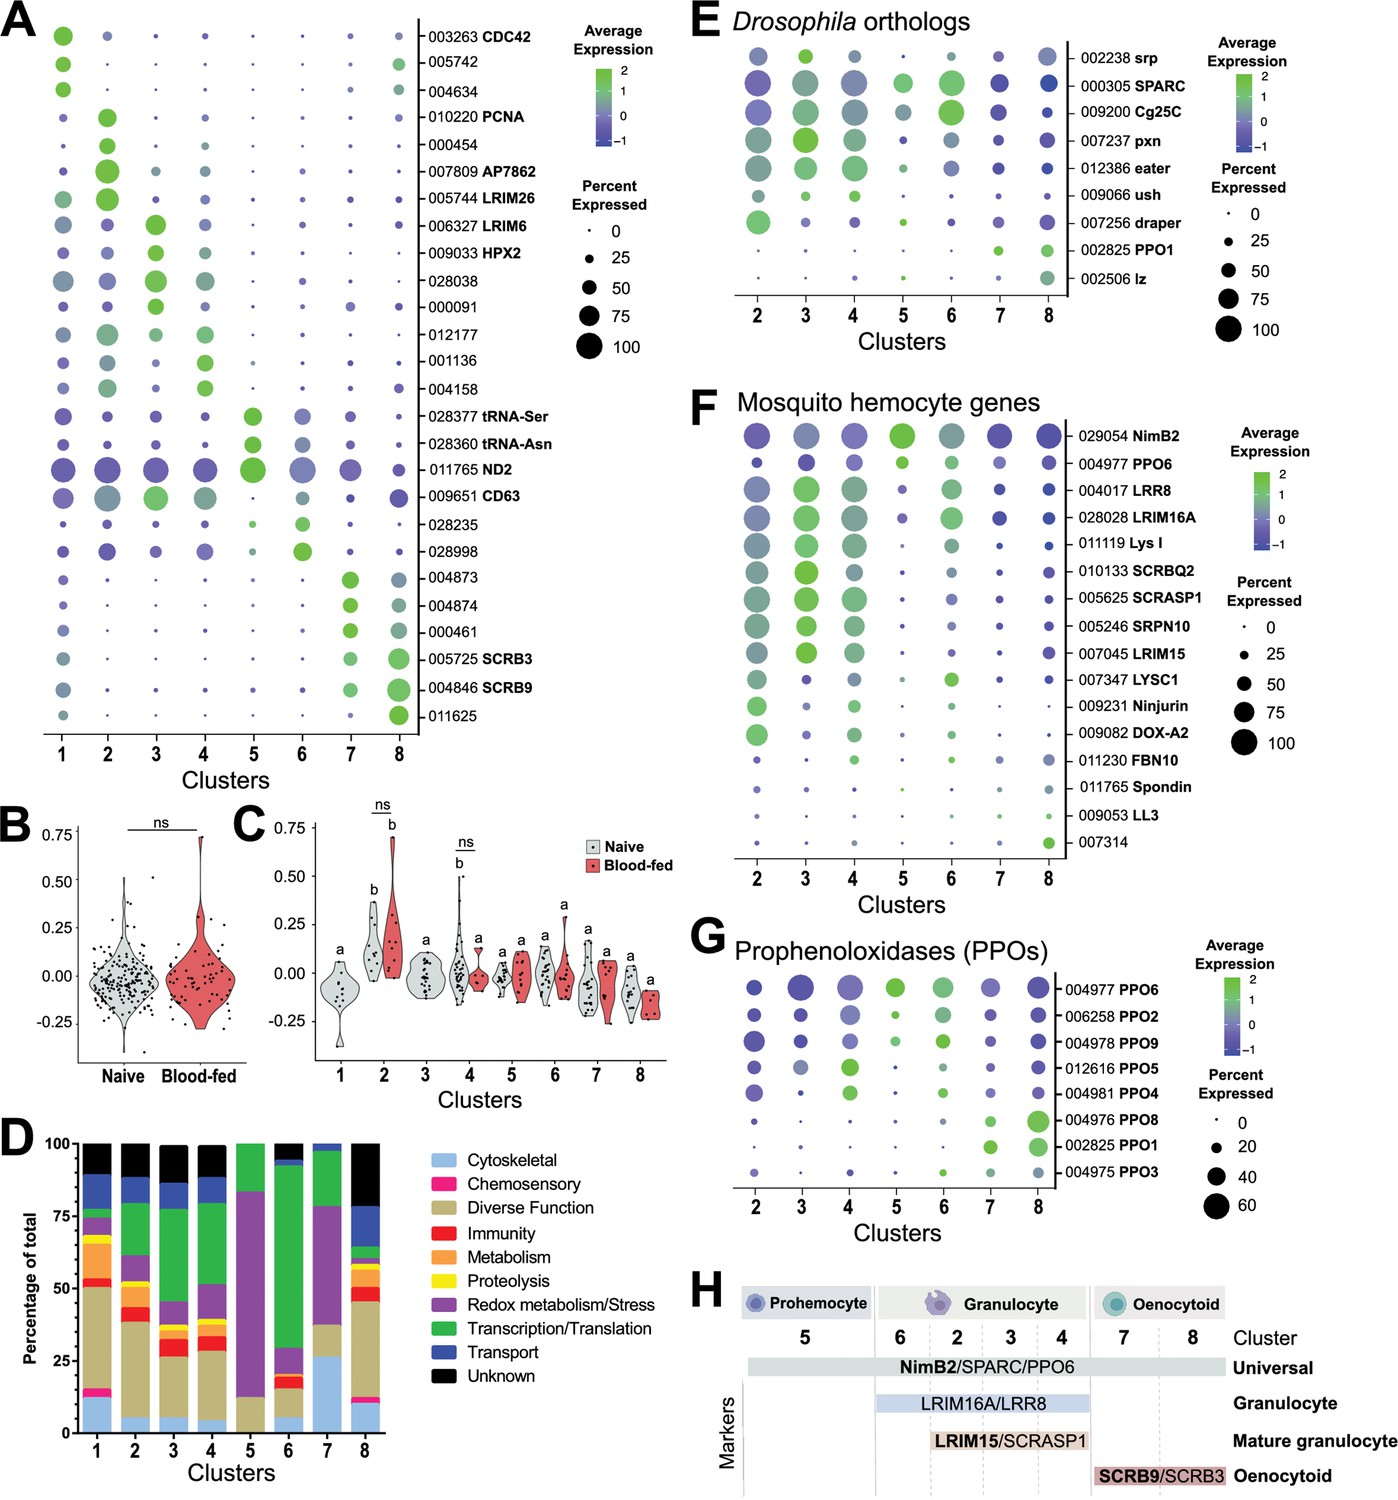
Comparative analysis of mosquito immune cells.
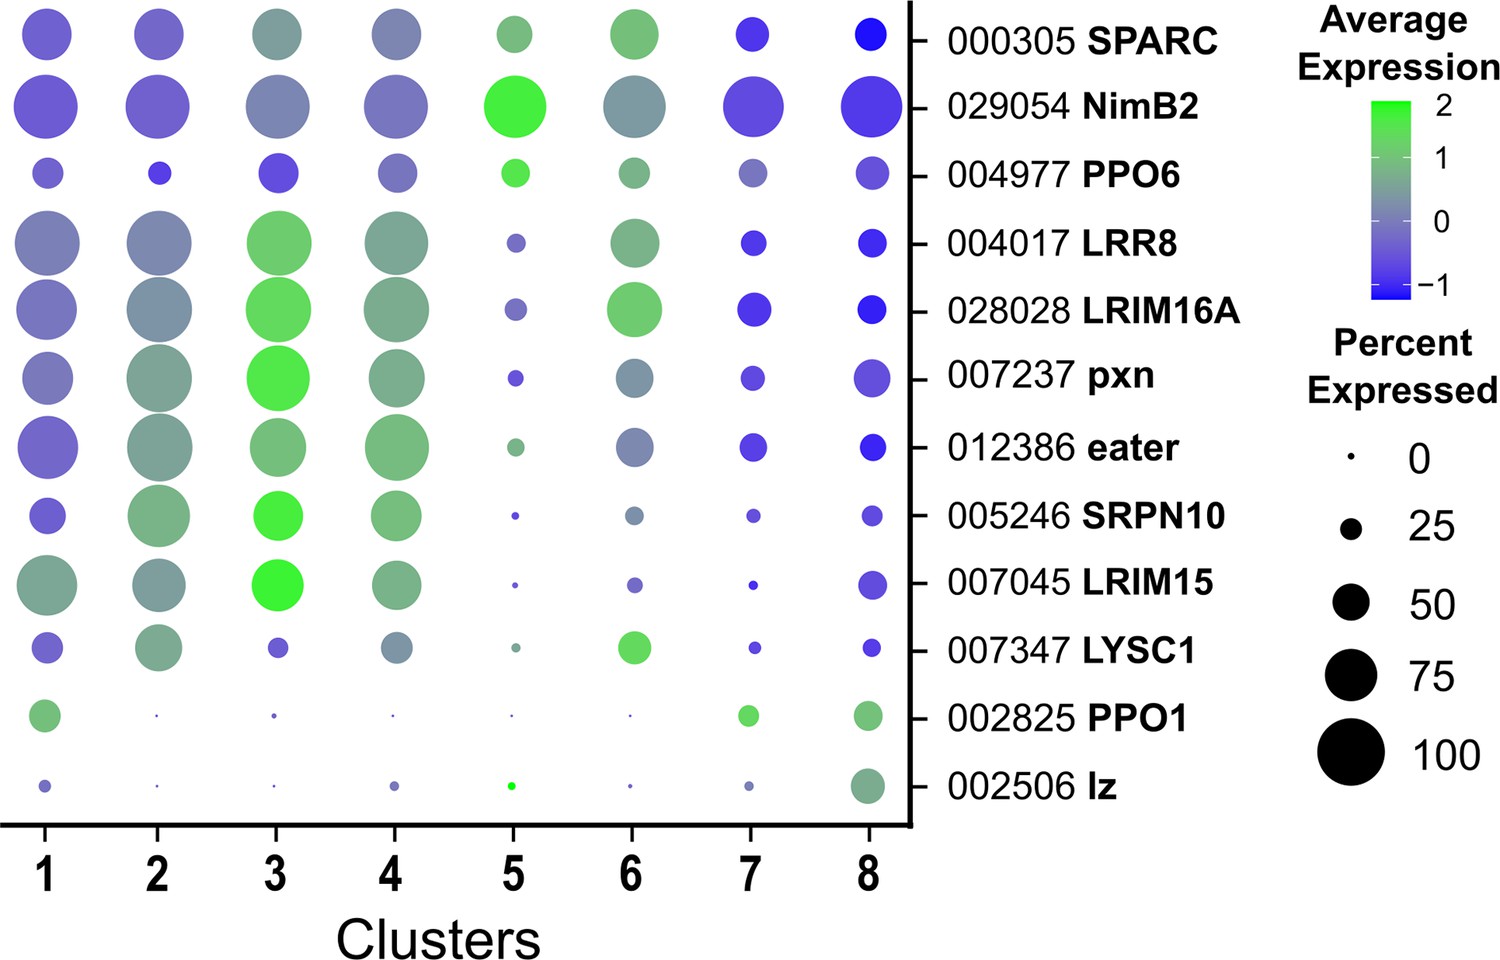
(A) Marker gene expression displayed by dot plot across cell clusters. Dot color shows levels of average expression, while dot size represents the percentage of cells expressing the corresponding genes in each cell cluster. (B) Violin plot of cell cycle genes (GO::0007049) displayed as the difference in average gene expression levels between the cell cycle gene set in cells under naïve and blood-fed conditions. (C) Similar comparisons of cell cycle genes were examined in individual cell clusters and under naïve and blood-fed conditions where possible. For B and C, positive numbers indicate higher levels of cell cycle gene expression compared to the random set for that physiological condition or cell cluster. (D) Gene ontology (GO) analysis of genes expressed in >80% cells within each respective cluster. Heat maps of candidate genes to Drosophila hemocyte orthologs (E), described mosquito hemocyte genes (F), or An. gambiae prophenoloxidases (PPOs) (G) to enable the characterization of immune cells form each cell cluster. (H) From these analysis, immune cells cluster were assigned to tentative cell types (prohemocytes, granulocytes, oenocytoids) based on the expression subtype-specific marker expression. Genes in bold are featured prominently in our downstream analysis.
Figure 2—figure supplement 1
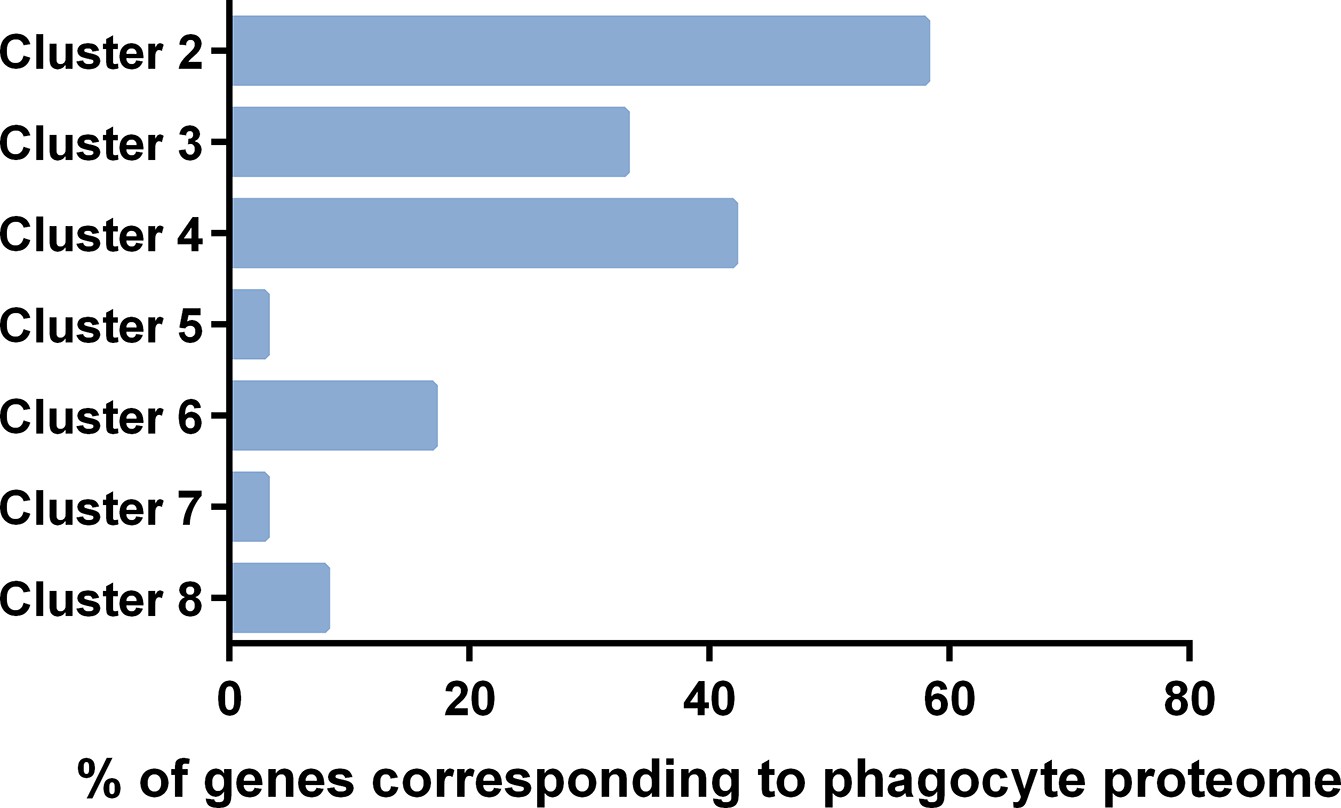
Comparisons of immune cell clusters to the An.
gambiae phagocyte proteome. Transcripts expressed in >60% of cells of each immune cell cluster were compared to the 811 proteins identified in the naive phagocyte-enriched proteome previously published by Smith et al., 2016. Data are displayed as the percentage of genes identified in the proteome with corresponding transcripts from each respective immune cell cluster.
Figure 2—figure supplement 2
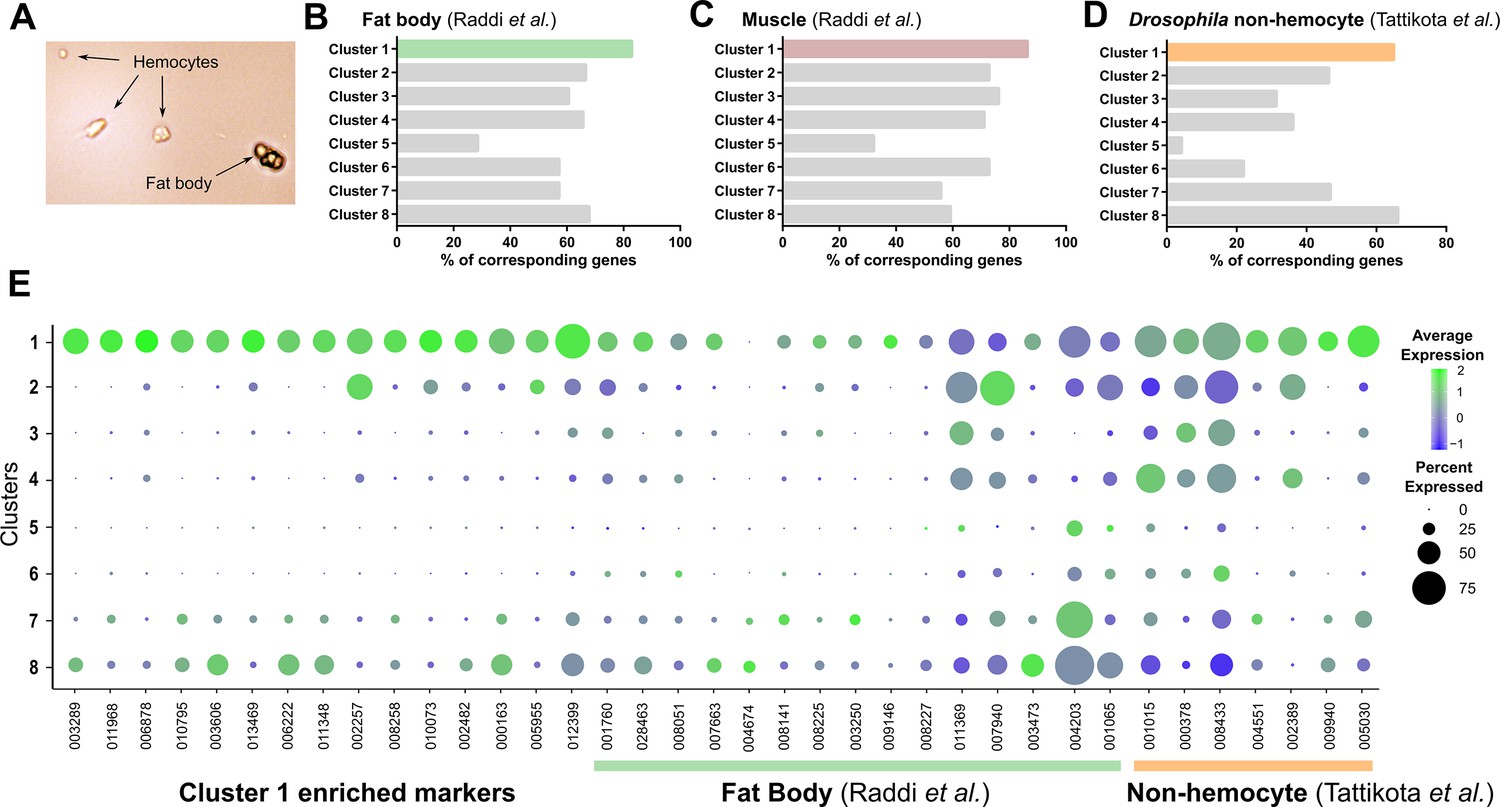
Comparisons of Cluster 1 to non-hemocyte cell populations.
Mosquito hemolymph perfusions routinely have contaminants (fat body, etc.) in addition to hemocytes (A). Using enriched gene sets for fat body (B) or muscle cells (C) defined by Raddi et al., 2020, or non-hemocyte cell populations defined by Tattikota et al., 2020 (D), these data support that cells in Cluster 1 represent non-hemocyte contaminants in our analysis. (E) Bubble plots of Cluster 1 enriched markers (our study), fat body markers (Raddi et al., 2020), and non-hemocyte markers (Tattikota et al., 2020) across immune cell clusters identified in our study.
Figure 2—figure supplement 3
Expression of hemocyte genes across all cell clusters.
Bubble plots display levels of average gene expression of hemocyte genes with previously described roles in Drosophila or Anopheles, with the dot size representing the percentage of cells expressing the corresponding genes in each cell cluster.
Figure 2—figure supplement 4
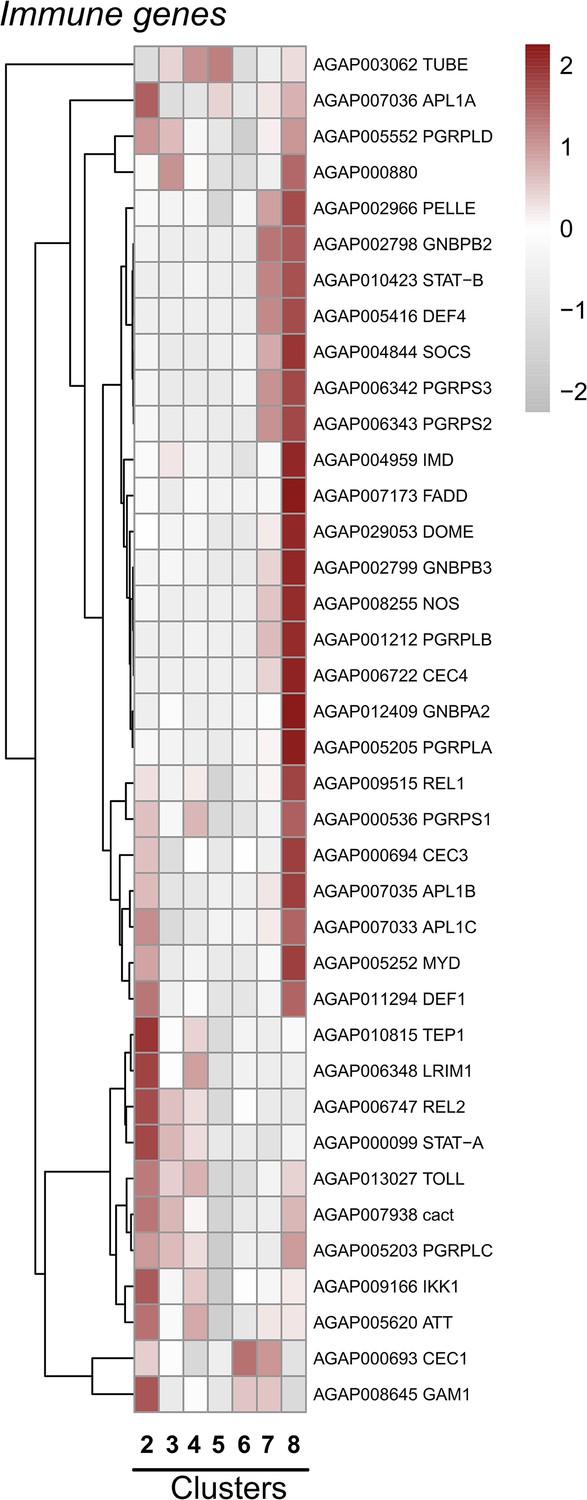
Expression of mosquito immune genes across cell clusters.
Expression patterns of known components of the An. gambiae IMD, Toll, and JAK-STAT pathways, as well as other antimicrobial proteins (AMPs) and complement factors with integral roles in mosquito innate immunity displayed across immune cell clusters. Each row represents the normalized (averaged) gene expressed of a given transcript across clusters, with differences between cell clusters indicated by heatmaps displaying the fold change in normalized gene expression (Z-score). Patterns in gene expression are displayed by hierarchical clustering.
Figure 2—figure supplement 5
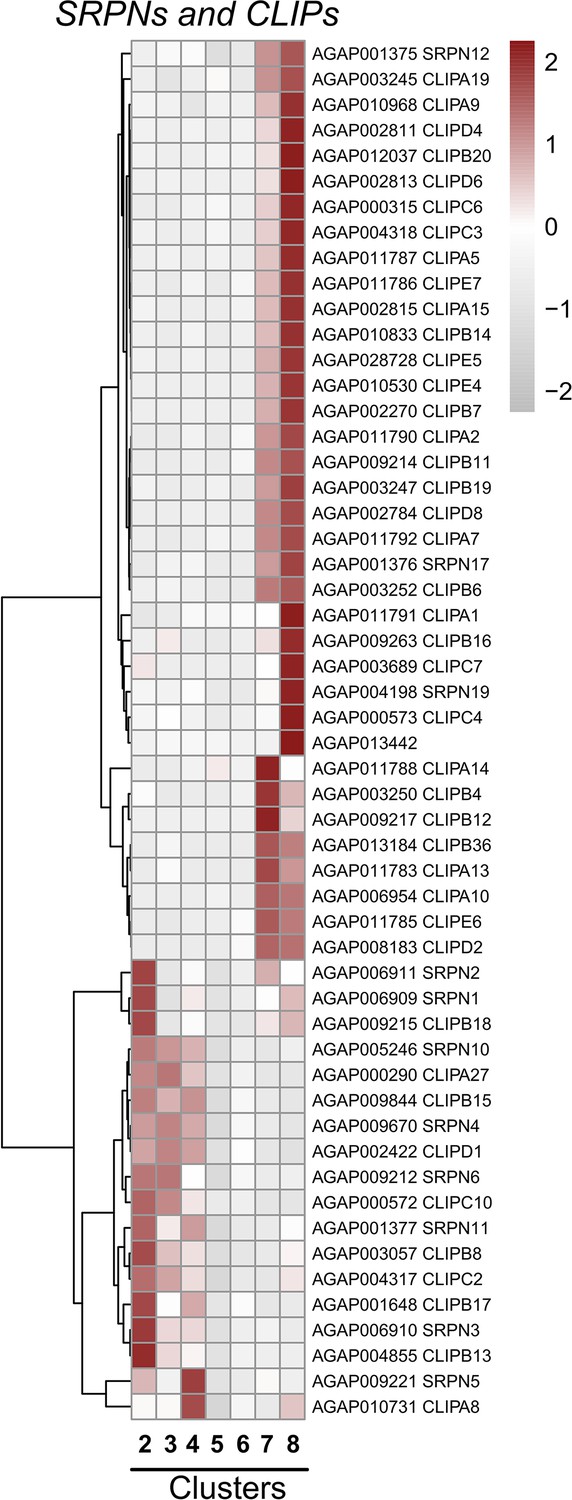
Expression of serine protease inhibitors (SRPNs) and CLIP serine proteases across cell clusters.
Expression patterns of SRPN and CLIP family members across immune cell clusters. Each row represents the normalized (averaged) gene expressed of a given transcript across clusters, with differences between cell clusters indicated by heatmaps displaying the fold change in normalized gene expression (Z-score). Patterns in gene expression are displayed by hierarchical clustering.
Figure 2—figure supplement 6
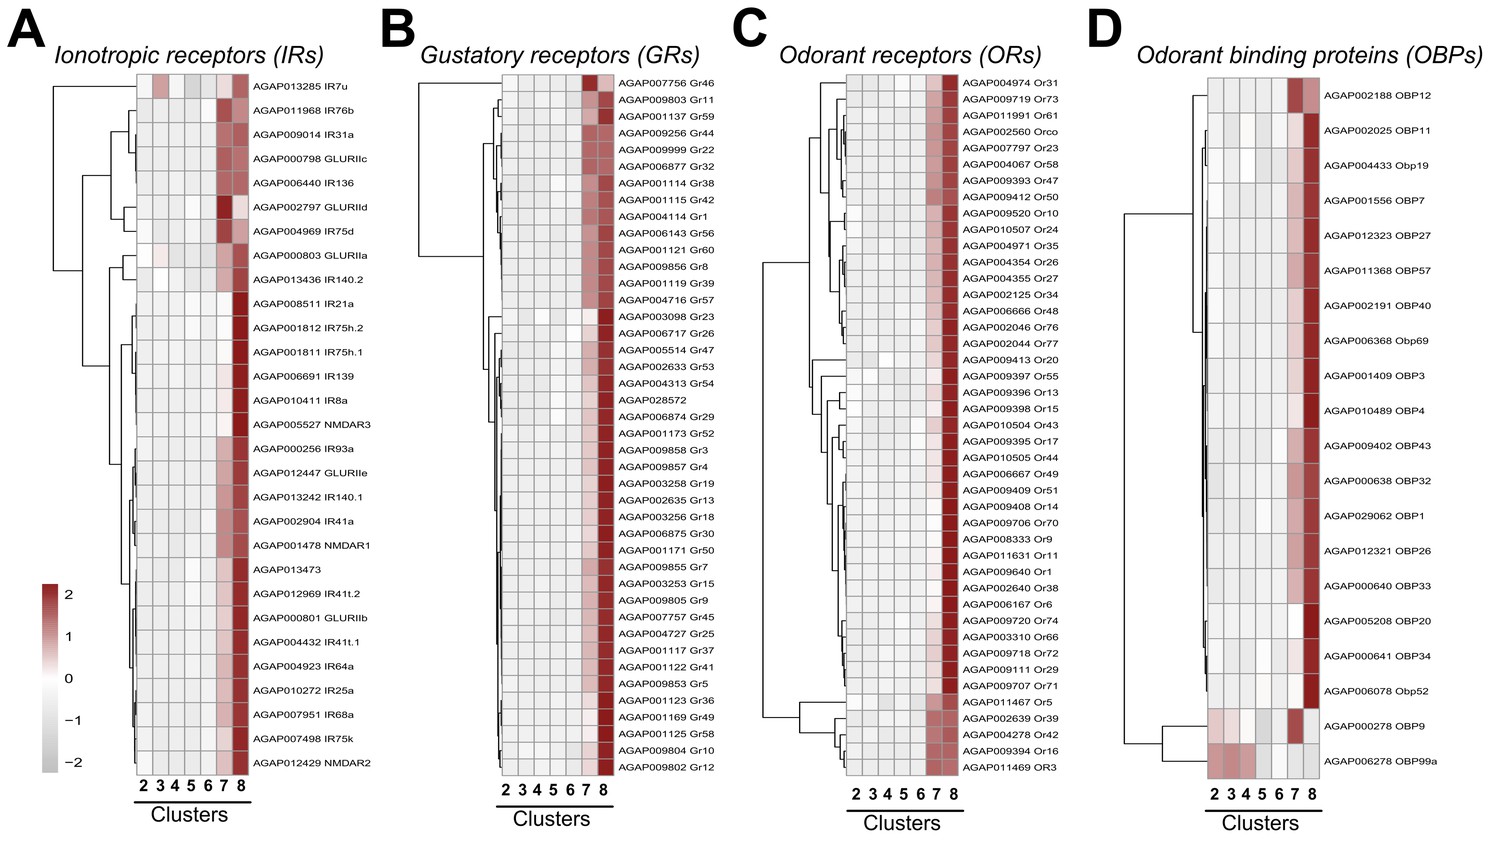
Expression of chemosensory genes across cell clusters.
Expression patterns of annotated ionotropic receptors (IRs) (A), gustatory receptors (GRs) (B), odorant receptors (ORs) (C), and odorant-binding proteins (OBPs) (D) across immune cell clusters. Each row represents the normalized (averaged) gene expressed of a given transcript across clusters, with differences between cell clusters indicated by heatmaps displaying the fold change in normalized gene expression (Z-score). Patterns in gene expression are displayed by hierarchical clustering.
Figure 2—figure supplement 7
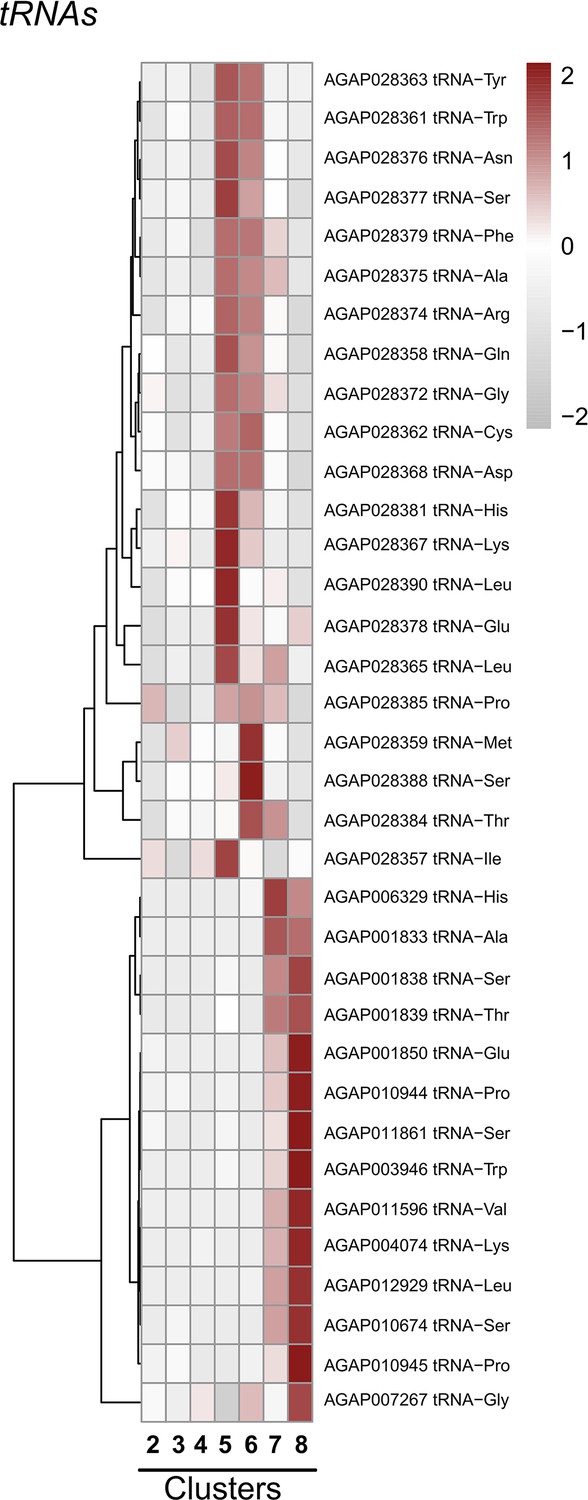
Expression of specific tRNAs across cell clusters.
Expression patterns of specific tRNAs across immune cell clusters. Each row represents the normalized (averaged) gene expressed of a given transcript across clusters, with differences between cell clusters indicated by heatmaps displaying the fold change in normalized gene expression (Z-score). Patterns in gene expression are displayed by hierarchical clustering.
Figure 2—figure supplement 8
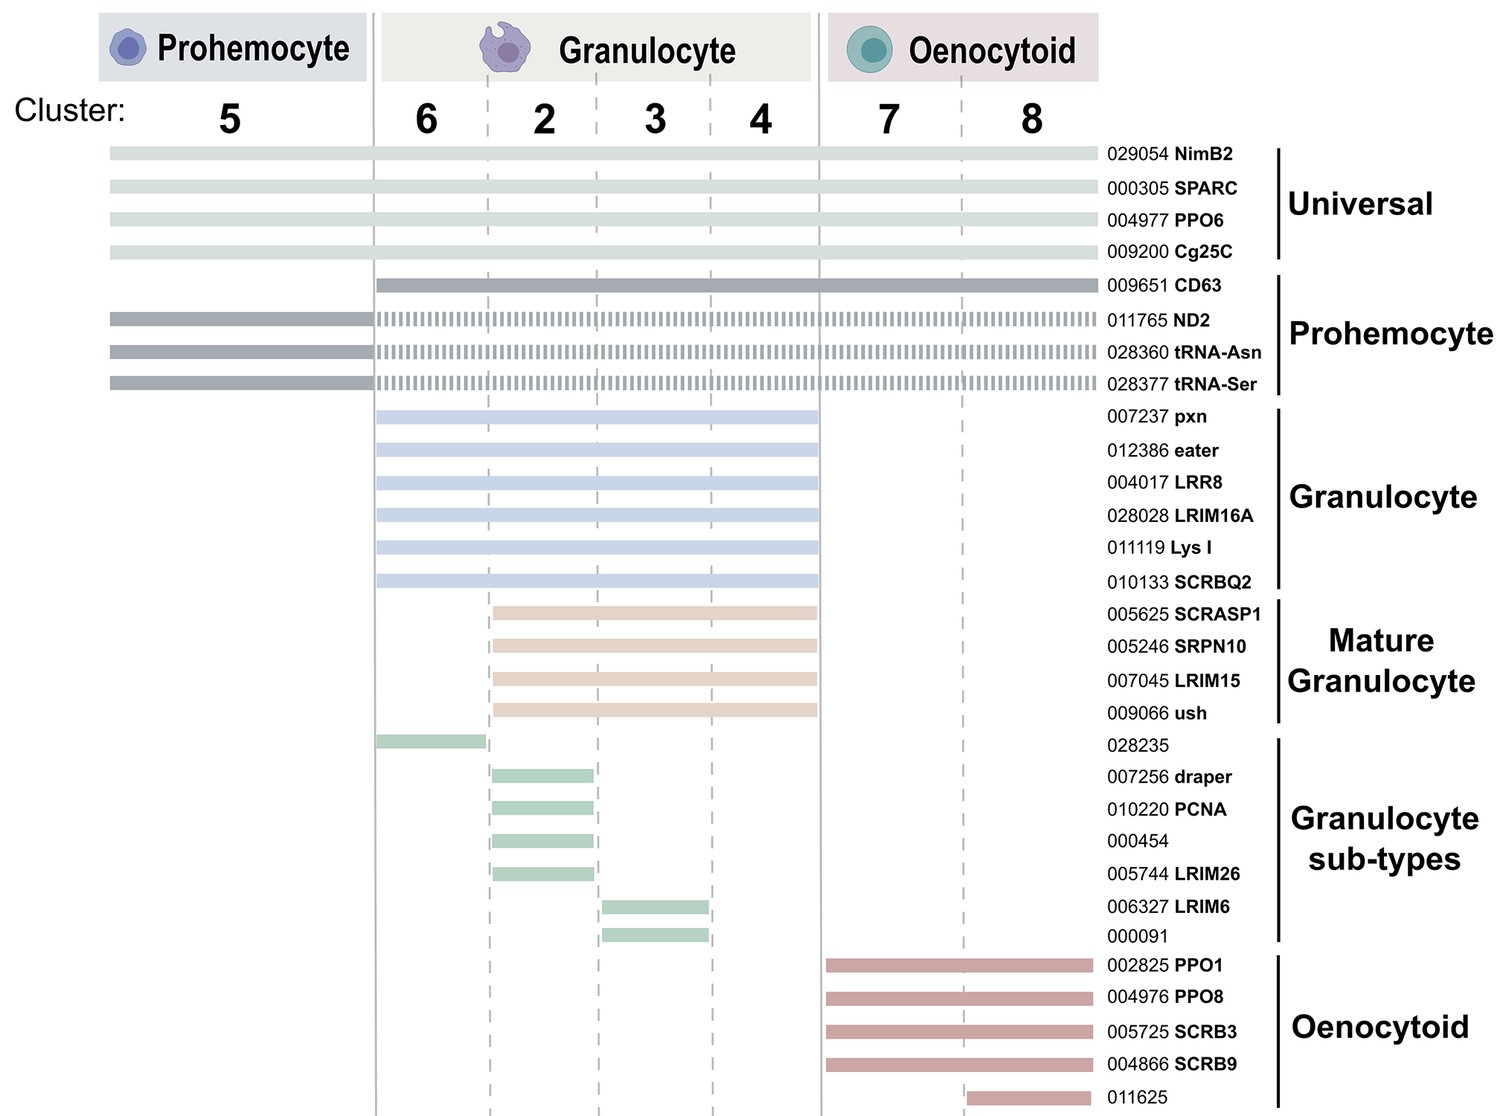
Candidate markers of immune cell clusters and hemocyte sub-types.
Summary of candidate marker genes for each immune cell cluster and putative hemocyte sub-type. Solid lines denote strong differential gene expression indicative of one or more clusters, while dashed lines display marker genes that are expressed in cell clusters at lower levels of expression. Gene accession numbers (without AGAP precursor) are shown on right with gene names.
Figure 3 with 8 supplements

Definition of mosquito immune cell subtypes.
RNA-FISH and gene expression profiles across cell clusters for the ‘universal’ marker, NimB2 (A), the ‘granulocyte’ marker, LRIM15 (B), and ‘oenocytoid’ marker, SCRB9 (C). The percentage of adherent cells following fixation was evaluated for each of the respective NimB2, LRIM15, and SCRB9 markers in four or more independent replicates (D). To determine the phagocytic ability of granulocytes and oenocytoids, the uptake of fluorescent beads was evaluated in either LRIM15+ or SCRB9+ cells in two independent replicates (E). LRIM15+ cells display a higher phagocytic index (# beads engulfed per cell) than LRIM15- cell populations (F). Data were analyzed using a Mann–Whitney test, with bars representing mean ± SE of two independent replicates. The phagocytic ability of LRIM15+ cells was further validated by examining the abundance of NimB2+/LRIM15+ cells by RNA-FISH following perfusion after treatment with control (LP)- or clodronate (CLD) liposomes that deplete phagocytic cells (G). Data were analyzed using a Mann–Whitney test. Bars represent mean ± SE of two independent replicates. Additional validation of clodronate (CLD) depletion of phagocytic cells was performed by qRT-PCR using primers for universal (uni.), granulocyte (gran.), and oenocytoid (oeno.) cell markers. Data were analyzed using an unpaired t test to determine differences in relative gene expression between LP and CLD treatments. Bars represent mean ± SE of three independent replications (H). Asterisks denote significance (**p < 0.01, ***p < 0.001). Scale bar, 10 µm.
-
Figure 3—source data 1
Source data pertaining to data presented in Figure 3D–H.
- https://cdn.elifesciences.org/articles/66192/elife-66192-fig3-data1-v3.xlsx
Figure 3—figure supplement 1
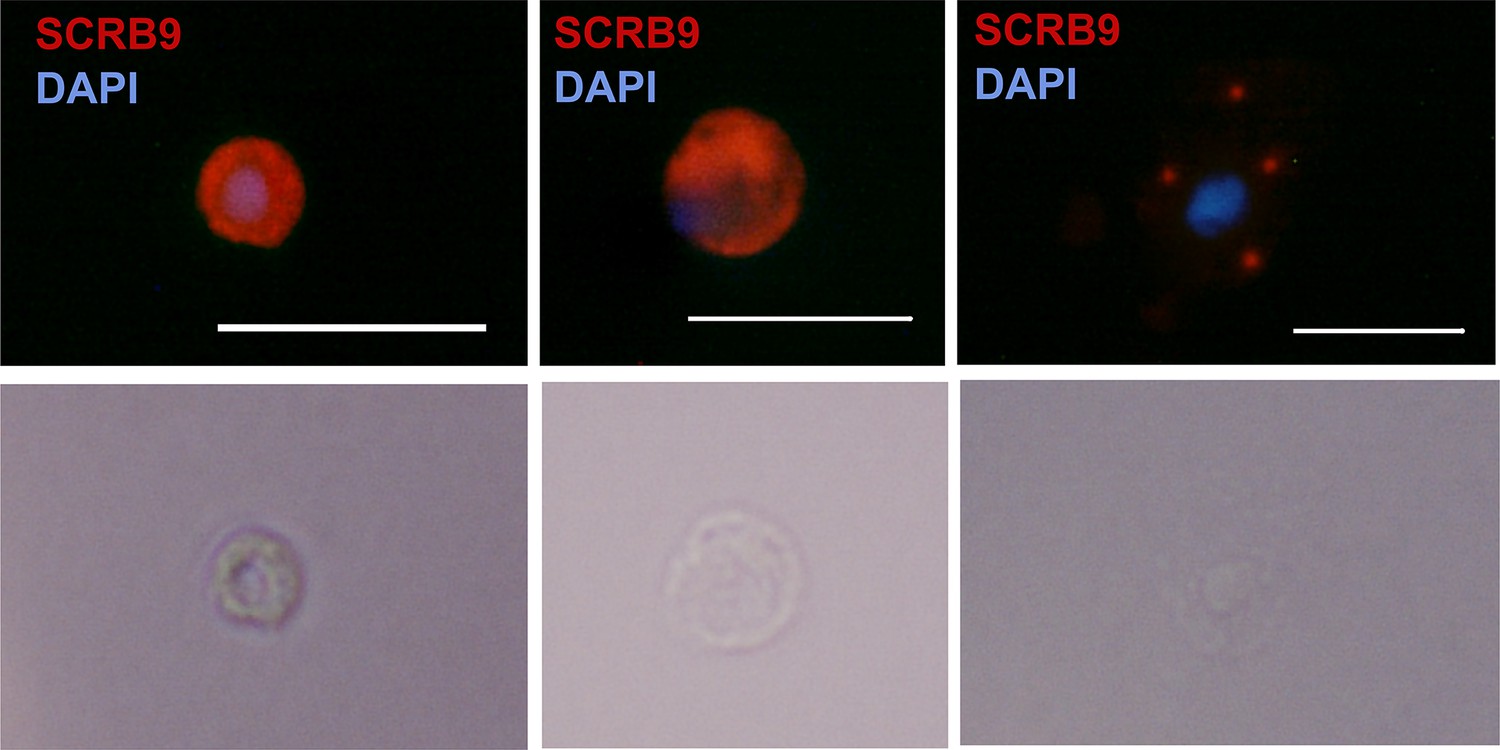
RNA-FISH of SCRB9+ immune cells.
RNA-FISH images of immune cells labeled with SCRB9 and stained with DAPI. Below is the corresponding phase contrast image of the same fixed cell. Scale bar, 10 µm.
Figure 3—figure supplement 2
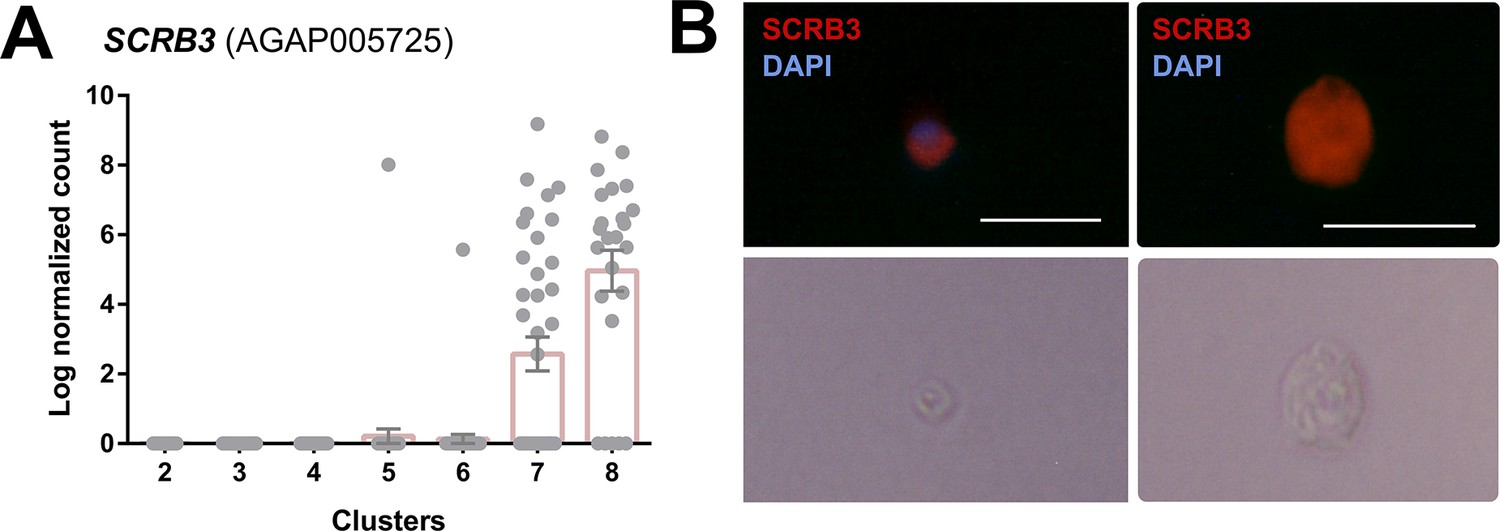
Expression profile and RNA-FISH of SCRB3+ immune cells.
(A) Expression of SCRB3 across immune cell clusters. (B) RNA-FISH images of immune cells labeled with SCRB3 and stained with DAPI. Below is the corresponding phase contrast image of the same fixed cell. Scale bar, 10 µm.
Figure 3—figure supplement 3
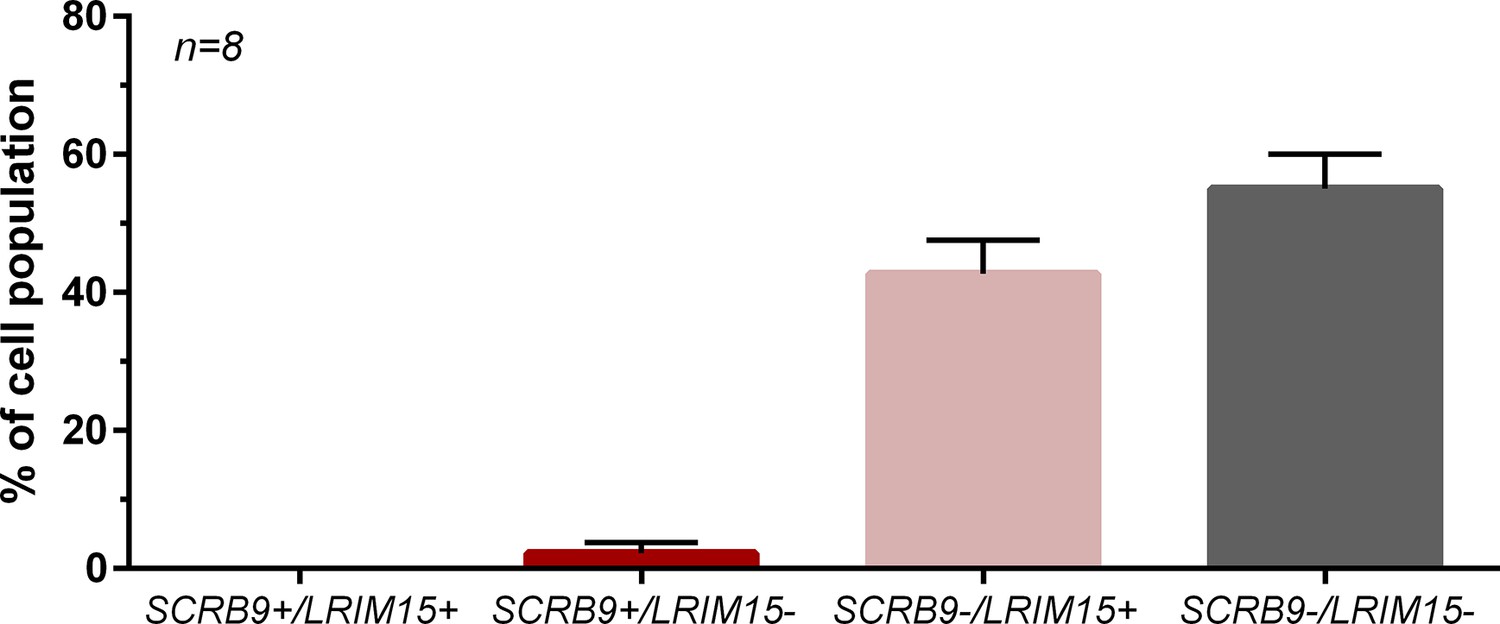
Co-hybridization of SCRB9 and LRIM15 labels distinct immune cell populations by RNA-FISH.
RNA-FISH experiments were performed with both SCRB9 and LRIM15 probes, with the resulting percentage of cells expressing either, both, or neither immune cell marker. n, number of individual mosquitoes examined.
Figure 3—figure supplement 4
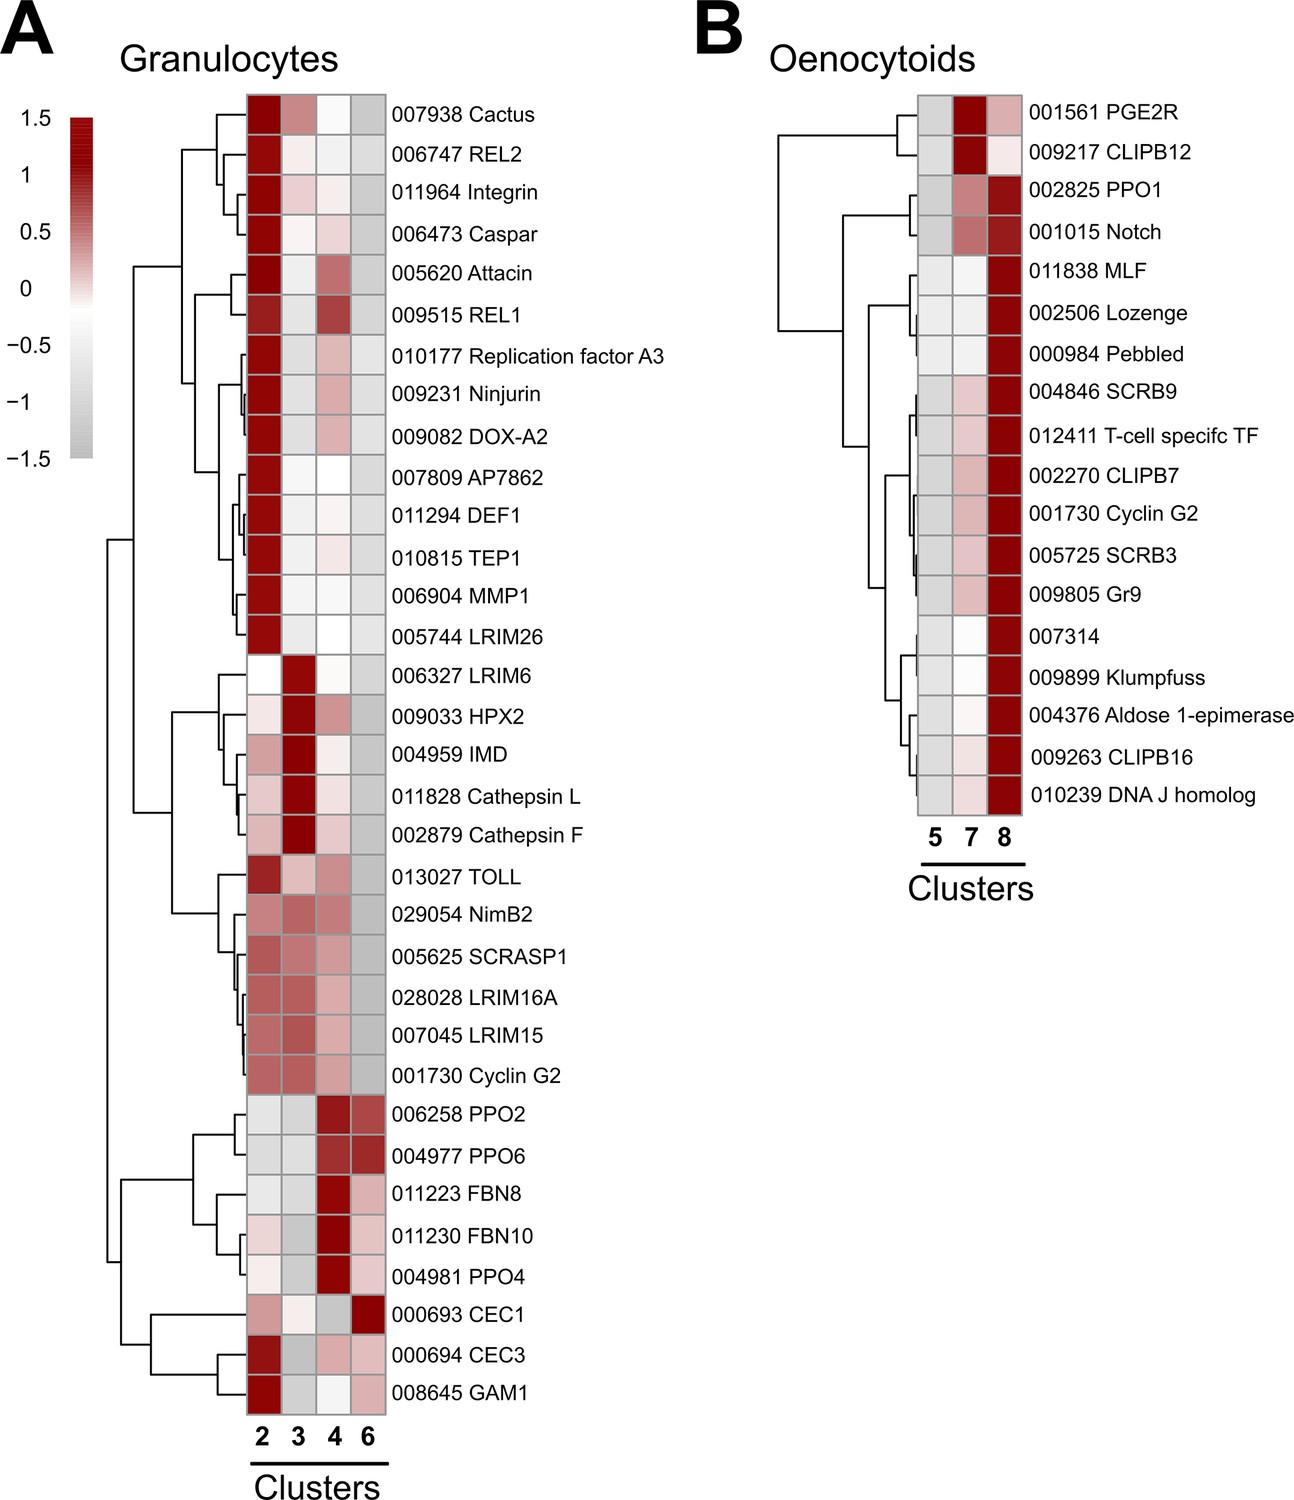
Expression of granulocyte and oenocytoid markers to distinguish immune cell sub-types.
Expression of marker genes to distinguish granulocyte (A) or oenocytoid (B) immune cell sub-types. Cluster 5 is included as an outgroup to help distinguish gene expression differences between Clusters 7 and 8 in (B). Each row represents the normalized (averaged) gene expressed of a given transcript across clusters, with differences between cell clusters indicated by heatmaps displaying the fold change in normalized gene expression (Z-score). Patterns in gene expression are displayed by hierarchical clustering.
Figure 3—figure supplement 5
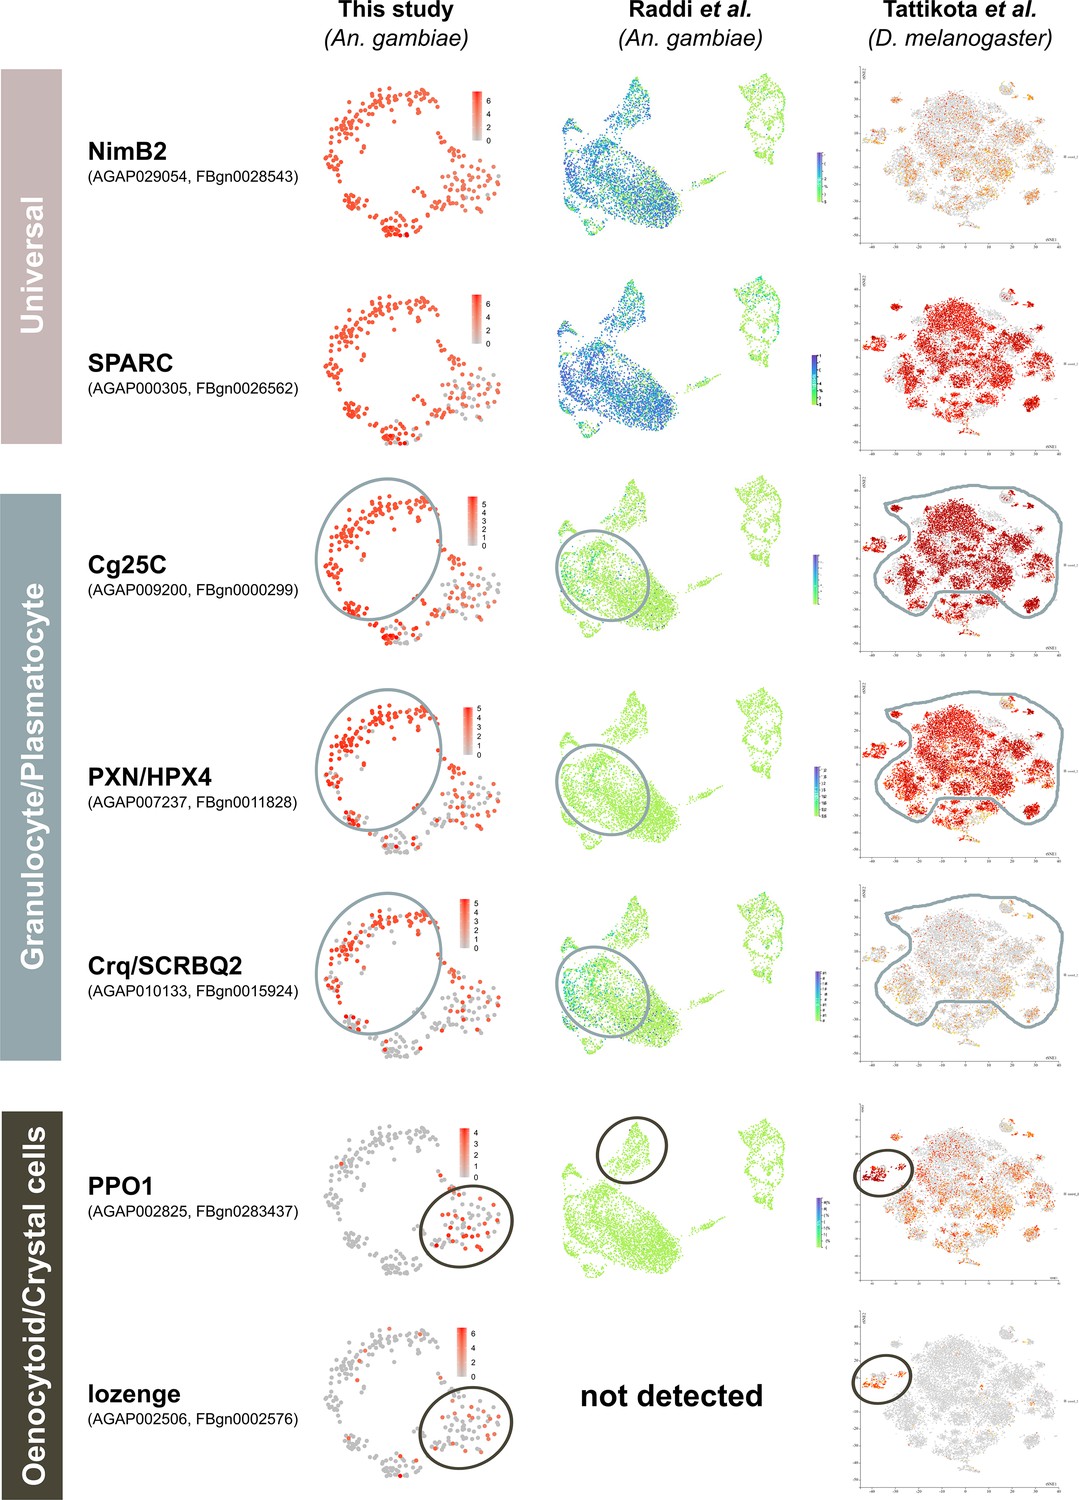
Examination of conserved hemocyte markers across Anopheles and Drosophila single-cell studies.
Hemocyte markers defined by functional studies in Drosophila that correspond to ‘universal’, ‘granulocyte/plasmatocyte’, and ‘oenocytoid/ crystal cell’ lineages were compared across recent studies in Anopheles (this study, Raddi et al., 2020) and Drosophila (Tattikota et al., 2020). For each gene, the corresponding mosquito and fly accession numbers are provided, with heatmaps of their expression patterns visualized on tSNE plots from each respective study. For both the granulocyte/plasmatocyte and oenocytoid/crystal cell lineages, corresponding cell types are outlined as defined in each study.
Figure 3—figure supplement 6
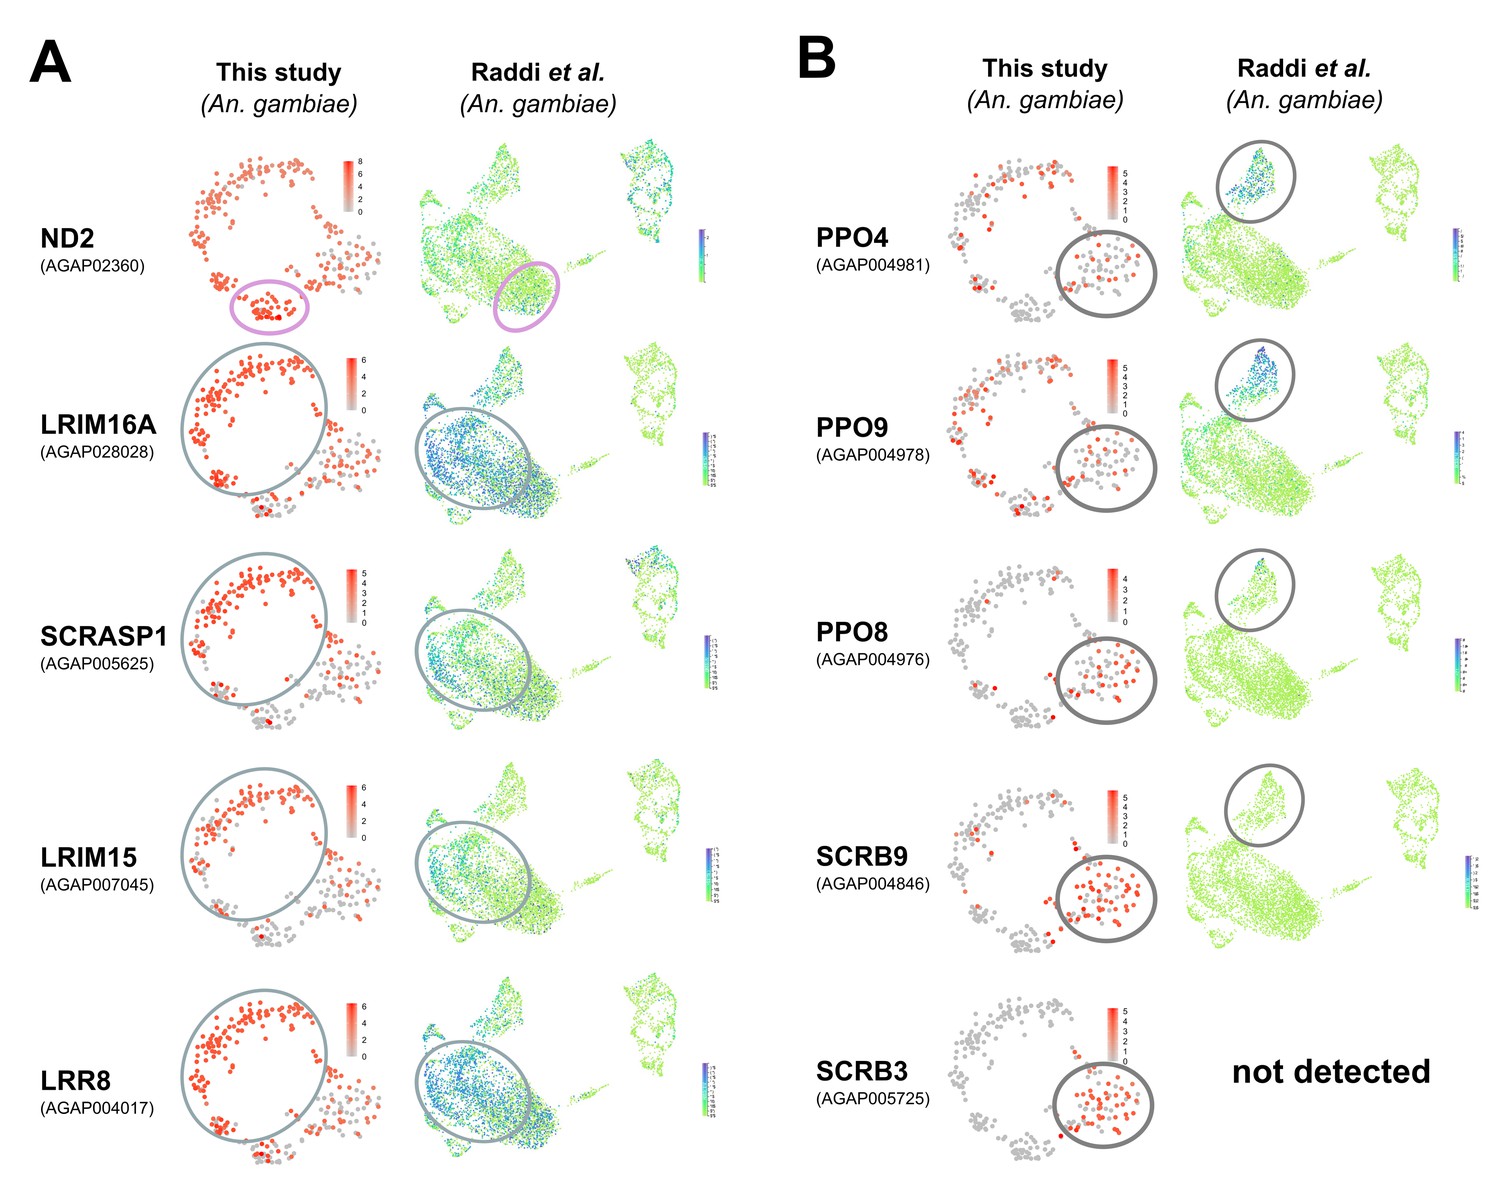
Examination of mosquito hemocyte markers in Anopheles single-cell studies.
Previously described mosquito-specific hemocyte markers were examined in recent single-cell studies in Anopheles (this study, Raddi et al., 2020) in prohemocyte/granulocyte populations (A) and in oenocytoids (B). For each gene, the corresponding mosquito accession numbers are provided, with heatmaps of their expression patterns visualized on tSNE plots from each respective study. Comparable cell populations are outlined as defined by each study. While markers are in general agreement in (A), the expression of markers to define oenocytoids (B) significantly differ between the two studies.
Figure 3—figure supplement 7
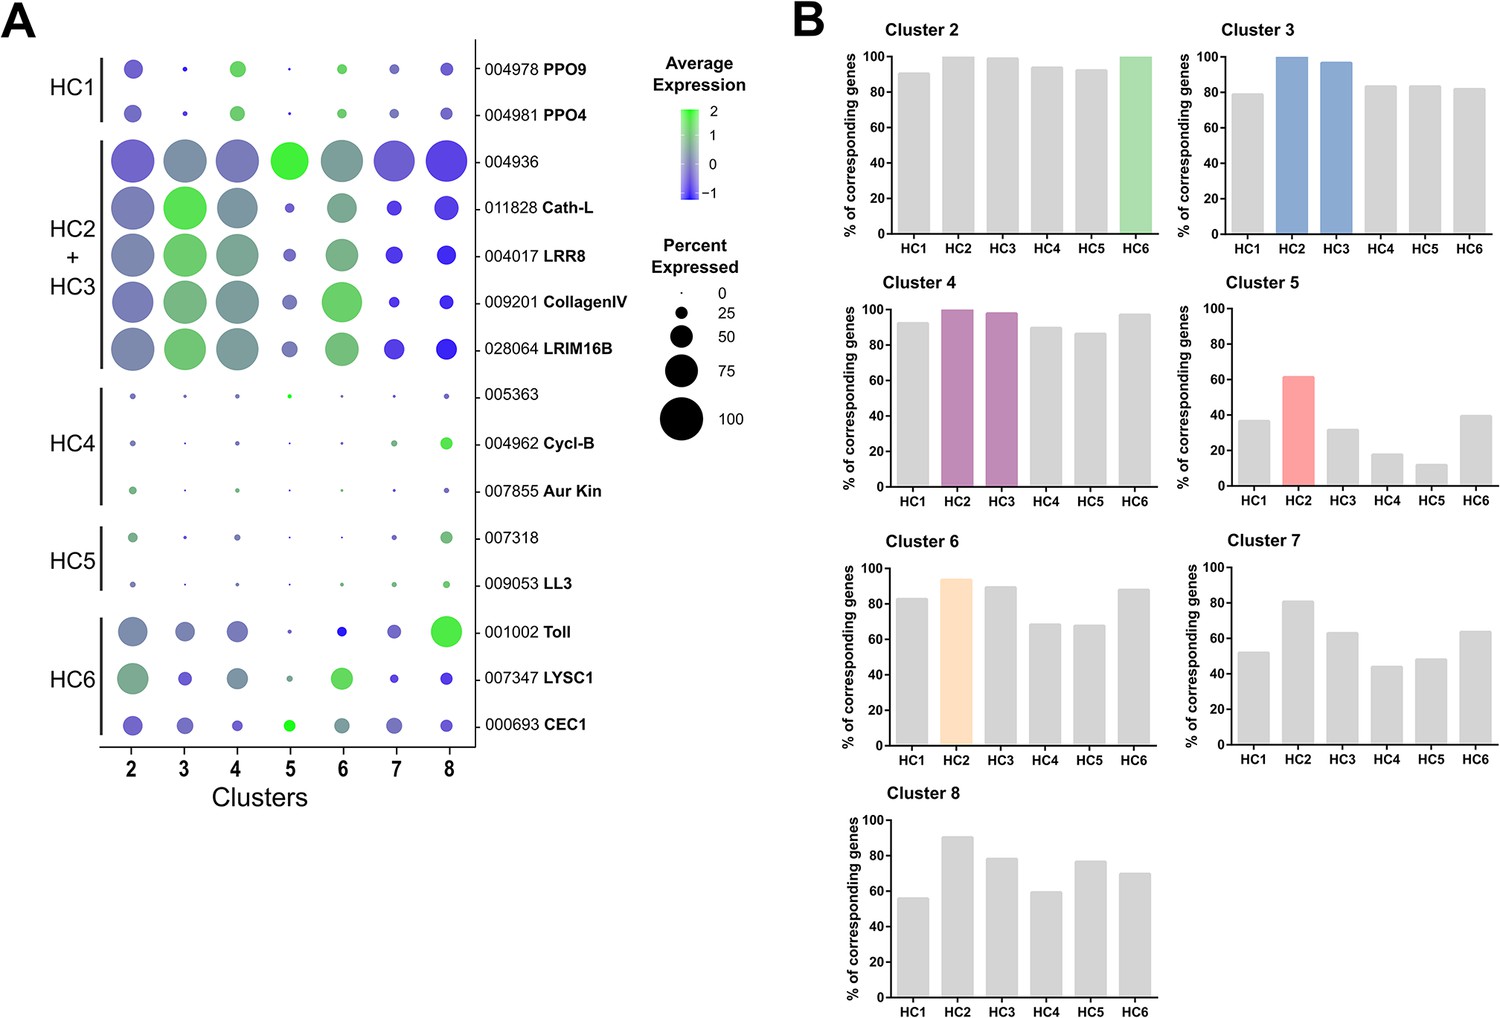
Comparison of immune cell clusters to Raddi et al.
Markers used to define immune cell subtypes (HC1-6) in Raddi et al., 2020 were displayed as bubble plots across immune cell clusters identified in our study (A). Using previously described gene sets for HC1-6 (Raddi et al., 2020), the hemocyte cell clusters identified in our analysis (2-8) were compared to determine the percentage of genes expressed within that cluster (B). Highlighted cell clusters (colors) denote the most likely ortholog(s) between studies.
Figure 3—figure supplement 8
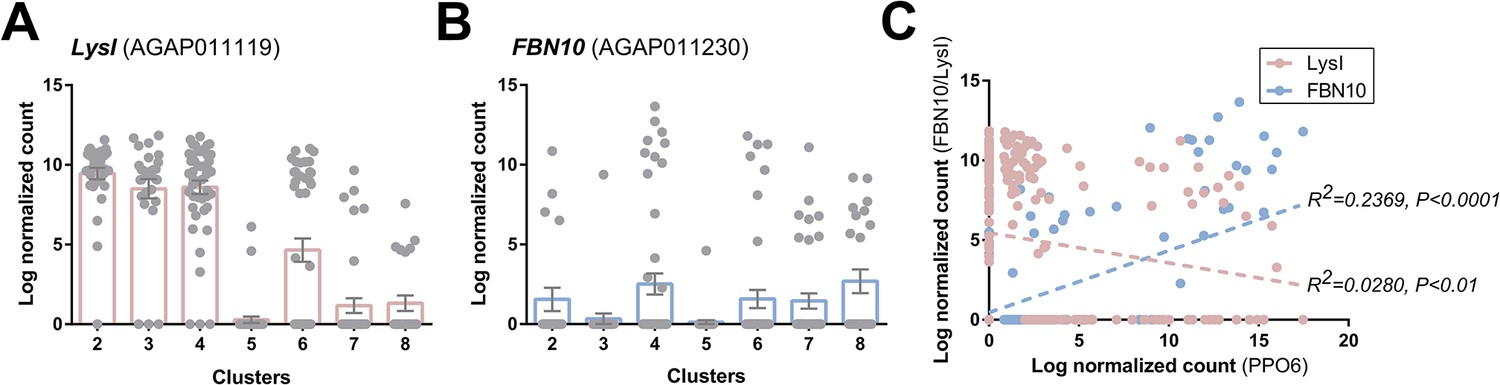
Comparisons of immune cell clusters to previously defined PPO6low and PPO6high hemocyte populations.
To correlate the immune cell clusters identified in our analysis with previously described PPO6low and PPO6high hemocyte populations (Severo et al., 2018), we examined the expression of LysI (A) and FBN10 (B) as respective markers of these previously defined cell populations. Although the expression of LysI and FBN10 was distributed across multiple cell clusters in our analysis, transcripts displayed strong negative or positive correlations respectively to the expression of PPO6 (C).
Figure 4
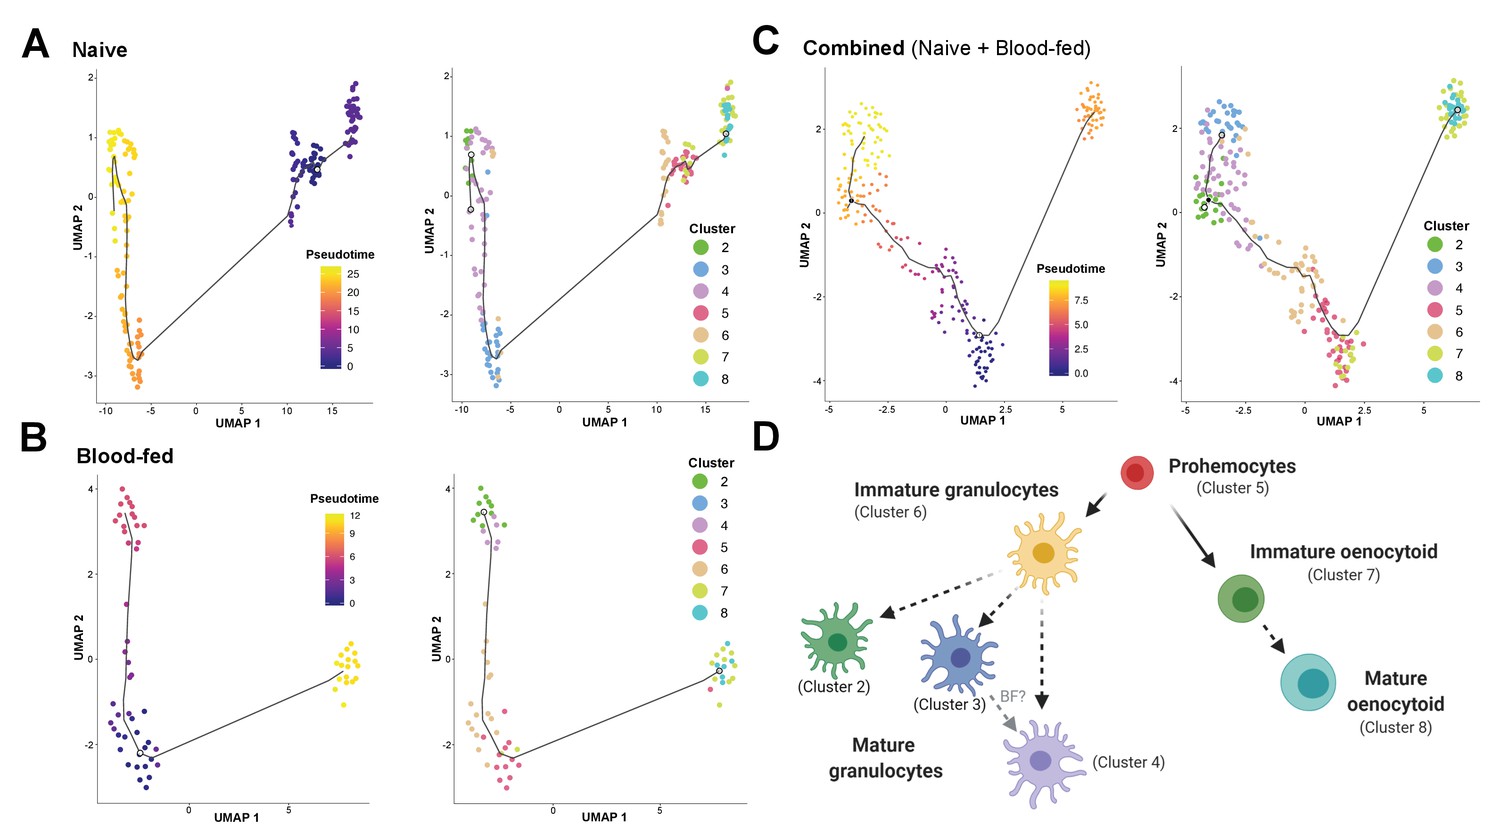
Lineage analysis of mosquito immune cells.
Using Monocle3, mosquito immune cells were visualized by UMAP to reveal two distinct lineages in pseudotime under naive (A), blood-fed (B), or combined (naïve and blood-fed) samples (C) with the corresponding immune cell clusters for each condition. Based on the lineage analysis, gene expression, and other functional assays, our data support the following model of immune cell development and differentiation where prohemocytes serve as precursors for the granulocyte and oenocytoid lineages (D). Each cell type is labeled with the corresponding cell cluster described in our analysis. Figure was created with BioRender.com.
Figure 5 with 2 supplements
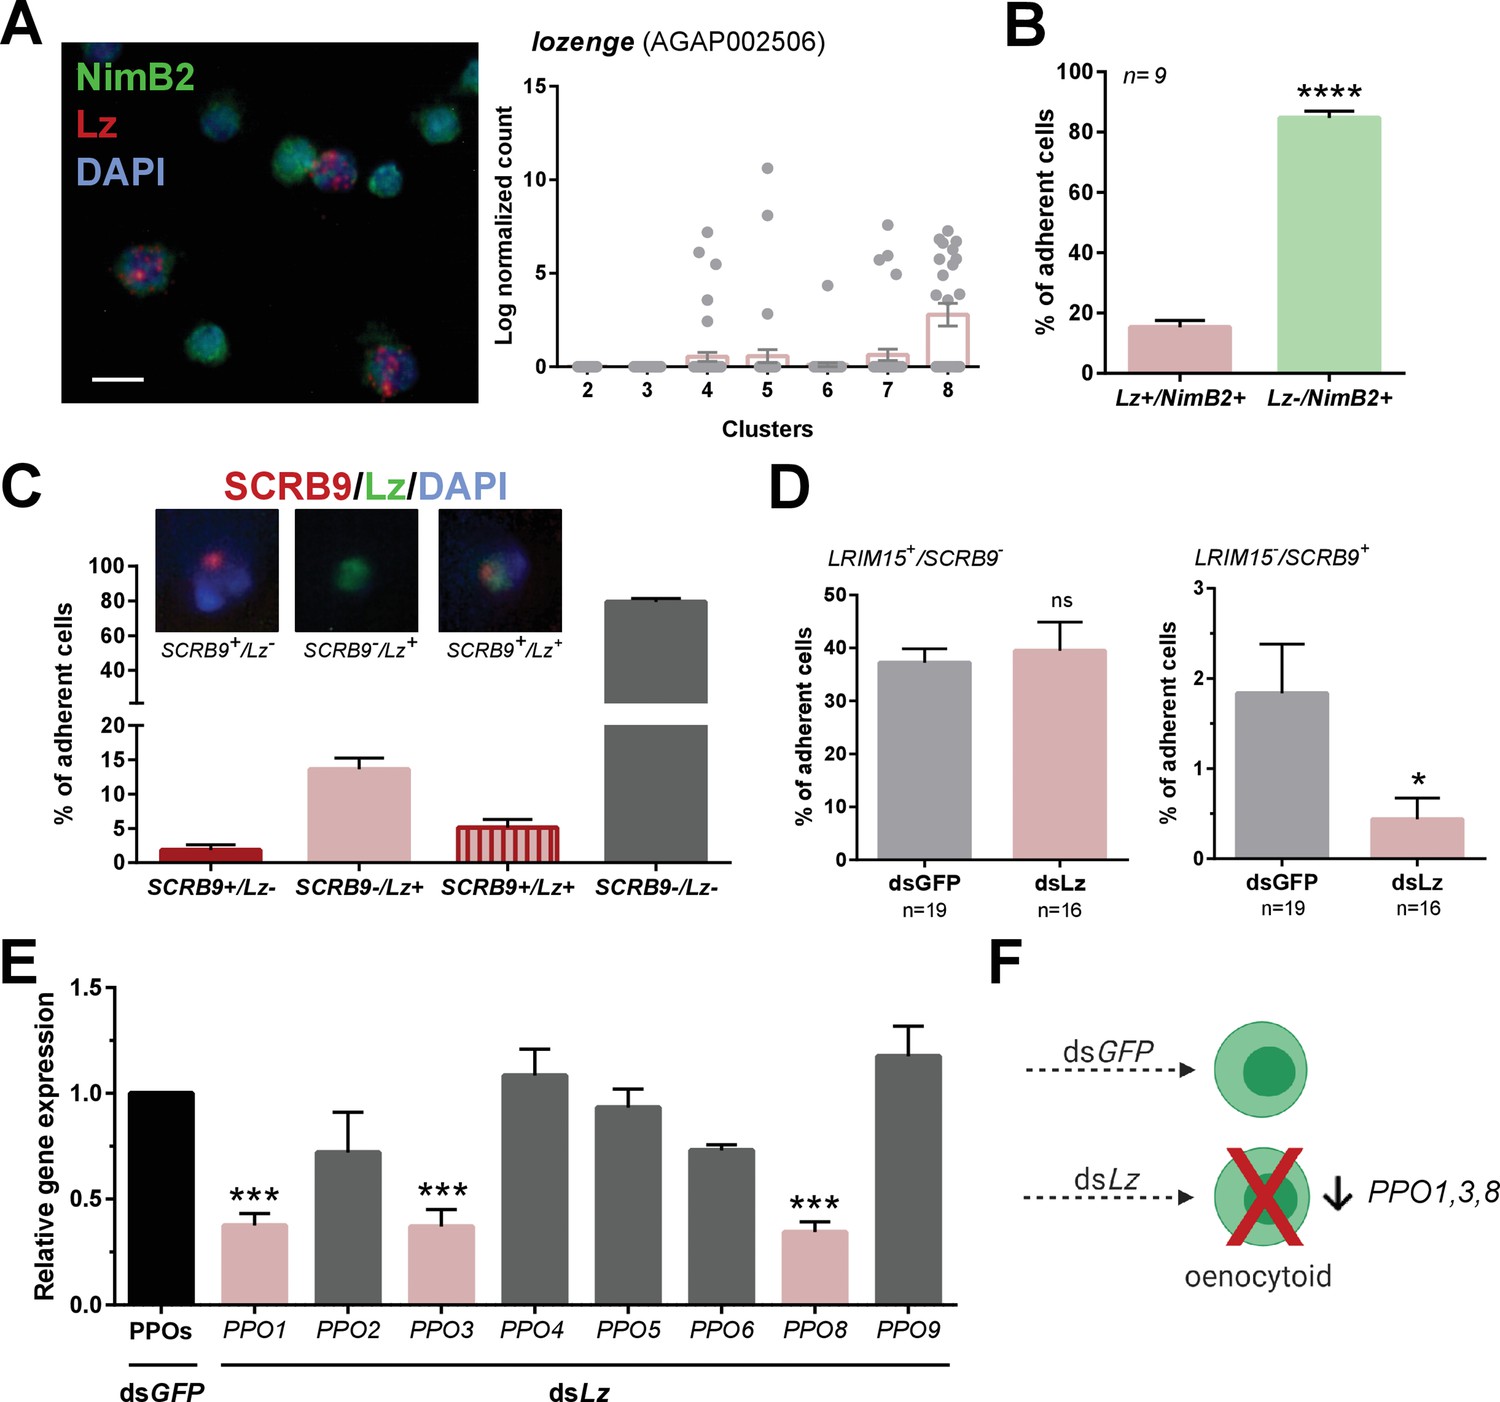
Lozenge promotes oenocytoid differentiation.
RNA-FISH and gene expression profiles across cell clusters for lozenge (Lz) (A). Scale bar, 10 µm. The percentage of adherent Lz+/NimB2+ or Lz-/NimB2+ cells were examined in naïve adult female mosquitoes to estimate cell abundance (B). Data were collected from two independent experiments. Asterisks denote significance (****p< 0.0001). To more closely examine the population of Lz+ cells, RNA-FISH experiments were performed double staining for Lz and the oenocytoid marker, SCRB9 (C). The percentage of fixed cells positive for one, both, or neither marker is displayed with representative images. Data are summarized from two independent experiments. To determine the effects of Lz on immune cell populations, the abundance of LRIM15+/SCRB9- (granulocyte) and LRIM15-/SCRB9+ (oenocytoid) cells were evaluated by RNA-FISH after GFP (control)- or Lz-silencing (D). Data represent the mean ± SE of three independent replicates. Significance was determined using Mann-Whitney analysis and is denoted by an asterisk (*p < 0.05); ns, not significant. Since Lz expression has previously been associated with prophenoloxidase (PPO) expression, the expression of all eight genes identified in our scRNA-seq analysis were examined by qRT-PCR in GFP (control) - Lz-silenced mosquitoes (E). Data represent the mean ± SE of three or more independent replicates and were analyzed by a one-way ANOVA and Holm-Sidak’s multiple comparison test using GraphPad Prism 6.0. Asterisks denote significance (***p < 0.001). (F) Summary of Lz-silencing experiments which display a reduction in oenocytoid numbers and a specific sub-set of PPO gene expression which support that Lz is integral to the differentiation of the mosquito oenocytoid lineage.
-
Figure 5—source data 1
Source data pertaining to data presented in Figure 5B–E.
- https://cdn.elifesciences.org/articles/66192/elife-66192-fig5-data1-v3.xlsx
Figure 5—figure supplement 1
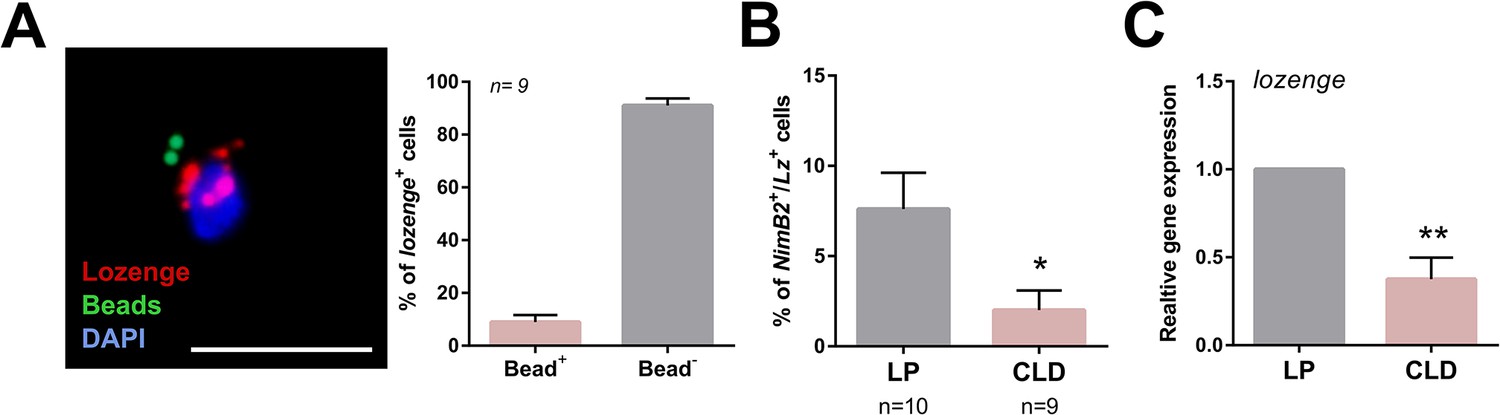
Phagocytic properties of a subset of lozenge (lz)+ cells.
RNA-FISH experiments were paired with phagocytosis assays using the injection of fluorescent beads, which display a subset of lozenge (lz)+ cells with phagocytic properties (bead +) (A). This was confirmed by a reduction in the percentage of NimB2+/Lz+ cells following treatment with clodronate liposomes (CLD) when compared to liposome only (LP) controls (B), and further validated by qRT-PCR analysis of lozenge expression from perfused hemocytes (C). Two independent biological experiments were performed for RNA-FISH experiments in (A) and (B). Data were analyzed by Mann–Whitney analysis using GraphPad Prism 6.0. Bars represent mean ± SE. lozenge expression was analyzed using an unpaired t test to determine relative gene expression between LP and CLD treatments. Bars represent mean ± SE of three independent replications. Asterisks denote significance (*p < 0.05, ***p < 0.001). Scale bar, 10 µm.
Figure 5—figure supplement 2
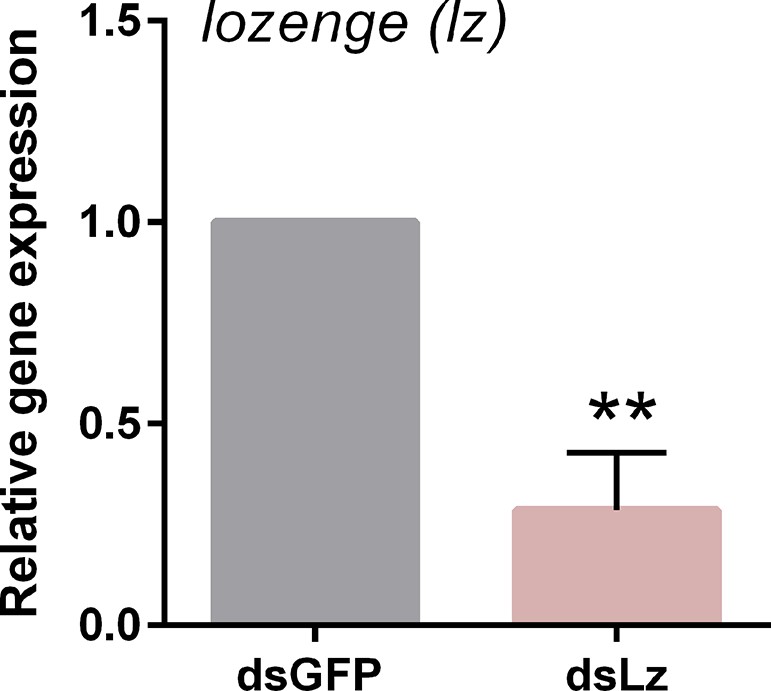
Validation of lozenge knockdown following RNAi.
To disrupt lozenge expression, dsRNA corresponding to GFP (control) or lozenge were injected into adult female mosquitoes and evaluated for knockdown 3 days post-dsRNA injection by qRT-PCR. Data from three experiments were analyzed using an unpaired t test in GraphPad Prism 6.0 to determine significance (**, p<0.01).
Tables
Key resources table
| Reagent type (species) or resource | Designation | Source or reference | Identifiers | Additional information |
|---|---|---|---|---|
| Strain, strain background (An. gambiae) | Keele | Hurd et al., 2005; Ranford-Cartwright et al., 2016 | NA | |
| Biological sample (An. gambiae) | adult female hemolymph | NA | NA | Perfused hemocytes from naïve (sugar-fed) or blood-fed (24 hr post-feeding) mosquitoes |
| Sequence-based reagent | LRIM15 (qRT-PCR primers) | Smith et al., 2016 | AGAP007045 | F:CGATCCTGATCCTGAACGTGGGCTTC R:GCAAGCAAGCCACTCACAAATCCTCG |
| Sequence-based reagent | LRIM16A (qRT-PCR primers) | Smith et al., 2016 | AGAP028028 | F:ATCAGAGTGCAGCACAAGTTGAAGGT R:TCTCTGTTAGCATAGCGCCTTCGTTC |
| Sequence-based reagent | Lz (qRT-PCR primers) | This study | AGAP002506 | F:GCACCGTCAATCAGAACCAA R:TGCCACTGATCGAATGCTTG |
| Sequence-based reagent | NimB2 (qRT-PCR primers) | Kwon and Smith, 2019 | AGAP029054 | F:CAATCTGCTCAAATGGCTGCTTCCACG R:GCTGCAAACATTCGGTCCAGTGCATTC |
| Sequence-based reagent | PPO1 (qRT-PCR primers) | Kwon and Smith, 2019 | AGAP002825 | F:GACTCTACCCGGATCGGAAG R:ACTACCGTGATCGACTGGAC |
| Sequence-based reagent | PPO2 (qRT-PCR primers) | Kwon and Smith, 2019 | AGAP006258 | F:TTGCGATGGTGACCGATTTC R:CGACGGTCCGGATACTTCTT |
| Sequence-based reagent | PPO3 (qRT-PCR primers) | Kwon and Smith, 2019 | AGAP004975 | F:CTATTCGCCATGATCTCCAACTACG R:ATGACAGTGTTGGTGAAACGGATCT |
| Sequence-based reagent | PPO4 (qRT-PCR primers) | Kwon and Smith, 2019 | AGAP004981 | F:GCTACATACACGATCCGGACAACTC R:CCACATCGTTAAATGCTAGCTCCTG |
| Sequence-based reagent | PPO5 (qRT-PCR primers) | Kwon and Smith, 2019 | AGAP012616 | F:GTTCTCCTGTCGCTATCCGA R:CATTCGTCGCTTGAGCGTAT |
| Sequence-based reagent | PPO6 (qRT-PCR primers) | Kwon and Smith, 2019 | AGAP004977 | F:GCAGCGGTCACAGATTGATT R:GCTCCGGTAGTGTTGTTCAC |
| Sequence-based reagent | PPO8 (qRT-PCR primers) | Kwon and Smith, 2019 | AGAP004976 | F:CCTTTGGTAACGTGGAGCAG R:CTTCAAACCGCGAGACCATT |
| Sequence-based reagent | PPO9 (qRT-PCR primers) | Kwon and Smith, 2019 | AGAP004978 | F:TGTATCCATCTCGGACGCAA R:AAGGTTGCCAACACGTTACC |
| Sequence-based reagent | rpS7 (qRT-PCR primers) | Kwon and Smith, 2019 | AGAP010592 | F:ACCCCATCGAACACAAAGTTGACACT R:CTCCGATCTTTCACATTCCAGTAGCAC |
| Sequence-based reagent | SCRB3 (qRT-PCR primers) | This study | AGAP005725 | F:CATCGGGACAGCTACATCCT R:TTATTGCTGCTACCGTTGCC |
| Sequence-based reagent | SCRB9 (qRT-PCR primers) | This study | AGAP004846 | F:CGATATTCGGCGATGCAACT R:CACGCATGACACGATTCAGT |
| Sequence-based reagent | GFP (T7 RNAi primers) | Kwon and Smith, 2019 | NA | F:TAATACGACTCACTATAGGGAGAATGGTGAGCAAGGGCGAGGAGCTGT R:CACGCATGACACGATTCAGT |
| Sequence-based reagent | Lz (T7 RNAi primers) | This study | AGAP002506 | F:TAATACGACTCACTATAGGGCTGCAACCGTCCCAGAACAACGGC R:TAATACGACTCACTATAGGGACAAACCGGAGATCGTTGAATTTGG |
| Sequence-based reagent | Nimrod B2 (RNA-FISH probe) | Advanced Cell Diagnostics | AGAP029054 | Severo et al., 2018 |
| Sequence-based reagent | LRIM15 (RNA-FISH probe) | Advanced Cell Diagnostics | AGAP007045 | regions 2–874 of XM_308718.4 |
| Sequence-based reagent | Lz (RNA-FISH probe) | Advanced Cell Diagnostics | AGAP002506 | regions 168–1372 of XM_312433.5 |
| Sequence-based reagent | SCRB3 (RNA-FISH probe) | Advanced Cell Diagnostics | AGAP005725 | regions 337–1276 of XM_315741.5 |
| Sequence-based reagent | SCRB9(RNA-FISH probe) | Advanced Cell Diagnostics | AGAP004846 | regions 402–1306 of XM_001688510.1 |
| Commercial assay or kit | Standard macrophage depletion kit | Encapsula NanoSciences LLC | CLD-8901 | Control liposomes or clodronate liposomes were used in a 1:5 dilution in 1x PBS |
| Commercial assay or kit | DNA Clean and Concentration kit | Zymo Research | D4013 | |
| Commercial assay or kit | MEGAscript RNAi kit | Life Technologies | AM1626 | |
| Commercial assay or kit | RevertAid First Strand cDNA Synthesis kit | Life Technologies | K1622 | |
| Commercial assay or kit | RNAscope Multiplex Fluorescent Detection Reagents V2 | Advanced Cell Diagnostics | 323110 | |
| Software, algorithm | Seurat | Butler et al., 2018 | ||
| Software, algorithm | Monocle3 | Cao et al., 2019 | ||
| Software, algorithm | alona | Franzén and Björkegren, 2020 | https://alona.panglaodb.se/ https://github.com/oscar-franzen/alona/ | |
| Software, algorithm | Graph Pad Prism | Graph Pad Software, LLC | ||
| Other | FITC-conjugatedWheat Germ Agglutinin (WGA) | Sigma | L4985 | 1:5000 |
| Other | DRAQ5 | Thermo Fisher Scientific | 62251 | 1:1000 |
| Other | Live/Dead Fixable Dead Cell Stain | Thermo Fisher Scientific | L34965 | 1:1000 |
| Other | FluoSpheres Fluorescent Microspheres | Molecular Probes | F8821, F8823 | Red or Green fluorescent fluorospheres for phagocytosis assays |
| Other | Opal Fluorophore reagent | Akoya Biosciences | Opal520 (FP1487001KT), Opal570 (FP1488001KT) | 1:1000 |
| Other | ProLongDiamond Antifade Mountant with DAPI | Life Technologies | P36966 | |
| Other | PowerUp SYBR Green Master Mix | Applied Biosystems | A25742 | |
| Other | E-RNAi | http://www.dkfz.de/signaling/e-rnai3/idseq.php | ||
| Other | DRSC RNA Seq Explorer | Tattikota et al., 2020 | https://www.flyrnai.org/scRNA/blood/ | |
| Other | Raddi et al., 2020 | https://hemocytes.cellgeni.sanger.ac.uk/ | ||
| Other | This study | https://alona.panglaodb.se/results.html?job=2c2r1NM5Zl2qcW44RSrjkHf3Oyv51y_5f09d74b770c9 |
Additional files
-
Supplementary file 1
FKPM values of individual immune cells following scRNA-seq analysis.
- https://cdn.elifesciences.org/articles/66192/elife-66192-supp1-v3.xlsx
-
Supplementary file 2
Differential gene expression in immune cell clusters displaying significant differences between naive and blood-fed cells.
- https://cdn.elifesciences.org/articles/66192/elife-66192-supp2-v3.xlsx
-
Supplementary file 3
Significant markers of immune cell clusters identified by the FindAllMarkers program using the Seurat toolkit.
- https://cdn.elifesciences.org/articles/66192/elife-66192-supp3-v3.xlsx
-
Supplementary file 4
Genes expressed in more than >80% of cells within each respective immune cell cluster.
- https://cdn.elifesciences.org/articles/66192/elife-66192-supp4-v3.xlsx
-
Supplementary file 5
Averaged gene expression of cells within each immune cell cluster.
- https://cdn.elifesciences.org/articles/66192/elife-66192-supp5-v3.xlsx
-
Supplementary file 6
Primers for qRT-PCR and dsRNA-mediated gene silencing.
- https://cdn.elifesciences.org/articles/66192/elife-66192-supp6-v3.docx
-
Supplementary file 7
Primers for RNAi.
- https://cdn.elifesciences.org/articles/66192/elife-66192-supp7-v3.docx
-
Transparent reporting form
- https://cdn.elifesciences.org/articles/66192/elife-66192-transrepform-v3.docx
Download links
A two-part list of links to download the article, or parts of the article, in various formats.
Downloads (link to download the article as PDF)
Open citations (links to open the citations from this article in various online reference manager services)
Cite this article (links to download the citations from this article in formats compatible with various reference manager tools)
Single-cell analysis of mosquito hemocytes identifies signatures of immune cell subtypes and cell differentiation
eLife 10:e66192.
https://doi.org/10.7554/eLife.66192


