Channel nuclear pore complex subunits are required for transposon silencing in Drosophila
- Cancer Research UK Cambridge Institute, University of Cambridge, Li Ka Shing Centre, United Kingdom
- Department of Life Science, Faculty of Health, Education and Life Sciences, Birmingham City University, United Kingdom
- School of Biosciences, College of Life and Environmental Sciences, University of Birmingham, United Kingdom
- Birmingham Center for Genome Biology, University of Birmingham, United Kingdom
Figures
Figure 1 with 3 supplements
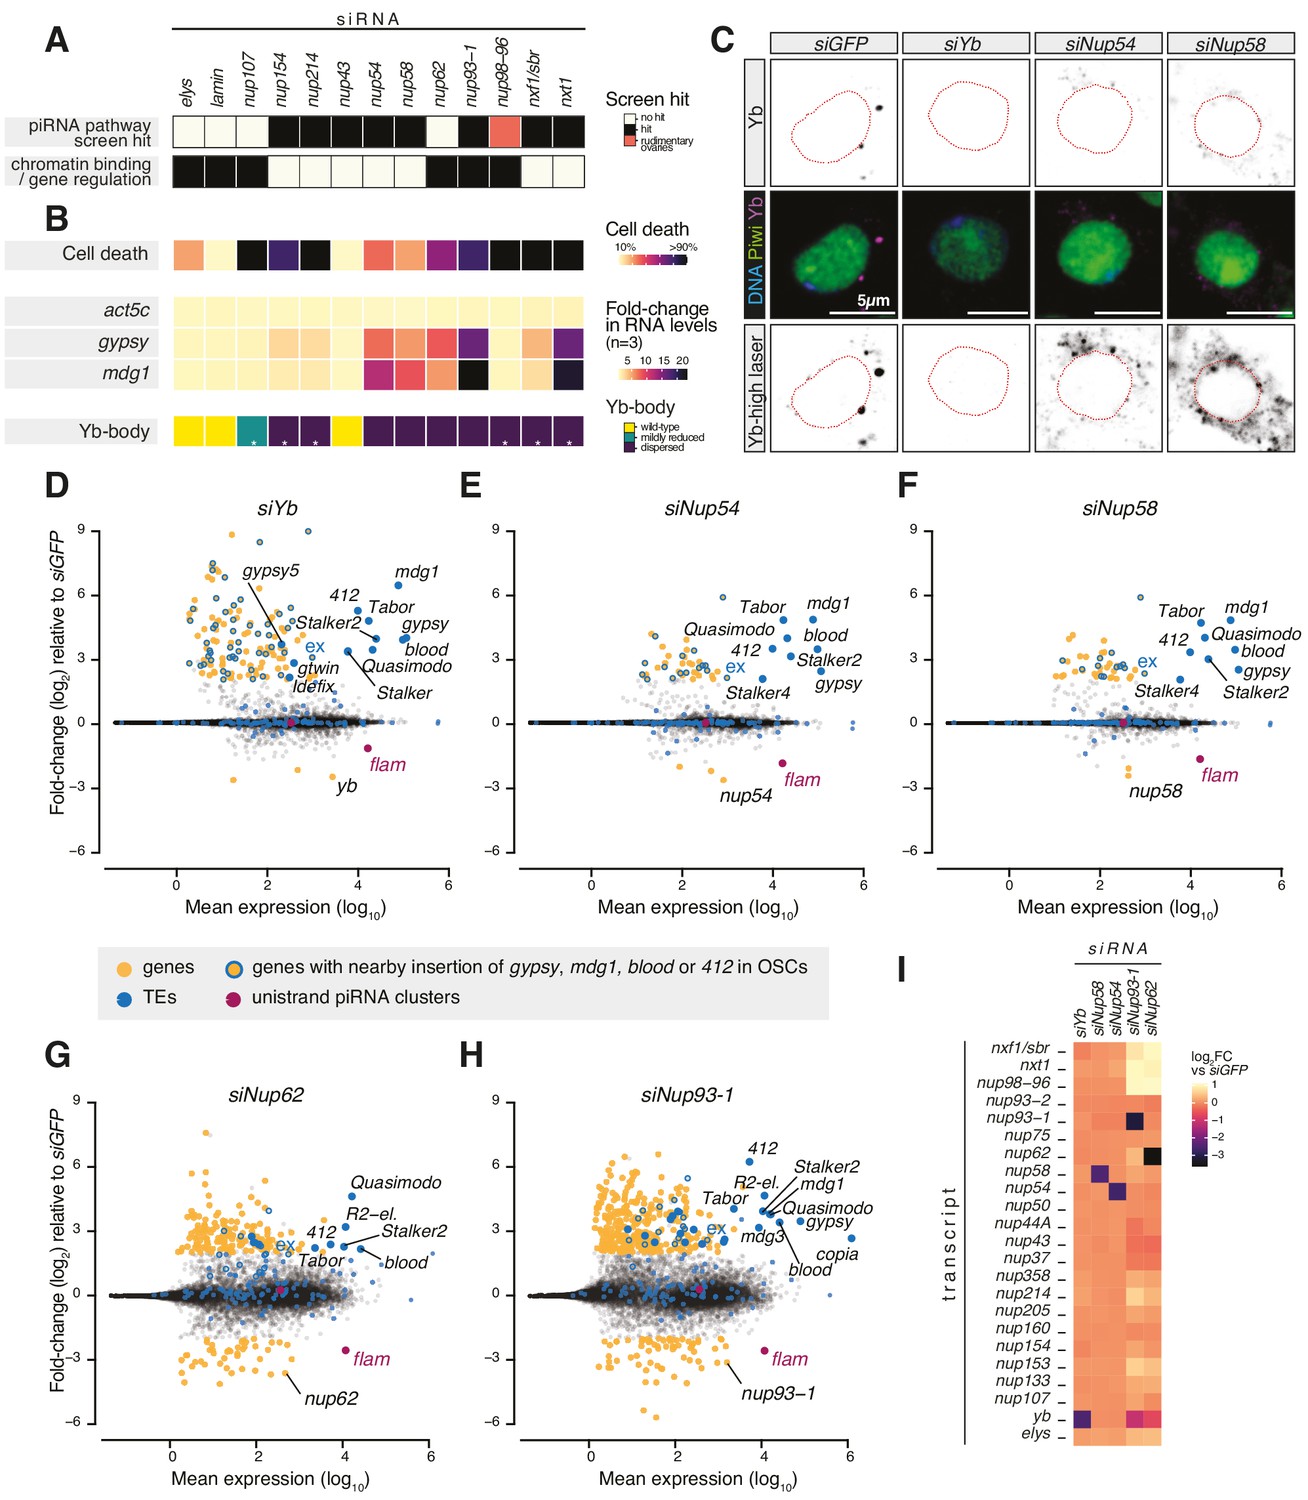
Requirement of Nuclear Pore Complex (NPC) subunits for gene regulation and transposon control.
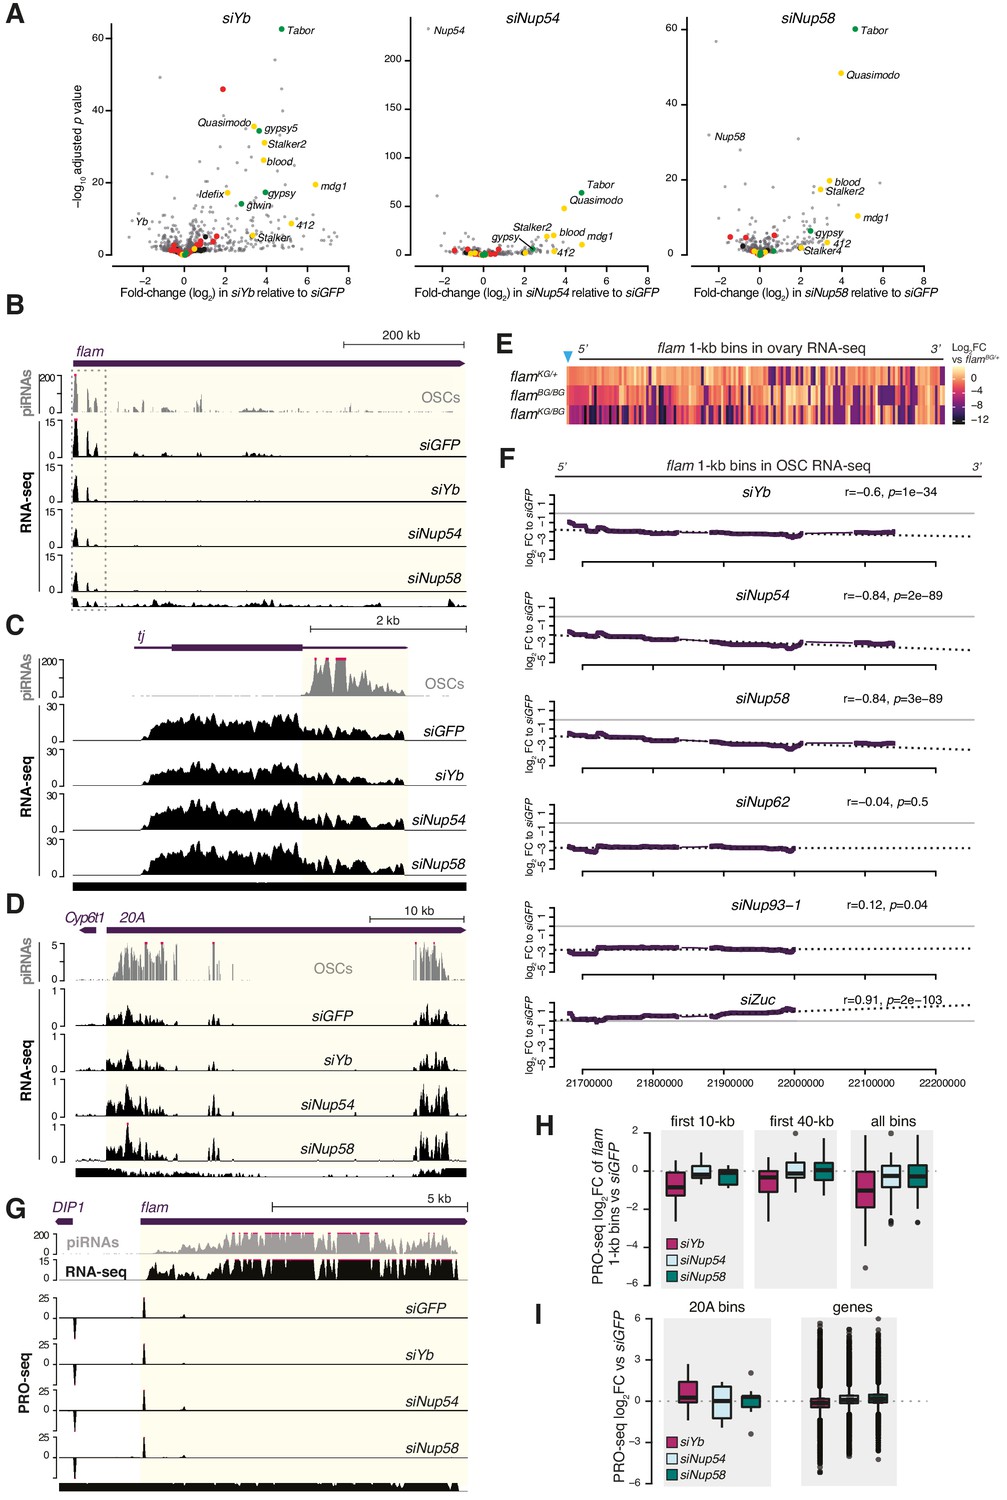
(A) Heatmap summarising literature data for selected Nups and export factors and (B) effects of each knockdown (kd) on cell viability, transposon expression levels with respect to siGFP and Yb-body assembly after 96 hr of siRNA treatment (n = 3; see also Figure 1—figure supplement 2A–E and Figure 1—figure supplement 3). Asterisks denote samples imaged after 48 hr of siRNA treatment because of lethality at later timepoints. (C) Confocal images of Yb and Piwi proteins in ovarian somatic cells (OSCs) upon the indicated kd. Dotted red lines denote nuclear envelope (see also Figure 1—figure supplement 2F). (D–H) MA plots showing mean expression levels (reads per million mapped reads, rpm) against fold-changes of genes and transposable elements (TEs) in RNA-seq from the indicated kd with respect to siGFP control (n = 4). Yellow: genes de-regulated more than fourfold with adjusted p value < 0.05; blue: TEs; blue outlines: genes de-regulated more than fourfold carrying a nearby TE (gypsy, mdg1, 412, or blood) insertion in OSCs; magenta: uni-strand piRNA clusters (20A and flam). (I) Fold-changes in transcript levels upon the indicated kd with respect to siGFP.
Figure 1—figure supplement 1
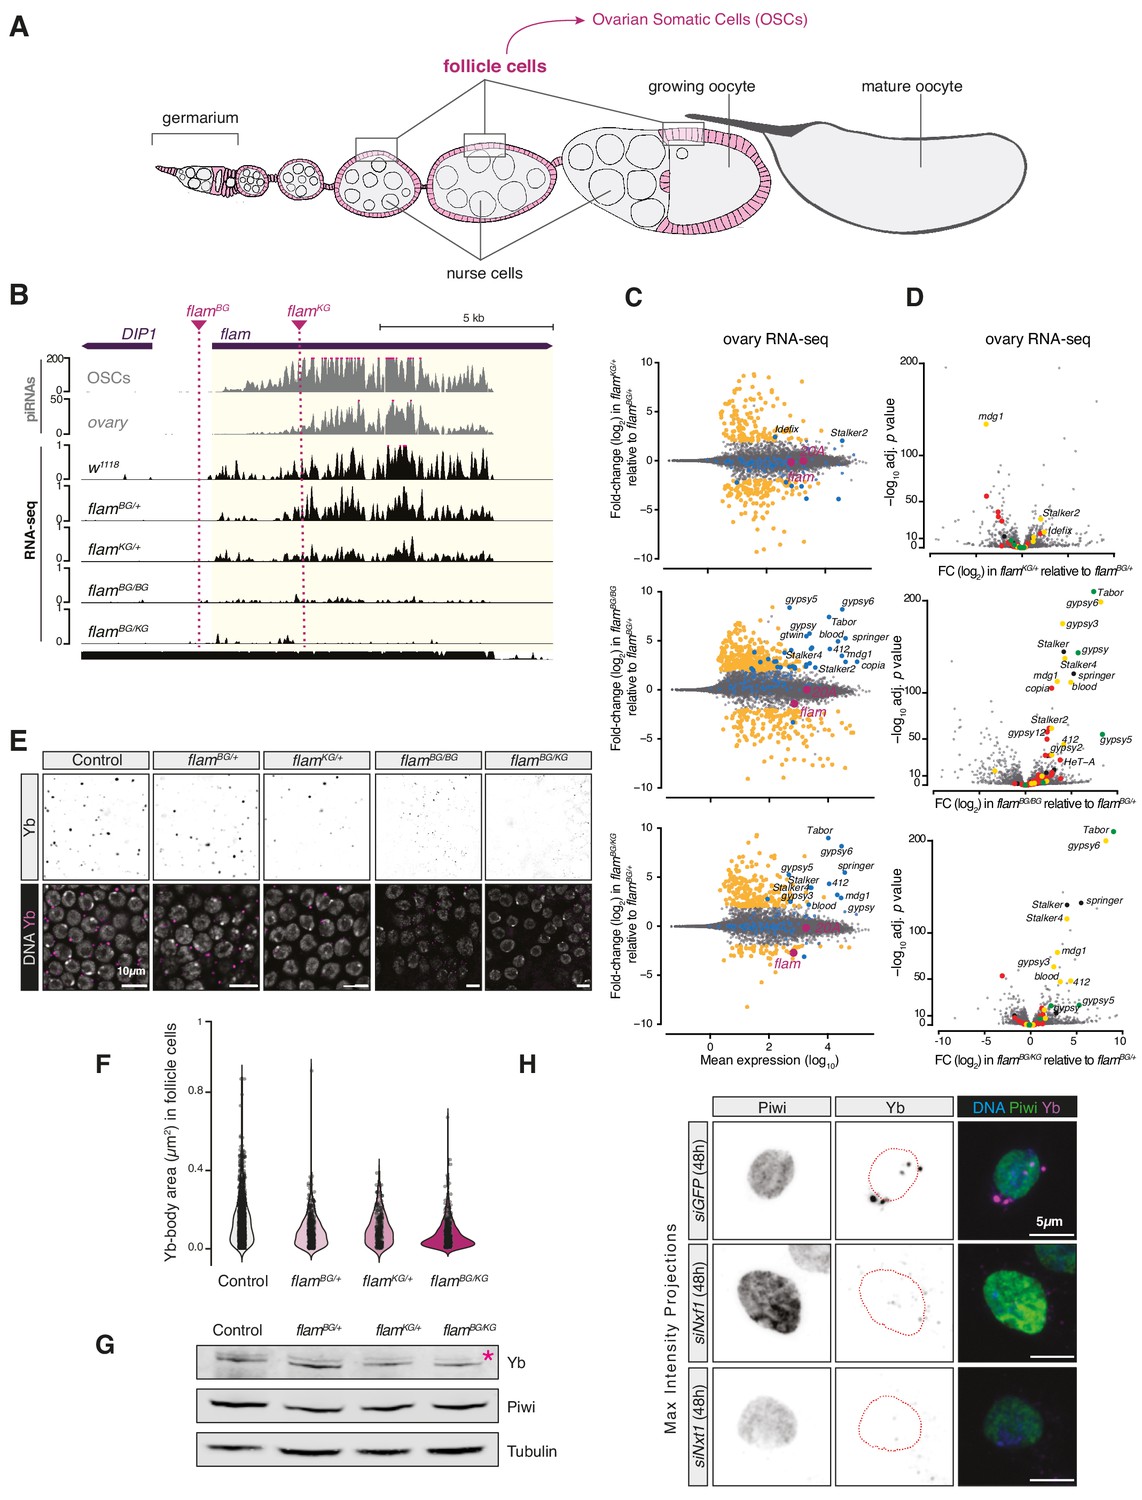
Yb-body formation is dependent on flam.
(A) Schematic of a Drosophila ovariole, the functional unit of the fly ovary. The follicle cells enclosing egg chambers are highlighted in magenta and cells of the germline are shown in grey. (B) Coverage plots of PIWI-interacting RNAs (piRNAs) and RNA-seq reads uniquely mapped to the uni-strand cluster flam in the indicated genotypes. Dashed lines indicate the location of the P-element insertion in the two flam mutant alleles. The mappability for an average 50 bp read length is shown at the bottom. (C) MA plots showing mean expression levels (rpm) against fold-changes with respect to control (flamBG/+) of genes and TEs in RNA-seq from the indicated genotypes (n = 3). Yellow: genes de-regulated more than fourfold with adjusted p value < 0.05. blue: transposable elements (TEs); magenta: uni-strand piRNA clusters (20A and flam). (D) Volcano plots showing fold-changes and corresponding significance of genes and TEs in RNA-seq from the indicated genotypes. Red: germline TEs; yellow: TEs active in somatic and germline tissue; green: somatic TEs. (E) Confocal images of Yb protein in follicle cells of control and indicated mutant flies. (F) Violin plots showing area of Yb-bodies in follicle cells of indicated genotypes. (G) Western blot showing Piwi and Yb levels in indicated genotypes; asterisk denotes an unspecific band from the anti-Yb antibody. (H) Confocal images of Yb and Piwi proteins in ovarian somatic cells (OSCs) upon the indicated knockdown (maximum intensity projections). Dotted red lines denote the nuclear envelope.
Figure 1—figure supplement 2
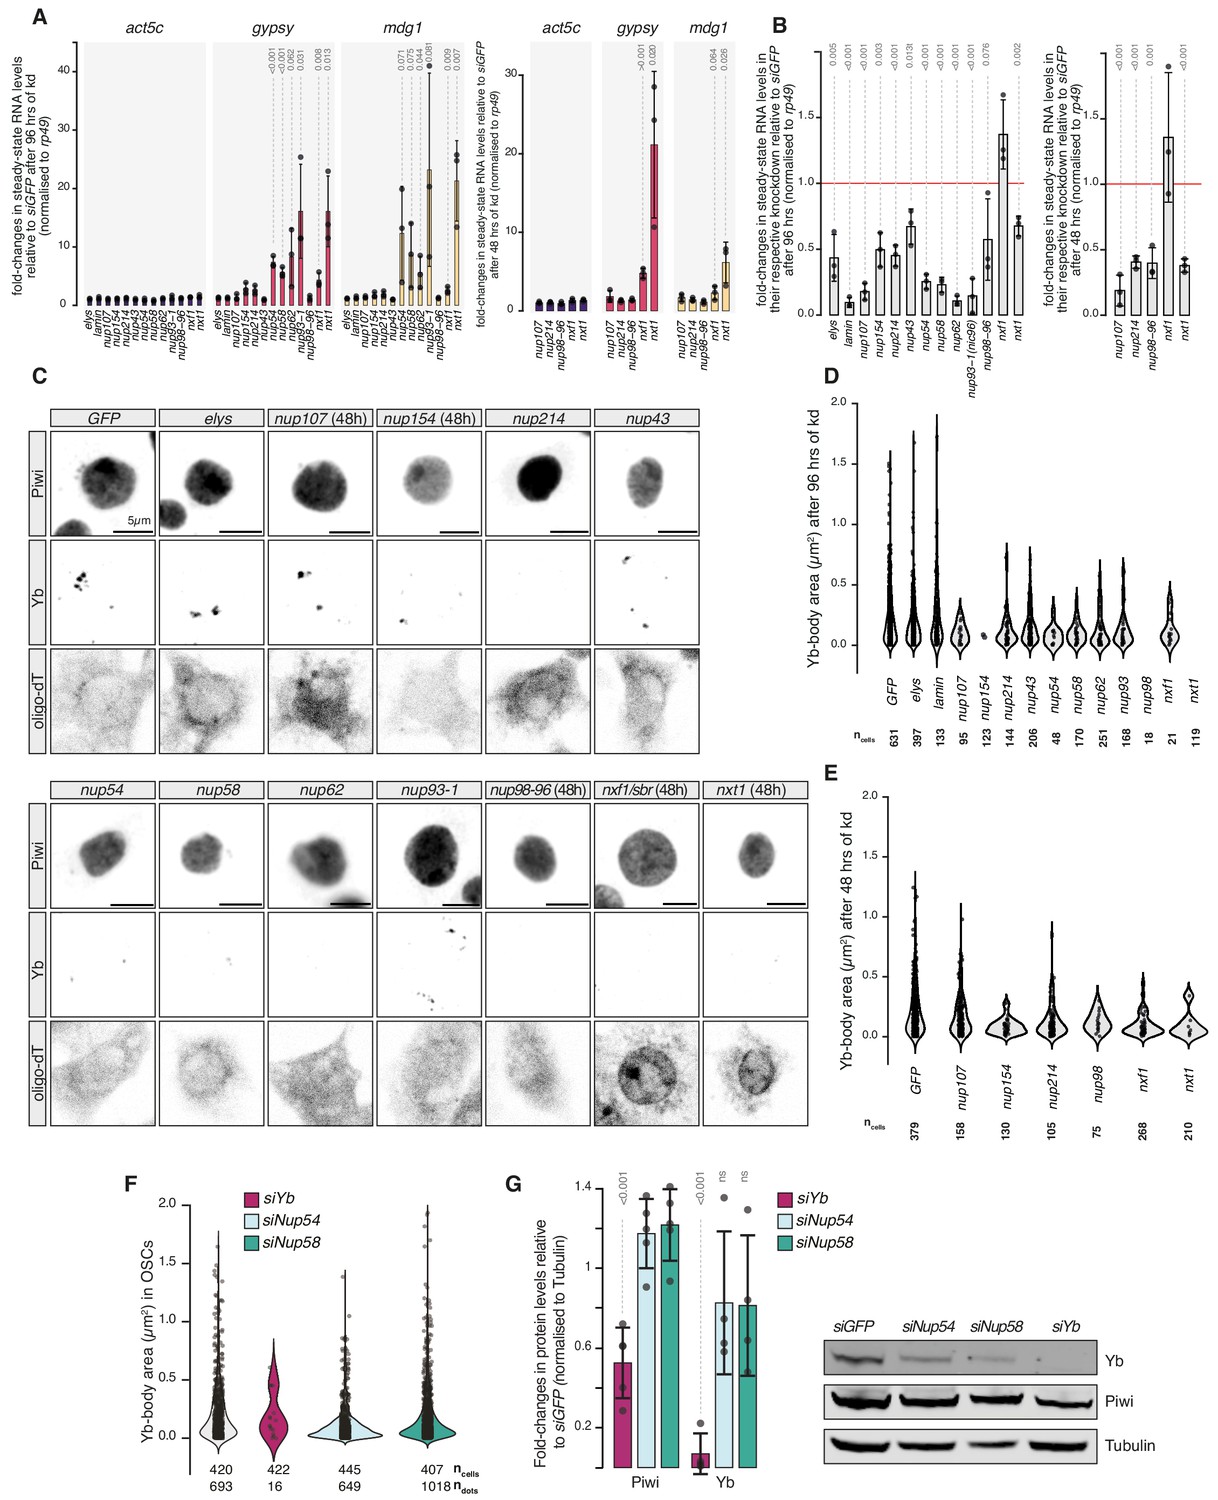
Effects of Nuclear Pore Complex subunits on transposable element (TE) silencing and Yb-body assembly in ovarian somatic cells (OSCs).
(A) Fold-changes in steady-state RNA levels of the indicated transposons or protein-coding mRNAs in OSCs upon the indicated knockdowns (kd) for 96 or 48 hrs. Values are relative to siGFP control kd and normalised to rp49. Error bars indicate standard deviation (n = 3). p values relative to the siGFP control are indicated above (unpaired t-test). (B) Fold-changes in steady-state RNA levels in OSCs upon the indicated kd for 96 or 48 hrs. Each bar indicates the kd target transcript expression level upon treatment with the respective siRNA. Values are relative to siGFP control and normalised to rp49. Error bars indicate standard deviation (n = 3). p values relative to the siGFP control are indicated above (unpaired t-test). (C) Confocal images of Yb and Piwi proteins and polyA-tail containing transcripts (oligo-dT) in OSCs upon the indicated kd. All kd are analysed after 96 hr unless indicated otherwise. See extended panel in Figure 1—figure supplement 3. (D, E) Violin plots showing area of Yb-bodies in OSCs upon the indicated kd, analysed after 96 (D) or 48 hr (E). ncells = total number of cells analysed. (F) Violin plots showing the area (in µm2) of Yb-bodies in OSCs upon the indicated kd, analysed after 96 hr. ncells = total number of cells analysed. ndots = number of Yb-bodies counted. (G) Quantification of western blots probing Piwi and Yb levels in the indicated kd (n = 4). p values with respect to siGFP control are indicated above (unpaired t-test). A representative western blot is shown on the right.
Figure 1—figure supplement 3
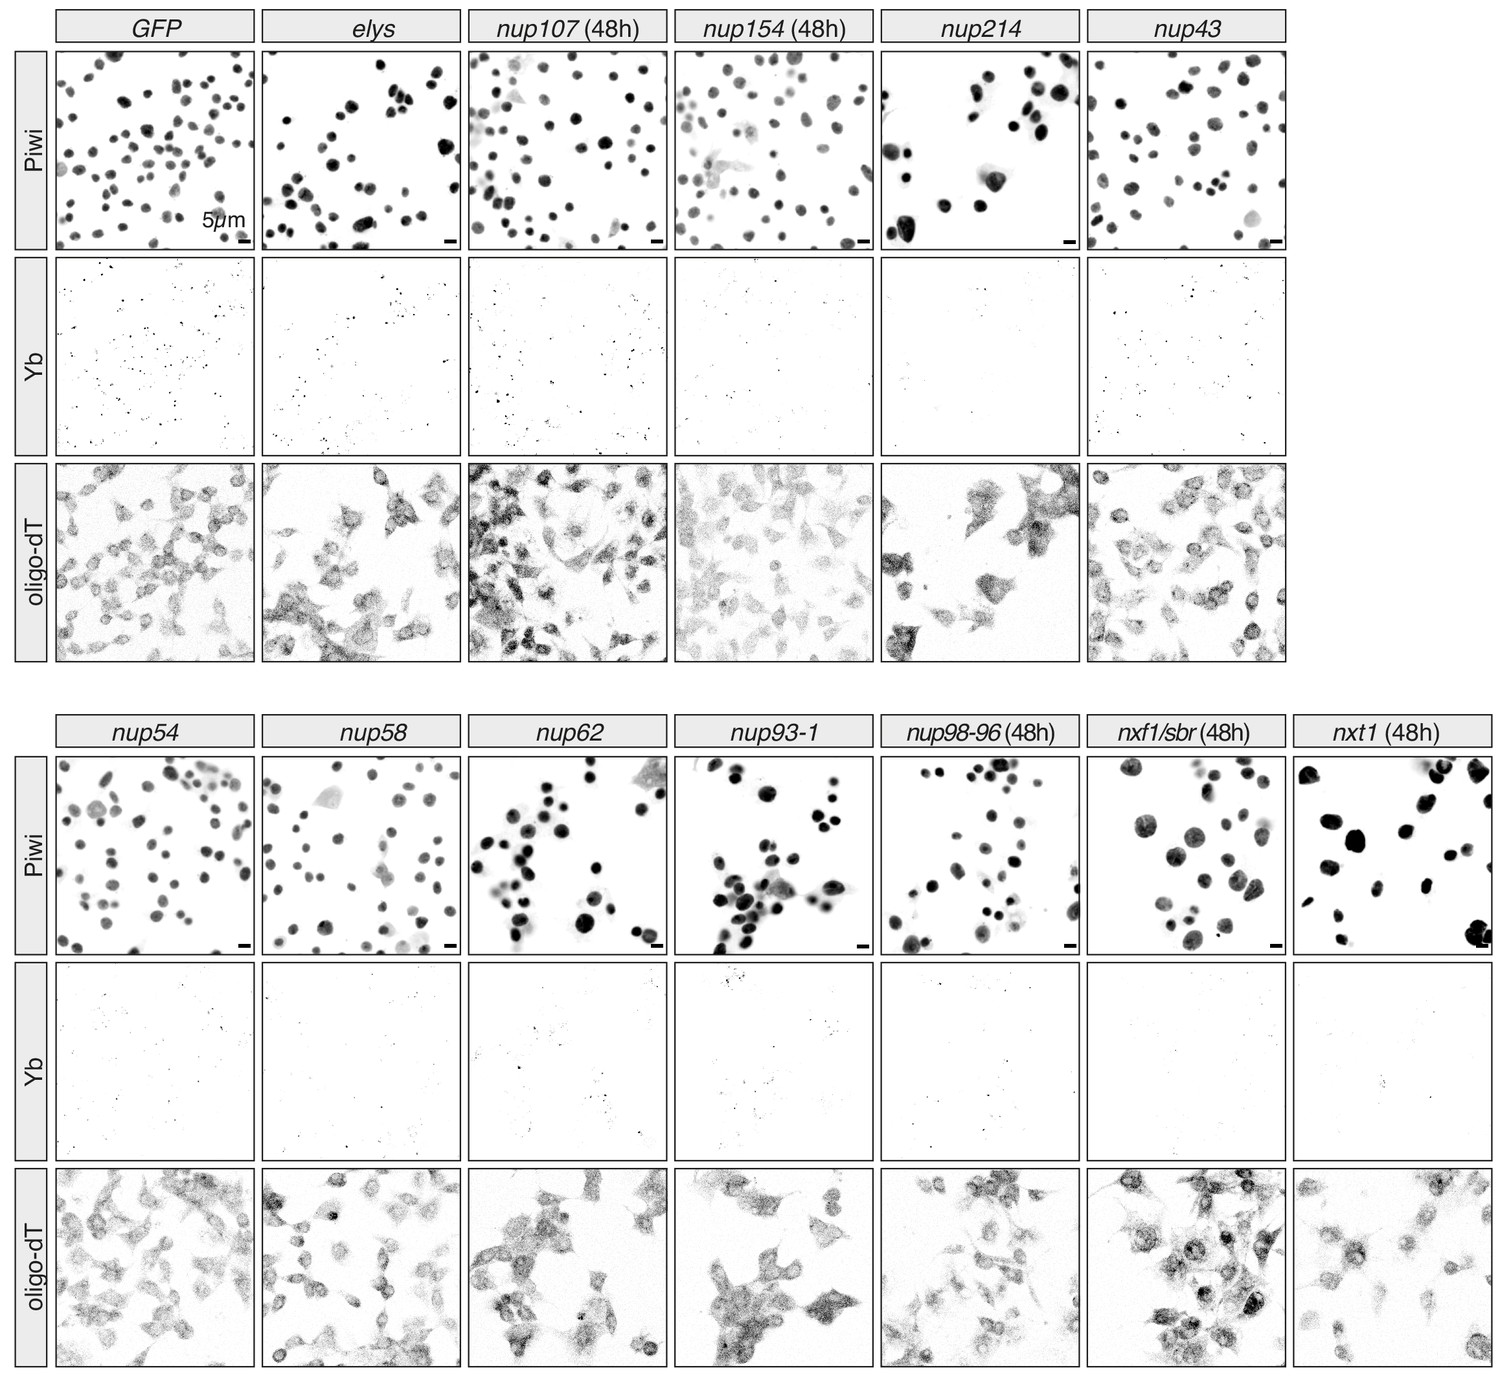
Effects of Nuclear Pore Complex subunits on Yb-body assembly in ovarian somatic cells (OSCs).
Confocal images of Yb and Piwi proteins and polyA-tail containing transcripts (oligo-dT) in OSCs upon the indicated knockdown. All knockdowns are 96 hr unless indicated otherwise.
Figure 2 with 3 supplements

Phenylalanine-glycine (FG) nucleoporins Nup54 and Nup58 function specifically in transposable element (TE) silencing.
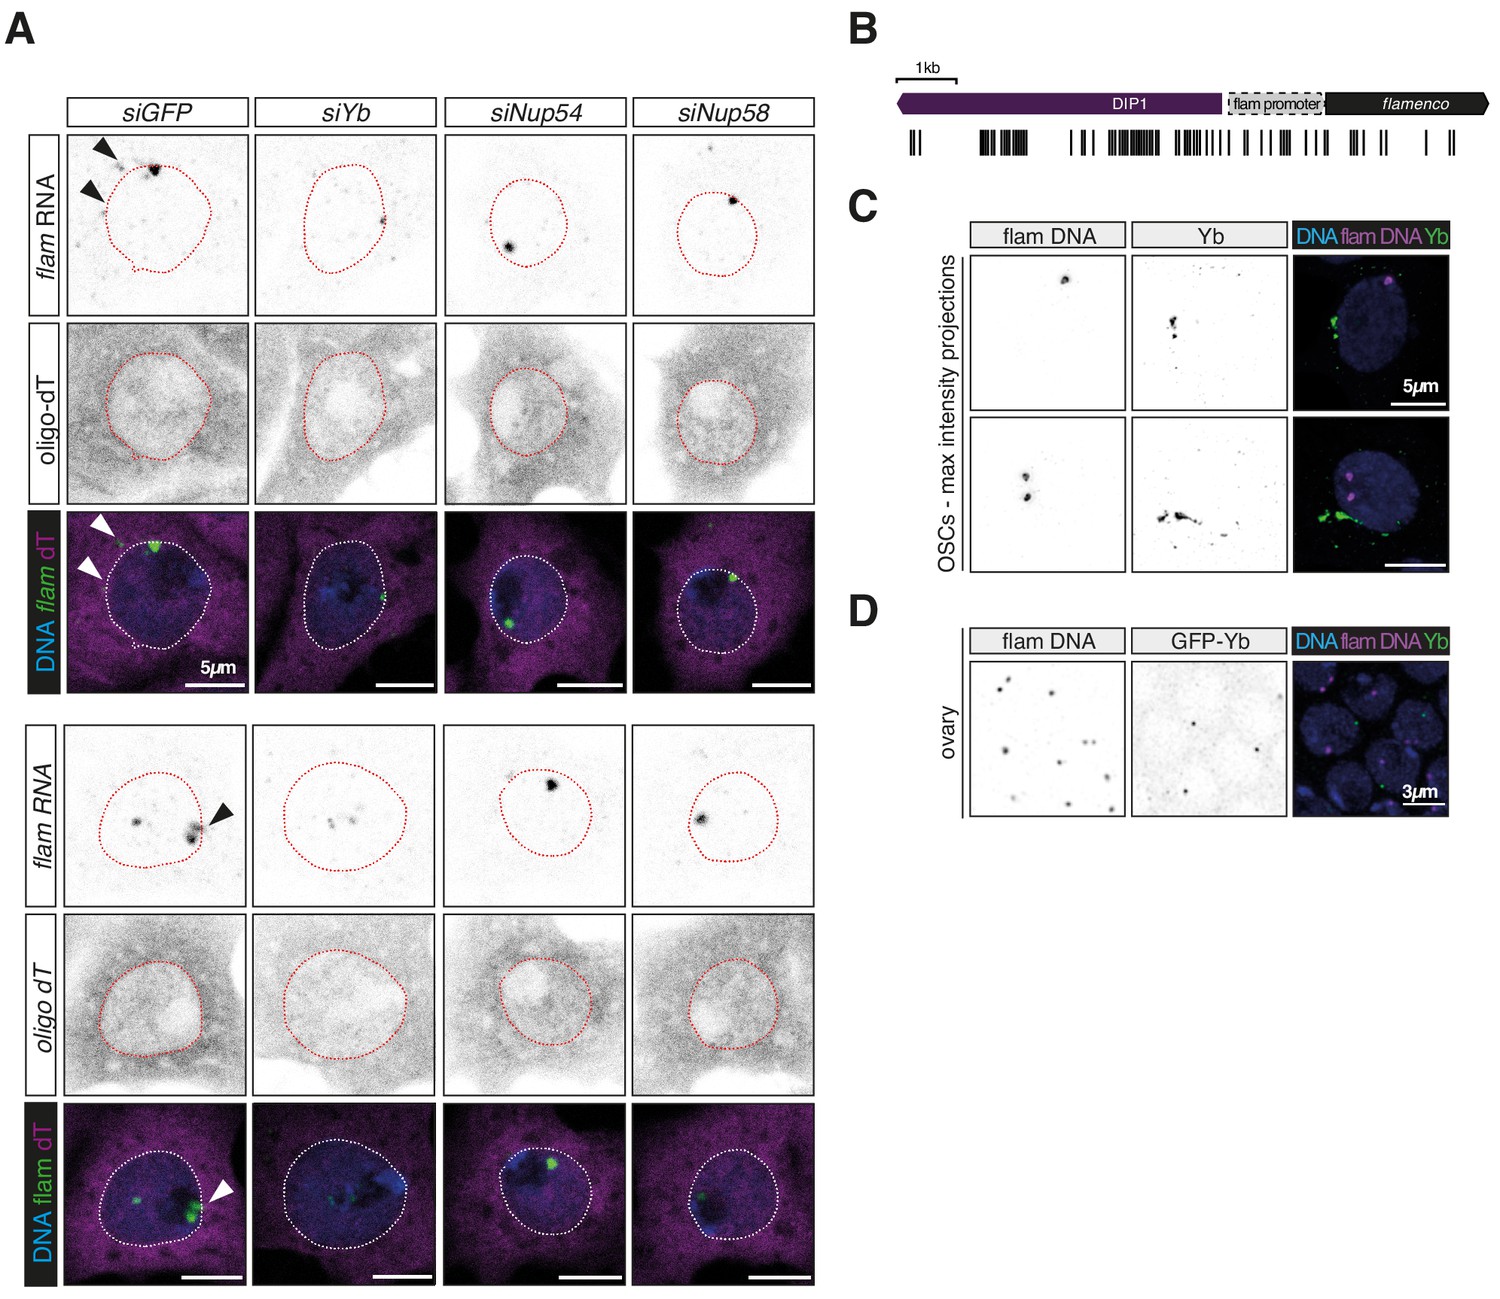
(A) Cartoon showing the Nuclear Pore Complex (NPC) structure with nuclear and cytosolic factors involved in flam export; inset shows the domain structure of the Nup62 complex subunits and of Nup93-1. Green boxes: FG-repeats; purple box: Nup54-family domain; grey box: Nic96-family domain. (B) Box plots showing changes in flam RNA levels in the indicated knockdowns (kd) or genotypes. Each datapoint corresponds to a 1 kb bin. Fold-changes were calculated for each bin with respect to the siGFP control. (C) Heatmaps showing changes in flam RNA levels in the indicated kd. Each datapoint corresponds to a 1 kb bin, ordered from 5′ to 3′. Fold-changes were calculated for each bin with respect to the relative siGFP control. (D, E) Coverage plots of piRNAs and RNA-seq reads uniquely mapped to the flam locus or to the protein-coding gene tj upon the indicated kd. The mappability for 25 bp reads is shown at the bottom. (F, G) Scatter plots showing expression levels of PIWI-interacting RNAs (piRNAs) upon the indicated kd. (H) Heatmaps showing changes in flam-derived piRNA levels upon the indicated kd. Each datapoint corresponds to a 1 kb bin, ordered from 5′ to 3′. Fold-changes were calculated for each bin with respect to the siGFP control. (I) Quantification of nuclear and cytoplasmic flam RNA-FISH foci is shown. Nnuc = total number of nuclei analysed; ndots = total number of flam foci counted. (L) Confocal images of flam RNA and polyA-tail containing transcripts (oligo-dT) in ovarian somatic cells (OSCs) upon the indicated kd (full panel in Figure 2—figure supplement 3A). Arrowheads indicate cytosolic flam foci. Dotted line denotes the nuclear envelope based on anti-lamin staining. (M) Confocal images of polyA-tailed transcripts (oligo-dT) in OSCs upon the indicated kd (full panel in Figure 1—figure supplement 2C and Figure 1—figure supplement 3).
Figure 2—figure supplement 1
Effects of Nup54 and Nup58 knockdown (kd) on flam expression.
(A) Volcano plots showing fold-changes and corresponding significance of genes and transposable elements (TEs) in RNA-seq from the indicated kd. Red: germline TEs; yellow: TEs active in somatic and germline tissue; green: somatic TEs. (B–D) Coverage plots of PIWI-interacting RNAs (piRNAs) and RNA-seq reads uniquely mapped upon the indicated kd. The mappability for 50 bp reads is shown at the bottom. (E) Heatmap showing changes in flam RNA levels in indicated genotypes. Each datapoint corresponds to a 1 kb bin, ordered from 5′ to 3′. Fold-changes were calculated for each bin with respect to the flamBG/+ control. The blue arrow indicates the P-element insertion in the flamKG allele, which disrupts flam transcription. (F) Changes in flam RNA levels in the indicated kd (100 kb sliding windows, ordered from 5′ to 3′, n = 396 windows). Dotted lines represent linear regression fits between log2 FC and transcript coordinates with Pearson’s r and significance (p) shown. (G) Coverage plots of piRNAs, RNA-seq, and PRO-seq reads (in rpm) uniquely mapped upon the indicated kd. The mappability for 50 bp reads is shown at the bottom. (H, I) Box plots showing changes in PRO-seq signal upon the indicated kd (n = 2). Each datapoint for flam and 20A corresponds to a 1 kb bin. Fold-changes were calculated for each bin with respect to the siGFP control.
Figure 2—figure supplement 2
Nup54 and Nup58 are required for PIWI-interacting RNA (piRNA) production from flam.
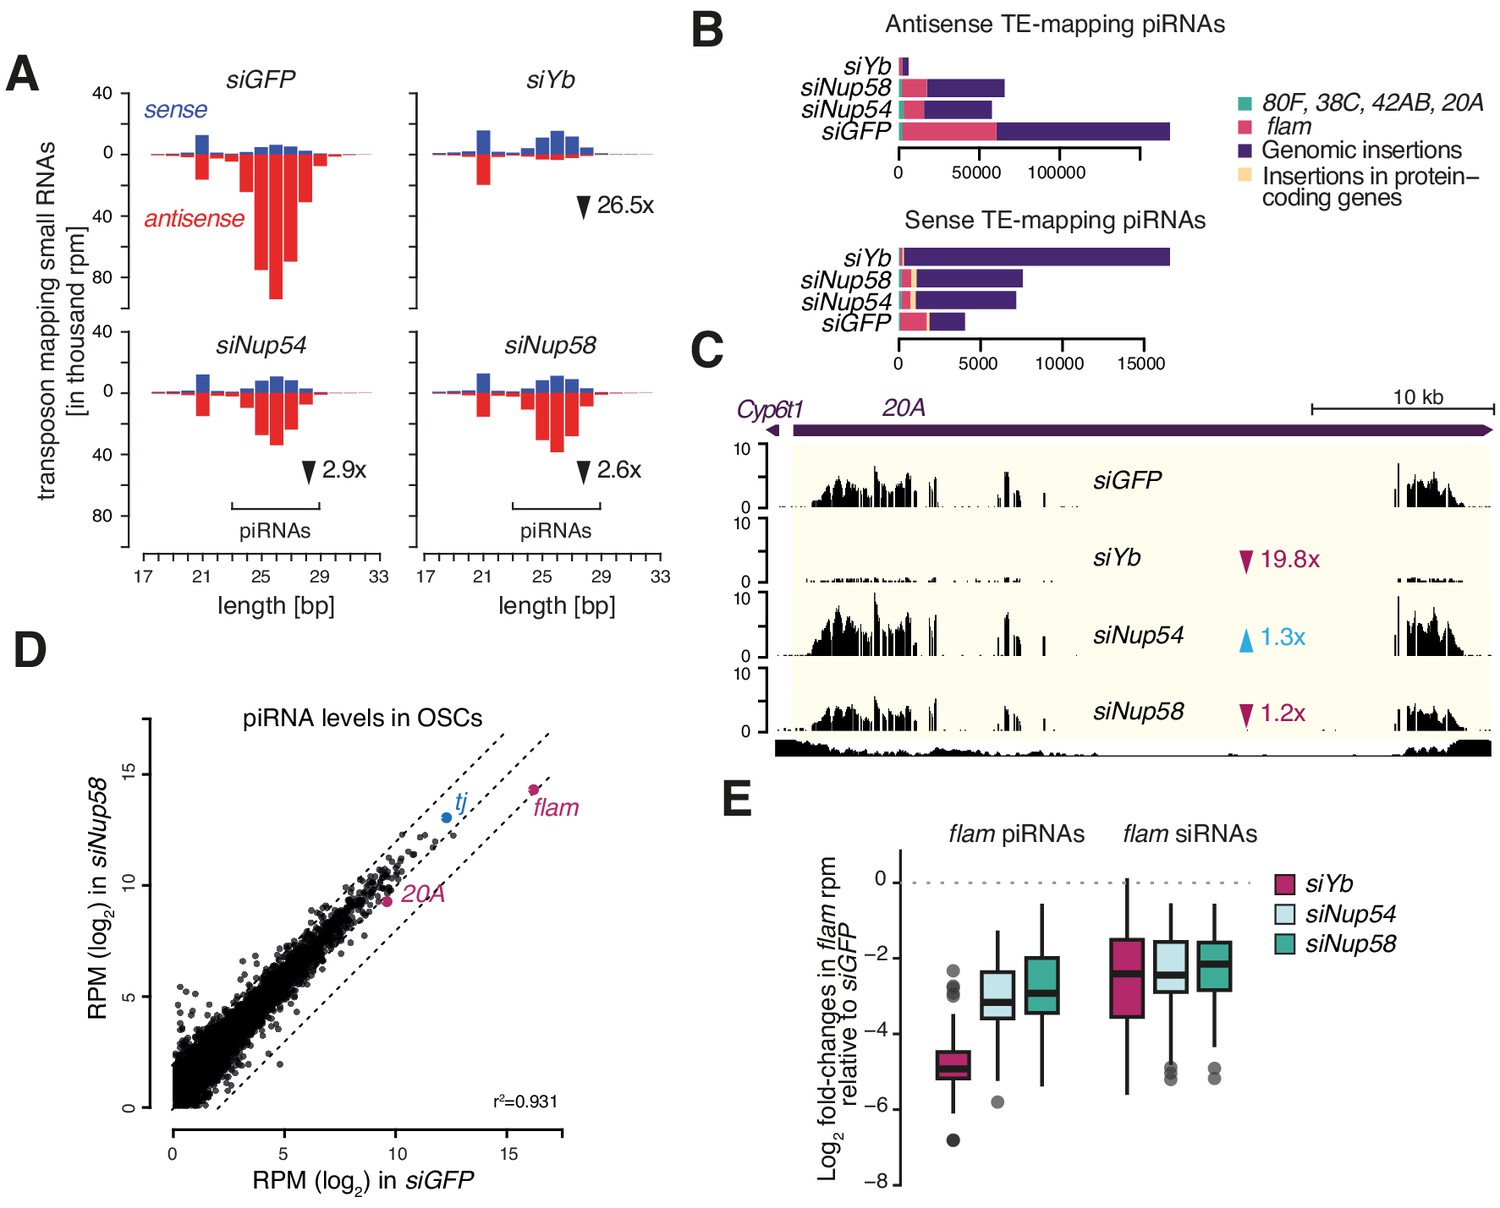
(A) Bar plots showing small RNA size profiles of transposable element (TE)-mapped reads upon the indicated knockdowns (kd). Counts are normalised to 1 million mapped miRNAs. Red: antisense; blue: sense. (B) Bar plots showing the genomic source of the sense and antisense TE-mapped small RNAs shown in (A) upon the indicated kd. Counts are normalised to 1 million mapped miRNAs. (C) Coverage plot showing piRNA levels over the uni-strand cluster 20A. (D) Scatter plot showing expression levels of piRNAs upon the indicated kd. (E) Box plots showing changes in flam piRNA and siRNA levels upon the indicated kd (1 kb bins).
Figure 2—figure supplement 3
Nup54 and Nup58 are required for flam export.
(A) Confocal images of flam RNA and polyadenylated mRNAs (oligo-dT) upon the indicated knockdown (kd). Arrowheads indicate cytosolic flam foci. (B) Schematic of the probes used for flam DNA-FISH. (C, D) Confocal images of flam DNA and Yb protein signal in ovarian somatic cells (OSCs) (C) and ovaries (D).
Figure 3 with 2 supplements
Nup54 and Nup58 are specifically required for flam export and processing into PIWI-interacting RNAs (piRNAs).
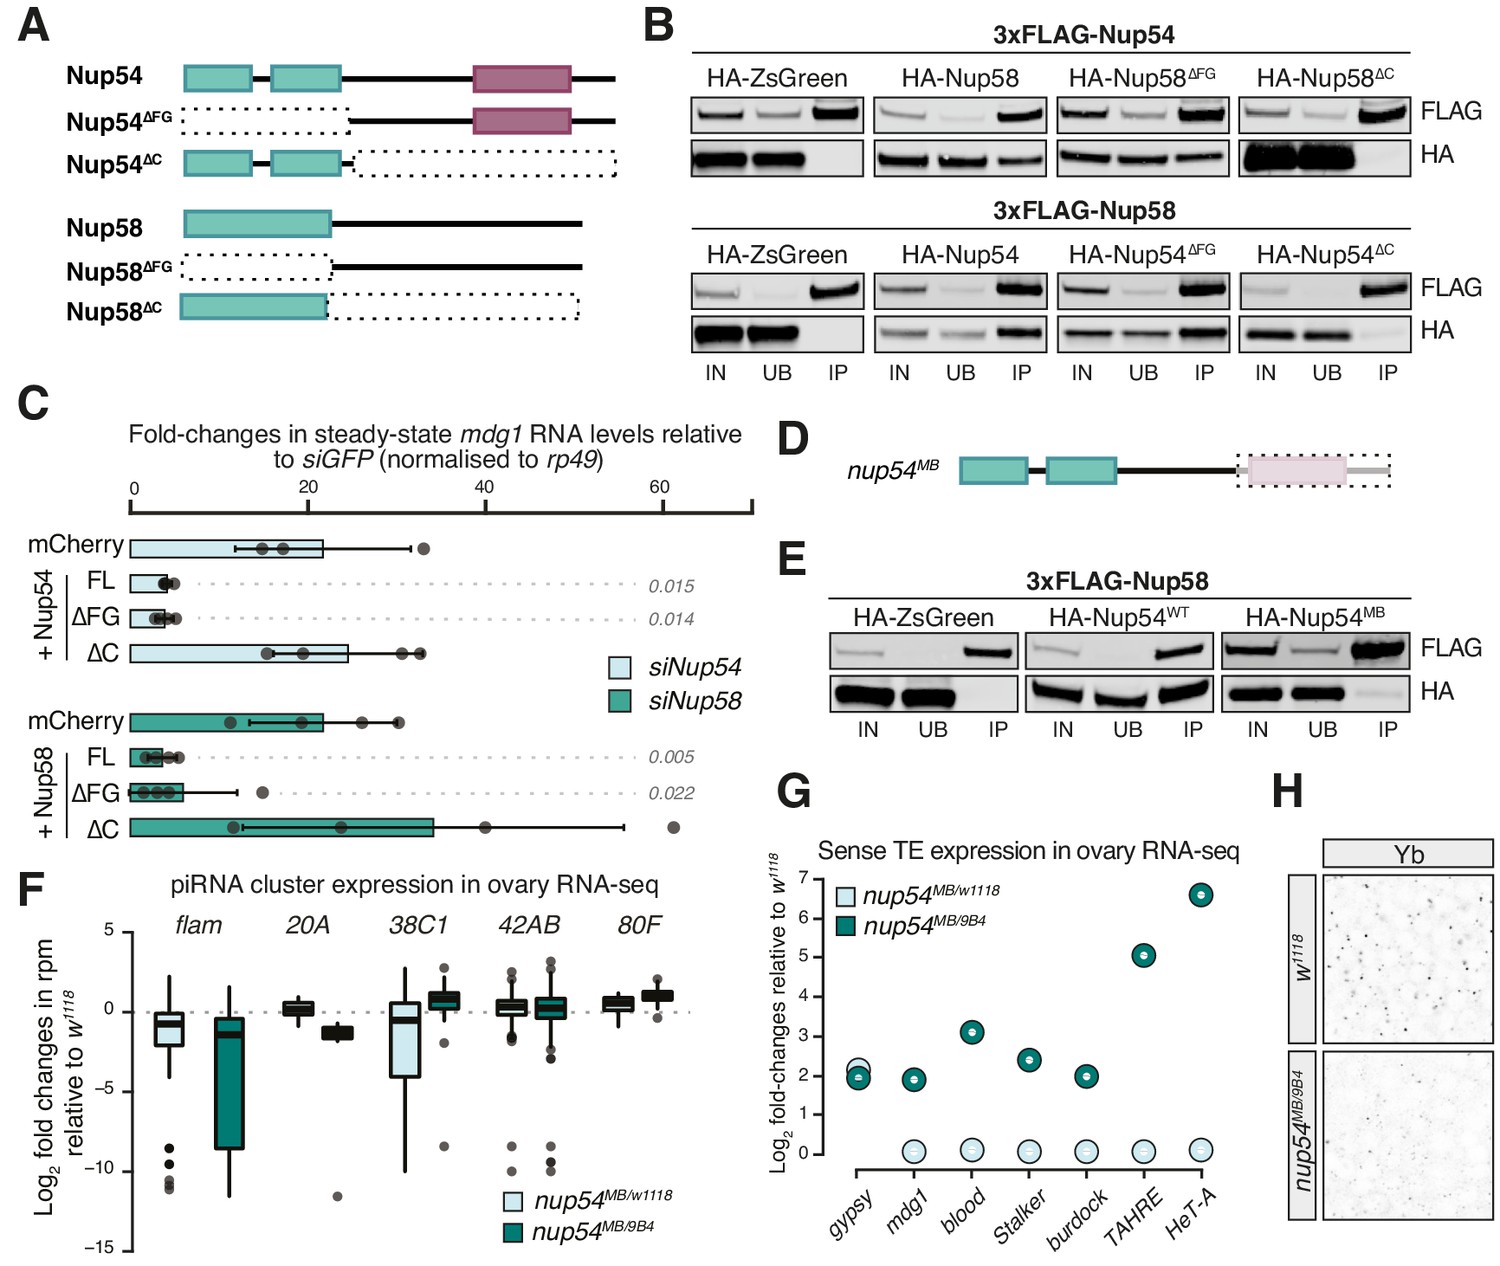
(A) Schematic of the Nup54 and Nup58 domain structure and the deletion constructs used in rescue experiments and co-immunoprecipitation assays. Green box: phenylalanine-glycine (FG)-repeats; purple box: Nup54-family domain. (B) Western blots of FLAG-tag co-immunoprecipitates from lysates of S2 cells transfected with the indicated constructs. IN: input; UB: unbound; IP: immunoprecipitate. (C) Fold-changes in steady-state RNA levels of the mdg1 transposon in ovarian somatic cells (OSCs) nucleofected with the indicated siRNAs and rescue constructs. Values are relative to siGFP and normalised to rp49. Error bars indicate standard deviation (n = 4). p values indicated next to each bar were calculated with respect to the relative mCherry control (unpaired t-test). (D) Schematic of the nup54MB allele. The dashed box indicates the portion that is absent in the mutant (purple box: Nup54 family domain). (E) Western blots of FLAG-tag co-immunoprecipitates from lysates of S2 cells transfected with the indicated constructs. (F) Box plots showing changes in piRNA cluster transcript levels in the indicated genotypes. Each datapoint corresponds to a 1 kb bin. (G) Steady-state levels of transposable element (TE) transcripts in the indicated genotypes. (H) Confocal images of Yb protein in follicle cells of the indicated genotypes (full panel in Figure 3—figure supplement 2).
Figure 3—figure supplement 1
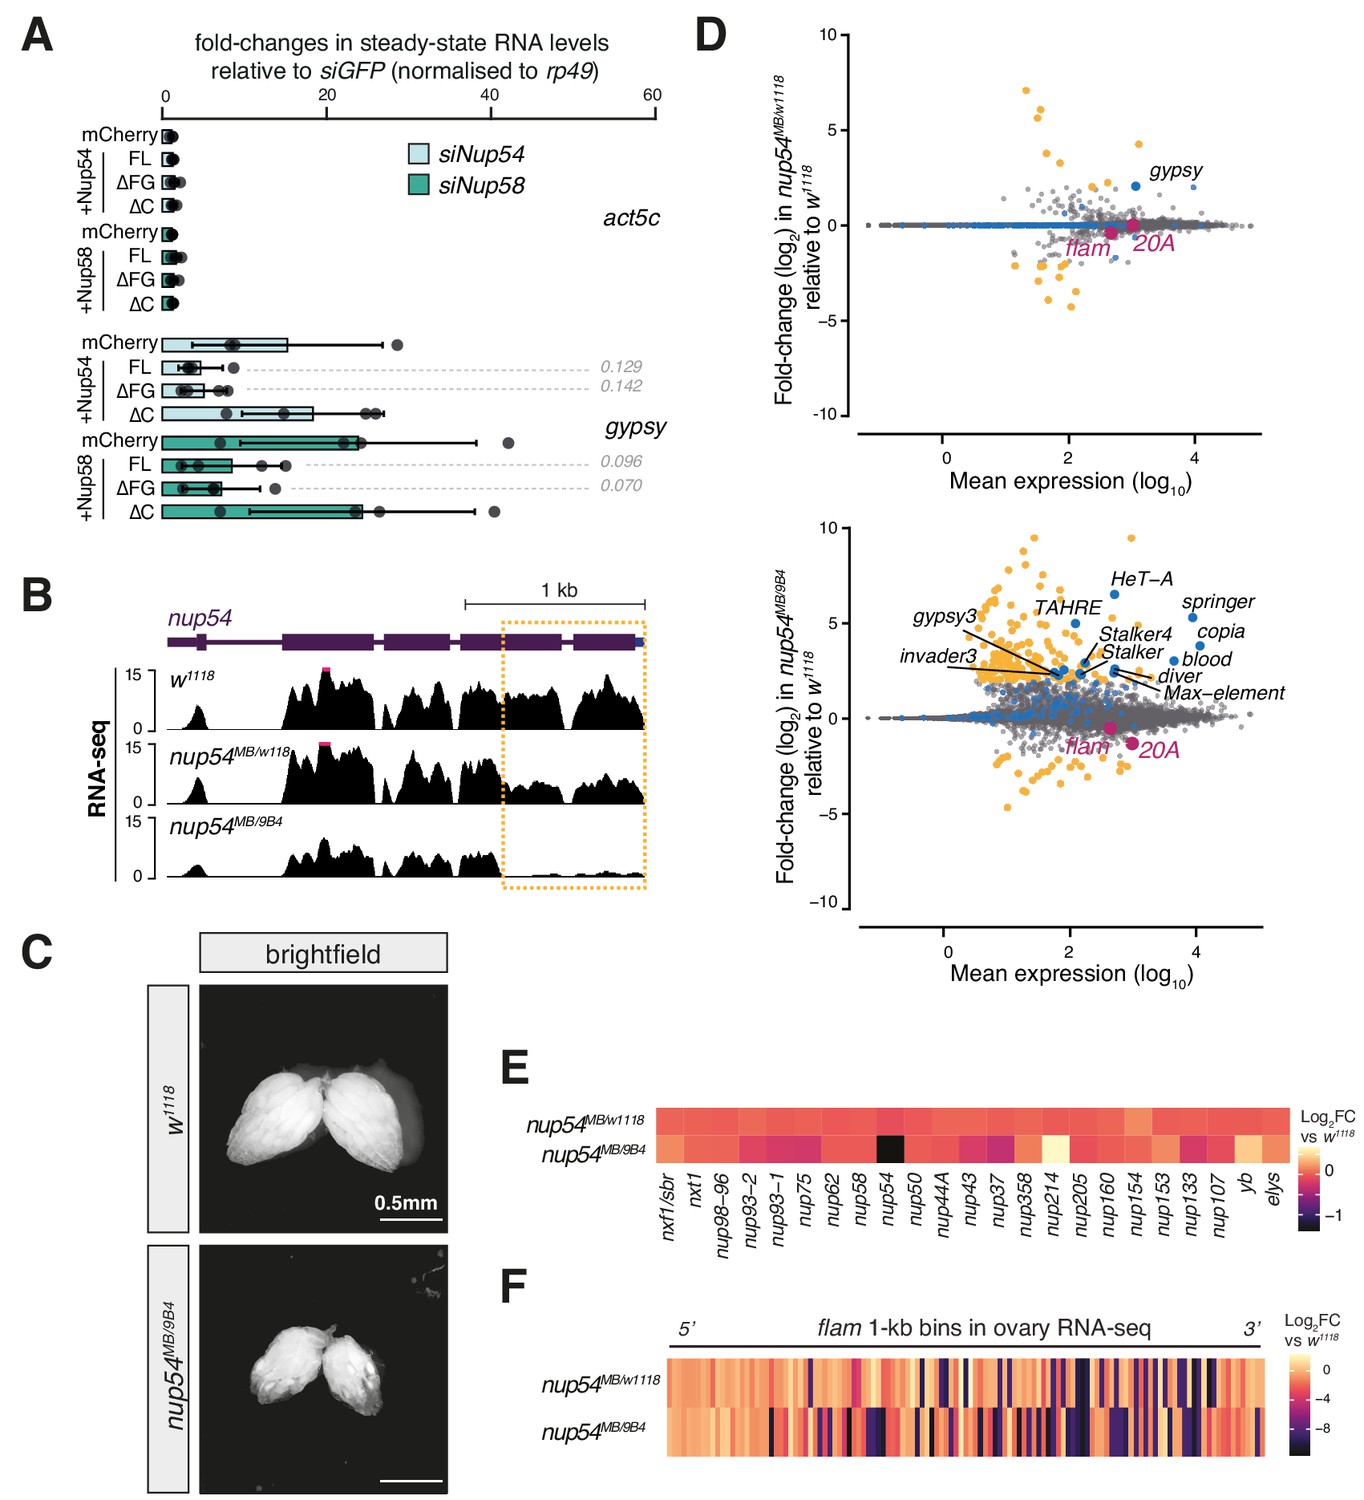
Effect of nup54MB mutants on gene expression.
(A) Fold-changes in steady-state RNA levels of the gypsy transposon or act5c gene in ovarian somatic cells (OSCs) nucleofected with the indicated siRNAs and rescue constructs. Values are relative to siGFP control knockdown and normalised to rp49. Error bars indicate standard deviation (n = 4). p values indicated next to each bar were calculated with respect to the relative mCherry control (unpaired t-test). (B) Coverage plots of RNA-seq reads over the nup54 locus. (C) Brightfield images showing ovary size and morphology in the indicated genotypes. (D) MA plots showing mean expression levels (rpm) and fold-changes with respect to control (w1118) of genes and transposable elements (TEs) in RNA-seq from the indicated genotypes (n = 3). Yellow: genes de-regulated more than fourfold with adjusted p value < 0.05; blue: TEs; magenta: uni-strand PIWI-interacting RNA (piRNA) clusters (20A and flam). (E) Heatmaps showing fold-changes in the RNA expression levels of various nucleoporins (Nups) and export factors in the indicated genotypes. (F) Heatmap showing changes in flam RNA levels in the indicated genotypes. Each datapoint corresponds to a 1 kb bin, ordered from 5′ to 3′. Fold-changes were calculated for each bin with respect to the w1118 control.
Figure 3—figure supplement 2
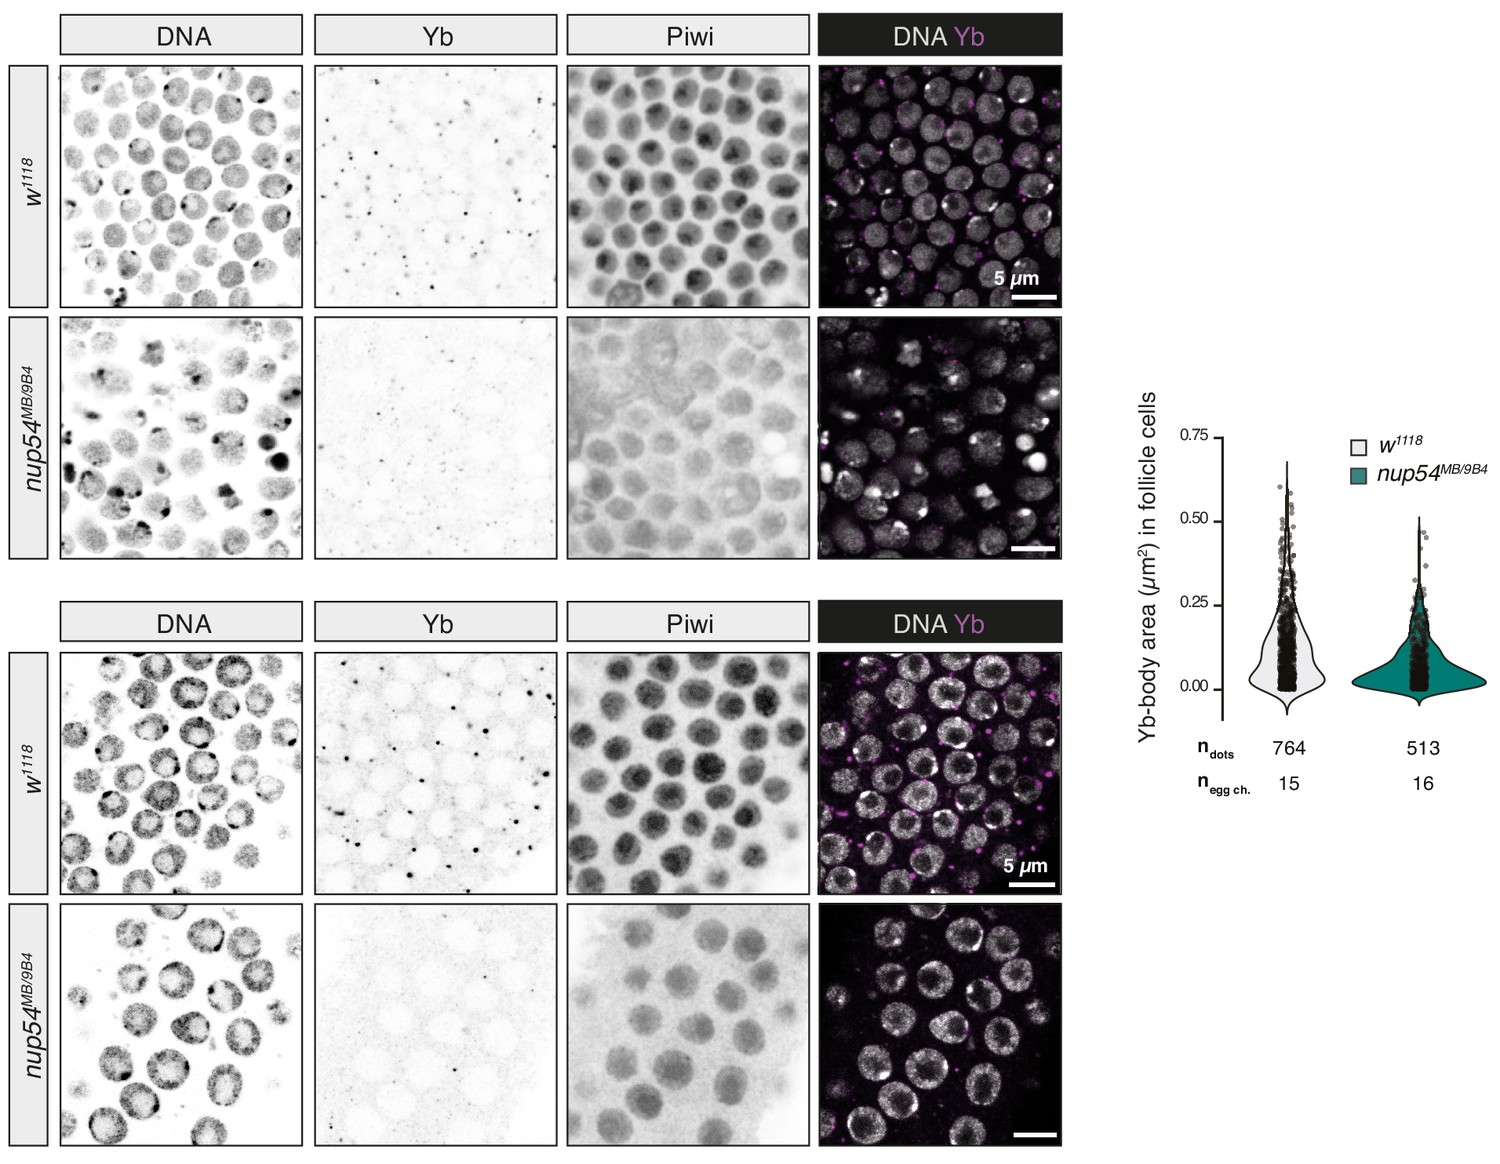
Effect of nup54MB mutants on Yb-body assembly.
Confocal images of Piwi and Yb proteins in ovaries of the indicated genotypes. Quantification of the size of Yb-bodies in the indicated genotypes is shown to the right. ndots = number of Yb-bodies counted; negg ch = number of egg chambers analysed.
Figure 4 with 1 supplement
Nup54 and Nup58 coordinate export and licensing of flam via Nxf1 and Yb.
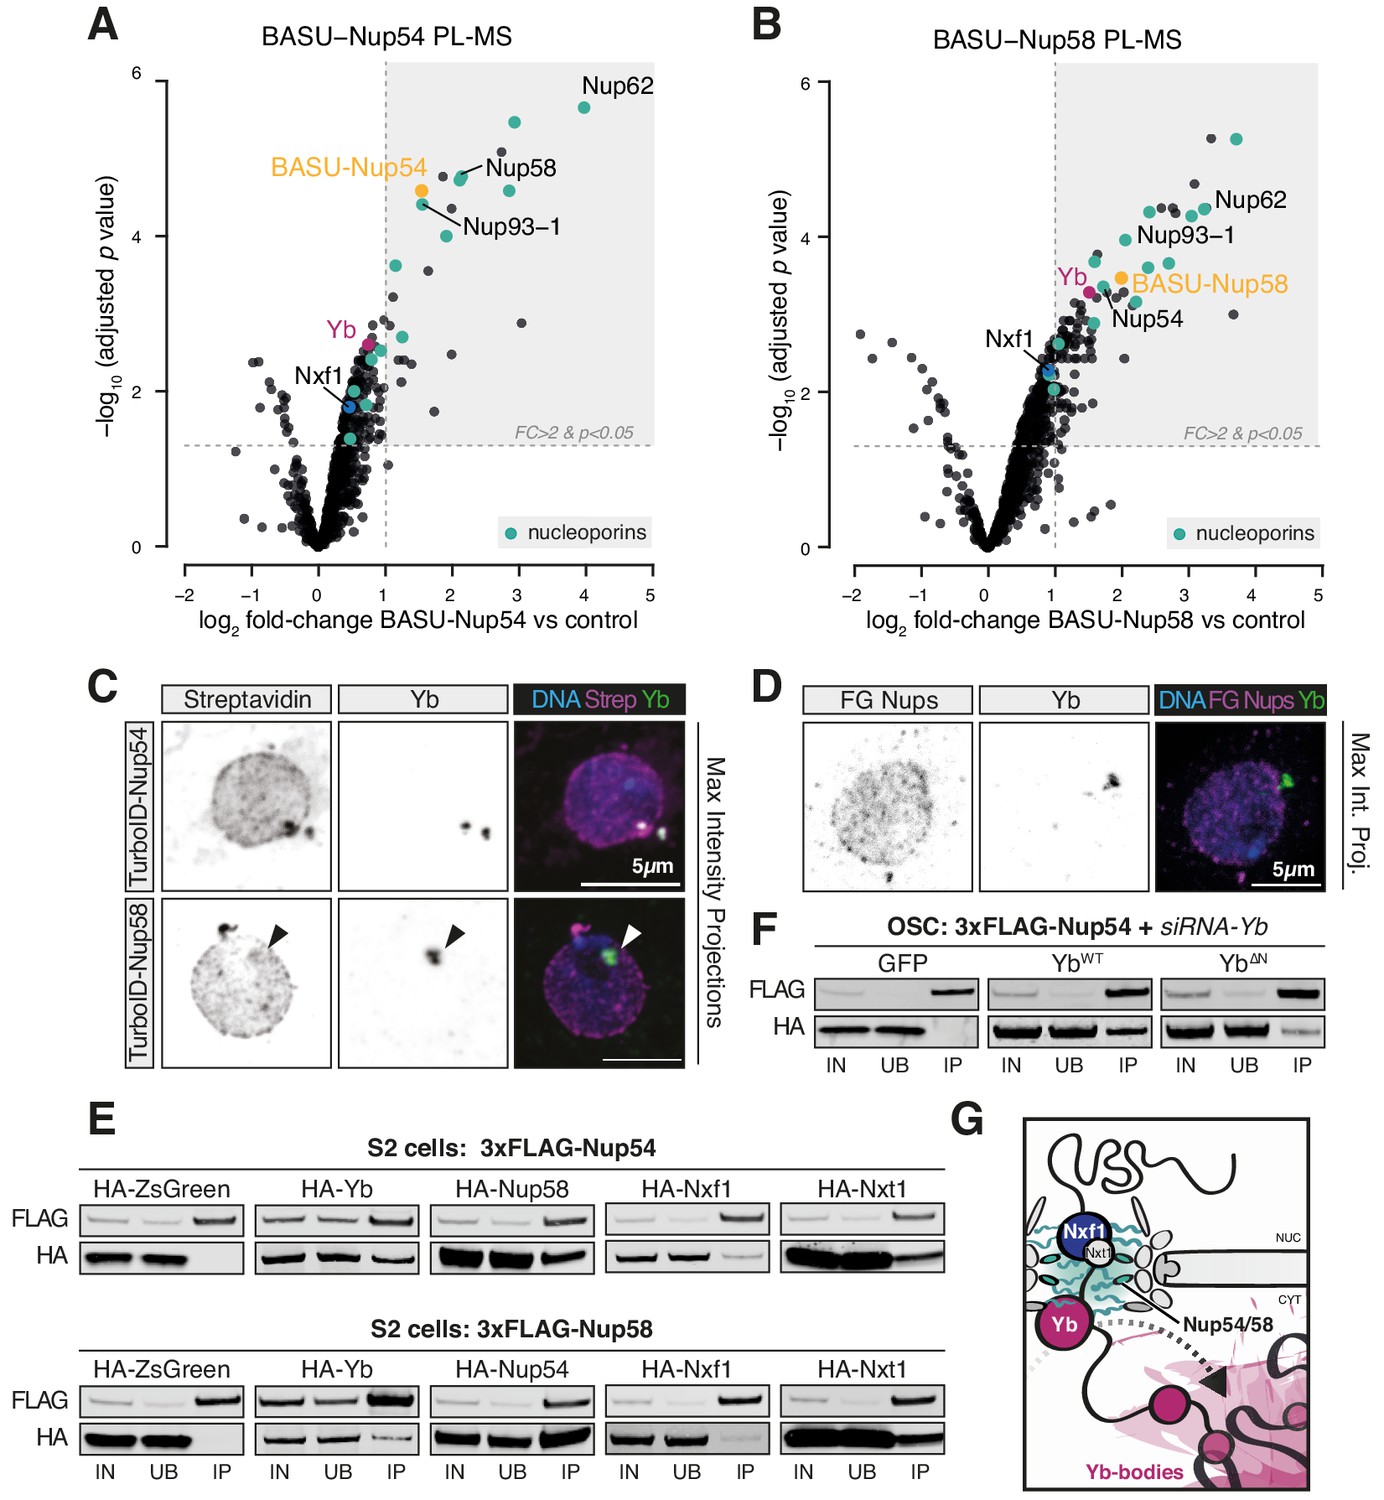
(A, B) Volcano plots showing enrichment and corresponding significance of biotinylated proteins identified via proximity labelling, followed by mass spectrometry (PL-MS) from ovarian somatic cells (OSCs) expressing the indicated constructs against control (n = 3). NPC subunits: green; Yb: magenta; Nxf1: blue; bait protein: yellow. (C, D) Confocal images of Yb protein and TurboID-Nup54/Nup58 or phenylalanine-glycine nucleoporins (FG-Nups) in OSCs. Arrowheads indicate Yb-bodies juxtaposed to Nup foci. (E, F) Western blots of FLAG-tagged co-immunoprecipitates from cells transfected with the indicated constructs and siRNAs. (G) Proposed model of flam export-coupled licensing in OSCs.
-
Figure 4—source data 1
Source data for volcano plot shown in Figure 4A.
- https://cdn.elifesciences.org/articles/66321/elife-66321-fig4-data1-v2.txt
-
Figure 4—source data 2
Source data for volcano plot shown in Figure 4B.
- https://cdn.elifesciences.org/articles/66321/elife-66321-fig4-data2-v2.txt
Figure 4—figure supplement 1
Nup54/Nup58 coordinate flam export and licensing by bridging Nxf1 and Yb.
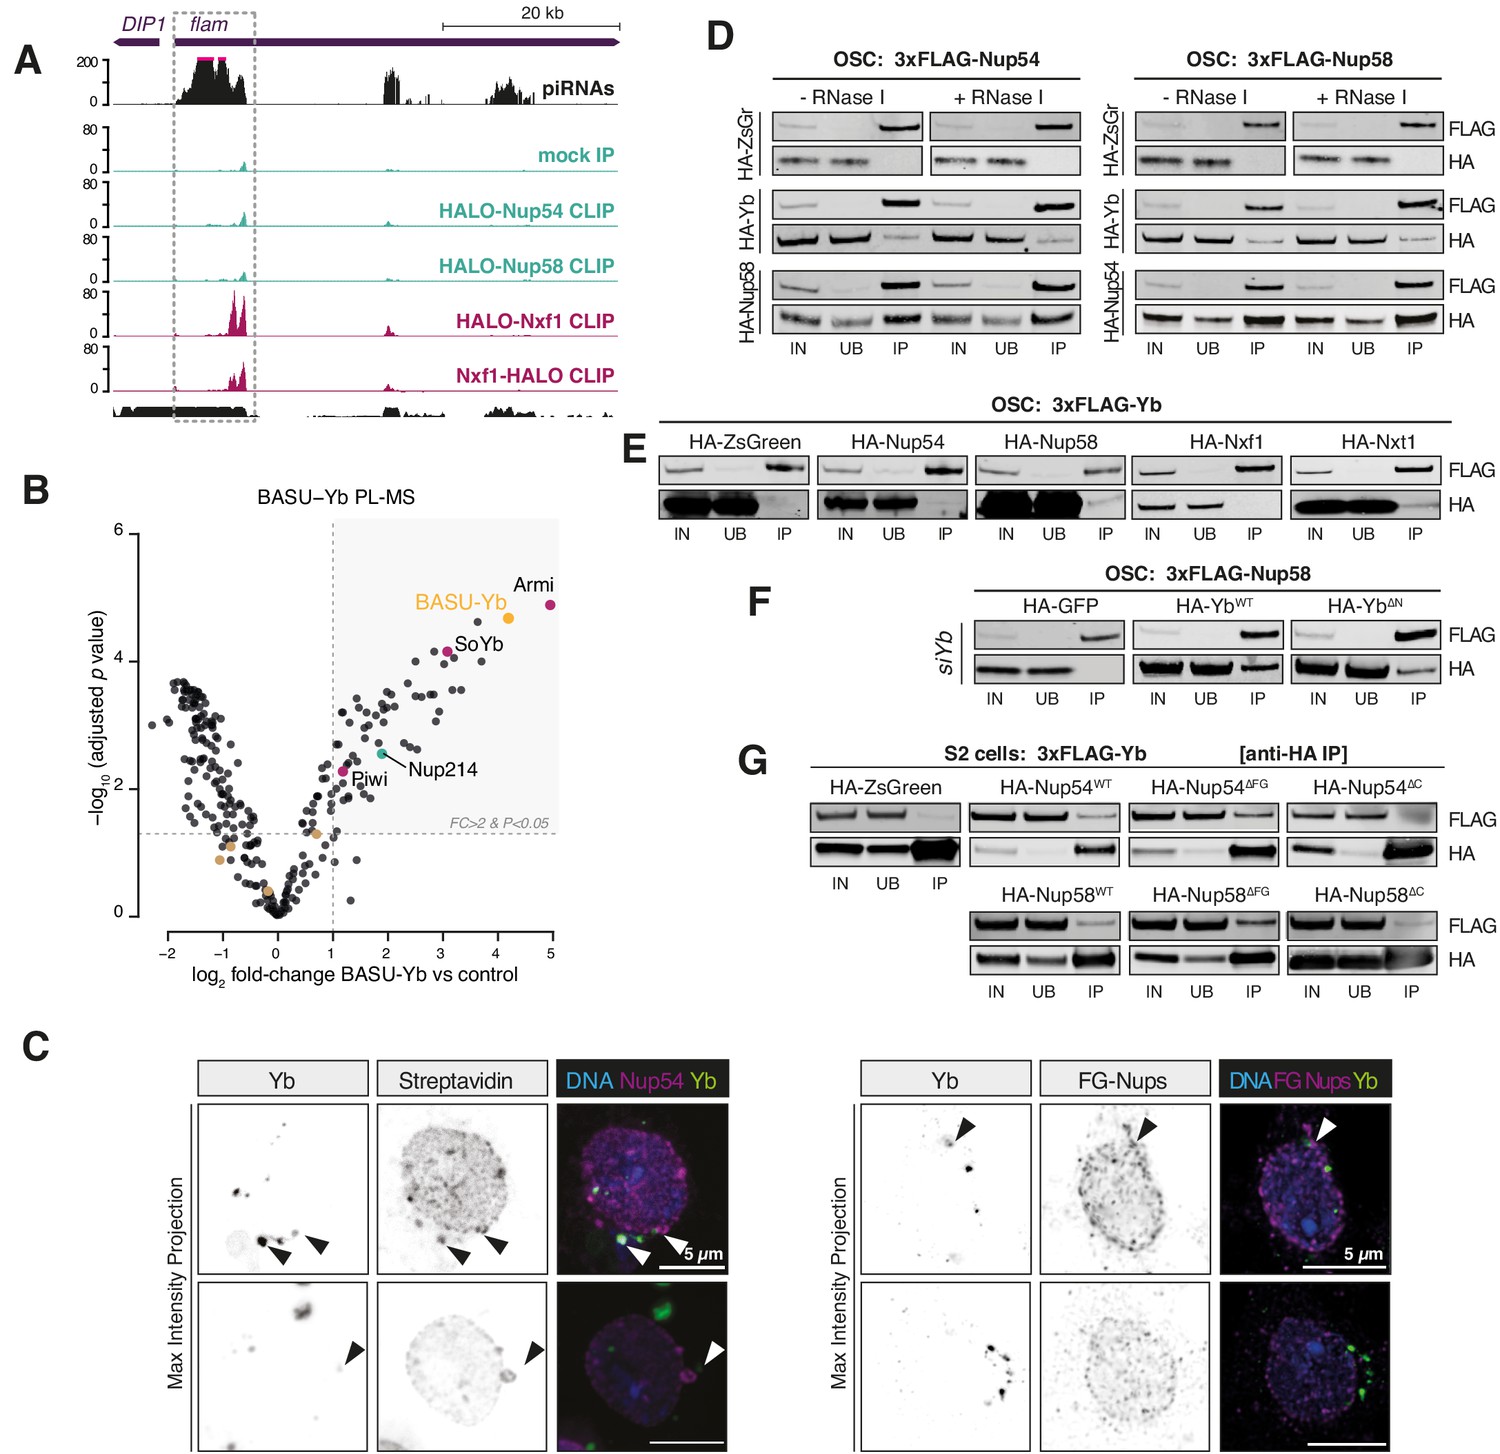
(A) Coverage plot of the indicated CLIP-seq reads over the first 50 kb of the flam locus (n = 3). The mappability for 50 bp reads is shown at the bottom. (B) Volcano plot showing enrichment and corresponding significance of biotinylated proteins identified via proximity labelling, followed by mass spectrometry (PL-MS) from ovarian somatic cells (OSCs) expressing BASU-Yb against control (n = 2). Cytosolic PIWI-interacting RNA (piRNA) pathway factors: magenta; nucleoporins: green; mitochondrial piRNA biogenesis factors: brown; bait protein: yellow. (C) Confocal images of Yb protein and TurboID-Nup54/Nup58 or phenylalanine-glycine nucleoporins (FG-Nups) in OSCs. Arrowheads indicate Yb-bodies juxtaposed to Nup foci. (D–F) Western blots of FLAG-tag co-immunoprecipitates from lysates of cells transfected with the indicated constructs. IN: input; UB: unbound; IP: immunoprecipitate. (G) Western blots of HA-tag co-immunoprecipitates from lysates of cells transfected with the indicated constructs. IN: input; UB: unbound; IP: immunoprecipitate.
-
Figure 4—figure supplement 1—source data 1
Source data for volcano plot shown in Figure 4—figure supplement 1B.
- https://cdn.elifesciences.org/articles/66321/elife-66321-fig4-figsupp1-data1-v2.txt
Tables
Key resources table
| Reagent type (species) or resource | Designation | Source or reference | Identifiers | Additional information |
|---|---|---|---|---|
| Gene (Drosophila melanogaster) | fs(1)Yb | FlyBase | FBgn0000928 | |
| Gene (Drosophila melanogaster) | flamenco | FlyBase | FBgn0267704 | |
| Gene (Drosophila melanogaster) | Nup54 | FlyBase | FBgn0033737 | |
| Gene (Drosophila melanogaster) | Nup58 | FlyBase | FBgn0038722 | |
| Gene (Drosophila melanogaster) | Elys | FlyBase | FBgn0031052 | |
| Gene (Drosophila melanogaster) | Nup43 | FlyBase | FBgn0038609 | |
| Gene (Drosophila melanogaster) | Nup214 | FlyBase | FBgn0010660 | |
| Gene (Drosophila melanogaster) | Nup62 | FlyBase | FBgn0034118 | |
| Gene (Drosophila melanogaster) | Nup93-1 | FlyBase | FBgn0027537 | |
| Gene (Drosophila melanogaster) | Nup98-96 | FlyBase | FBgn0039120 | |
| Gene (Drosophila melanogaster) | Nxf1/Sbr | FlyBase | FBgn0003321 | |
| Gene (Drosophila melanogaster) | Nxt1 | FlyBase | FBgn0028411 | |
| Gene (Drosophila melanogaster) | lamin | FlyBase | FBgn0002525 | |
| Gene (Drosophila melanogaster) | Nup107 | FlyBase | FBgn0027868 | |
| Gene (Drosophila melanogaster) | Nup154 | FlyBase | FBgn0021761 | |
| Gene (Drosophila melanogaster) | Zuc | FlyBase | FBgn0261266 | |
| Gene (Drosophila melanogaster) | tj | FlyBase | FBgn0000964 | |
| Antibody | Anti-Piwi (Rabbit polyclonal) | DOI:10.1016/j.cell.2007.01.043 | IF(1:500) WB(1:5000) | |
| Antibody | Anti-Yb (Mouse monoclonal) | DOI:10.1101/gad.1989510 | IF(1:500) WB(1:1000) | |
| Antibody | Anti-Yb (Rabbit polyclonal) | DOI:10.1038/emboj.2011.308 | WB(1:1000) | |
| Antibody | Anti-tubulin (Rabbit polyclonal) | Abcam | Cat# ab18251, RRID:AB_2210057 | WB(1:5000) |
| Antibody | Anti-HA (Rabbit monoclonal) | Cell Signaling Technology | Cat# 3724, RRID:AB_1549585 | WB(1:1000) |
| Antibody | Anti-HA (Rabbit polyclonal) | Abcam | Cat# ab9110, RRID:AB_307019 | WB(1:1000) |
| Antibody | Anti-FLAG (Mouse monoclonal) | Sigma | Cat# F1804, RRID:AB_262044 | WB(1:1000) |
| Antibody | Anti-lamin (Mouse monoclonal) | Developmental Studies Hybridoma Bank | Cat# adl67.10, RRID:AB_528336 | IF(1:200) |
| Antibody | Anti-Nuclear Pore Complex Proteins (Mouse monoclonal) | Biolegend | Cat# 902907, RRID:AB_2565026 | IF(1:500) |
| Antibody | Anti-Mouse IgG Alexa Fluor-488 (Goat polyclonal) | Thermo Fisher Scientific | Cat# A-11029, RRID:AB_2534088 | IF(1:500) |
| Antibody | Anti-Rabbit IgG Alexa Fluor-647 (Goat polyclonal) | Thermo Fisher Scientific | Cat# A-21245, RRID:AB_2535813 | IF(1:500) |
| Antibody | GFP-Booster Atto-488 (Alpaca monoclonal) | Chromotek | Cat# gba488-100, RRID:AB_2631386 | IF(1:500) |
| Commercial assay or kit | IRDye 800CW Streptavidin | LI-COR | Cat# 926-32230 | WB(1:4000) |
| Commercial assay or kit | Streptavidin, Alexa Fluor 555 Conjugate | Thermo Fisher Scientific | Cat# S-21381 | IF(1:500) |
| Commercial assay or kit | Mouse monoclonal anti-FLAG M2 magnetic beads | Sigma-Aldrich | Cat# CatM8823, RRID:AB_2637089 | |
| Commercial assay or kit | Dynabeads MyOne Streptavidin C1 | Thermo Fisher Scientific | Cat# 65001 | |
| Commercial assay or kit | Pierce IP Lysis Buffer-100 ml | Thermo Fisher Scientific | Cat# 87787 | |
| Commercial assay or kit | RIPA Lysis and Extraction Buffer | Thermo Fisher Scientific | Cat# 89901 | |
| Commercial assay or kit | Thermo Scientific Pierce anti-HA magnetic beads | Thermo Fisher Scientific | Cat# 88836 | |
| Commercial assay or kit | cOmplete, Mini, EDTA-free Protease Inhibitor Cocktail | Sigma-Aldrich | Cat# 11836170001 | |
| Commercial assay or kit | RNasin Plus RNase Inhibitor | Promega | Cat# N2615 | |
| Commercial assay or kit | Effectene Transfection Reagent | Qiagen | Cat# 301427 | |
| Commercial assay or kit | Nucleofector Kit V | Lonza | Cat# VVCA-1003 | |
| Commercial assay or kit | DNase I, Amplification Grade | Thermo Fisher Scientific | Cat# 18068015 | |
| Commercial assay or kit | RNaseOUT Recombinant Ribonuclease Inhibitor | Thermo Fisher Scientific | Cat# 10777019 | |
| Commercial assay or kit | Magne HaloTag Beads,20% Slurry | Promega | Cat# G7282 | |
| Commercial assay or kit | Deoxynucleotide Solution Set (100 mM; 25 μmol each) | New England Biolabs | Cat# N0446S | |
| Commercial assay or kit | SuperScript III Reverse Transcriptase | Thermo Fisher Scientific | Cat# 18080085 | |
| Commercial assay or kit | Chloroform anhydrous 99+% | Sigma-Aldrich | Cat# 288306 | |
| Commercial assay or kit | TRIzol Reagent | Thermo Fisher Scientific | Cat# 15596026 | |
| Commercial assay or kit | Insulin solution human | Sigma-Aldrich | Cat# I9278 | |
| Commercial assay or kit | Fibronectin from human plasma 0.1% solution | Sigma-Aldrich | Cat# F0895 | |
| Commercial assay or kit | ProLong Diamond Antifade Mountant | Thermo Fisher Scientific | Cat# P36961 | |
| Commercial assay or kit | Fly Extract | Drosophila Genomics Resource Center | Cat# 1645670 | |
| Commercial assay or kit | SMARTer RNA Unique Dual Index Kit – 24U | Clontech | Cat# 634451 | |
| Commercial assay or kit | RiboPOOL 10 nM for Drosophila | Cambridge Bioscience | ||
| Commercial assay or kit | D-Biotin solution | Thermo Fisher Scientific | Cat# B20656 | |
| Commercial assay or kit | Shields and Sang M3 Insect Medium | Sigma | Cat# S3652 | |
| Commercial assay or kit | Library Quantification Kit | Kapa Biosystems | Cat# KK4873 | |
| Commercial assay or kit | ProTEV Plus | Promega | Cat# V6101 | |
| Commercial assay or kit | Paraformaldehyde, 16% w/v aq. soln., methanol free | Alfa Aesar | Cat# 043368.9M | |
| Commercial assay or kit | RNase A (affinity purified)1 mg/ml | Thermo Fisher Scientific | Cat# AM2271 | |
| Commercial assay or kit | NuPAGE 4–12%, Bis-Tris,1.5 mm, Mini Protein Gel, 10-well | Thermo Fisher Scientific | Cat# NP0335BOX | |
| Commercial assay or kit | Xfect Transfection Reagent | Takara Bio | Cat# 631318 | |
| Commercial assay or kit | Pierce Protein A/G Magnetic Beads | Thermo Fisher Scientific | Cat# 88802 | |
| Commercial assay or kit | Agencourt RNAClean XP beads | Beckman Coulter | Cat# A63987 | |
| Commercial assay or kit | NEBNext Ultra Directional RNA Library Prep Kit for Illumina | New England Biolabs | Cat# E7420L | |
| Commercial assay or kit | SMARTer Stranded RNA-Seq Kit | Takara Bio | Cat# 634839 | |
| Commercial assay or kit | RNeasy Mini Kit | Qiagen | Cat# 74104 | |
| Commercial assay or kit | Cell Line Nucleofector kit V | Lonza | Cat# VVCA-1003 | |
| Commercial assay or kit | Nucleofector II device | Lonza | Cat# AAB-1001 | |
| Cell line (Drosophila melanogaster) | S2 cells | Thermo Fisher Scientific | Cat# R69007, RRID:CVCL_Z232 | |
| Cell line (Drosophila melanogaster) | Ovarian somatic cells (OSCs) | DOI:10.1038/nature08501 | RRID:CVCL_IY73 | |
| Software, algorithm | Fiji | ImageJ | RRID:SCR_002285 | |
| Software, algorithm | Proteome Discoverer 2.1 | Thermo Fisher Scientific | RRID:SCR_014477 | |
| Software, algorithm | STAR | DOI:10.1093/bioinformatics/bts635 | RRID:SCR_015899 | |
| Software, algorithm | DEseq2 | DOI:10.1186/s13059-014-0550-8 | RRID:SCR_015687 | |
| Software, algorithm | Image Studio Lite | LI-COR | RRID:SCR_013715 |
Additional files
-
Source code 1
Custom script for Yb-bodies analysis in Fiji.
- https://cdn.elifesciences.org/articles/66321/elife-66321-code1-v2.zip
-
Source code 2
Custom script for flam RNA-FISH analysis in Fiji.
- https://cdn.elifesciences.org/articles/66321/elife-66321-code2-v2.zip
-
Supplementary file 1
List of siRNA sequences, qPCR primers, and fly stocks used in this study.
- https://cdn.elifesciences.org/articles/66321/elife-66321-supp1-v2.xlsx
-
Transparent reporting form
- https://cdn.elifesciences.org/articles/66321/elife-66321-transrepform-v2.pdf
Download links
A two-part list of links to download the article, or parts of the article, in various formats.
Downloads (link to download the article as PDF)
Open citations (links to open the citations from this article in various online reference manager services)
Cite this article (links to download the citations from this article in formats compatible with various reference manager tools)
Channel nuclear pore complex subunits are required for transposon silencing in Drosophila
eLife 10:e66321.
https://doi.org/10.7554/eLife.66321


