Topoisomerase VI is a chirally-selective, preferential DNA decatenase
- Laboratory of Single Molecule Biophysics, National Heart, Lung and Blood Institute, National Institutes of Health, United States
- Department of Biochemistry and Metabolism, John Innes Centre, United Kingdom
Figures
Figure 1
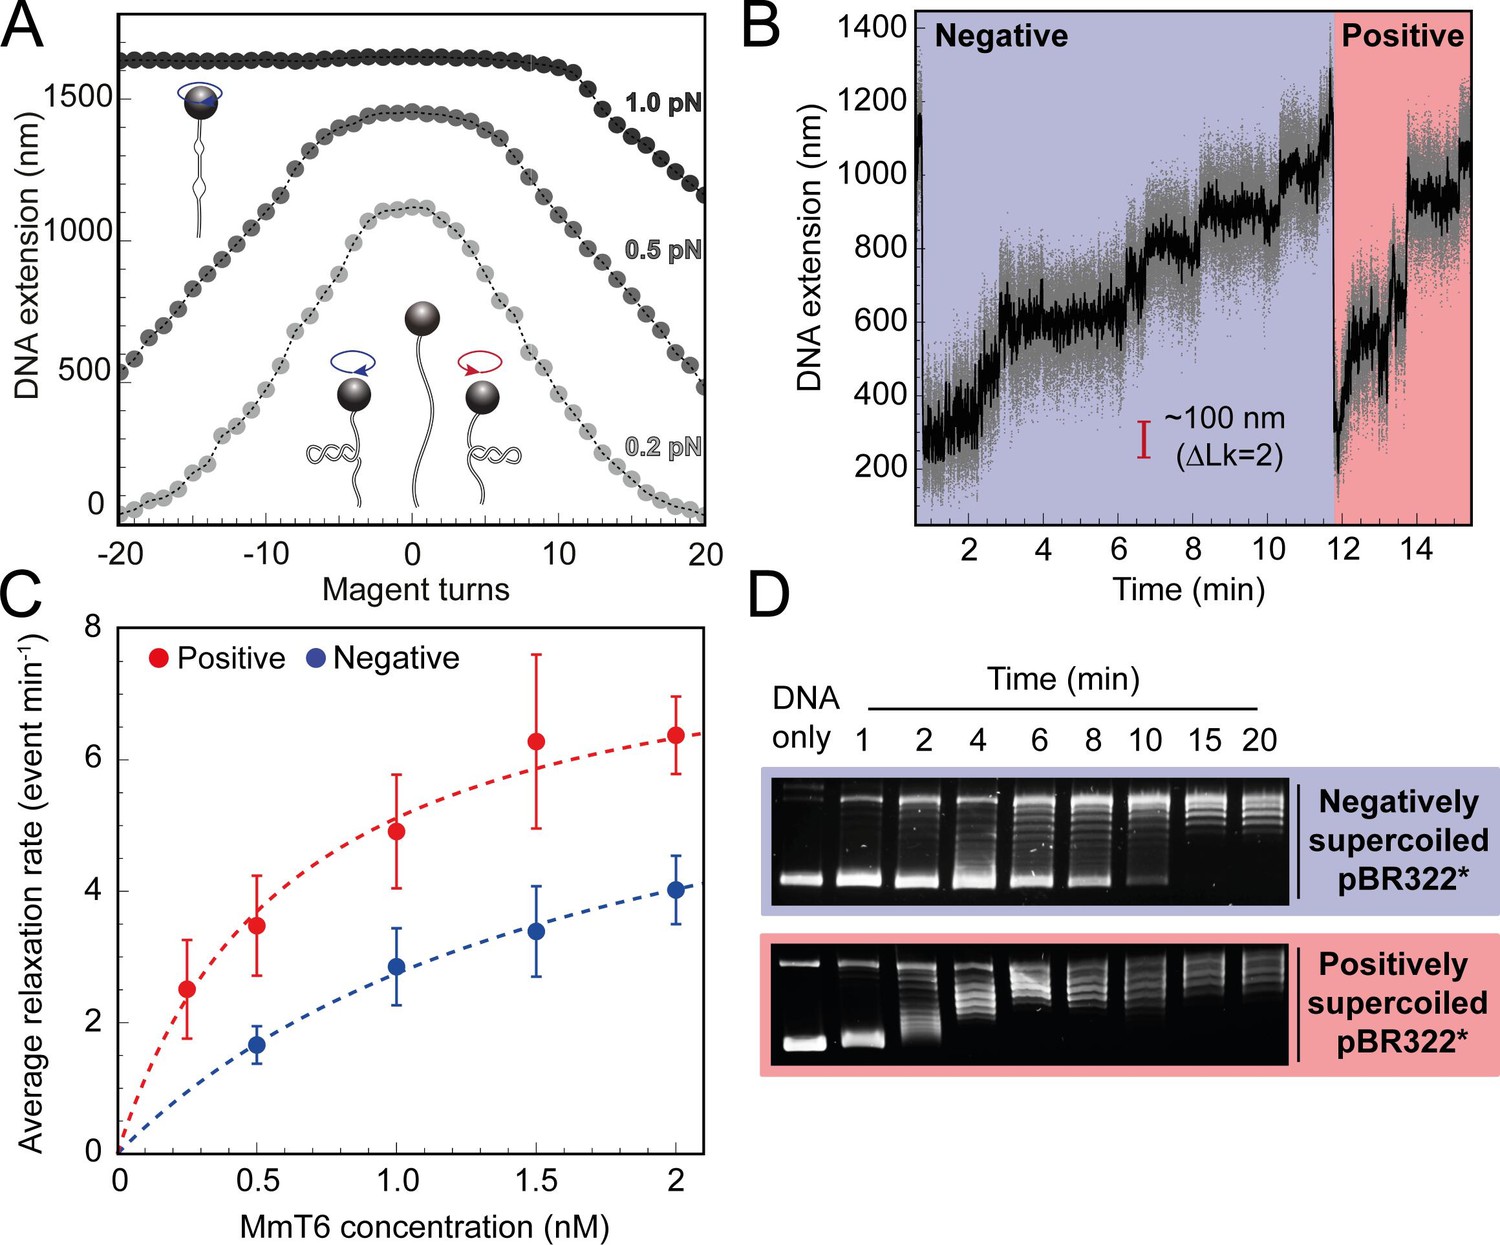
Topo VI relaxation rate depends on the chirality of DNA supercoiling.
(A) Magnetic tweezers calibration curves for a 5 kb DNA duplex supercoiled under low (0.2 pN), medium (0.5 pN) and high (1.0 pN) force. DNA extension is plotted as a function of magnet turns. Negative magnet turn values represent the clockwise rotation of the magnets which produces negative, or right-handed DNA crossings. Positive, or left-handed crossings are produced by rotating the magnets anticlockwise. At high force, clockwise rotation promotes DNA melting, rather than negative supercoiling, hence the DNA extension is insensitive to magnet rotation. (B) Example trace of topo VI-dependent supercoil relaxation. Data collected at a force of 0.4 pN, at 21 °C, using 0.5 nM topo VI and 1 mM ATP. Each strand-passage event is evident as an abrupt DNA extension increase of ~100 nm, corresponding to a ΔLk of 2. Relaxation of negative supercoils is highlighted in blue, and positive in red. Positive supercoils are relaxed faster, resulting in short events ( < 1 min) being compressed when plotted on the same axis as negative supercoil relaxation. Data collected at 200 Hz (grey dots) and plotted with a 1 s Savitzky–Golay smoothing filter (black line). (C) Average relaxation rate of topo VI (± SEM) on positive (N tethers across all data points = 40) and negative (N tethers across all data points = 42) supercoils as a function of topo VI concentration (0.25–2 nM), collected at a force of 0.4 pN, at 21 °C. Data were fitted to a Michaelis-Menten-like function (). Raw data were analysed in IgorPro 7 (WaveMetrics) using a T-test based method, first described in Seol et al., 2016. (D) Agarose gel-based supercoil-relaxation time course. Negatively or positively supercoiled pBR322* was incubated at 21 °C, with 20 nM topo VI and the reaction was stopped at consecutive time points using 50 mM EDTA. Samples were run on a 1% (w/v) native agarose gel for 15 hr at ~2 Vcm–1, stained with 0.5 μg/mL ethidium bromide and imaged under UV illumination.
-
Figure 1—source data 1
Source data is in the file Figure 1.
- https://cdn.elifesciences.org/articles/67021/elife-67021-fig1-data1-v2.csv
Figure 2
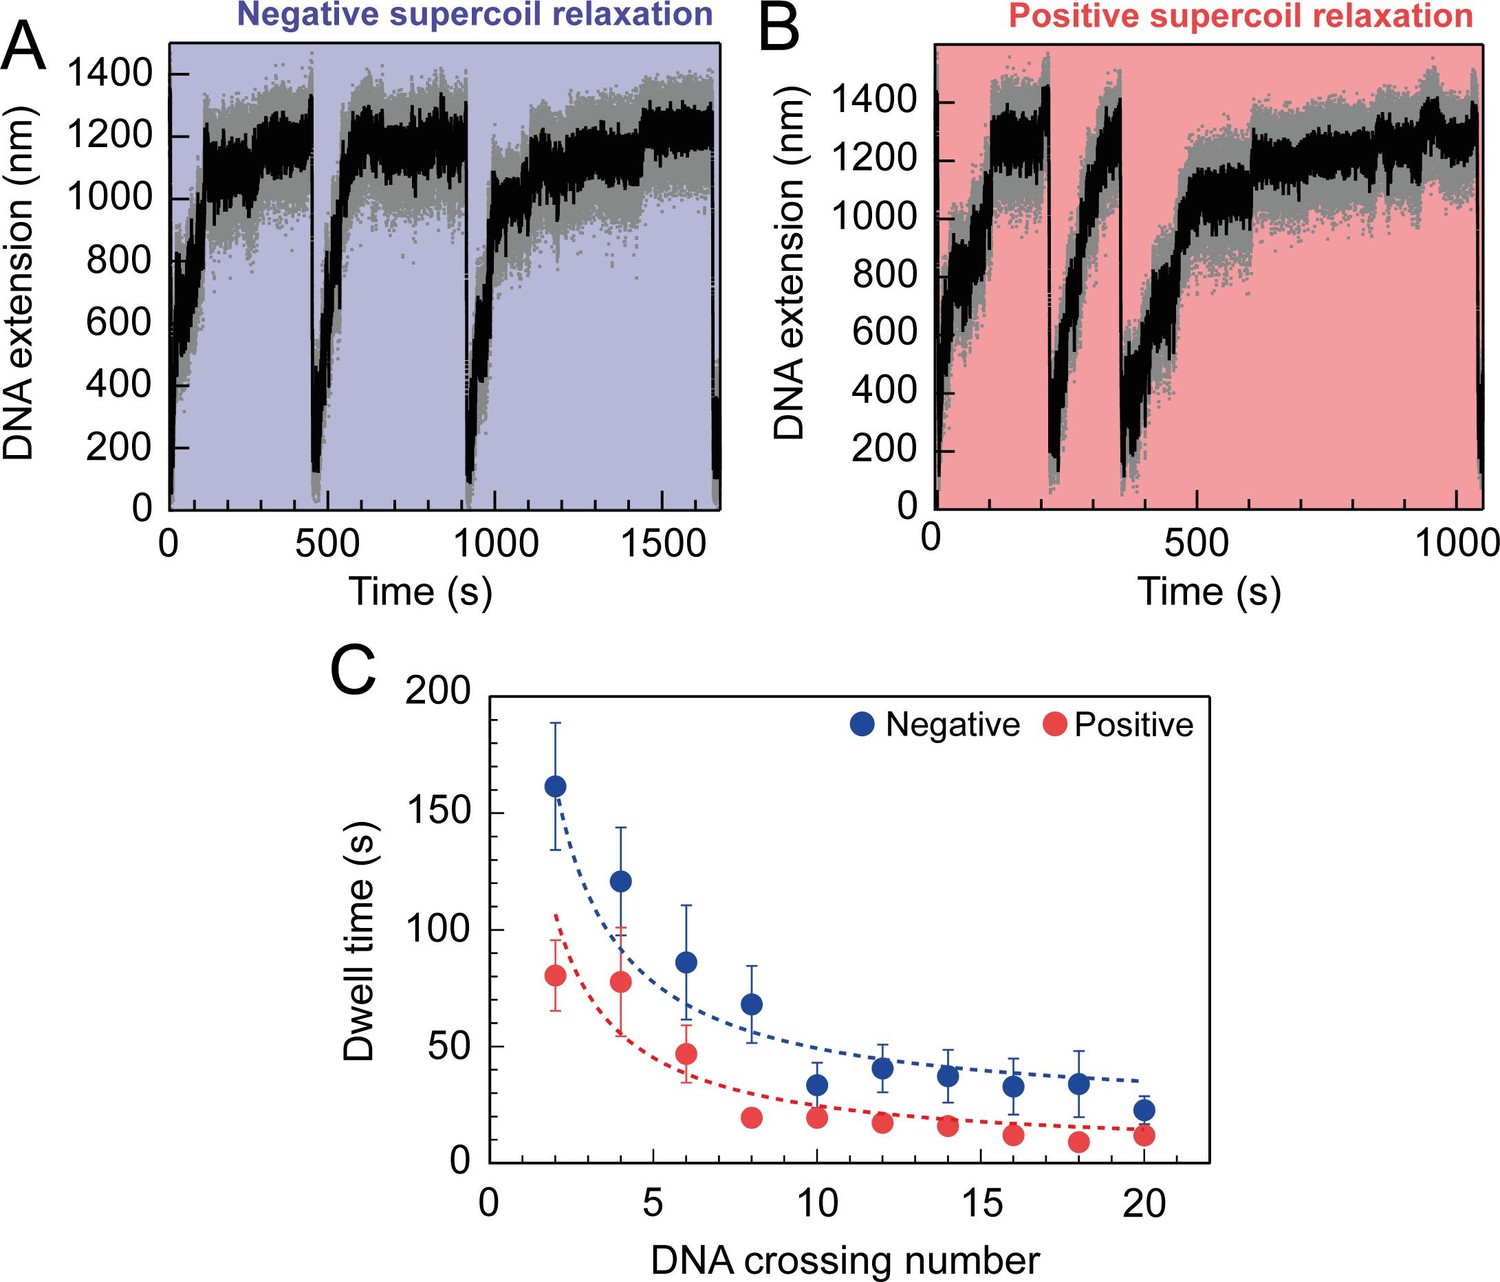
Topo VI relaxation rate depend on the level of DNA supercoiling.
(A) An example trace of 0.75 nM topo VI fully relaxing negative supercoils in a 5 kb DNA duplex at a force of 0.4 pN, at 21 °C. DNA extension is plotted against time. The abrupt decreases in extension correspond to rapid DNA supercoiling by rotating the magnets. The slower DNA extension increases correspond to topo VI-dependent supercoil relaxation activity. Data collected at 200 Hz (grey dots) and with a 1-second Savitzky–Golay smoothing filter (black line)( B) same as in A, aside from the DNA being positively supercoiled. (C) Dwell time (± SEM) between topo VI-dependent strand-passage events on positive (N dwell times across all data points = 212) and negative (N dwell times across all data points = 146) supercoils, plotted against the level of DNA supercoiling. Data were fitted to an inverse function, where the time taken for topo VI to perform a strand-passage reaction is inversely proportional to the number of DNA crossings present in the substrate. Raw data (A and B) were analysed in IgorPro 7 (WaveMentrics) using a T-test based method, first described in Seol et al., 2016.
-
Figure 2—source data 1
Source data is in the file Figure 2.
- https://cdn.elifesciences.org/articles/67021/elife-67021-fig2-data1-v2.csv
Figure 3 with 1 supplement
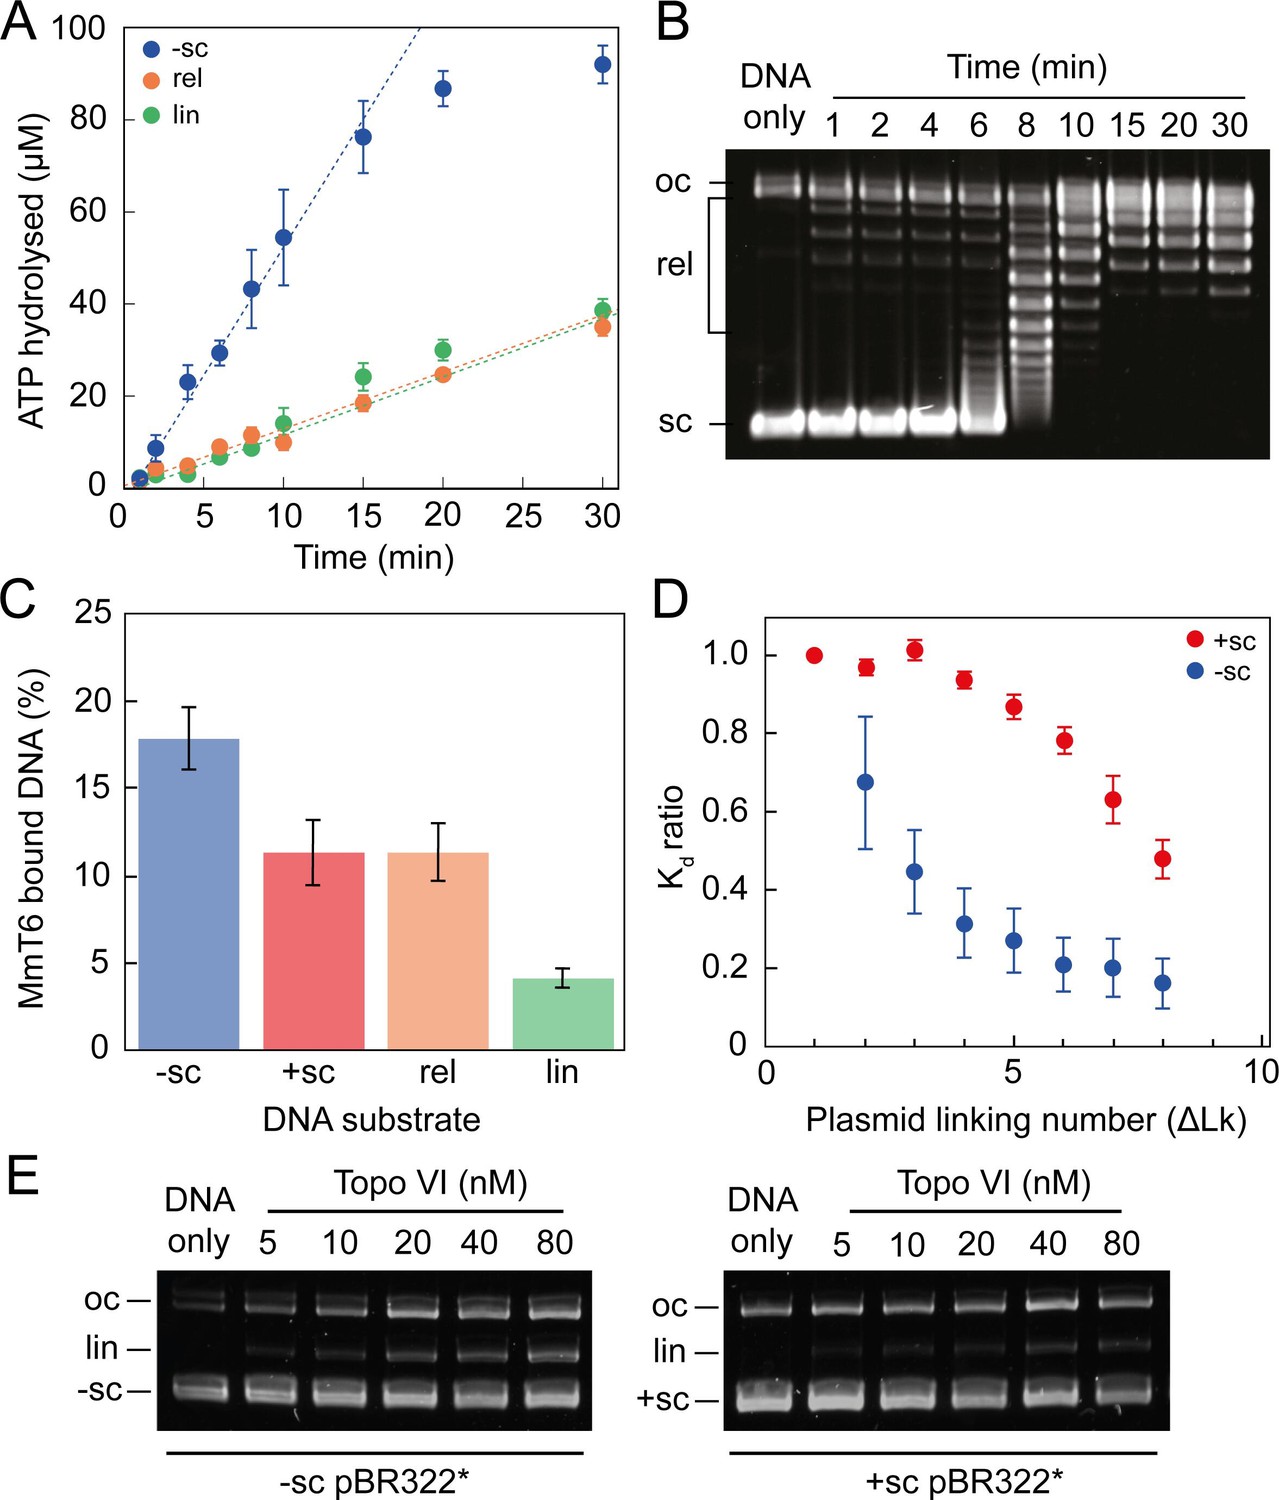
ATPase activity and DNA binding of topo VI are stimulated by supercoiled DNA.
(A) The ATPase activity of topo VI over time, measured using radioactive ATP. Assays were performed at 21 °C, using 1 μM topo VI, 430 nM pBR322* that was negatively-supercoiled (blue), linear (green), or relaxed (orange), and 450 μM [γ-32]-ATP. (B) Agarose-gel based relaxation time course performed under the same conditions as A, using the same topo VI:DNA ratio (1:2.3), but with non-radioactive ATP. In A, the ATPase rate on supercoiled DNA plateaus around 15 min, which corresponds to the DNA being fully relaxed by topo VI, as shown in B. Samples were run on a 1% (w/v) native agarose gel for 15 hr at ~2 Vcm–1, stained with 0.5 μg/mL ethidium bromide and imaged under UV illumination. (C) The ATP-independent DNA binding activity of topo VI, measured using a nitrocellulose membrane capture technique, with either negatively-supercoiled (-sc), positively-supercoiled (+ sc), relaxed (rel) or linearised (lin) pBR322* (± SEM). DNA concentrations measured using A260. (D) The ATP-independent DNA binding activity of topo VI, on either positively- (red) or negatively-supercoiled (blue) topoisomers of pBR322* measured using a nitrocellulose membrane capture technique. Bound and unbound DNA samples were run on a 1% (w/v) native agarose gel for 15 hr at ~2 Vcm–1, stained with 0.5 μg/mL ethidium bromide and imaged under UV illumination. The intensity of the bands were measured using ImageJ and the relative dissociation constants (Kd± SEM) for each topoisomer calculated as described in Litwin et al., 2015. (E) DNA cleavage activity of topo VI using negatively- and positively-supercoiled pBR322*. Topo VI concentration was varied from 5 to 80 nM and incubated with 4 nM pBR322*, 1 mM ADPNP, 10 mM MgCl2, at 37 °C for 30 min. All samples were treated with 1 mg/mL proteinase K and 0.2% SDS, then run on a 1% (w/v) native agarose gel for 10 hr at ~2 Vcm–1, stained with 0.5 μg/mL ethidium bromide and imaged under UV illumination.
-
Figure 3—source data 1
Source data is in the file Figure 3.
- https://cdn.elifesciences.org/articles/67021/elife-67021-fig3-data1-v2.csv
Figure 3—figure supplement 1
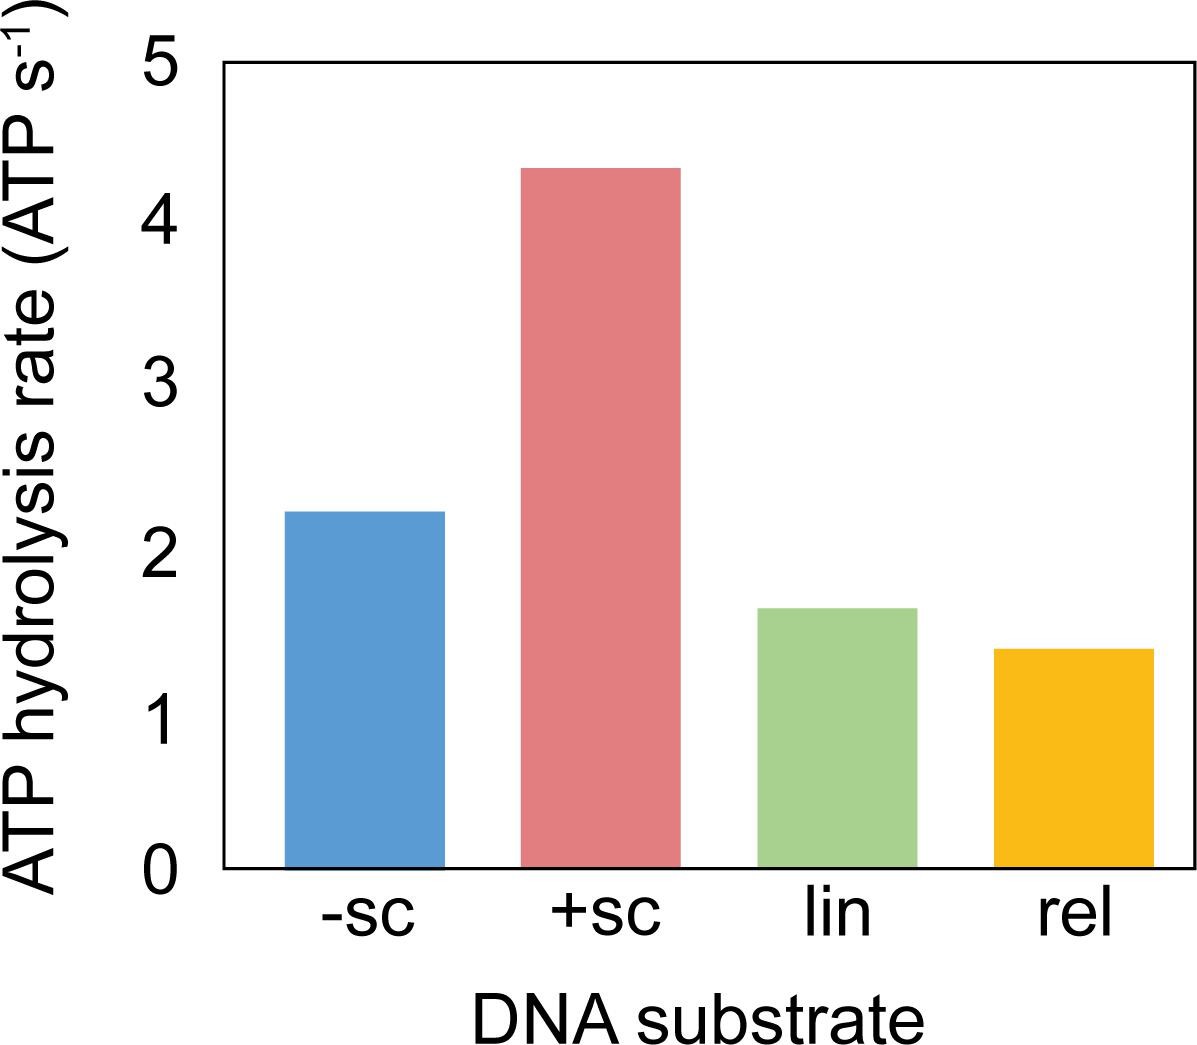
ATPase activity of M. mazei topo VI with different DNA species.
ATPase rates were measured using a PK/LDH linked assay (Feng et al., 2021) with 1.2 µM topo VI in the presence of 177 nM DNA at 37 °C.
-
Figure 3—figure supplement 1—source data 1
Source data is in the file Figure 3—figure supplement 1.
- https://cdn.elifesciences.org/articles/67021/elife-67021-fig3-figsupp1-data1-v2.csv
Figure 4 with 3 supplements
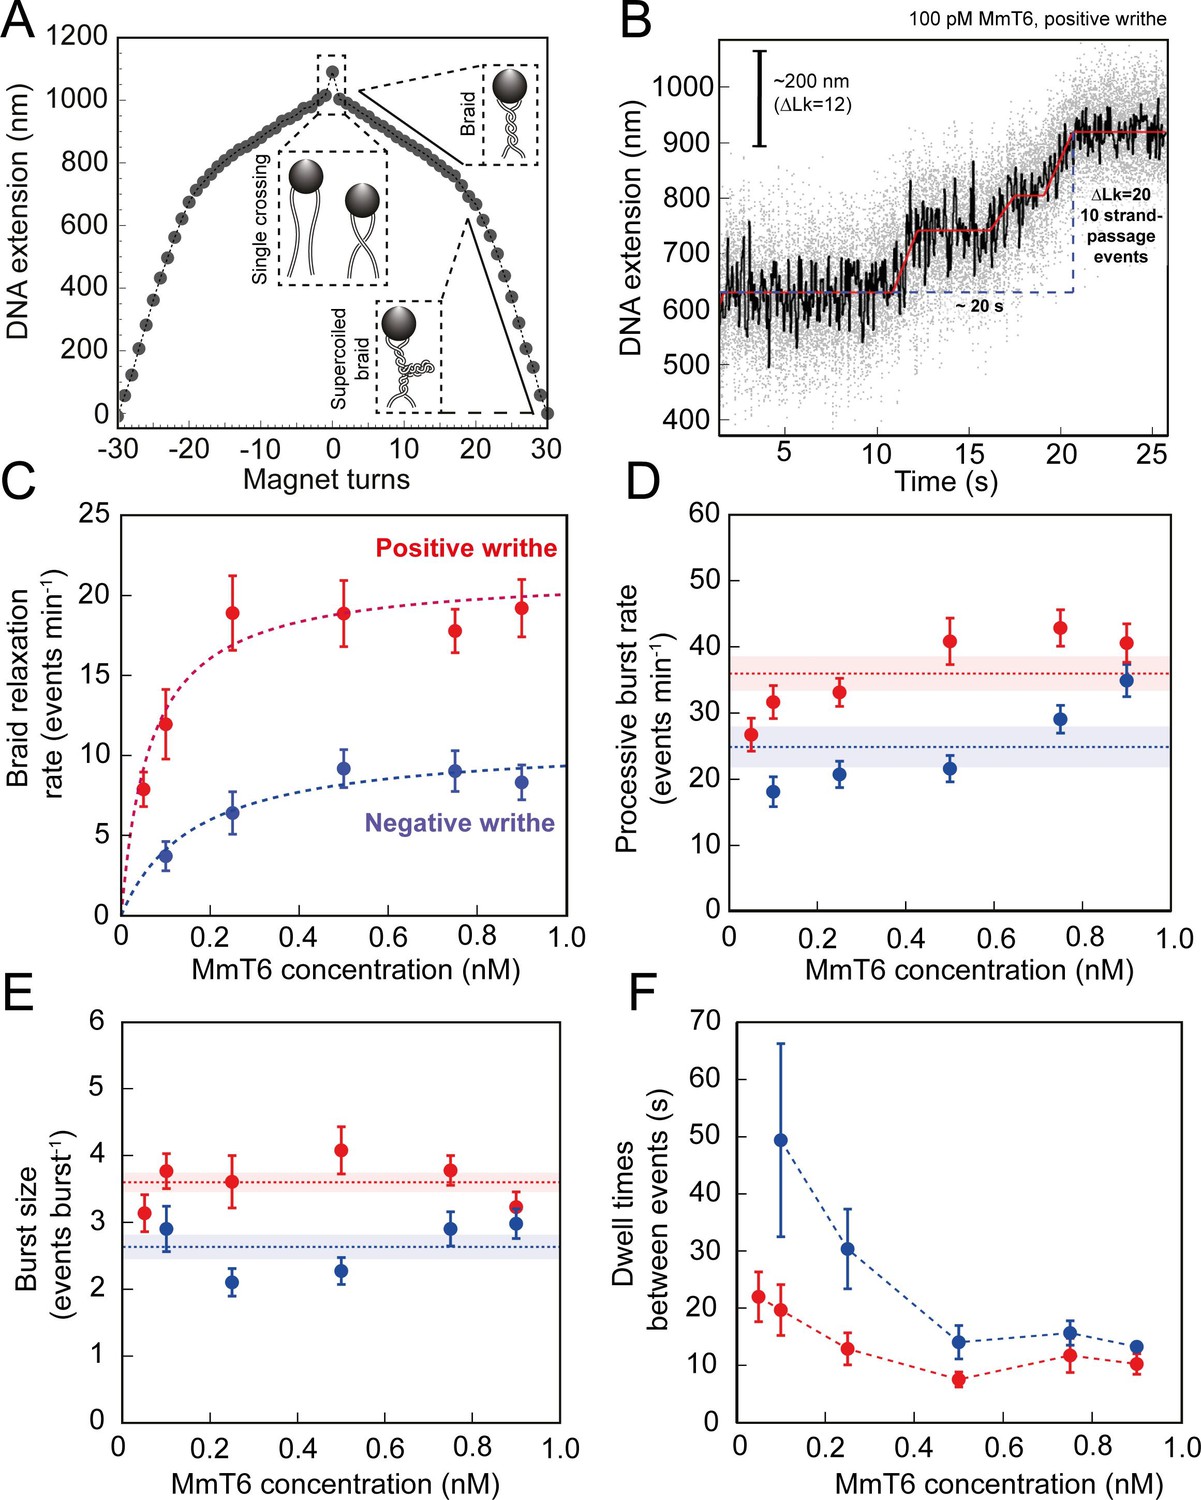
Topo VI activity on braided DNA substrates.
(A) Calibration curve for a DNA braid formed from two 5 kb DNA duplexes tethered to a single magnetic bead. DNA extension is plotted as a function of magnet turns. Negative magnet-turn values represent the right-handed rotation of the magnets producing negative writhe, and positive magnet-turn values represent the generation of positive writhe via left-handed magnet rotation. (Note: this is the reverse scenario of forming a plectoneme, see Figure 1A). The first positive or negative 360° turn results in a sharp decrease in DNA extension as a single crossing is input. This is followed by a gradual decrease in extension with rotation, representing the formation of a DNA braid. At a critical number of turns, the braid buckles upon itself to form a supercoiled braid, which is evident in the graph as a switch to a steeper gradient. (B) An example of raw magnetic tweezers data, showing topo VI relaxation activity on a DNA braid with positive chirality. Data collected at a force of 0.5 pN, at 21 °C, using 0.1 nM topo VI and 1 mM ATP. Scale bar (black) represents ΔLk of 12, which corresponds to a change in DNA extension of 200 nm. A total of 10 DNA crossings are relaxed by topo VI in ~20 s (blue dashed line), measured as the time between the imposition and complete relaxation of the braids. Data collected at 200 Hz (grey dots) and plotted with a 1 second Savitzky–Golay smoothing filter (black line) and the T-test fit in red (Seol et al., 2016). Additional examples of braid relaxation data and the T-test fits are provided in Figure 4—figure supplement 1. (C) The average rate of topo VI braid unlinking activity (± SEM), of both positive (N tethers across all data points = 92) and negative (N tethers across all data points = 55) braids, measured as the number of strand-passage events/min and plotted as a function of topo VI concentration (0.05–0.9 nM). Data were fitted to a Michaelis-Menten-like function (). (D) The processive burst rate of topo VI (± SEM) on both positive (N burst events across all data points = 206) and negative (N burst events across all data points = 104) braids, measured as the average number of events min–1 in a burst, and plotted as a function of topo VI concentration. A burst is defined as rapid topo VI activity corresponding to the passage of two or more consecutive T-segments in which individual strand-passage events cannot be discerned by the step-finder. Any single strand-passage events detected were omitted from the average. The horizontal dashed lines represent the average processive burst rate (± SEM) across all concentrations of topo VI assayed. (E) The average burst size of topo VI (± SEM) on both positive (N burst events across all data points = 217) and negative (N burst events across all data points = 132) braids, measured as the average number of strand-passage events per burst, plotted as a function of topo VI concentration. Single passage events were included in the average burst size. The horizontal dashed lines represent the average processive burst size (± SEM) across all concentrations of topo VI assayed. (F) The dwell times between processive bursts of topo VI activity on both positive (N dwell times across all data points = 156) and negative (N dwell times across all data points = 119) braids, plotted as a function of topo VI concentration. A dwell time is defined as a period of time in which the DNA extension remains constant, reflecting lack of topo VI-dependent braid unlinking activity. In C-F, data was collected at a force of 0.5 pN, at 21 °C, using 1 mM ATP, with topo VI activity on positive DNA braids in red, and in blue for negative DNA braids. Raw data were analysed in IgorPro 7 (WaveMentrics) using a T-test-based method, first described in Seol et al., 2016. Figure 4—figure supplement 2 provides a comparison between the analysis of the experimental braid relaxation data and the analysis of simulated purely distributive braid relaxation data. Figure 4—figure supplement 3 provides examples of the t-test based fitting of the simulated data sets.
-
Figure 4—source data 1
Source data is in the file Figure 4.
- https://cdn.elifesciences.org/articles/67021/elife-67021-fig4-data1-v2.csv
Figure 4—figure supplement 1
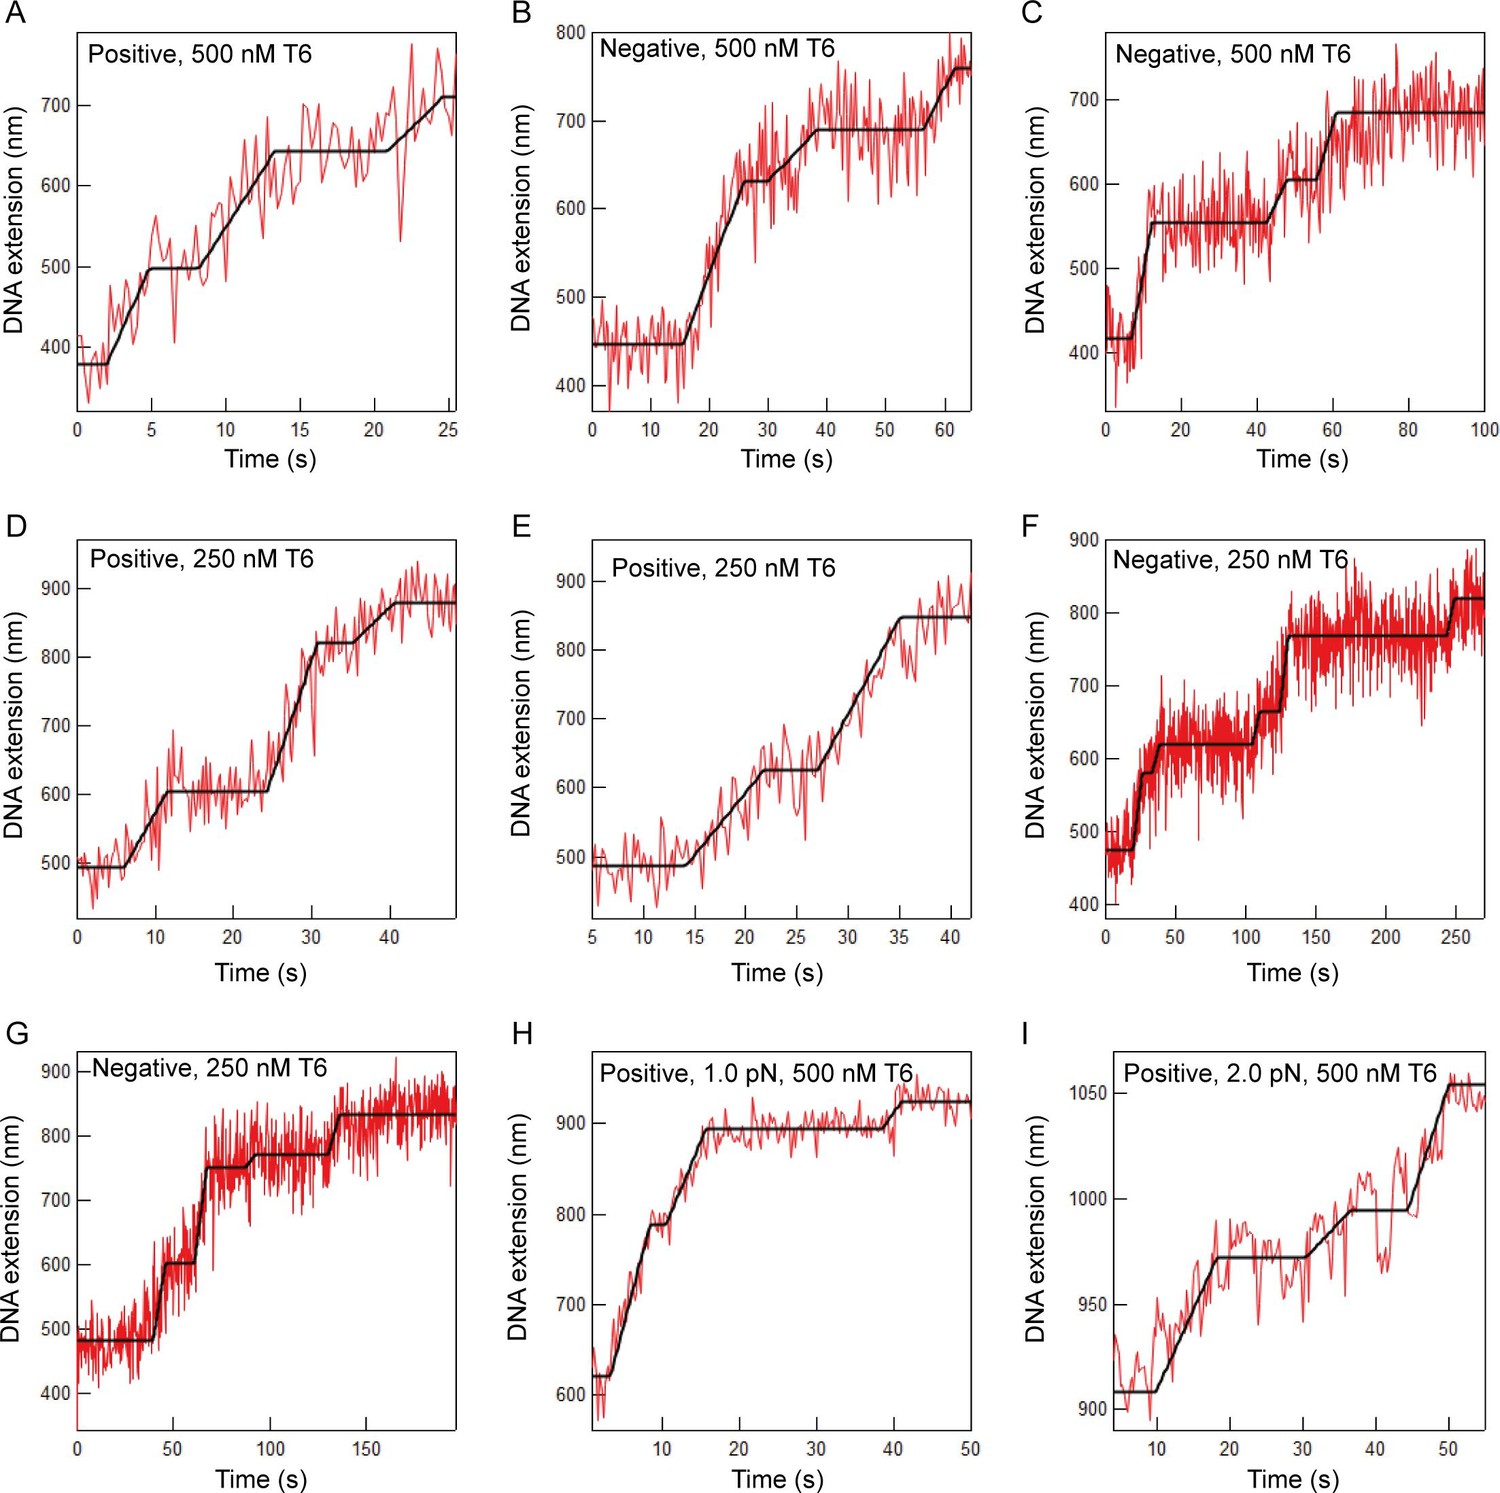
Additional examples of T-test fits to braid relaxation data.
Extension versus time data for topo VI relaxing braided DNA (red lines) and the T-test based fit to the data (black lines). The sign of the braiding and the concentration of topo VI are indicated on each graph. For panels A-G, the applied force was 0.5 PN. The applied force for panels H and I are indicated on the graphs. Although the extension change per braided link varies slightly among different braids (15–50 nm) the most common extension change per link was ~40 nm.
-
Figure 4—figure supplement 1—source data 1
Source data is in the file Figure 4—figure supplement 1.
- https://cdn.elifesciences.org/articles/67021/elife-67021-fig4-figsupp1-data1-v2.xlsx
Figure 4—figure supplement 2
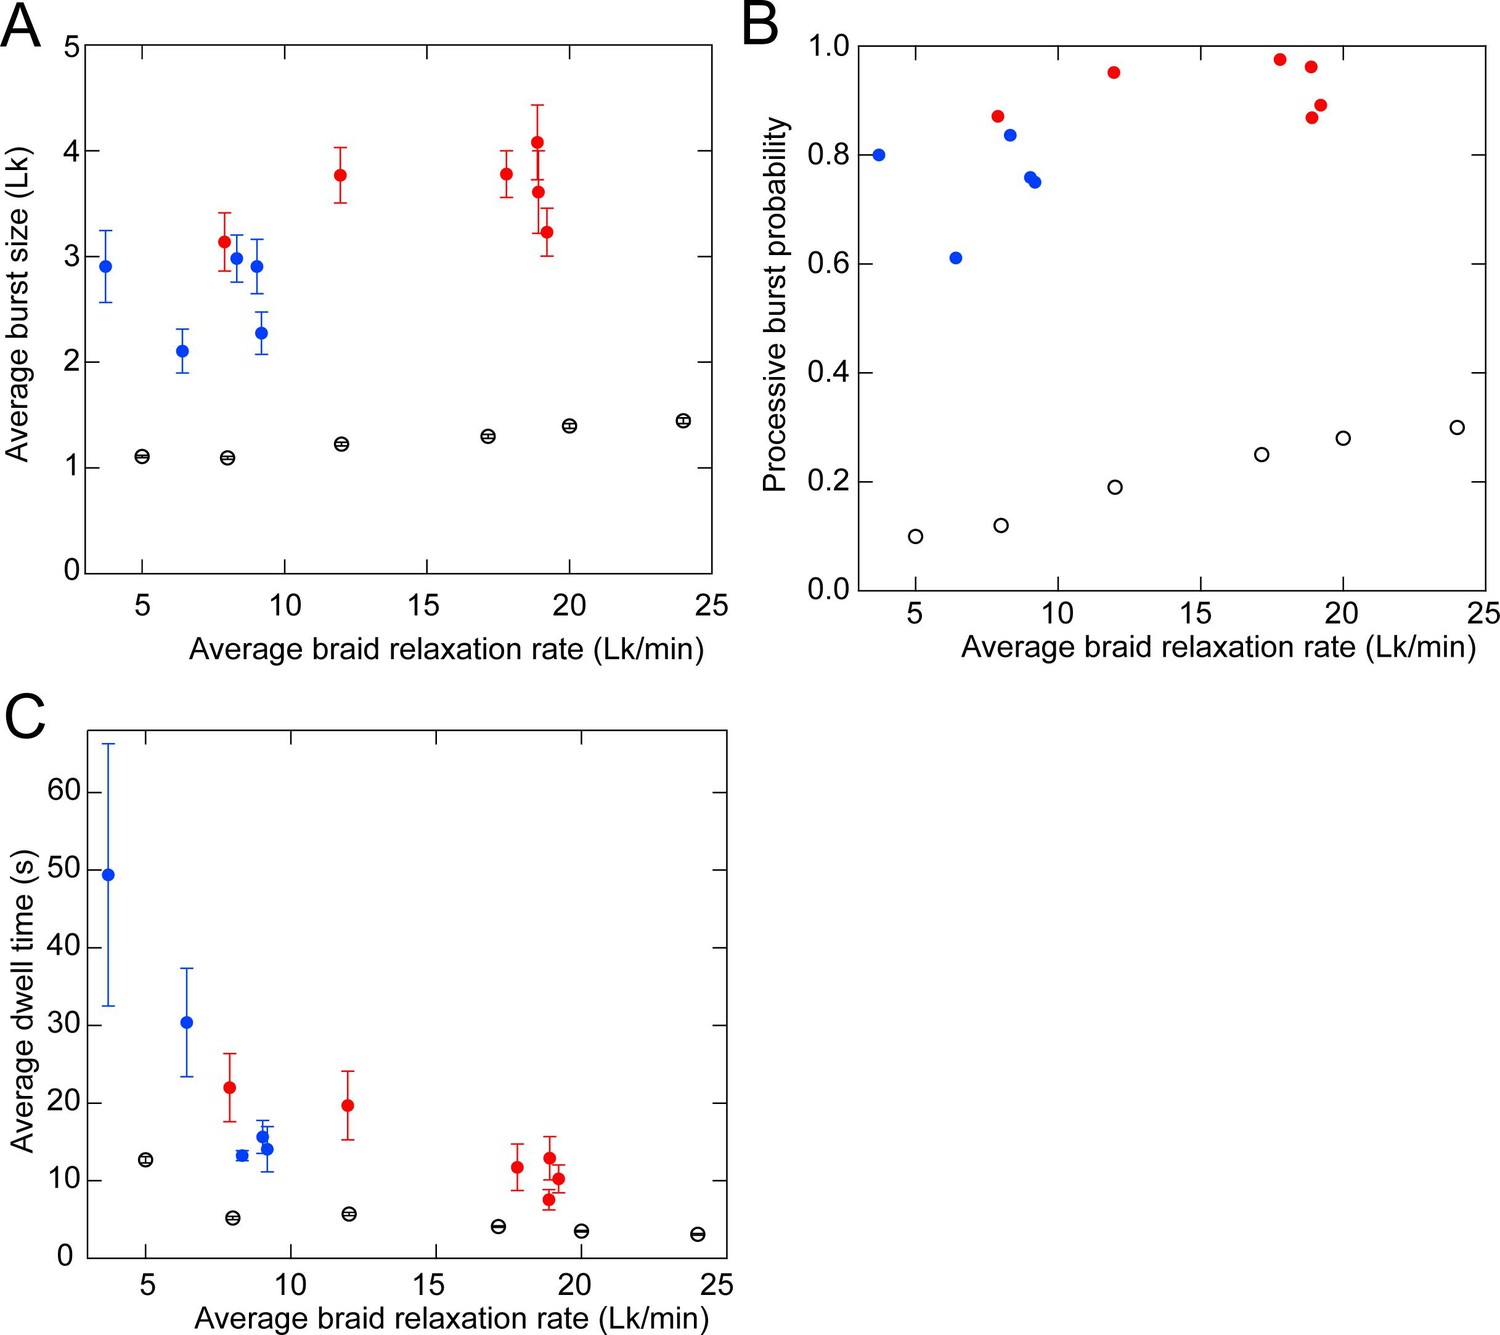
Comparison of the experimental braid relaxation data with a purely distributive relaxation model via simulations.
To test the possibility that the braid relaxation data are consistent with purely distributive relaxation by topo VI, we performed simulations of distributive braid relaxation with average rates corresponding to the average measured braid relaxation rates (the number of crossings relaxed divided by the total time to relax the crossing including all pauses) at different topo VI concentrations (Figure 4C) and performed T-test fitting of the simulated extension versus time data with identical T-test parameters used for the experimental data (see Figure 4—figure supplement 3 for examples of T-test fits to simulated data). One hundred simulations of the distributive relaxation of braids containing 12 links were performed for each of six different average relaxation rates and the statistics of the simulated relaxation data were obtained from the T-test fits. (A) The average burst-size (linking number difference) for positive (red filled circles) and negative (blue filled circles) braids and simulated braid relaxation data (open circles) plotted as a function of the average braid relaxation rate with error bars corresponding to the standard error of the mean. The average step-size for the simulated perfectly distributive relaxation slightly exceeds one due to individual steps that are missed in the t-test analysis. (B) The average processive burst probability for positive (red filled circles) and negative (blue filled circles) braids and simulated braid relaxation data plotted as a function of the average braid relaxation rate. Fitted steps larger than 150% of the extension change for a single linking number were scored as a processive burst and the probability was obtained by dividing this number by the total number of fitted steps. (C) The average pause time between steps for positive (red filled circles) and negative (blue filled circles) braids and simulated braid relaxation data plotted as a function of the average braid relaxation rate with error bars corresponding to the standard error of the mean.
-
Figure 4—figure supplement 2—source data 1
Source data is in the file Figure 4—figure supplement 2.
- https://cdn.elifesciences.org/articles/67021/elife-67021-fig4-figsupp2-data1-v2.xlsx
Figure 4—figure supplement 3
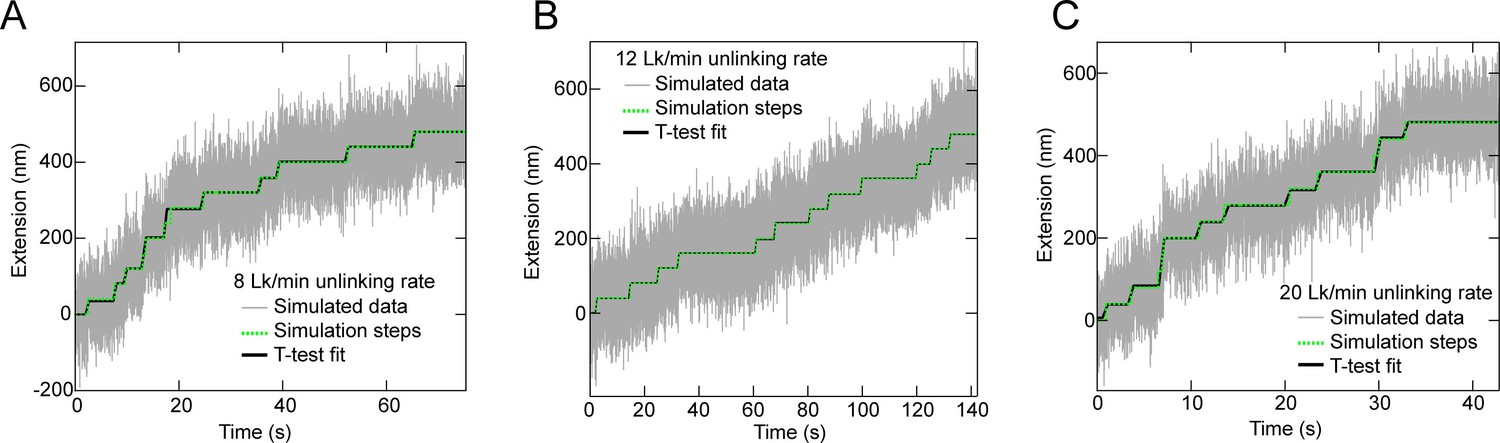
Examples of T-test based fits to simulated braid relaxation data.
Simulated DNA extension versus time for distributive relaxation (grey line) along with the T-test fit (black line) and the simulated extension in the absence of noise (green dashed line) at average relaxation rates of: (A) 8 Lk/min. (B) 12 Lk/min, and (C) 20 Lk/min. Each simulated trace consists of a series of 12, 40 nm increases in DNA extension that occur at exponentially distributed time intervals with a mean time corresponding to the average relaxation rate. Gaussian noise with a standard deviation of 60 nm, estimated from experimental trajectories at 0.5 pN (Figure 4, Figure 4—figure supplement 1), was added to the simulated trajectories. T-test fitting of the trajectories was performed with the same parameters as those used for the experimental data: Initial data down-sampled 10-fold to 20 Hz, T-test comparison window size of 40 points, T-test significance level (alpha parameter) of 10–7, minimum step size of 20 nm (half the extension associated with a single relaxation event, 40 nm).
-
Figure 4—figure supplement 3—source data 1
Source data is in the file Figure 4—figure supplement 3.
- https://cdn.elifesciences.org/articles/67021/elife-67021-fig4-figsupp3-data1-v2.xlsx
Figure 5
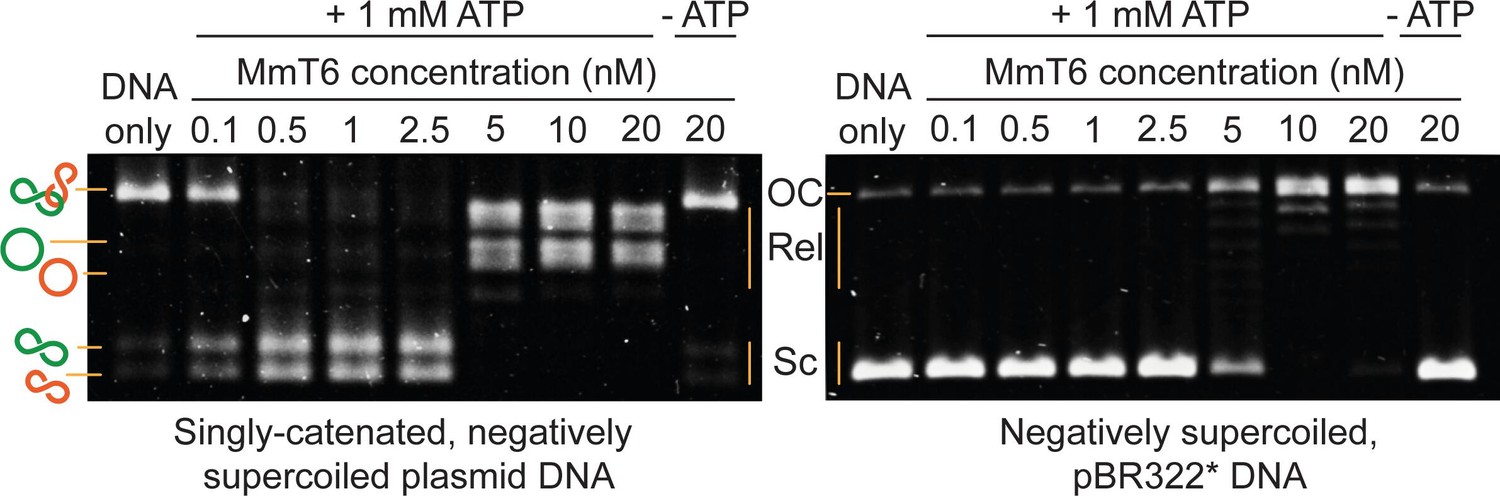
Agarose gel-based assay of DNA decatenation and relaxation by Methanosarcina mazei topo VI (MmT6).
On the left, a singly catenated (depicted by the linked green and orange circles), negatively supercoiled plasmid substrate is decatenated by 0.1–20 nM topo VI. The catenated, supercoiled plasmids vary in size and when decatenated, can be seen as two bands that migrate further (depicted by the separated green and orange circles) (Waraich et al., 2020). As they are also negatively supercoiled, the relaxation of the plasmids can be seen at topo VI concentrations ~10 fold higher (5 nM) than when full decatenation is seen (0.5 nM). This is further corroborated by a relaxation assay performed using negatively supercoiled pBR322* (right-hand gel), where relaxation activity is not detected until ~10 fold the MmT6 concentration (5 nM) necessary for decatenation. OC: open circular, Rel: relaxed and Sc: supercoiled. Both reactions were incubated for 30 min at 37 °C.
Figure 6 with 1 supplement
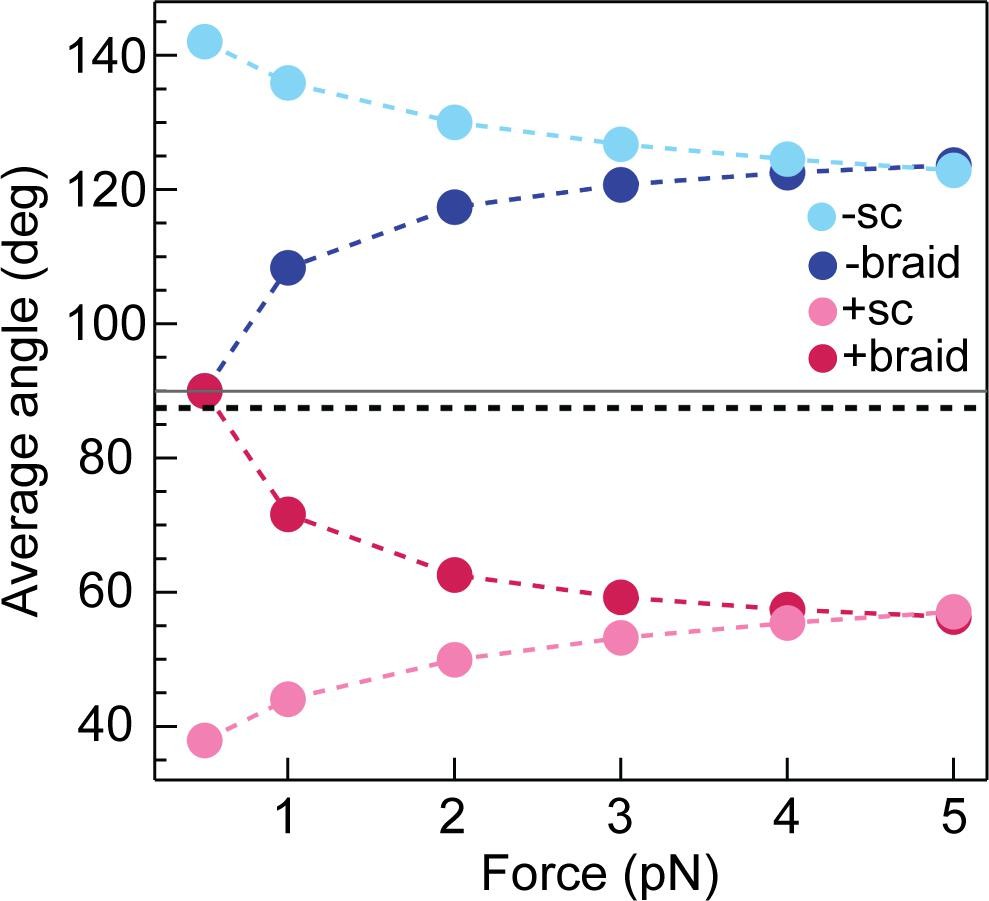
Calculated average DNA-crossing angles for supercoils and braids, as a function of force.
The average DNA-crossing angle in positive and negative supercoils (+ sc [ink] and -sc [light blue], respectively) were calculated as described in Neukirch and Marko, 2011. The temperature was 293 K, the DNA persistence length was 50 nm and the monovalent salt concentration was 100 mM. The average DNA-crossing angles in positive and negative braids (+ braid [red] and -braid [dark blue], respectively) were calculated as described in Charvin et al., 2005. The temperature, DNA persistence length and monovalent salt concentration were the same as for supercoils. DNA duplex spacing was 600 nm, DNA-crossing number was eight and the DNA was 5080 bp long. In both the supercoil and braiding calculations, variables were set to mirror experimental conditions as close as possible. The horizontal grey line represents 90° and the dotted black line represents the topo VI DNA-crossing angle preference (α0 ≈ 87.5°).
-
Figure 6—source data 1
Source data is in the file Figure 6.
- https://cdn.elifesciences.org/articles/67021/elife-67021-fig6-data1-v2.csv
Figure 6—figure supplement 1
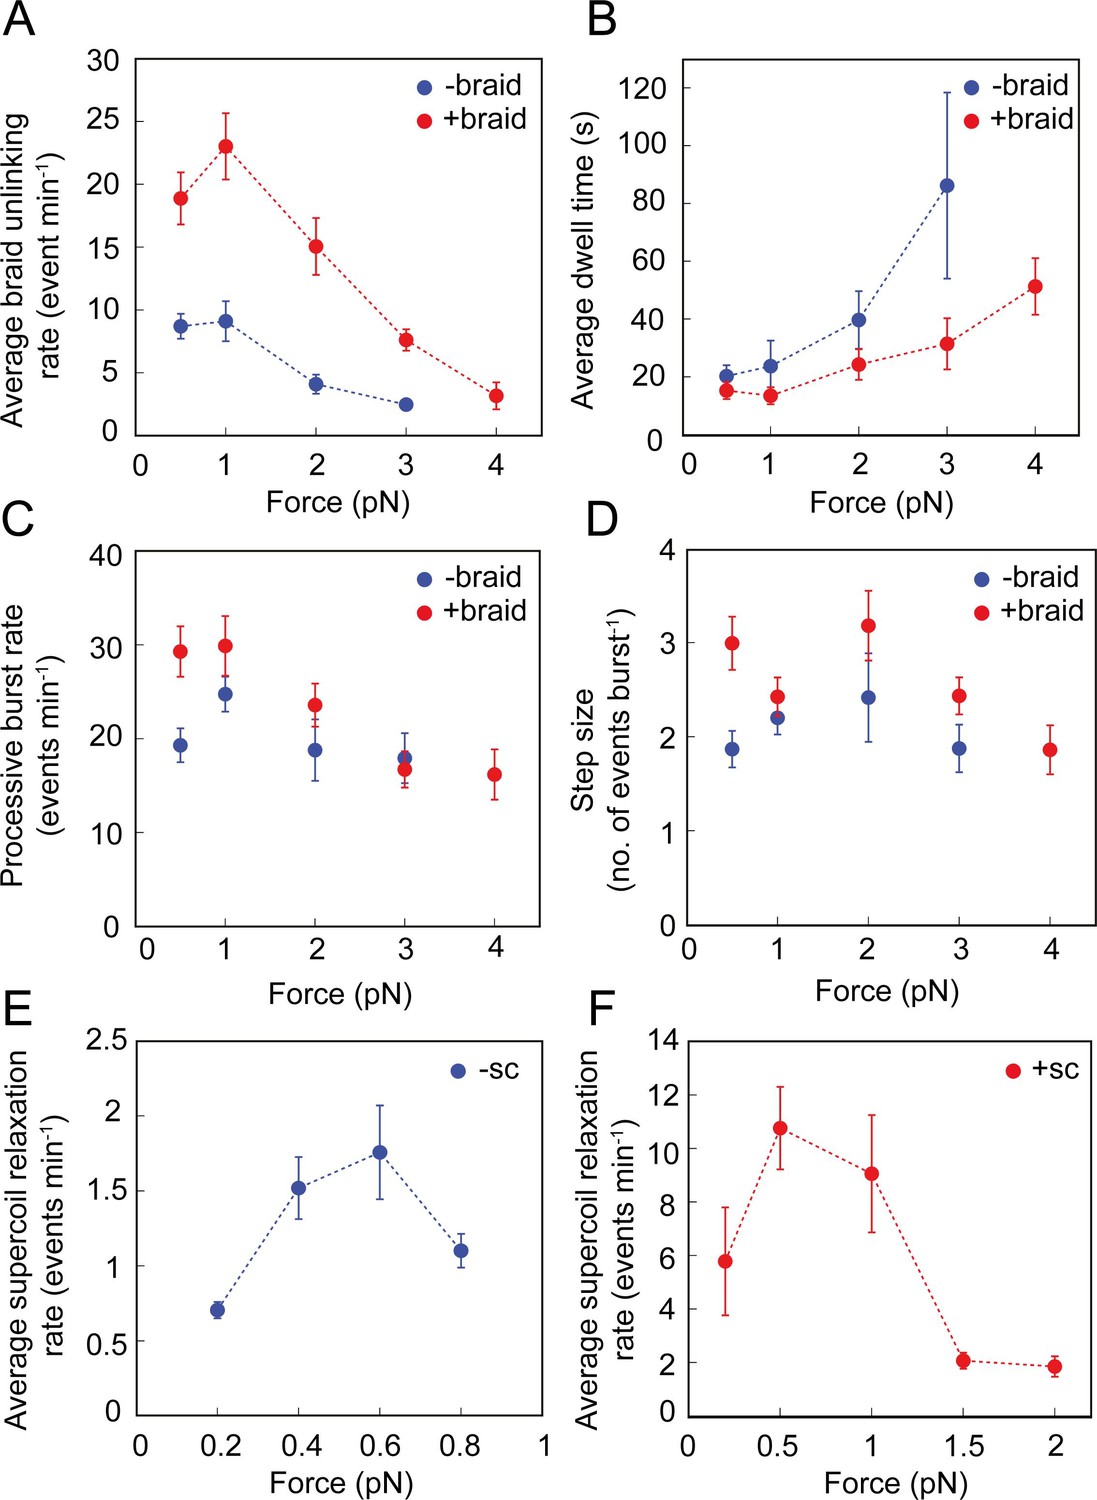
Effect of force on the braid unlinking and supercoil relaxation activity of topo VI.
(A) The average rate of positive (red, N tethers across all data points = 28) and negative (blue, N tethers across all data points = 22) braid unlinking (events min–1) (± SEM), plotted against force. (B) The average dwell times (s) between unlinking events for positive (red, N dwell times across all data points = 75) and negative (blue, N dwell times across all data points = 56) braids (± SEM), plotted against force. (C) The average processive burst rate (events min–1) for positive (red, N burst events across all data points = 80) and negative (blue, N burst events across all data points = 44) braid unlinking (± SEM), plotted against force. (D) The average step size (events burst–1) for positive (red, N = 92) and negative (blue, N = 69) braid unlinking (± SEM), plotted against force. Assays in A-D were conducted using 0.5 nM topo VI and 1 mM ATP, at 21 °C, over a force range of 0–4 pN.( E) The average rate of relaxation of negative supercoils (events min–1) (± SEM, N tethers across all data points = 12), plotted against force. (F) The average rate of relaxation of positive supercoils (events min–1) (± SEM, N tethers across all data points = 15), plotted against force. Assays in Figures E-F were conducted using 0.75 nM topo VI and 1 mM ATP, at 21 °C.
-
Figure 6—figure supplement 1—source data 1
Source data is in the file Figure 6—figure supplement 1.
- https://cdn.elifesciences.org/articles/67021/elife-67021-fig6-figsupp1-data1-v2.csv
Figure 7 with 1 supplement
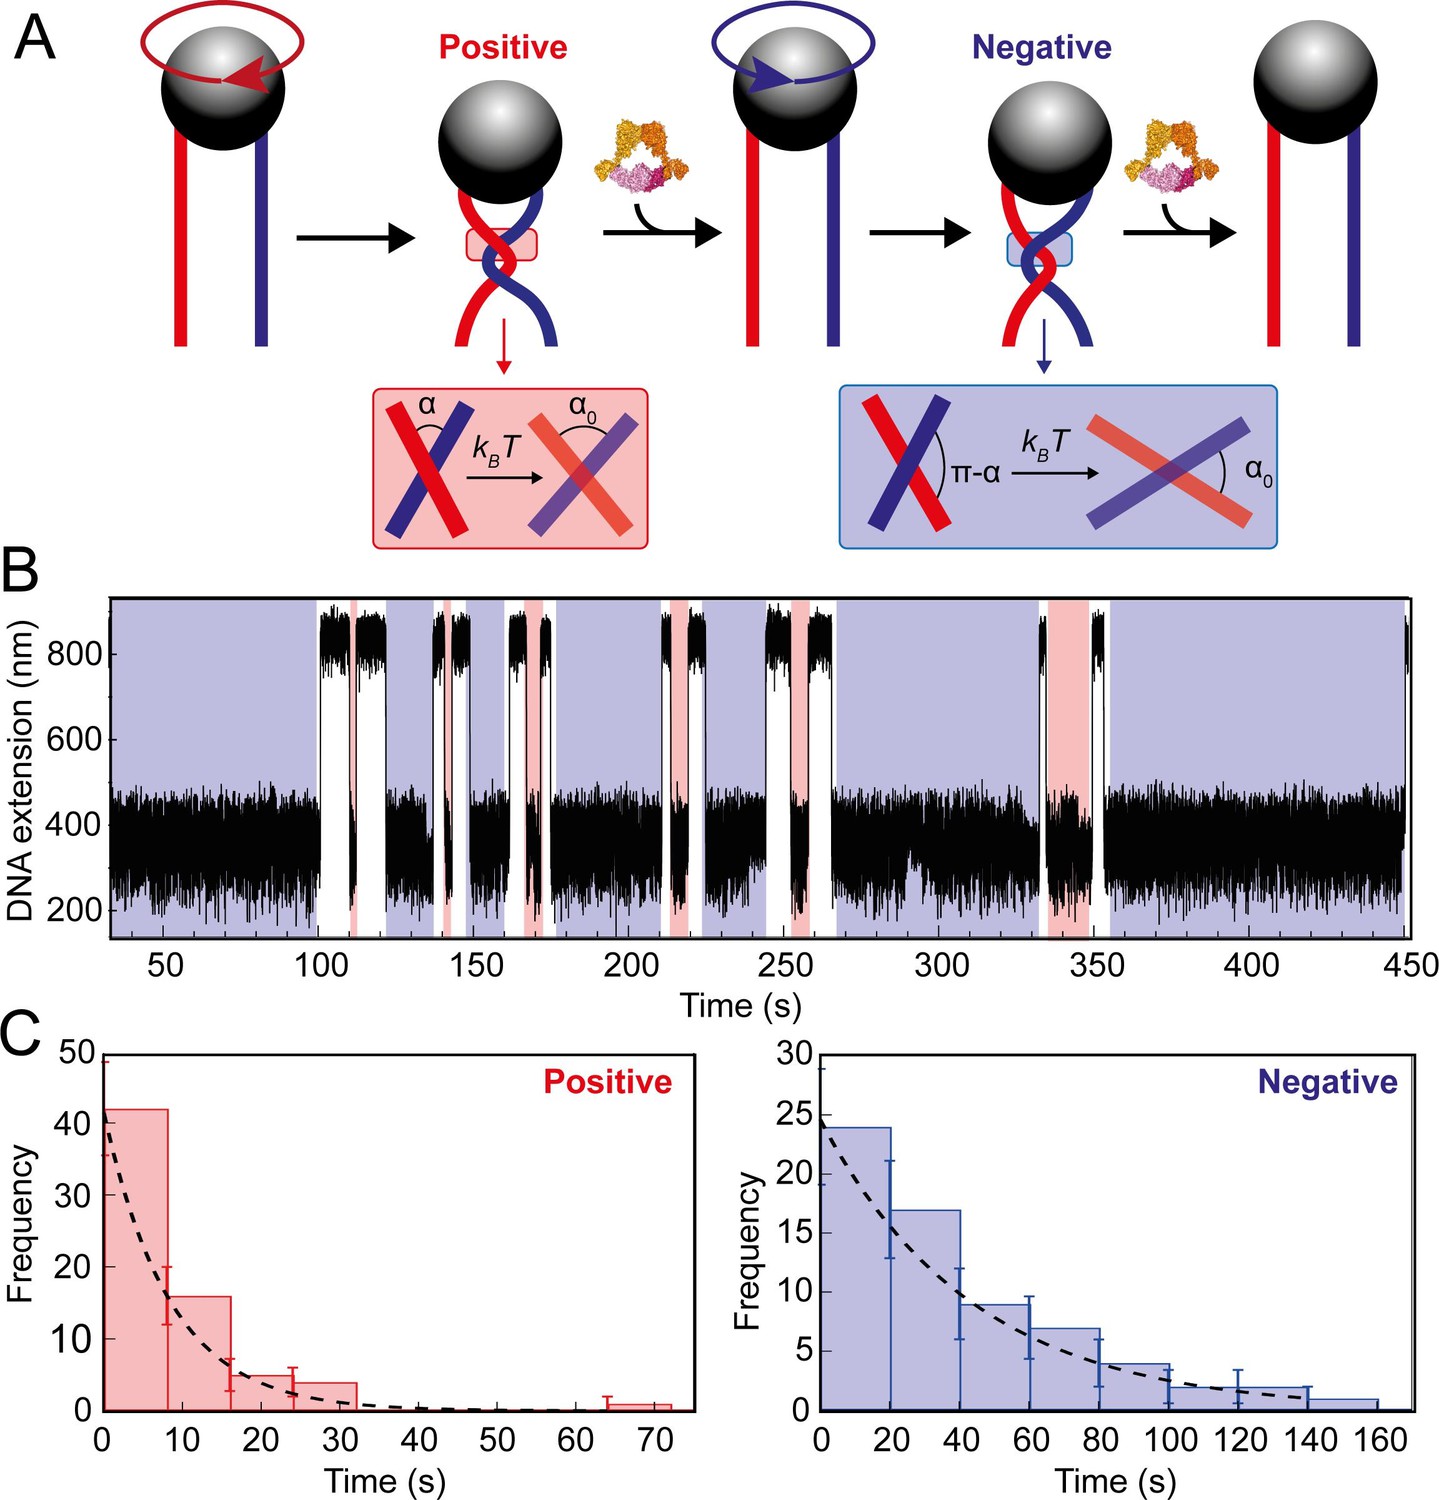
Topo VI unlinking single DNA crossings.
(A) Single crossing assay schematic with DNA crossing geometry for positive (left-handed, red) and negative (right-handed, blue) DNA writhe. One 360° clockwise magnet rotation imparts a positive crossing, which is unlinked by topo VI, followed by the generation and subsequent topo VI-dependent unlinking of a negative DNA crossing, formed by a 360° anticlockwise magnet rotation. The crossing angle is defined as the clockwise angle between the top and bottom DNA strands. For positive crossings this is an acute angle (α); for negative crossings the obtuse angle is the supplement (π-α) of the positive angle. For topo VI, achieving the preferred angle (α0 < 90) requires a smaller thermal fluctuation of positive crossings, therefore there is a higher probability of α0 being achieved than for negative crossings. (B) Single crossing unlinking data, collected for a braid formed from 3 kb DNA tethers, spaced 624 nm apart, at a force of 1 pN, using 0.9 nM topo VI and 1 mM ATP. Positive crossings (red) were relaxed more rapidly than negative crossings (blue). (C) Distributions of the topo VI-dependent unlinking times for negative (blue bars) and positive (red bars) crossings, of the data shown in B. The data were fitted with single exponentials, P(t) = τ–1exp(-t/τ), returning characteristic unlinking times of τR = 47 ± 7 s for negative crossings, and τL = 8 ± 1 s for positive crossings, giving a ratio of τL/ τR = 0.19 ± 0.04.
-
Figure 7—source data 1
Source data is in the file Figure 7.
- https://cdn.elifesciences.org/articles/67021/elife-67021-fig7-data1-v2.csv
Figure 7—figure supplement 1
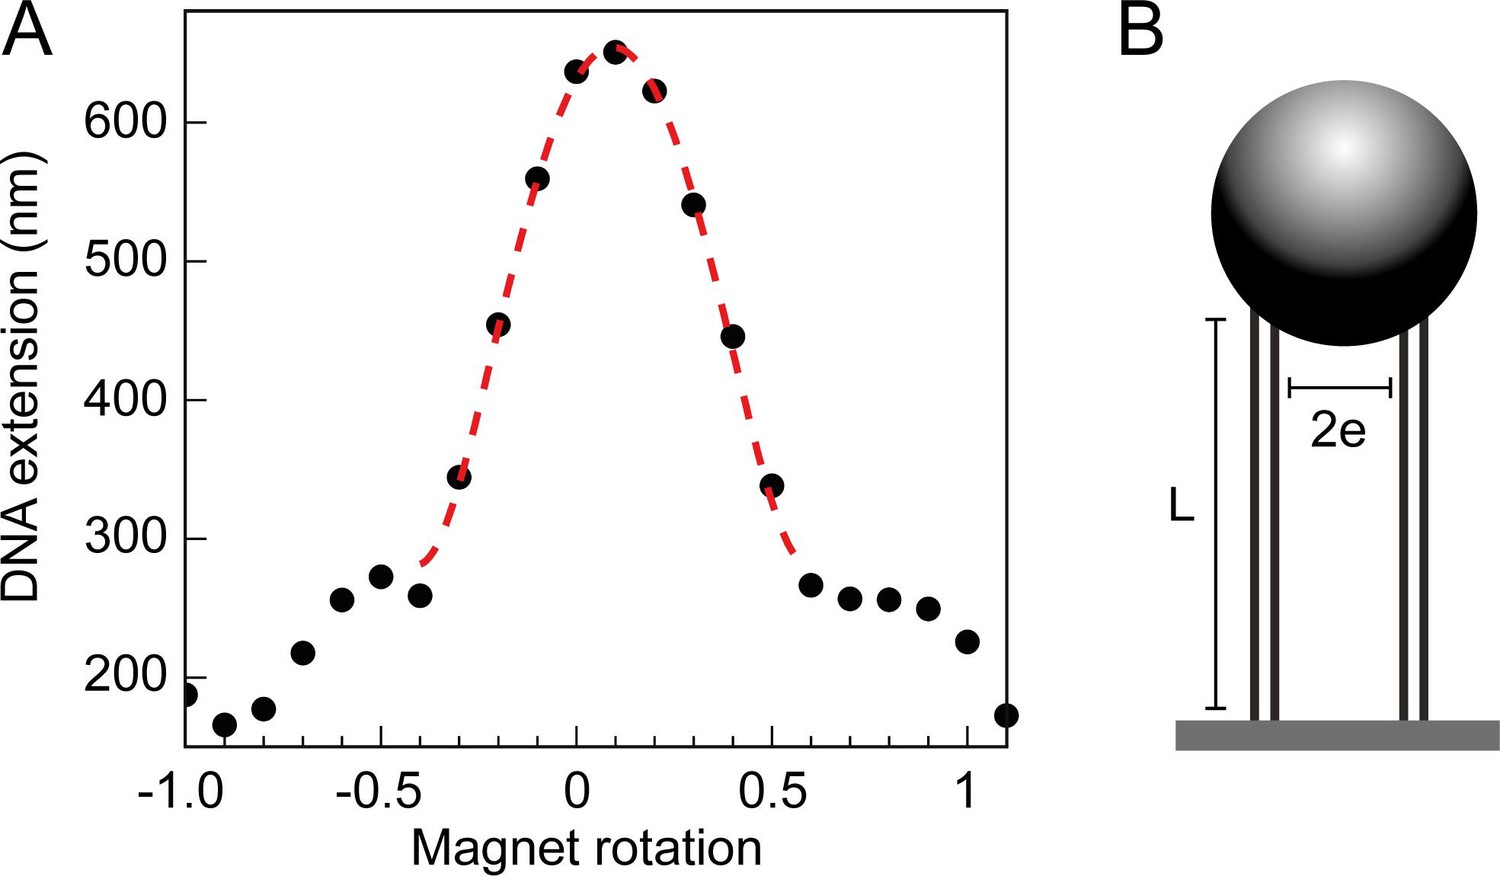
Braid tether calibration and geometric fit.
(A) The DNA extension of a 3 kb double tether, plotted as a function of magnet rotations and fitted to a geometric function (Neuman et al., 2009). Where L is the measured DNA extension, L0 is the maximum DNA extension (dependent on the force applied), e is half the separation distance between the DNA molecules, n is the number of magnet rotations, and r is the radius of the magnetic bead to which the tethers are bound. The first term in the expression describes the extension of a twisted swing, whilst the second two terms are a correction for the spherical bead, see Neuman et al., 2009 for a full description. (B) Geometric parameters of the DNA tethers, attained through the calibration and subsequent geometric fit (seen in Figure 7A), namely the length of the DNA tethers (L) and the separation distance between them (). Along with the force and number of turns, this information was used in Monte Carlo (MC) and Brownian Dynamics (DB) simulations.
-
Figure 7—figure supplement 1—source data 1
Source data is in the file Figure 7—figure supplement 1.
- https://cdn.elifesciences.org/articles/67021/elife-67021-fig7-figsupp1-data1-v2.csv
Figure 8 with 2 supplements

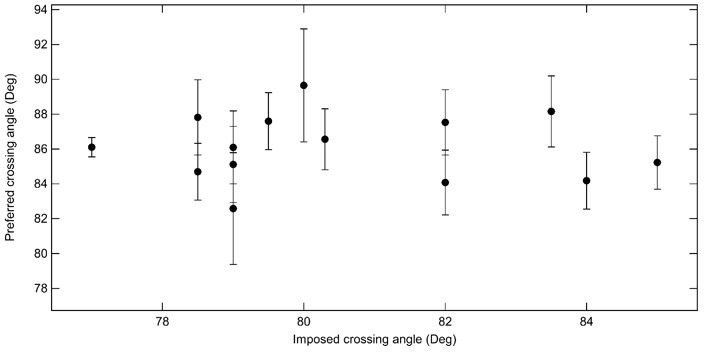
Preferred DNA crossing angle measurements for topo VI.
(A) Crossing angle probability distributions for single positive (PL(α), red) and negative (PR(α), blue) crossings, from Monte Carlo (MC) simulations for the tether geometry and force displayed in Figure 7. The positive crossing angle probability distribution was obtained from the MC simulations, whereas the negative crossing angle distribution was derived from the relationship PR(α) = PL(180°-α). For Brownian dynamics (BD) simulations, the negative crossing angle distributions, like the positive, were measured directly. The imposed crossing angle (αL: black-dotted line) is the average angle for the positive crossing angle distribution, in this case ≈ 79°. (B) Ratio of negative to positive probability from A plotted on a semilogarithmic axis. Using the relationship τL/τR = PR(α0)/ PL(α0), the preferred angle (α0) can be obtained, as illustrated by the black arrow. For this tether geometry and force, τL/τR = 0.19 ± 0.04 (obtained from the analysis in Figure 7C), which gives α0 of 87.9° ± 4.4° when using MC simulations, and 83.5° ± 4.2° when using BD simulations. The error associated with α0 in C and D is the combination of the statistical and systematic error, with the latter being the main contributor. (C) Preferred crossing angles (α0) from fourteen different DNA tether geometries, plotted against the average positive crossing angles (αL), as measured by MC simulations (filled circles, left-hand plot) and BD simulations (open circles, right-hand plot). (D) Preferred crossing angles (α0) from 14 different DNA tether geometries, as measured by MC simulations (filled circles, left-hand plot) and BD simulations (open circles, right-hand plot), plotted against the applied force on the DNA tether. The combined average preferred crossing angle for topo VI, determined from the MC simulations, was 87.8° ± 0.4° (± SEM), and from BD simulations, was 87.4° ± 0.4° (± SEM), both values represented by the dotted line and error shading in plots C and D (N = 14).
-
Figure 8—source data 1
Source data is in the file Figure 8.
- https://cdn.elifesciences.org/articles/67021/elife-67021-fig8-data1-v2.csv
Figure 8—figure supplement 1
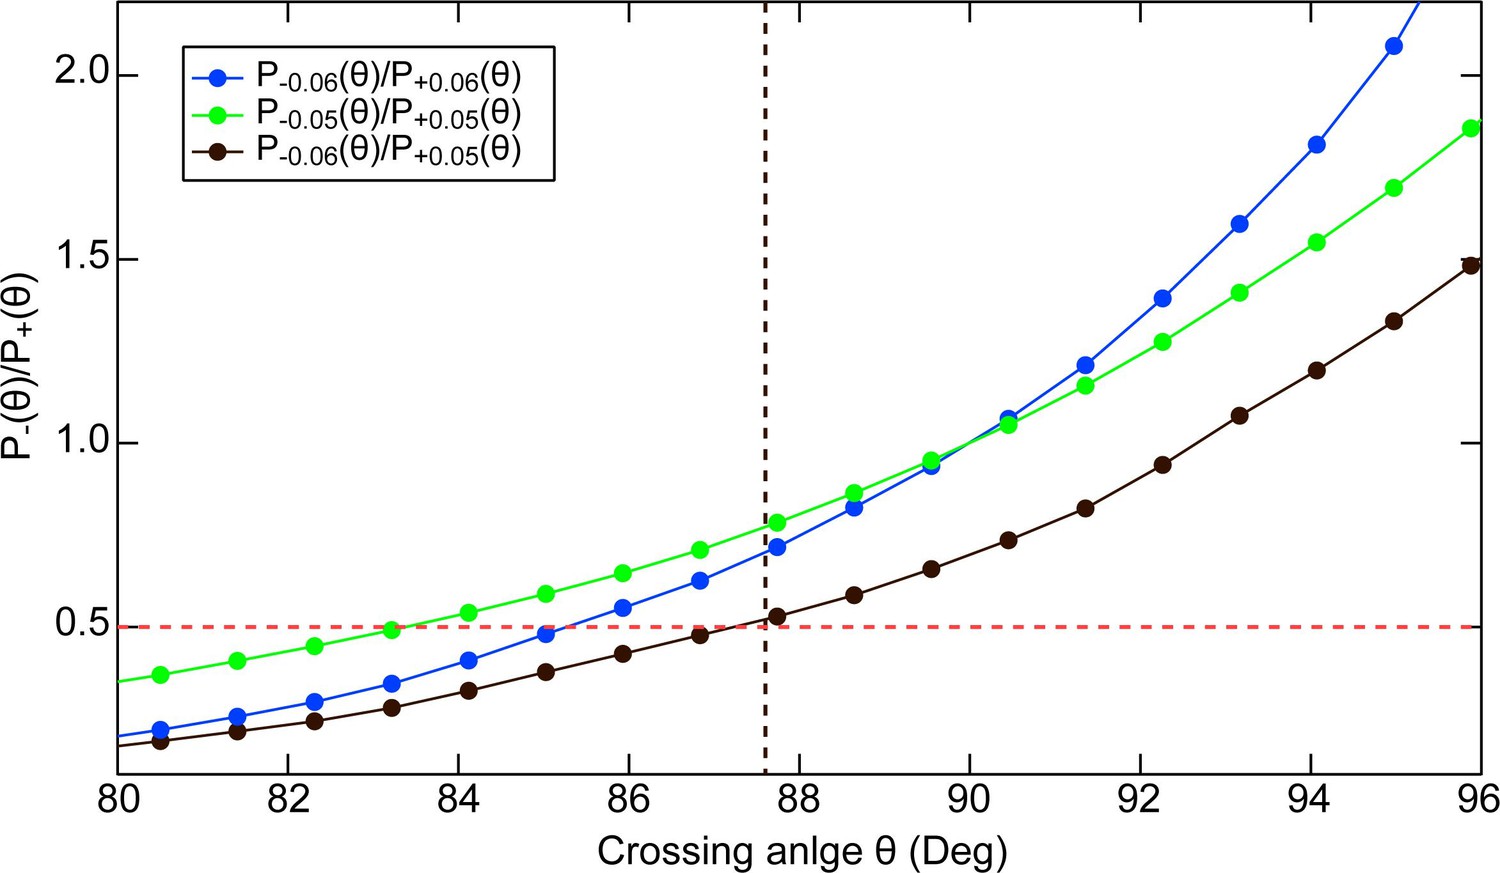
Estimate of the preferred crossing angle for topo VI from plasmid relaxation ATPase measurements.
Comparison between the ATPase rate of Topo VI relaxing negatively versus positively supercoiled DNA and the crossing angle distributions of negatively- and positively-supercoiled DNA estimated from Monte Carlo simulations. Ratio of negatively to positively supercoiled 3.5 kB plasmid DNA crossing angle probability distributions Pσ(θ) plotted as a function of the crossing angle, θ, for superhelical density, σ = ± 0.06 (Blue dots) σ = ± 0.05 (Green dots) and for σ = –0.06 compared with σ = + 0.05 (Black dots). The red dashed line at a ratio of 0.5 corresponds to the ratio of ATPase rates of Topo VI relaxing negatively versus positively supercoiled DNA (Figure 3—figure supplement 1). By analogy with Figure 8B, the preferred crossing angle for topo VI corresponds to the crossing angle at which the ratio of crossing angle probabilities is equal to the ratio of ATPase rates for negatively and positively supercoiled DNA. For the three different supercoiling ratios considered, the corresponding preferred crossing angle estimates are: 83° (σ = ± 0.05), 85° (σ = ± 0.06), and 87° (σ = −0.06 and σ = + 0.05). These estimates of the preferred crossing angle compare favourably to the preferred crossing angle of 87.5° (black vertical dashed line) derived from the single-molecule measurements (Figure 8). The crossing angle distributions were obtained from Monte Carlo simulations of supercoiled 3.5 kB circular DNA with superhelical density (σ) of 0.06 or 0.05, with an effective sodium ion concentration of 0.2 M performed by Vologodskii and Cozzarelli, 1996; Vologodskii and Cozzarelli, 1994. Crossing angle distributions for negatively supercoiled DNA were obtained from the positively supercoiled distributions by replacing the crossing angle with its supplement.
-
Figure 8—figure supplement 1—source data 1
Source data is in the file Figure 8—figure supplement 1.
- https://cdn.elifesciences.org/articles/67021/elife-67021-fig8-figsupp1-data1-v2.csv
Figure 8—figure supplement 2
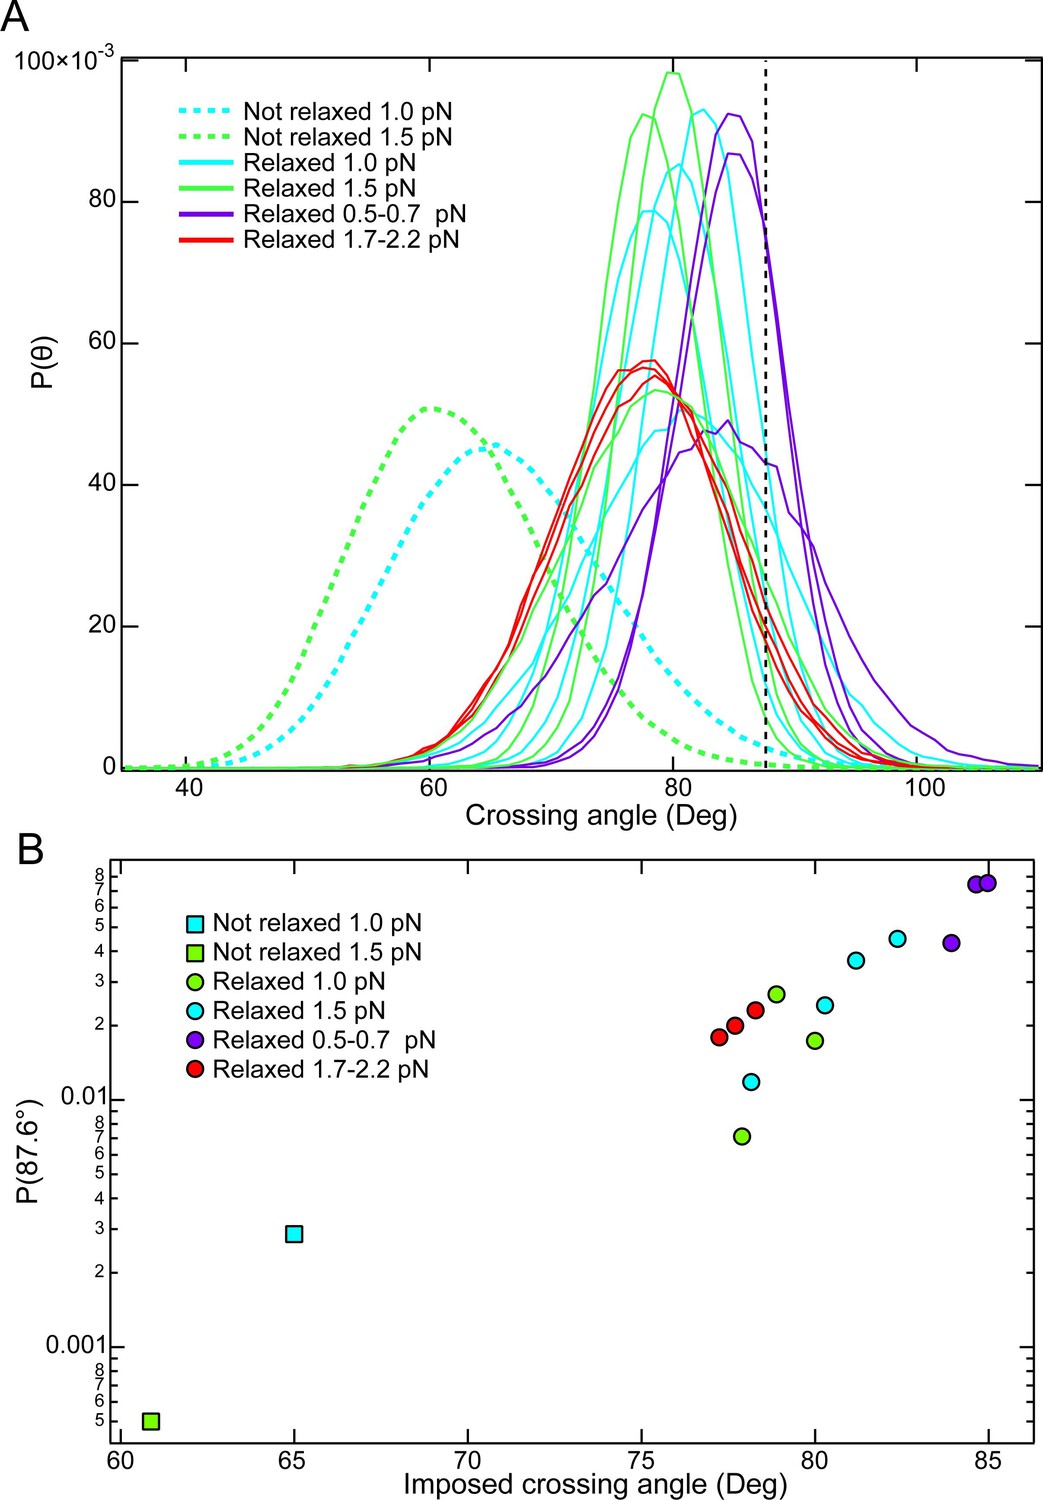
Comparisons of crossing angle probability distributions among single-crossings that are relaxed and not relaxed by topo VI.
(A) Crossing angle probability distributions from MC simulations for single-crossing geometries that were relaxed by topo VI (solid lines) and one single-crossing geometry that was not relaxed by topo VI at 1 and 1.5 pN of force (dashed lines). The vertical black dashed line corresponds to the preferred crossing angle of 87.6°. (B) Probability of obtaining the preferred crossing angle (87.6°) plotted as function of the imposed (peak) crossing angle for each of the simulated crossing angle distributions in part A. Initial relaxation measurements were typically performed at one or 1.5 pN. Under these conditions the probability of obtaining the preferred crossing angle in the non-relaxed crossing angle distribution (squares) is a factor of ~4–14 – fold less probable than the next lowest probability, and ~150 fold less probable than the most probable configuration (compare with the green and blue circles to the right). On average, the unlinking time for the crossing that was not relaxed would be expected to be ~13 fold longer at 1 pN and ~38 fold longer at 1.5 pN than the average unlinking time of the single crossings that were relaxed (6 seconds on average). It is likely that these much longer times to capture a T-segment exceed the binding time of topo VI to the G-segment, which will further reduce the effective unlinking rate to a greater extent than the decrease in T-segment capture rate.
-
Figure 8—figure supplement 2—source data 1
Source data is in the file Figure 8—figure supplement 2.
- https://cdn.elifesciences.org/articles/67021/elife-67021-fig8-figsupp2-data1-v2.csv
Figure 9
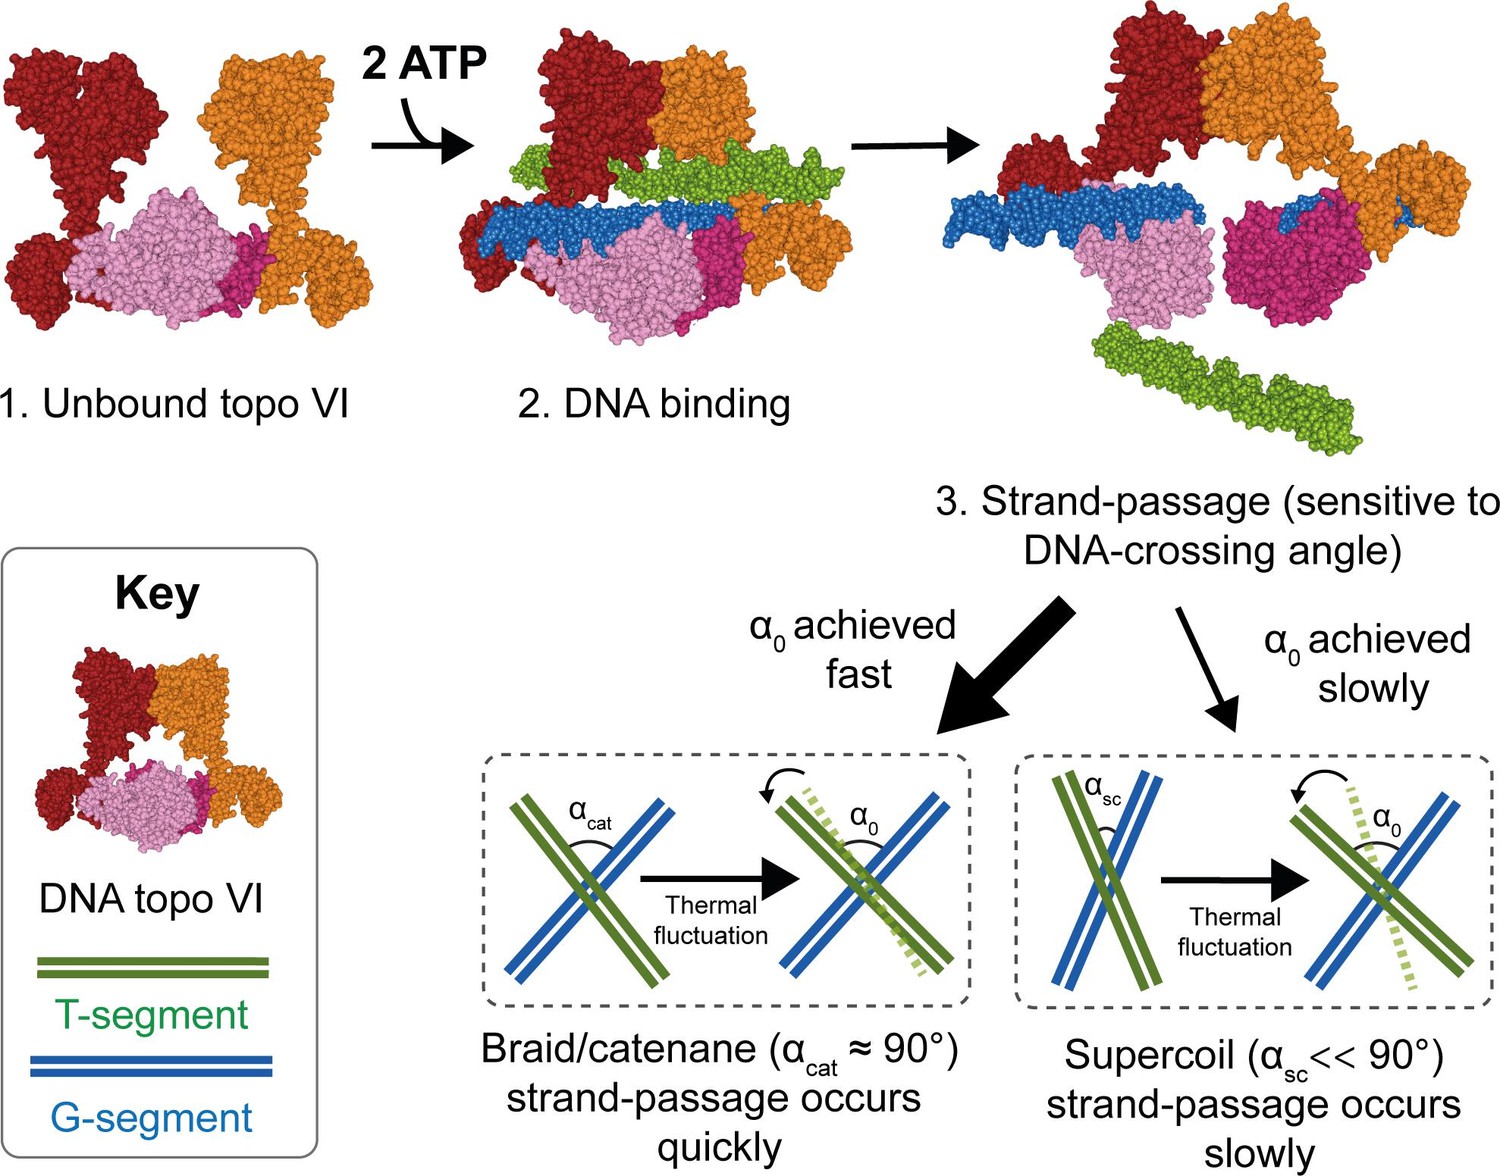
Model for chirality-dependent topo VI activity.
Unbound topo VI (1) binds a G- and T-segment in the presence of ATP (2), leading to G-segment cleavage and T-segment strand-passage. The rate at which strand passage occurs is sensitive to the DNA-crossing angle. The preferential topo VI DNA-crossing angle (α0) was shown to be ~87.5°, which occurs more frequently in DNA braids and catenanes than in supercoiled DNA. DNA-crossing angles in supercoils (αsc) are further from 90° and α0 than the DNA-crossing angles in braids and catenanes (αcat), so larger thermal fluctuations are required for supercoils to achieve the preferred topo VI crossing angle, and therefore they are relaxed less efficiently.
Author response image 1
Average preferred crossing angle for topo VI obtained from comparisons among all right handed crossings and all left handed crossings for single-crossing relaxation experiments.
Each point represents the average crossing angle obtained by comparing the relative relaxation times and simulated DNA crossing angle distributions of 26 single-crossing measurements (13 of each handedness) with measurements from one DNA tether, plotted as a function of the average imposed crossing angle of the tether geometry to which the other measurements were compared. The error bars correspond to the SEM. The average preferred crossing angle computed from these cross-comparisons is 86.1 ± 0.5°.
Tables
Key resources table
| Reagent type (species) or resource | Designation | Source or reference | Identifiers | Additional information |
|---|---|---|---|---|
| Gene (Methanosarcina mazei) | Top6A | Gift from James Berger, Johns Hopkins University | NCBI Gene ID: 1480760 | |
| Gene (Methanosarcina mazei) | Top6B | Gift from James Berger, Johns Hopkins University | NCBI Gene ID: 1480759 | |
| Strain, strain background (E. coli) | Rosetta 2 (pLysS) | Novagen | ||
| Genetic reagent (E. coli) | pBR322* | Inspiralis | ||
| Genetic reagent (E. coli) | pET28a | EMD Millipore | CAT#:69,865 | |
| Genetic reagent (E. coli) | pBlueScript II KS(+) | Agilent | CAT#:212,207 | |
| Recombinant DNA reagent | Top6AB dual expression vector | PMID:17603498 | Corbett et al., 2007 | |
| Antibody | Anti-digoxigenin(SheepPolyclonal) | Roche | Roche Cat# 11333089001, RRID:AB_514496 | Reconstituted in 1 x Phosphatebuffered saline (0.6 µg) |
| Commercial assay or kit | PCR DNA purification kit | Qiagen | Qiagen Cat. #: 28,104 | |
| Other | Streptavidin coated magnetic beads (ø: 1 and 2.8 µm) | Invitrogen | Invitrogen Cat. #: 65,602 and 65,305 | |
| Chemical compound, drug | Phusion high-fidelity DNA polymerase | New England Biolabs | NEB Cat. #: M0530 | |
| Chemical compound, drug | T4 DNA ligase | Promega | Promega Cat. #: M1801 | |
| Chemical compound, drug | BsaI-HF | New England Biolabs | NEB Cat. #: R3535 | |
| Chemical compound, drug | Biotin-16-dUTP | Roche | Sigma Cat#:11093070910 | |
| Chemical compound, drug | Digoxigenin-11-dUTP | Roche | Sigma Cat#:11558706910 | |
| Sequence-based reagent | 5 kb DNA supercoil primer1 | Eurofin Genomics Seol and Neuman, 2011a | 5'- GCT GGG TCT CGG TTGTTC CCT TTA GTG AGG GTT AAT TG | |
| Sequence-based reagent | 5 kb DNA supercoil primer2 | Eurofin Genomics Seol and Neuman, 2011a | 5'- GCT GGG TCT CGT GGT TTC CCTTTA GTG AGG GTT AAT TG | |
| Sequence-based reagent | 3 kb DNA braid primer1 | Eurofin Genomics | 5’(2 x)biotin-GCTGGGTCTCGGTTGGAACTGCGACT GGATAGG | |
| Sequence-based reagent | 3 kb DNA braid primer 2 | Eurofin Genomics | 5' (3 x) digoxigenin-GCTGGGTCTCGGTTGGATTACGCCA GTTGTACG | |
| Sequence-based reagent | 5 kb DNA braid primer1 | Eurofin Genomics | 5’(2 x)biotin-CTTCCGCTTCCTCGCTCACTGACTC | |
| Sequence-based reagent | 5 kb DNA braid primer 2 | Eurofin Genomics | 5' (3 x) digoxigenin-CTGTTCATCCGCGTCCAGCTCGTTG | |
| Sequence-based reagent | Bio/Dig labelledPrimer1 | Eurofin Genomics Seol and Neuman, 2011a | 5’-GGA CCT GCT TTC GTT GTG GCG TAA TCA TGG TCA TAG | |
| Sequence-based reagent | Bio/Dig labelledPrimer2 | Eurofin Genomics Seol and Neuman, 2011a | 5'- GGG TCT CGT GGT TTA TAG TCC TGT CGG GTT TC | |
| Software, algorithm | LabVIEW, Instrument control software | National Instruments | NI Cat. #: 776678–35 | |
| Software, algorithm | Igor Pro 7,Data analysis | WaveMetrics | PMID:28069956 | |
| Software, algorithm | ImageJ, Data analysis | National Institutes of Health | ||
| Chemical compound, drug | Adenosine triphosphate (ATP) | MilliporeSigma | A2383 | |
| Chemical compound, drug | Nicotinamide adenine dinucleotide (NADH) | MilliporeSigma | 10107735001 | |
| Chemical compound, drug | Pyruvate Kinase/Lactic Dehydrogenase (PK/LDH) | MilliporeSigma | P0294 | |
| Chemical compound, drug | Phosphoenol-pyruvate (PEP) | MilliporeSigma | 10108294001 | |
| Other | Plate reader | BMG LabTech | CLARIOstar Plus | Used for the PK/LDH-coupled ATPase assay. |
| Software, algorithm | Microsoft Excel | RRID:SCR_016137 | Used for data analysis for the PK/LDH-coupled ATPase assay. | |
| Software, algorithm | LAMMPS | https://www.lammps.org/ | Used for Molecular Dynamics Simulations | |
| Software, algorithm | MATLAB | MathWorks | Used for analyses of Molecular Dynamics Simulations |
Additional files
Download links
A two-part list of links to download the article, or parts of the article, in various formats.
Downloads (link to download the article as PDF)
Open citations (links to open the citations from this article in various online reference manager services)
Cite this article (links to download the citations from this article in formats compatible with various reference manager tools)
Topoisomerase VI is a chirally-selective, preferential DNA decatenase
eLife 11:e67021.
https://doi.org/10.7554/eLife.67021


