Proposed therapy, developed in a Pcdh15-deficient mouse, for progressive loss of vision in human Usher syndrome
- Department of Otorhinolaryngology - Head & Neck Surgery, University of Maryland School of Medicine, United States
- Ophthalmic Genetics and Visual Function Branch, National Eye Institute, National Institutes of Health, United States
- National Center of Excellence in Molecular Biology, University of the Punjab, Pakistan
- Laboratory of Molecular Genetics, National Institute of Deafness and Other Communication Disorders, National Institutes of Health, United States
- Laboratory of Retinal Cell and Molecular Biology, National Eye Institute, National Institutes of Health, United States
- Otolaryngology Branch, National Institute of Deafness and Other Communication Disorders, United States
- Departments of Ophthalmology and Visual Sciences, University of Maryland School of Medicine, United States
- Departments of Molecular Biology and Biochemistry, University of Maryland School of Medicine, United States
Figures
Figure 1 with 1 supplement
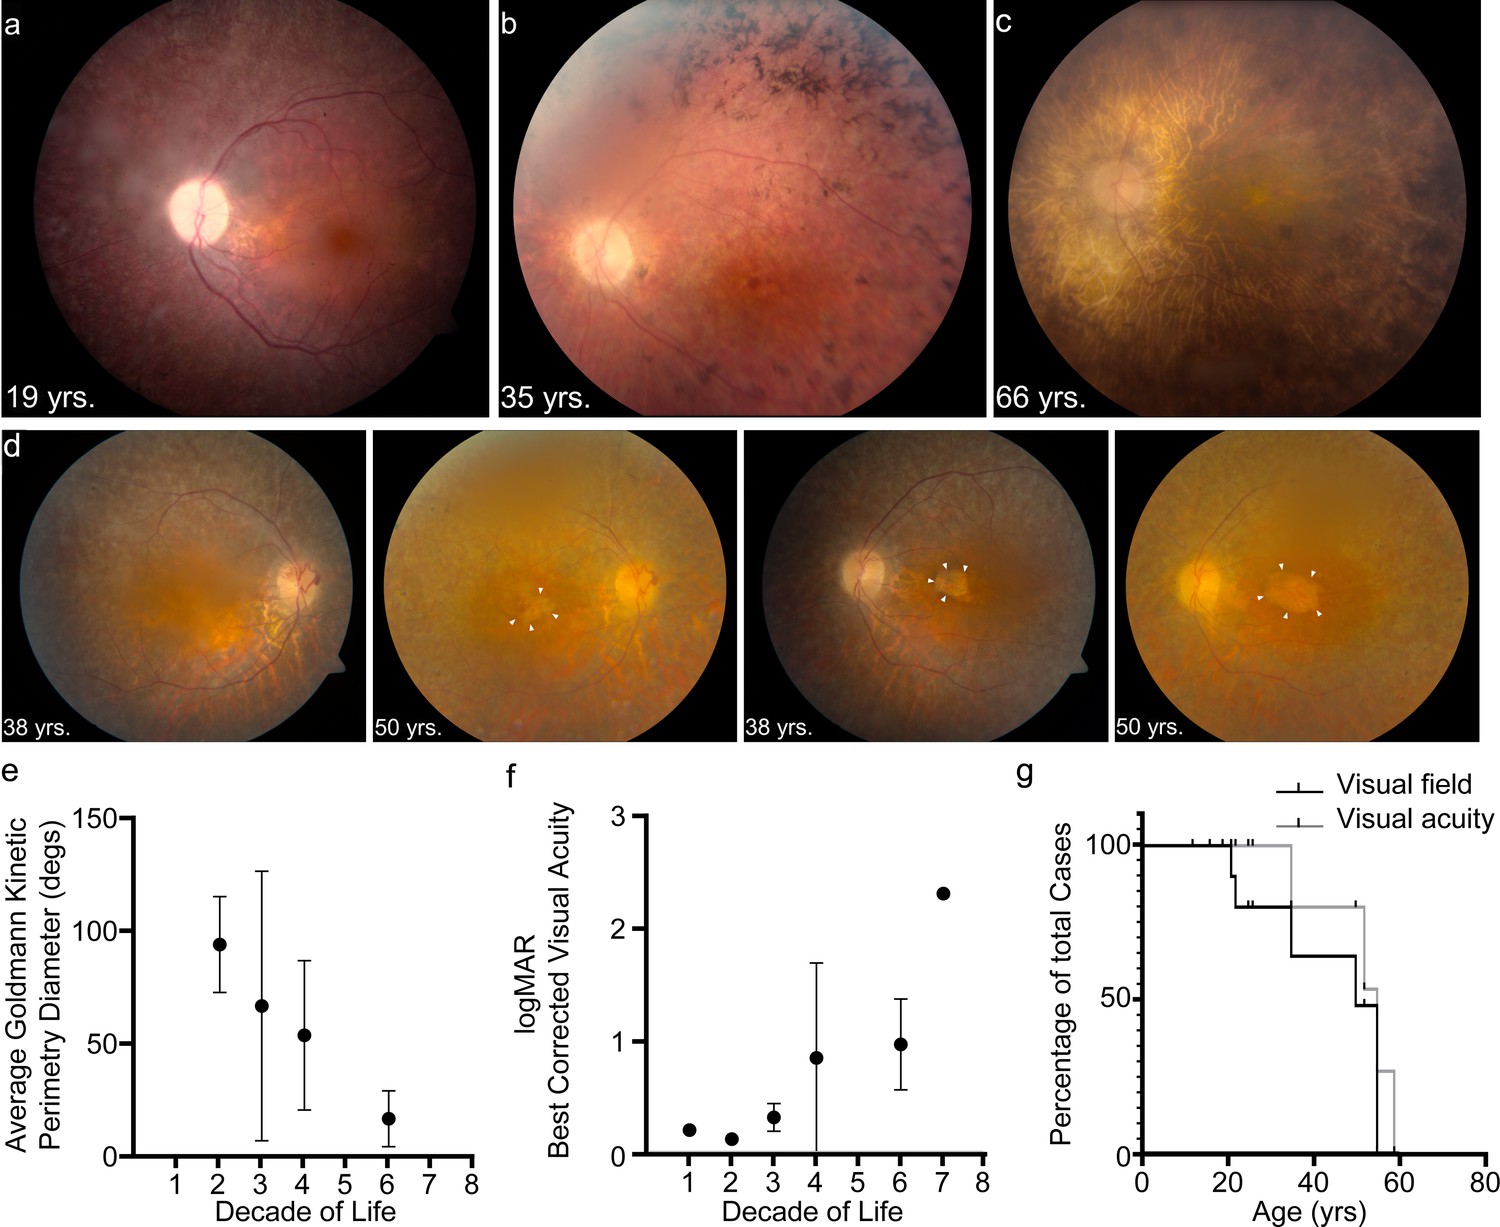
USH1F p.Arg245* spectrum and longitudinal eye phenotype.
(a–c) Fundus images depicting the spectrum of retinal findings in p.Arg245* USH1F patients, show mottling of pigment epithelium, attenuation of retinal vasculature, and pallor of optic nerve head seen in all three fundus photos. Peripheral bony spicules and macular atrophy are noted (b). Diffuse atrophy and advanced retinal degeneration are seen in (c). (d) Longitudinal progression of macular atrophic changes (arrowheads point at edge of macular atrophic area) over a 12-year period in a USH1F patient who is compound heterozygous for p.Arg245*/p.Arg929*. (e) Mean and SEM of Goldmann visual field diameters for patients with data binned by decade of life. (f) Mean and SEM of best-corrected visual acuity binned by decade of life for all patient visits. (g) Survival analysis curves for visual acuity (logMAR visual acuity>1, i.e., acuity worse than 20/200) and visual field (visual field <20° in better eye). These values were chosen since they usually denote visual function at legal blindness levels. SEM, standard error of the mean. The online version of this article includes source data and the following figure supplement(s) for Figure 1.
Figure 1—figure supplement 1
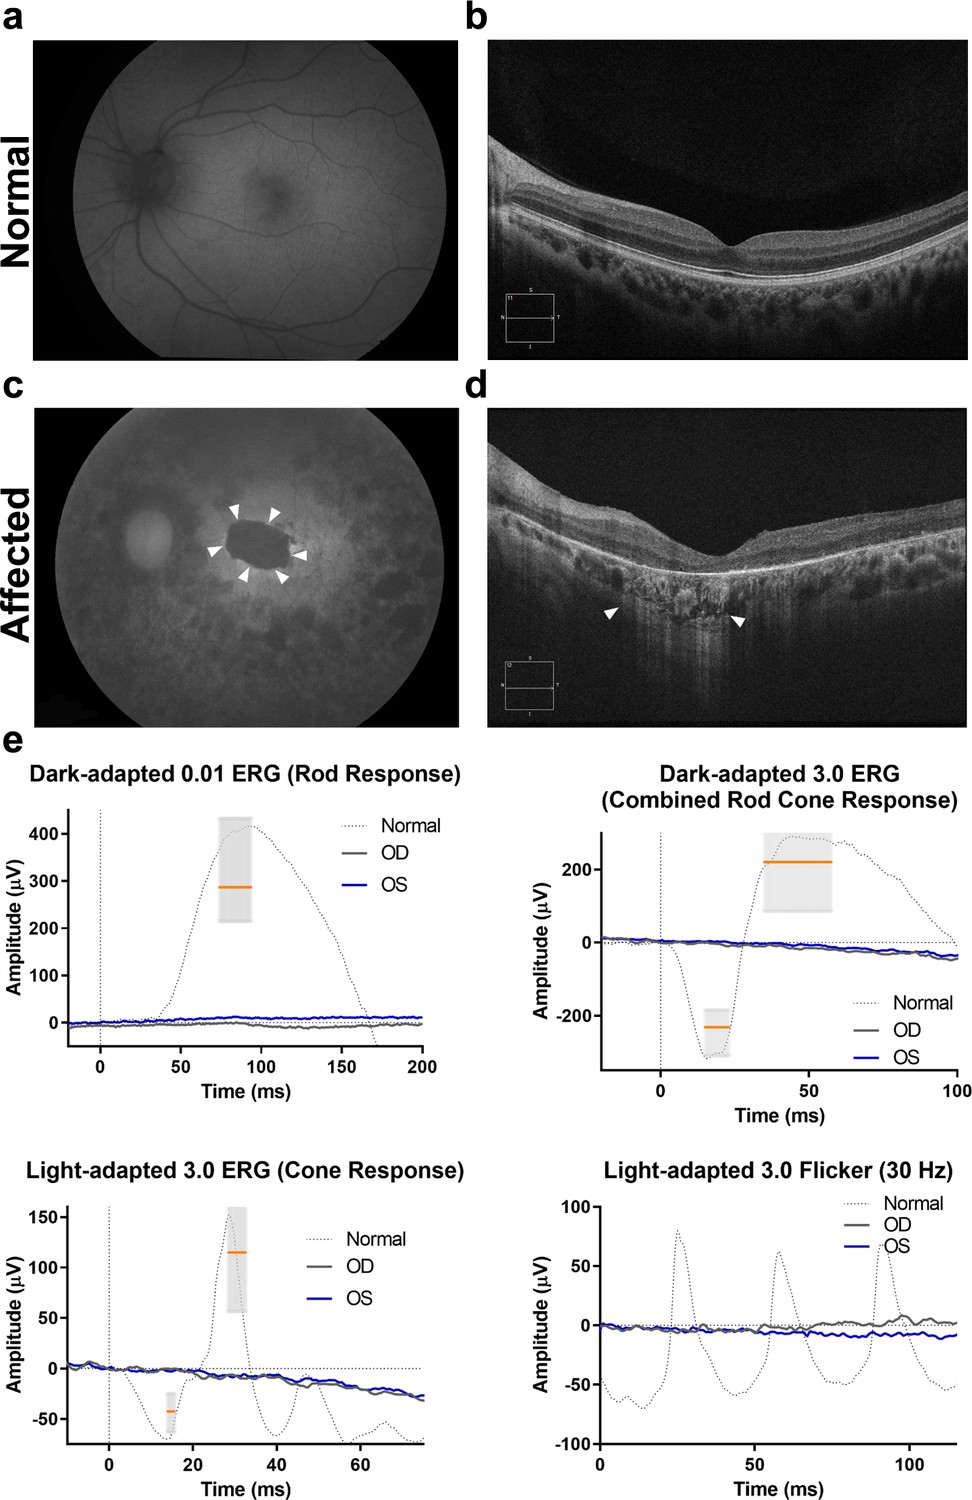
Fundus autofluorescence, optical coherence tomography (OCT), and electroretinography in compound heterozygous patient LMG197 #1831.
(a–c) Left eye fundus autofluorescence in (c) shows a central area, delineated by white arrowheads, of complete loss of autofluorescence consistent with RPE atrophy (compare with normal fundus autofluorescence in a). The images were obtained at the most recent patient visit (age 50 years). (d). Left eye OCT, also obtained at 50 years of age, shows the corresponding macular area with complete RPE and outer retinal atrophy as indicated by homogenous choroidal hypertransmission (white arrowheads) and absence of RPE band (in addition to significant macular thinning and loss of photoreceptors). Contrast with normal OCT anatomy presented in panel (b). (e) Electroretinography from the same patient at 38 years of age with noise level (extinguished) responses in both eyes. Median and 95% confidence interval for amplitude and implicit time indicated by the gray bars and orange line for the median. An example of normal waveform tracing is also shown. RPE, retinal pigment epithelium.
Figure 2 with 4 supplements
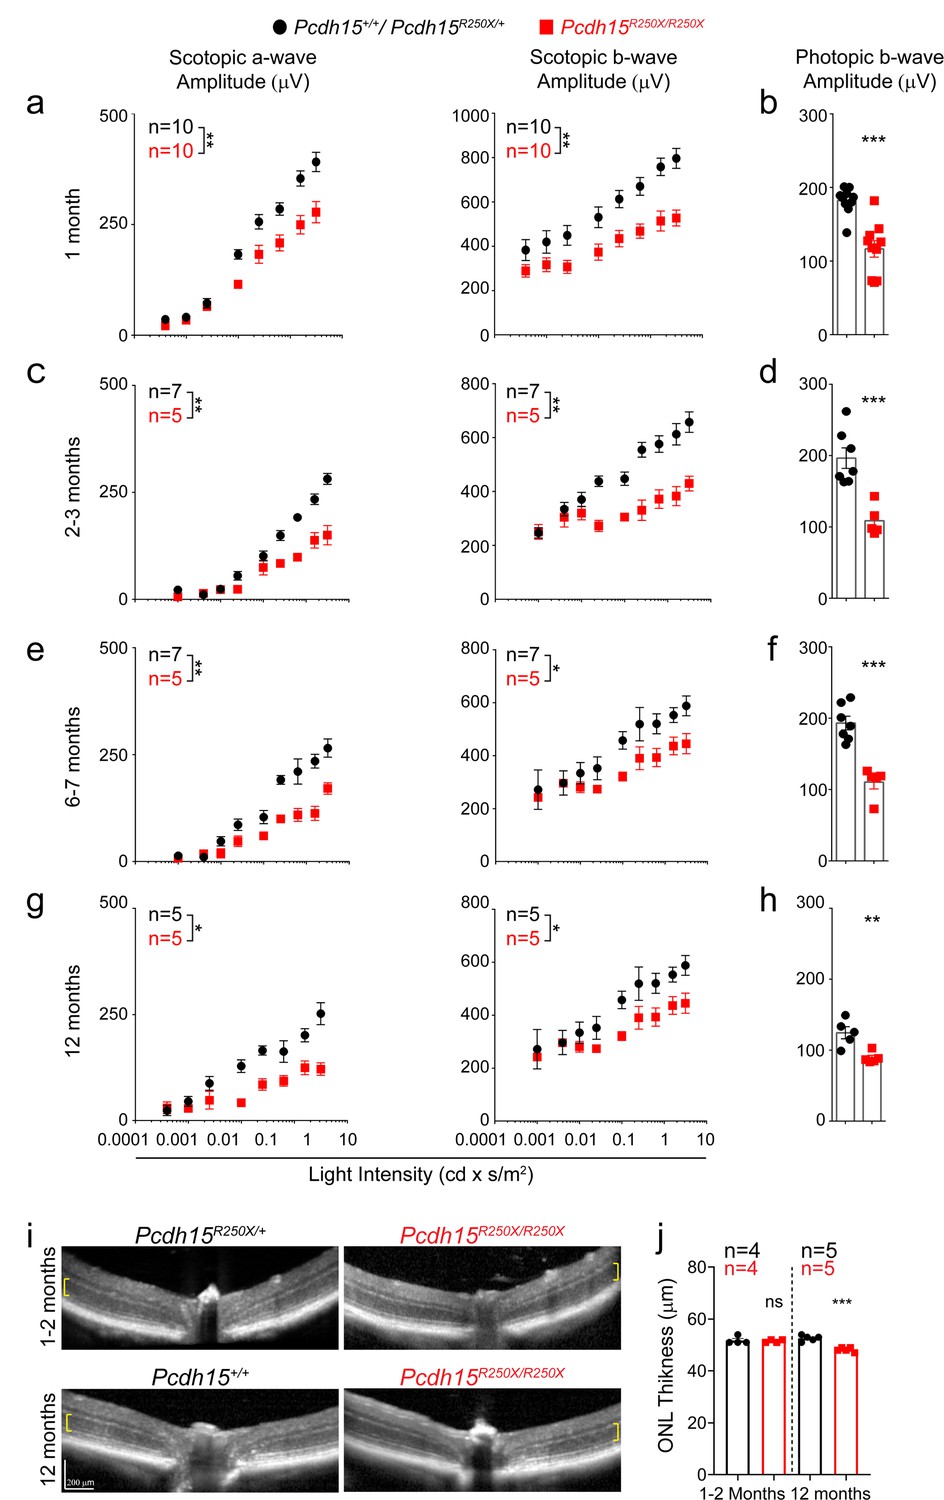
Loss of protocadherin-15 leads to visual dysfunction over a period of 1 year.
(a) Quantification of scotopic (dark adapted) responses from littermate control (Pcdh15+/+ or Pcdh15R250X/+) and mutant (Pcdh15R250X/R250X) mice at 1 month of age revealed progressive loss of both a- (left panels) and b-wave (right panels) amplitudes in mutant mice. Representative ERG waveforms are shown in Extended data Figure 3b. (b) Quantification of photopic (light adapted) b-wave indicates decline of cone photoreceptor function in mutant mice. (c–h) Quantification of scotopic ERG amplitudes (c, e, g) and photopic ERG amplitudes (d, f, h) at indicated ages shows sustained decline in amplitudes over time in Pcdh15 mutant mice. (i) Representative OCT images from mice of denoted genotype, shows no gross retinal degeneration in young (1–2 months, top panels) or old (12–14 months, bottom panels) mice. (j) Quantification of outer nuclear layer (ONL) of images showed in (i), shows mild loss of ONL in aged mutant mice. Data presented as mean ± SEM. Each data point represents an individual mouse. Data presented as mean ± SEM. Student’s unpaired t-test, p<0.05 (*), p<0.01 (**). The online version of this article includes source data and the following figure supplement(s) for Figure 2.
Figure 2—figure supplement 1
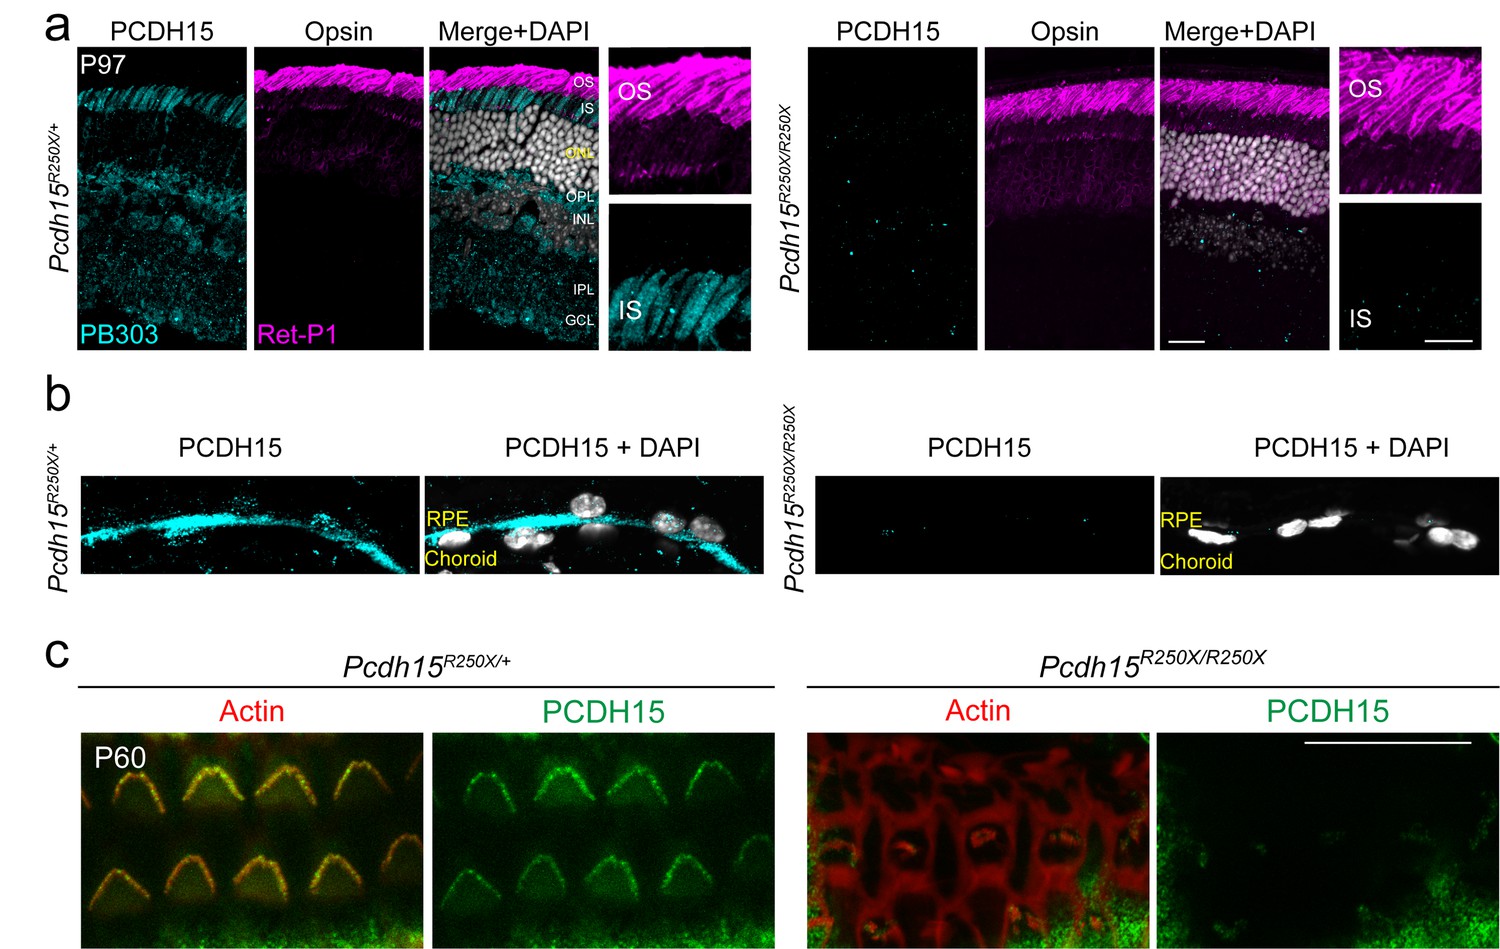
Validation of loss of protocadherin-15 in the retina and cochlea of Pcdh15R250X mutant mice.
(a) Confocal micrographs of P97 mouse retinae from control and Pcdh15R250X mutants immunostained for protocadherin-15 (PCDH15, cyan, left panel) and opsin to label outer segments (OS, magenta, center panel) shows robust protocadherin 15 localized to the inner segments (IS), outer plexiform layer (OPL), and ganglion cell layer (GCL). Notably, protocadherin-15 immunoreactivity is absent in Pcdh15R250X mutant mice. (b) Zoomed-in image of the OS/ IS interface. DAPI to visualize nuclei in gray. (c) Confocal micrographs of P60 organ of Corti of indicated genotype immunostained with protocadherin-15 (PCDH15) antibody HL5614 (green) and counterstained with phalloidin (red) confirm the loss of protocadherin-15 in Pcdh15R250X/R250X mice. Scale bar: 10 μm. INL, inner nuclear layer; IPL, inner plexiform layer.
Figure 2—figure supplement 2
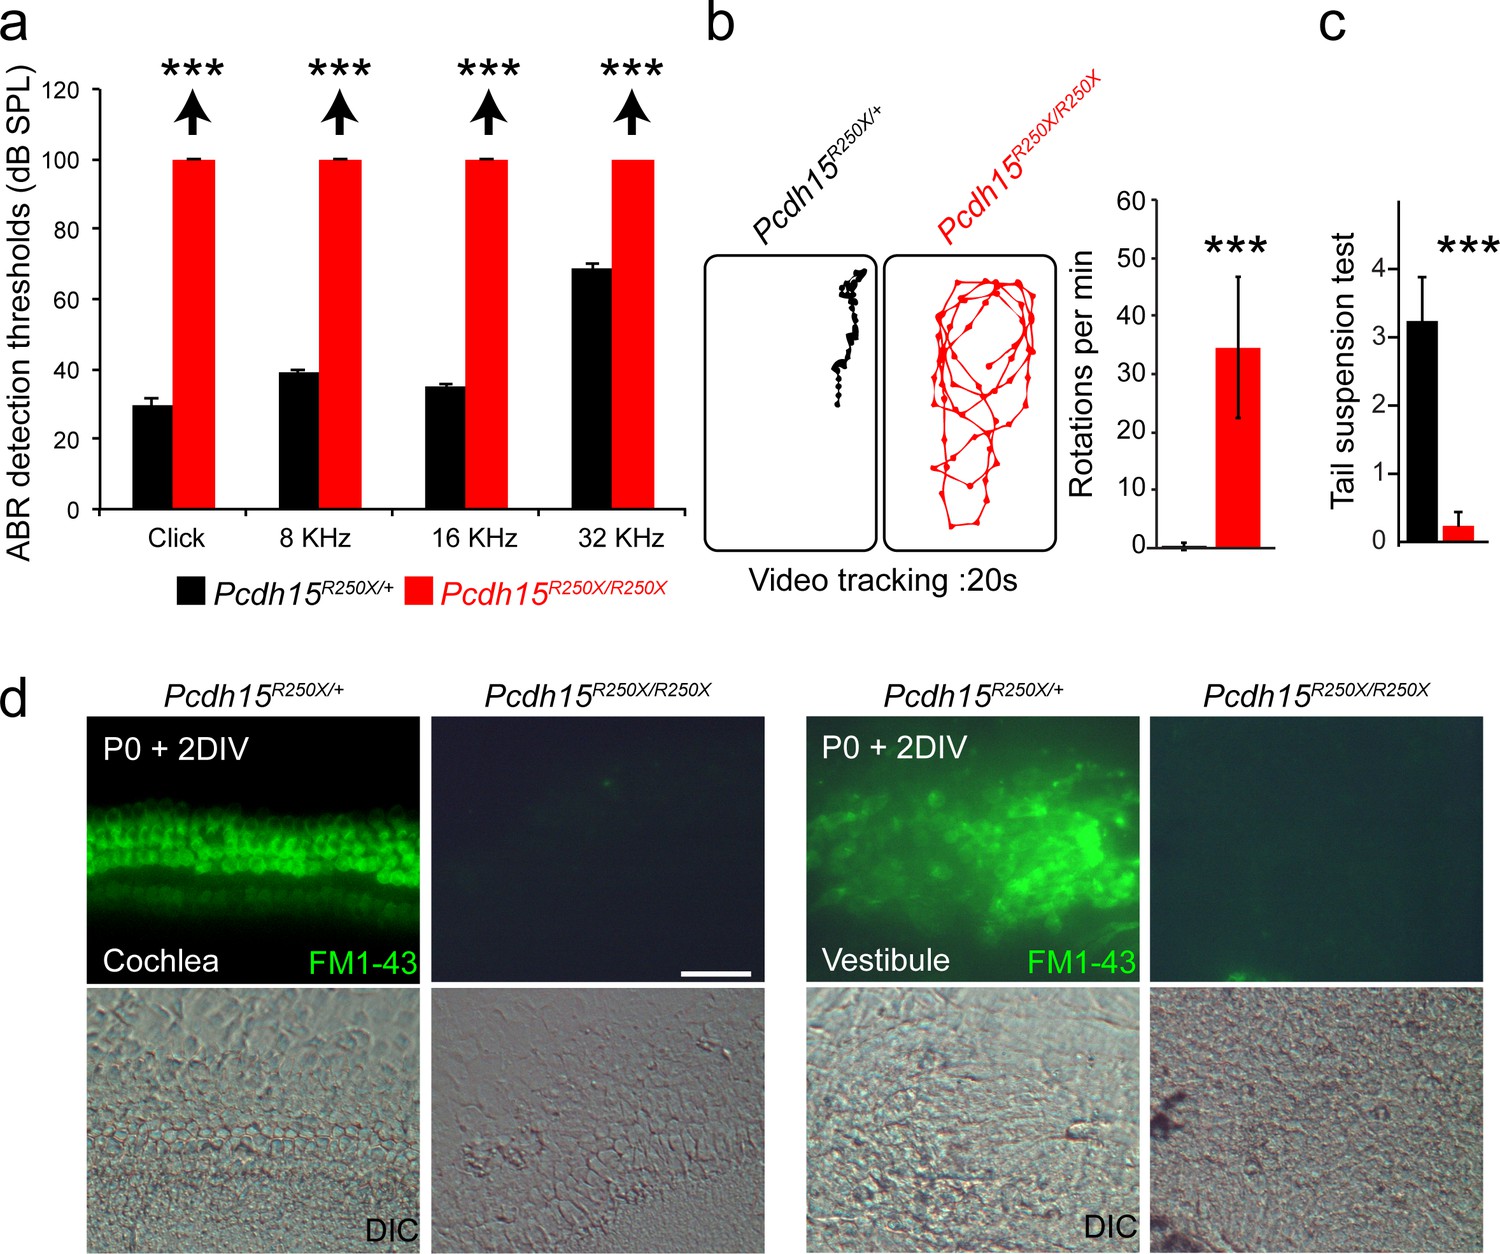
Pcdh15R250X mutant mice have profound hearing loss and severe vestibular system dysfunction.
(a) Average thresholds of acoustic brainstem response (ABR) to broadband clicks and tone-pips with frequencies of 8 kHz, 16 kHz, and 32 kHz in control (Pcdh15R250X/+; black) and mutant (Pcdh15R250X/R250X; red) mice at P16–P30 (n=4/genotype), revealed no detectable hearing in Pcdh15R250X mutants. (b) Representative open‐field exploratory behavior of a 2-month-old mouse for denoted genotypes shows increased circling behavior in mutant mice (left panels), quantified in right panel. (n=3/genotype). (c) Average score of tail-suspension test in control and mutants at P16-30, further confirms vestibular areflexia in Pcdh15R250X mutant mice. (n=4/genotype). Data are shown as mean ± SEM. (***, p<0.001) using Student’s unpaired t-test. (d) Epifluorescence micrographs and corresponding DIC micrographs of control and Pcdh15R250X/R25X cultured organ of Corti and vestibular explants imaged after exposure to 3 µM of FM1–43, a channel permeable dye, for 10 s, revealed impaired mechanotransduction function in Pcdh15R250X mutant mice. The samples were dissected at P0 and kept for 2 days in vitro (P0+2 DIV). Scale bar: 20 µm.
Figure 2—figure supplement 3
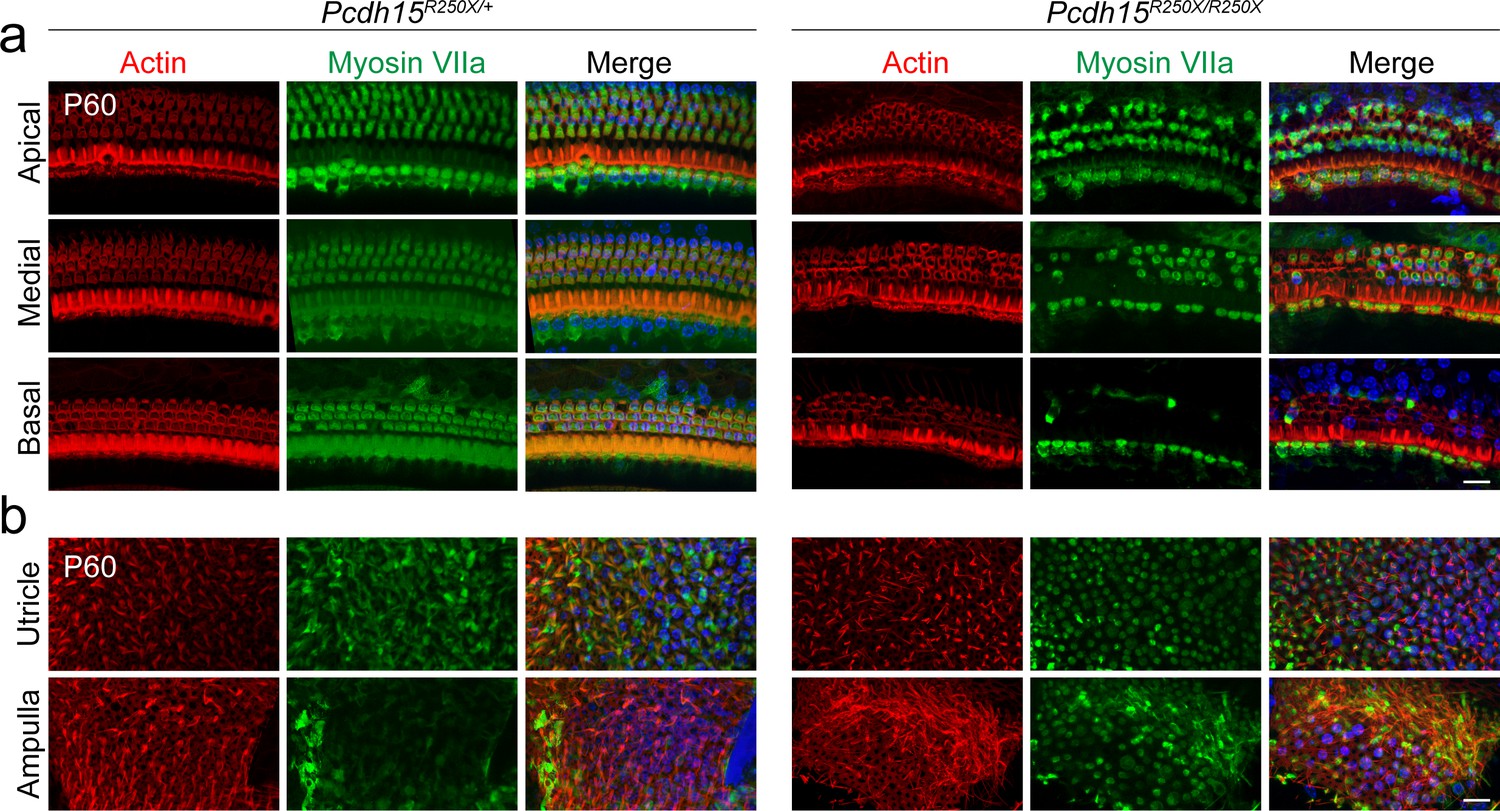
Pcdh15R250X mutant mice have degeneration of sensory hair cells in the organ of Corti (a, b).
Confocal micrographs of P60 organ of Corti (a) and vestibular end organs (b) of control (Pcdh15R250X/+) and mutant (Pcdh15R250X/R250X) mice immunostained with myosin VIIa antibody (green) and counterstained with phalloidin (red) and DAPI (blue), revealed degeneration of sensory hair cells. Medial and basal turns of the cochlea and utricle are shown. Scale bar: 10 μm.
Figure 2—figure supplement 4
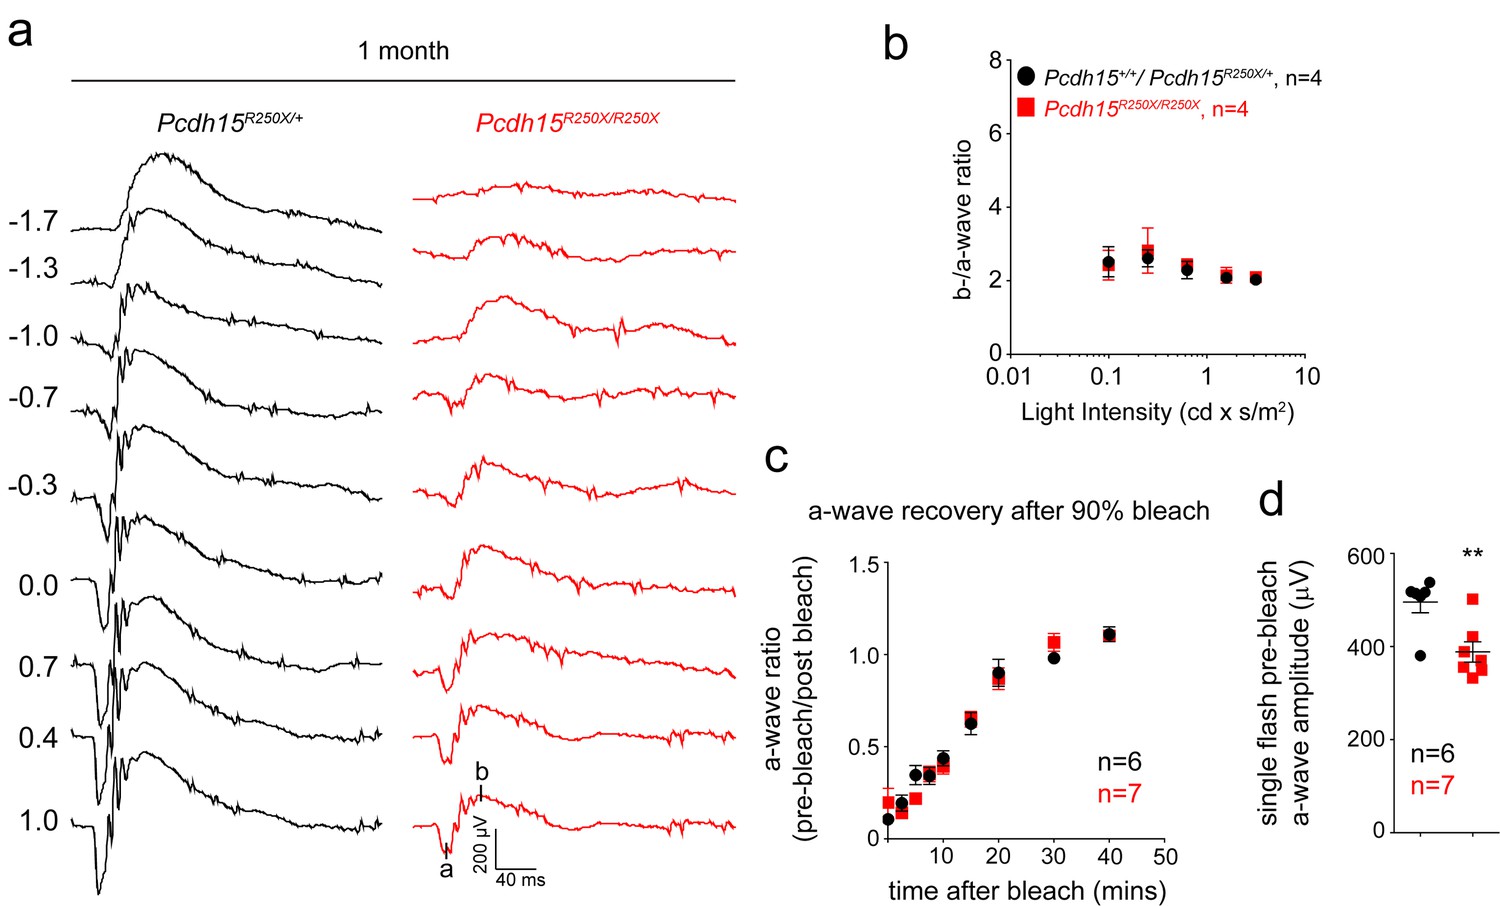
Loss of protocadherin-15 leads to retinal dysfunction in Pcdh15R250X mutant mice.
(a) Representative ERG waveforms from 1-month-old mice of the denoted genotypes show normal wave architecture with significantly reduced waveforms for mutant mice. (b) b/a ratio shows the mutant mice have a ratio comparable to control mice. (c) Recovery of scotopic ERG maximal a-wave amplitudes (a-wave ratio; mean ± SEM) after strong bleaching (estimated>90%) of rhodopsin in overnight dark-adapted control (Pcdh15R250X/+) and mutant (Pcdh15R250X/R250X) mice. Bleaching was achieved by a 45 s illumination with bright white light at time 0. (d) Quantification of single flash pre-bleach a-wave amplitudes from the same mice as shown in (c). Although the recovery of a-wave amplitude (ratio of pre-bleach to post-bleach) in both control and mutant was similar, the initial single flash a-waves were significantly reduced in mutant mice. ERG, electroretinography.
Figure 3 with 2 supplements
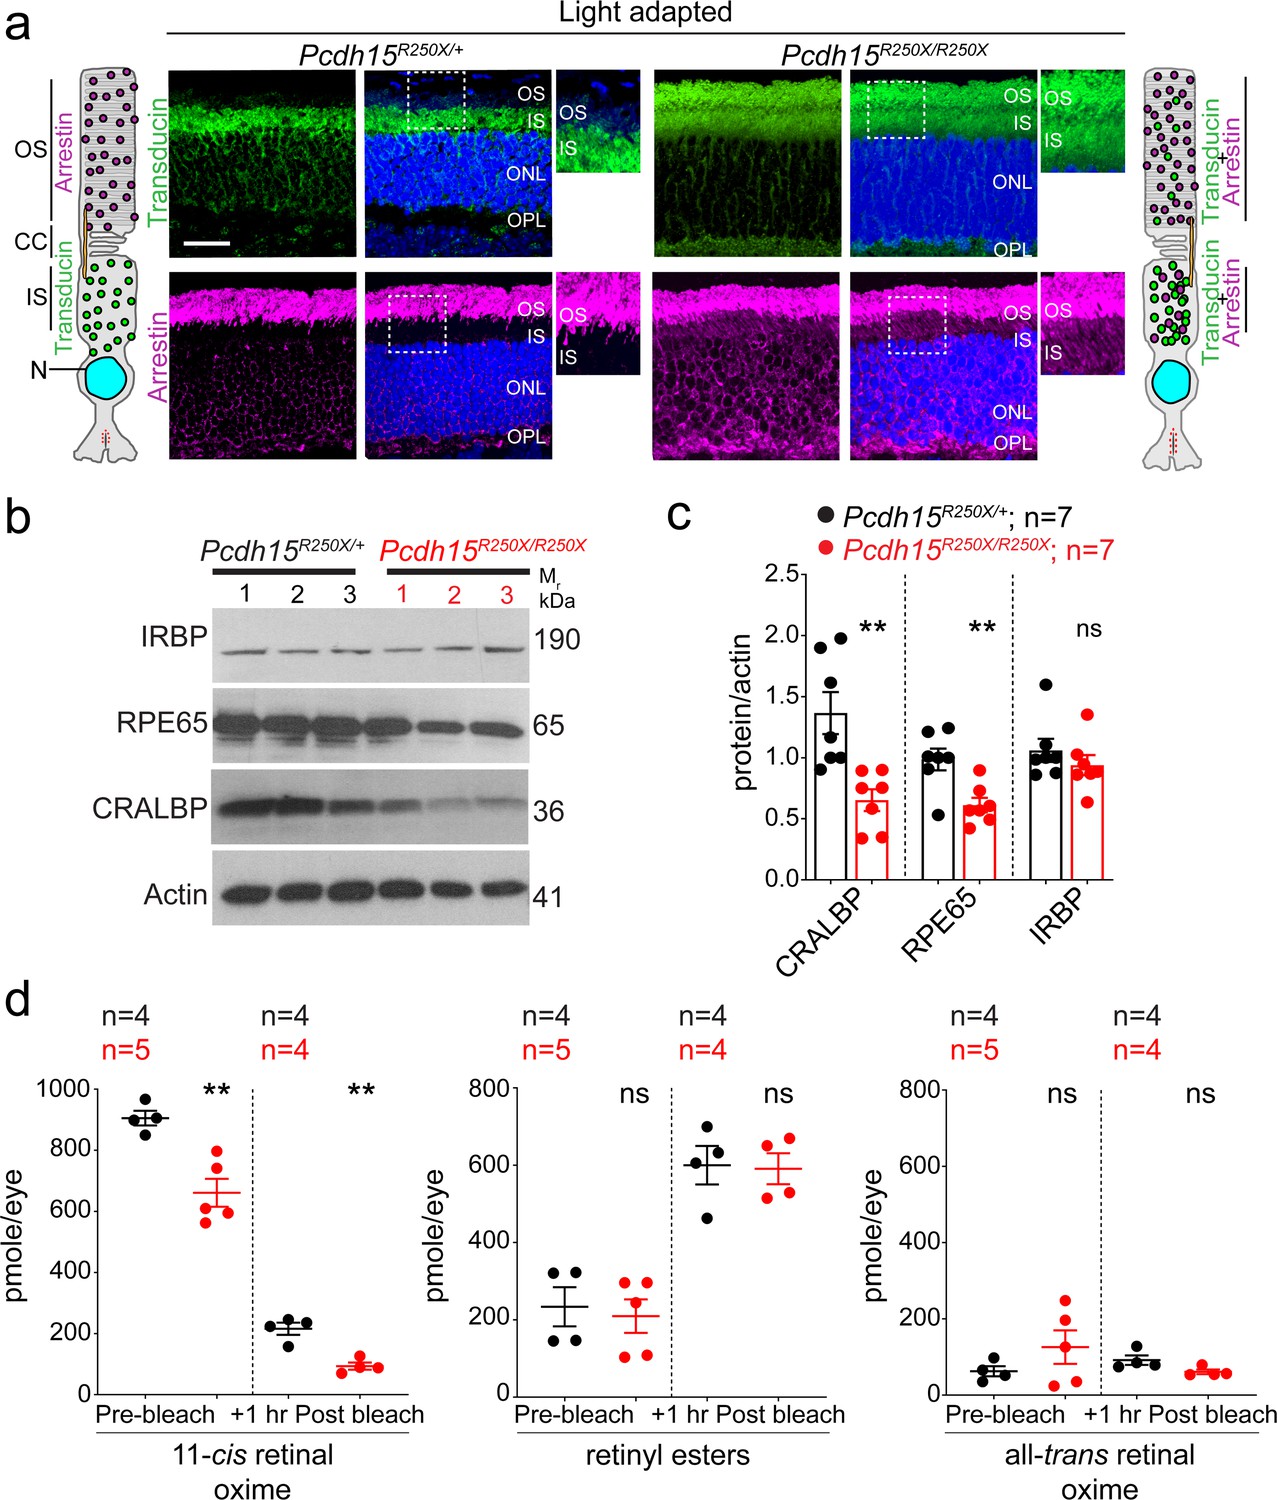
Loss of protocadherin-15 leads to aberrant localization of key proteins involved in the phototransduction cascade and retinoid cycle.
(a) Representative confocal micrographs of light-adapted retinae show mislocalization of phototransduction cascade proteins, arrestin, and transducin, to both the inner segment (IS) and outer segment (OS) in mutant mice (right panels). In control mice, transducin is correctly localized to the IS and arrestin is to the OS (left panels). A schematic of the localization of arrestin and transducin in control and mutant mice is also shown. Scale bar: 20 µm. (b, c) Immunoblot of proteins involved in the visual retinoid cycle shows reduced quantities of RPE65 and CRALBP but not IRBP, quantified in (c). (d) Quantification of indicated retinoid species from control and mutant mice shows reduced quantities of 11-cis retinal oxime. Data presented as mean ± SEM. Each data point represents an individual mouse. Student’s unpaired t-test, p<0.05 (*), p<0.01 (**). The online version of this article includes source data and the following figure supplement(s) for Figure 3. ONL, outer nuclear layer; OPL, outer plexiform layer.
Figure 3—figure supplement 1
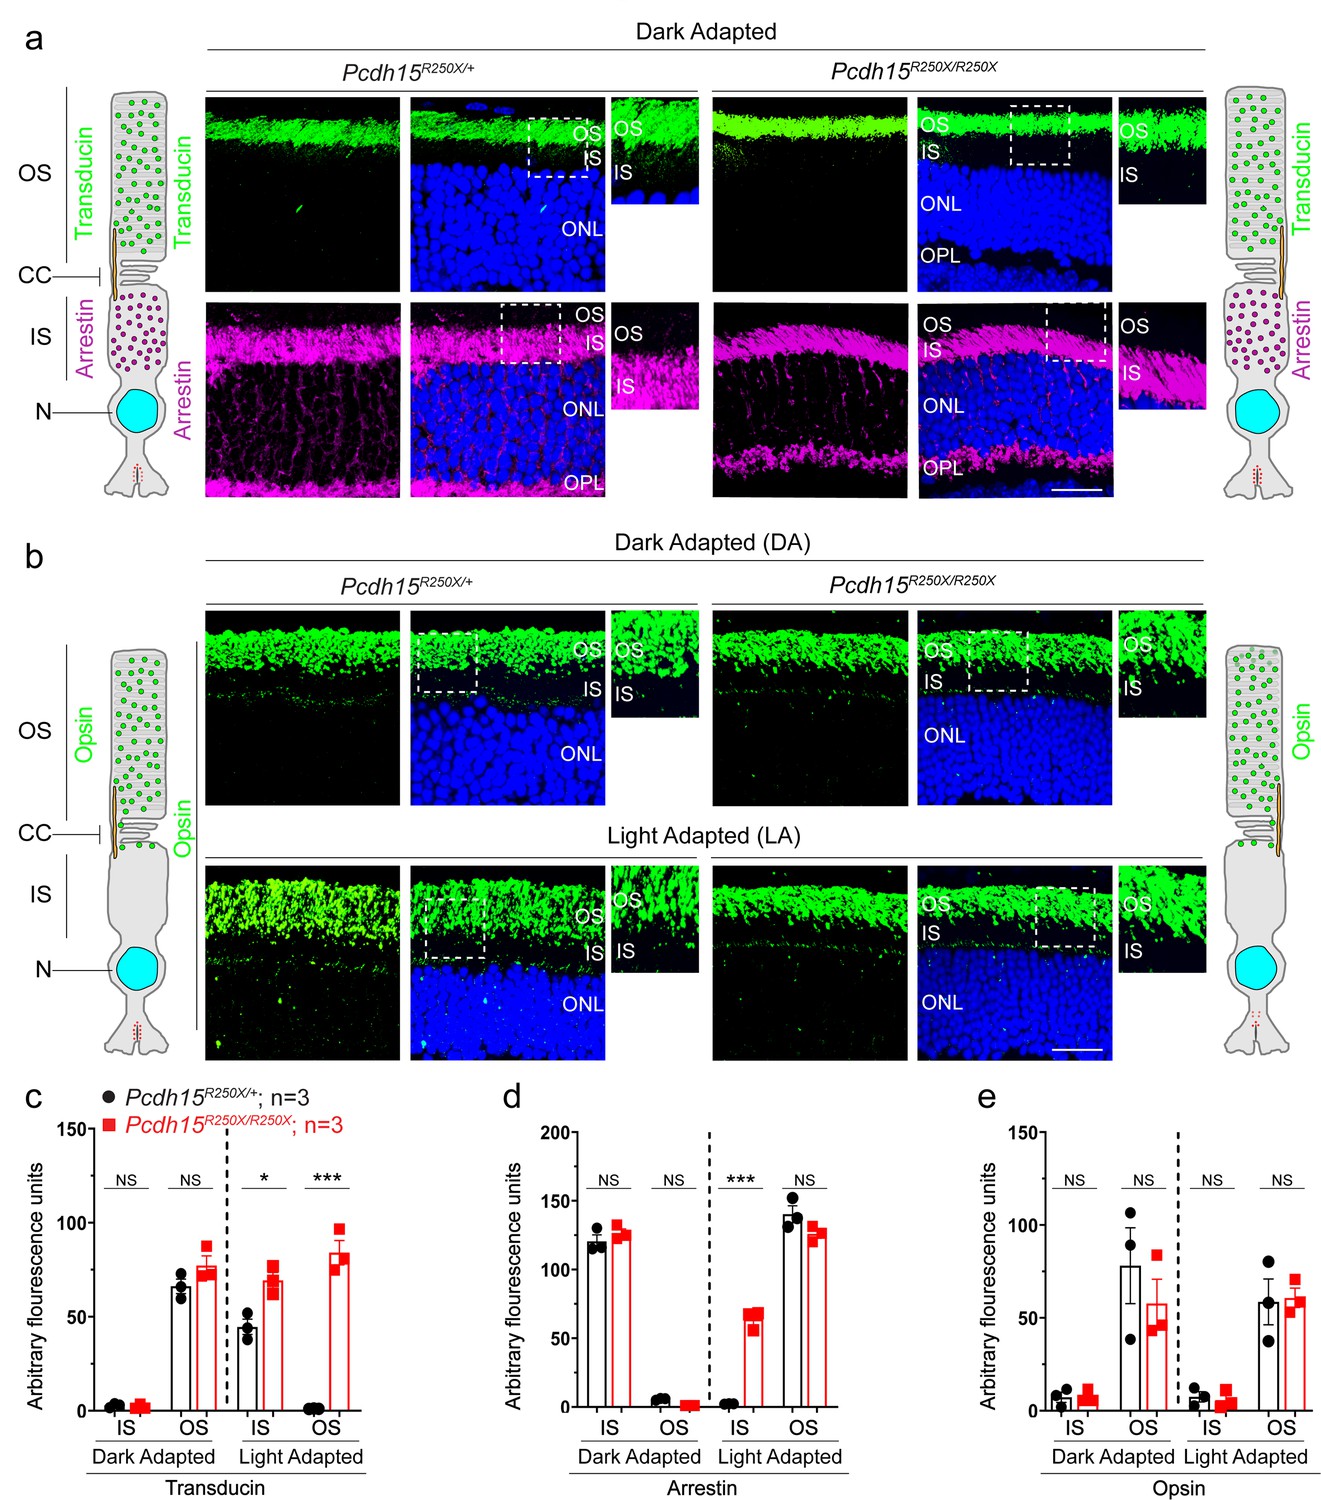
Loss of protocadherin-15 does not affect dark-adapted localization of key phototransduction cascade proteins.
(a) Representative confocal micrographs of dark-adapted retinae show the correct localization of phototransduction cascade proteins, transducin to the outer segment (OS), and arrestin to the inner segment (IS), in both control and mutant mice. Schematic of the localization of arrestin and transducin in control and mutant mice is also shown. (b) Dark-adapted (top panels) and light-adapted (bottom panels) localization of opsin is not affected by loss of protocadherin-15. Schematic of the localization of opsin in control and mutant mice is also shown. Scale bar: 20 µm. (c–e) Quantification of denoted proteins in the IS or OS for panels in (a, b) and Figure 3a shows mislocalization of transducin to the OS and arrestin to the IS in mutant mice. Student’s unpaired t-test, p<0.05 (*), p<0.001 (***). NS. not significant; ONL, outer nuclear layer, OPL, outer plexiform layer.
Figure 3—figure supplement 2
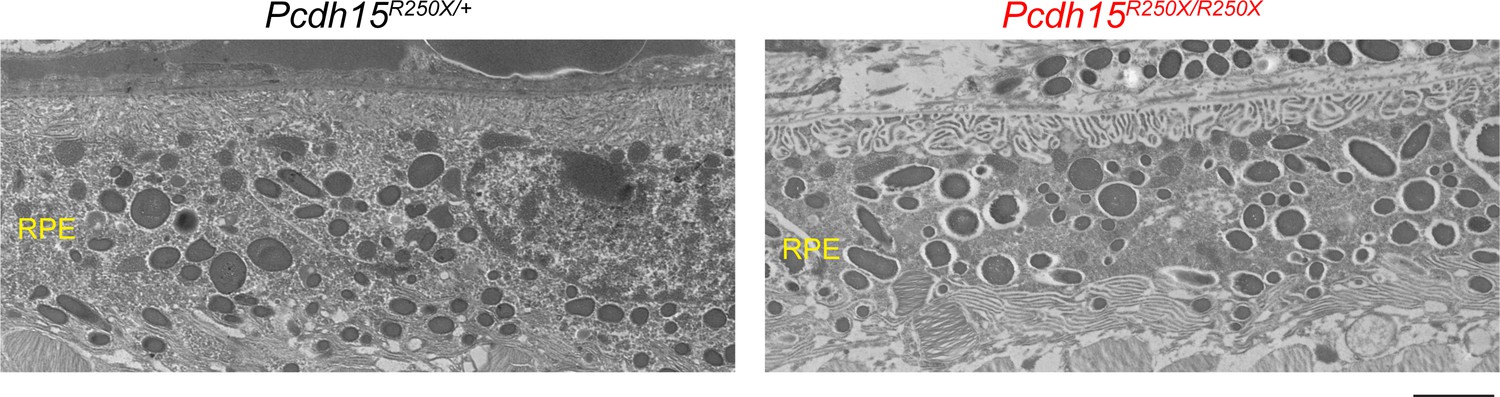
Loss of protocadherin-15 did not apparent degeneration of RPE in Pcdh15R250X/R250X mutant mice.
Transmission electron micrographs of 1–2-month-old mice of denoted genotype show normal RPE with no obvious structural abnormalities, irrespective of genotype. Scale bar: 2 µm. Data presented as mean ± SEM. Each data point represents an individual mouse. Student’s unpaired t-test, p<0.01 (**).
Figure 4 with 2 supplements
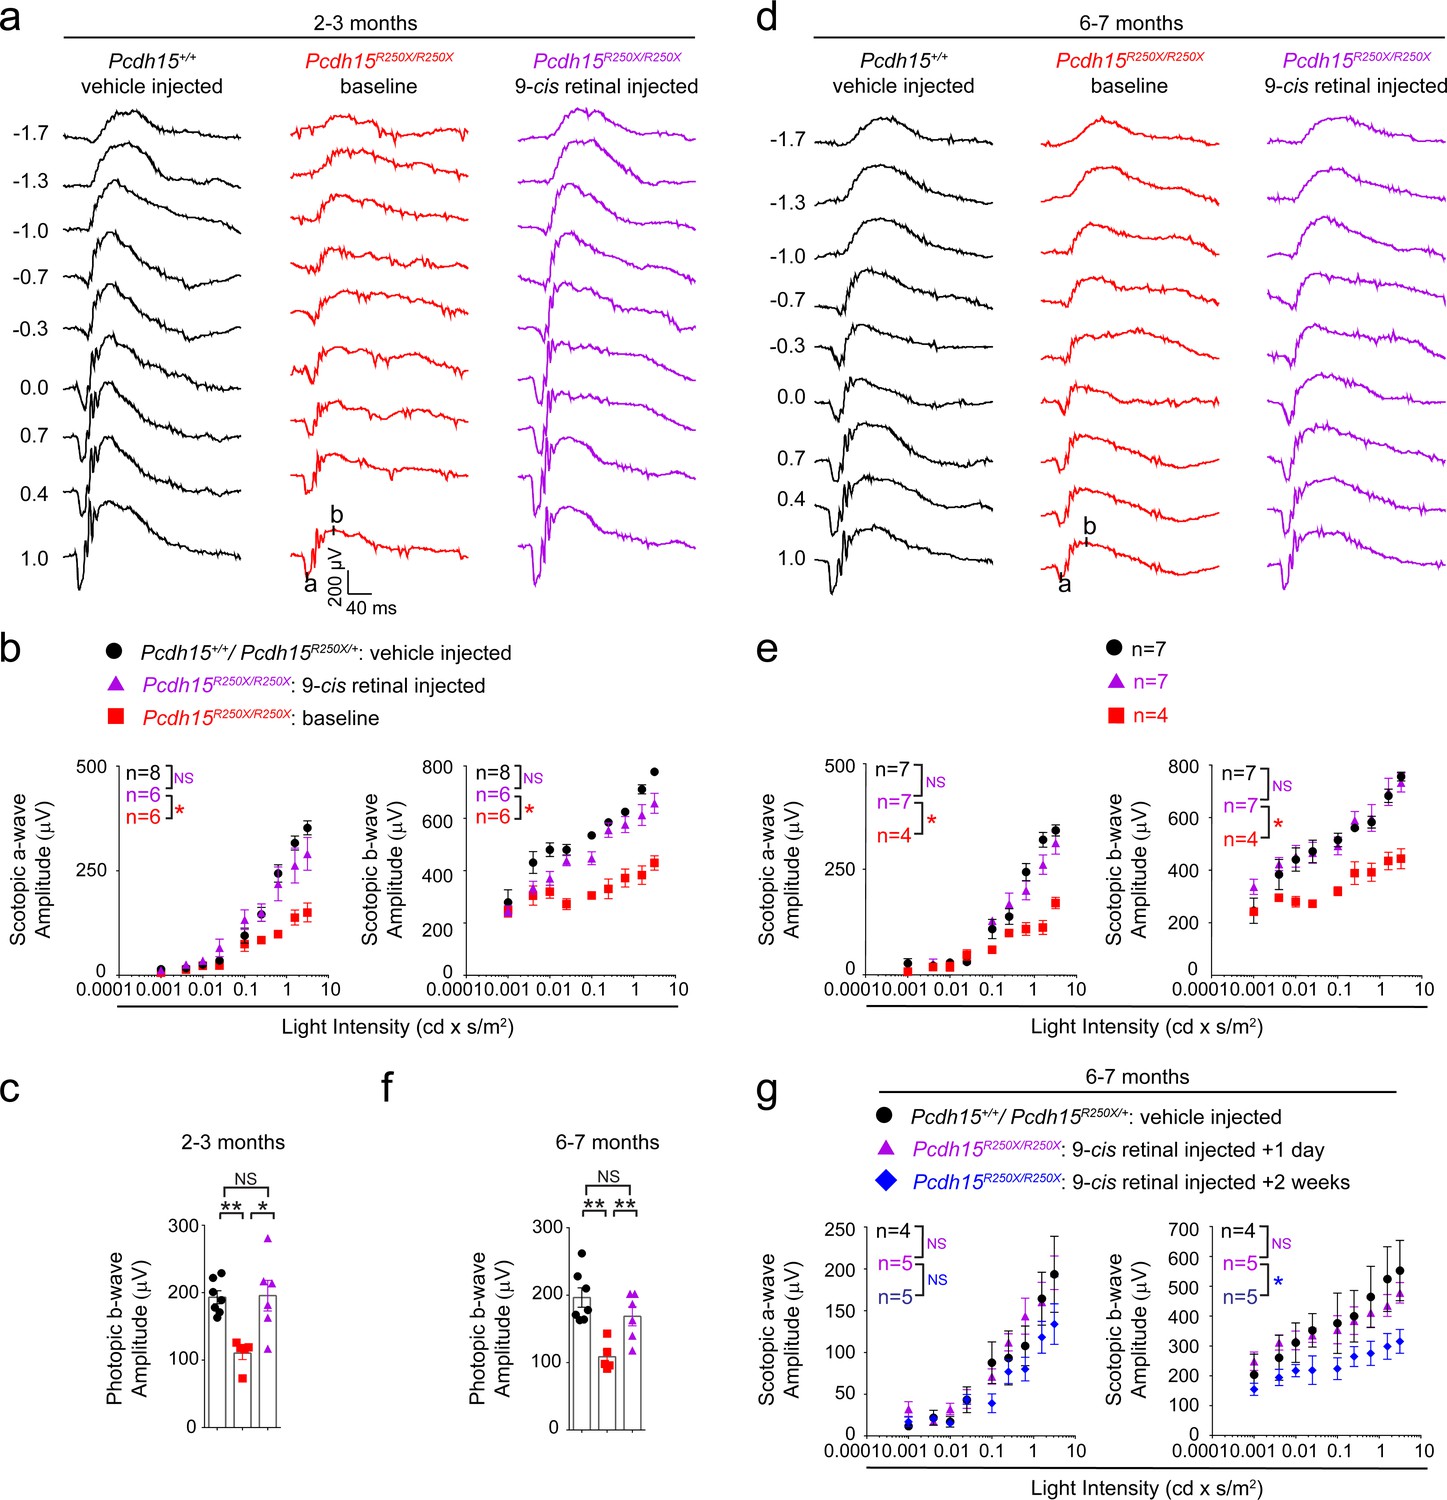
Exogenous 9-cis retinal rescues ERG deficits in young and old mutant mice.
(a, d) Representative scotopic ERG traces from young (2–3 months) (a) and old (6–7 months) (d). 9-cis retinal injected Pcdh15 mutant mice (right panels) show waveforms comparable to vehicle-injected control mice (left panels). Same Pcdh15R250X mutant mice assessed 1 week prior to 9-cis retinal injection and ERG assessment show significantly reduced waveforms (central panels, baseline). (b, e) a- (left panel) and b-wave (right panel) quantification of scotopic ERG amplitudes shown in (a) and (d), respectively. (c, f) Quantification of photopic b-wave for the denoted mice shows 9-cis retinal also improved cone-mediated function of mutant mice. (f) a- (left panel) and b-wave (right panel) quantification of scotopic ERG amplitudes for a different cohort of 6–7-month-old mice show that 2 weeks after 9-cis retinal injection in mutant mice, the efficacy starts to wane. Data presented as mean ± SEM. One-way ANOVA and Bonferroni post hoc test, p<0.05 (*) or p<0.001 (***). NS, not significant. The online version of this article includes source data and the following figure supplement(s) for Figure 4. ERG, electroretinography.
Figure 4—figure supplement 1
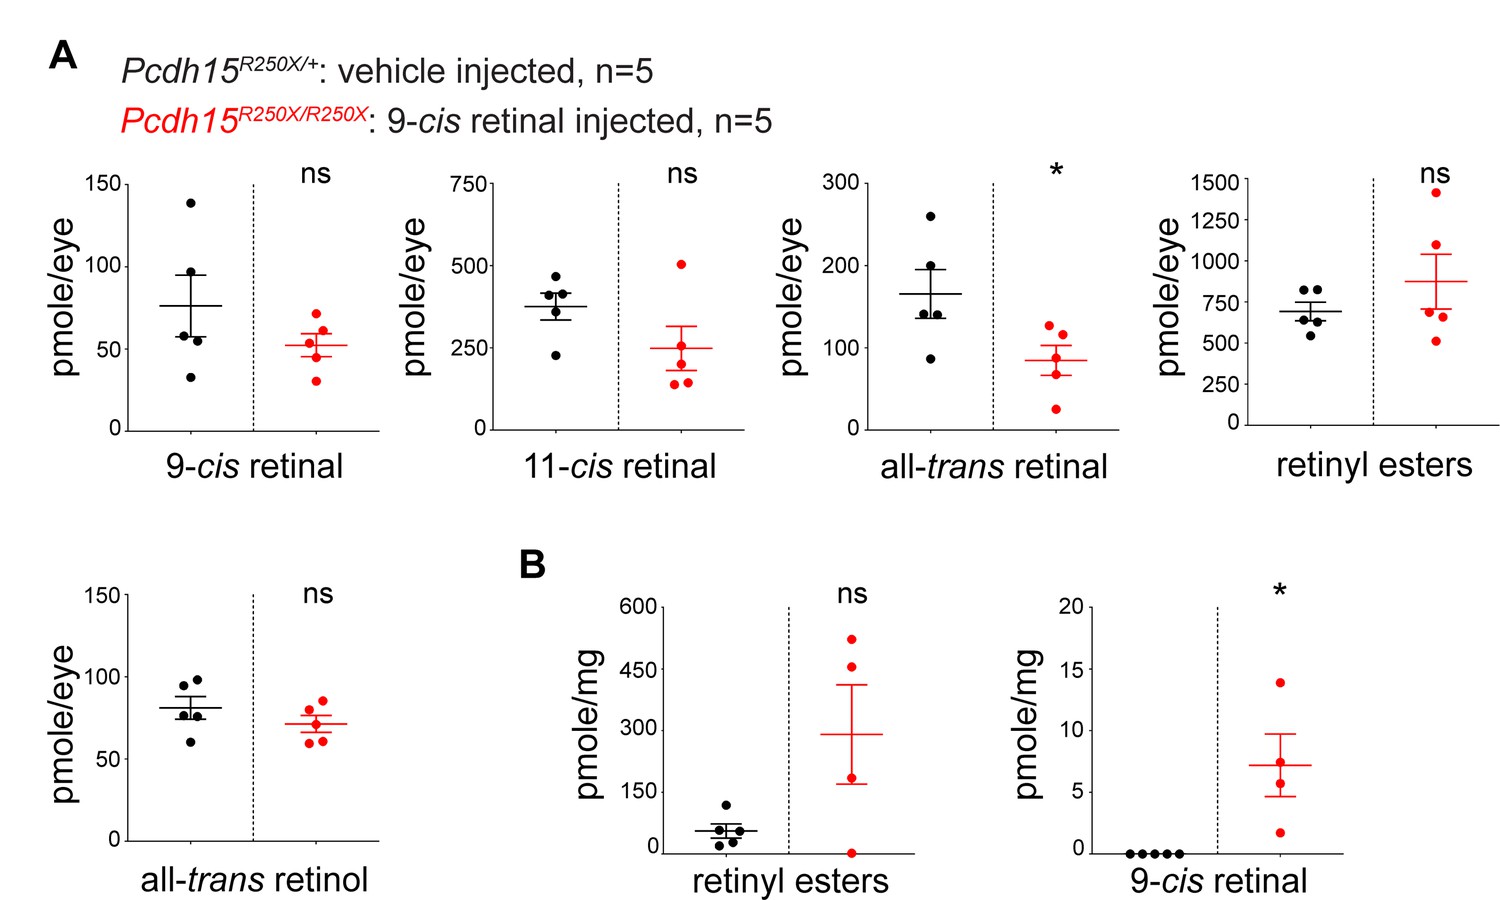
Accumulation of various retinoids in tissues following exogenous 9-cis retinal delivery.
(a) Eye and (b) liver. Student’s unpaired t-test, p<0.05 (*), ns. not significant.
Figure 4—figure supplement 2
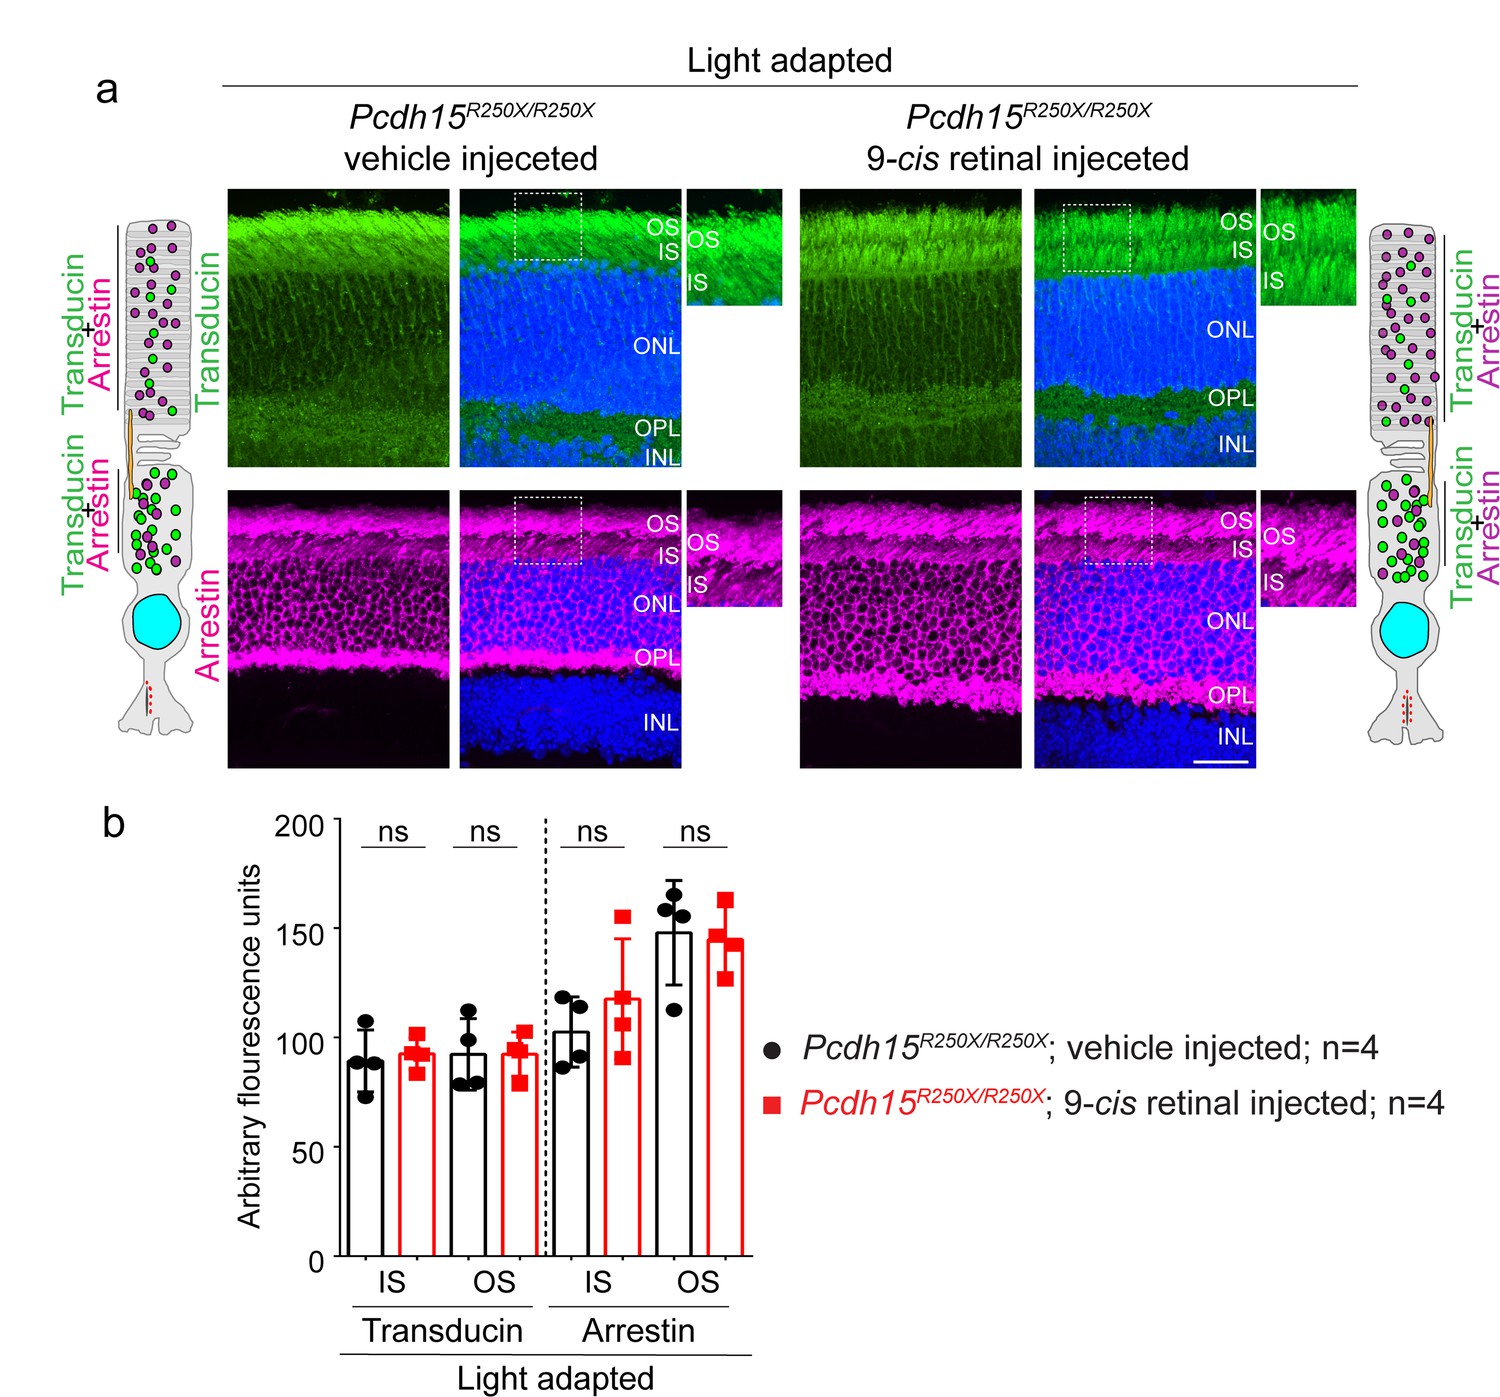
Exogenous 9-cis retinal does not improve the mislocalization of key phototransduction cascade proteins.
(a) Representative confocal micrographs of light-adapted retinae from vehicle-injected control mice (Pcdh15R250X/+), exhibit the correct localization of phototransduction cascade proteins, transducin to the outer segment (OS) and arrestin to the inner segment (IS). 9-cis retinal injected mutant mice (Pcdh15R250X/R250X) exhibit the same aberrant mislocalization of arrestin and transducin. Schematic of the localization of arrestin and transducin in control and mutant mice is also shown. Scale bar: 10 μm. (b) (Quantification of denoted proteins in the IS or the OS for panels in a). Student’s unpaired t-test, ns, not significant.
Tables
Table 1
Ophthalmic clinical manifestations of patients with biallelic PCDH15 mutations.
Eleven patients in this study are homozygous for the p.Arg245* variants while two siblings carry compound heterozygous variants, ¥p.Arg245*/p.Arg929*. Visual acuity assessments consistently show a decline between the third and fourth decade of life. Visual field loss in these subjects, shown in Table 1, further support severe retinitis pigmentosa. Macular atrophy and PSC cataract appear early and may contribute to the observed reduction in visual acuity. Optic nerve head pallor is also frequent and advanced. Normal Goldmann Visual Field Perimetry horizontal diameters are in the range of: V4e—150–160°, I4e—130–140°, and I1e—20–30°. BCVA: Best-Corrected Visual Acuity, OD: right eye, OS: left eye, HM: Hand Motion visual acuity, LP: Light Perception, HVF: Humphrey Visual Field, PSC: Posterior Subcapsular Cataract, NS: Nuclear Sclerosis Cataract, IOL: Intraocular lens, CME: Cystoid Macular Edema, ERM: Epiretinal Membrane, RPE: Retinal Pigment Epithelium, ONH: Optic Nerve Head, ND: Not Done, N/A: Not Available.
| Age (years) | BCVA OD; OS | Visual field OD | Visual field OS | Lens | Macula | Spicules/mottling | Optic nerve | |
|---|---|---|---|---|---|---|---|---|
| LMG210 #1563 | 12 | 20/25; 20/30 | 90, ND, ND | 90, ND, ND | Clear | Normal | N/A | N/A |
| 22 | 20/40; 20/50 | 30, 0, 0 | 28, 0, 0 | Mild PSC | Pigment | Spicules | Pale | |
| 35 | HM; HM | 20, 0, 0 | 15, 0, 0 | PSC | Atrophy | Spicules | Pale +3 | |
| LMG279 #1795 | 19 | 20/25; 20/32 | 50, 15, 0 | 65, 18, 0 | PSC | Normal | Spicules | Pale |
| LMG268 #1722 | 37 | 20/30; 20/30 | 23, 14, 10 | 20, 12, 10 | PSC | Normal | Spicules | Pale |
| 50 | 20/160; 20/50 | 12, 1, 0 | 15, 2, 0 | PSC | Atrophy OD | Spicules | Pale | |
| 59 | LP; 20/500 | 0, 0, 0 | 6, 0, 0 | PSC+NS | Atrophy | Spicules | Pale | |
| 67 | LP; HM | ND | ND | PSC+NS OD; | Atrophy | Spicules | Pale | |
| IOL OS | ||||||||
| LMG178 #1463 | 25 | 20/100; 20/30 | ND | ND | Mild PSC | CME | Spicules | ONH swelling |
| 26 | 20/50; 20/40 | 30, 8, 0 | 35, 25, 0 | Mild PSC | CME | Spicules | Resolved swelling | |
| LMG200 #1539 | 8 | 20/30; 20/30 | ND | ND | N/A | N/A | N/A | N/A |
| 25 | 20/50; 20/40 | 40, 0, 0 | 40, 0, 0 | Clear | Atrophy | Spicules | Pale+1 | |
| LMG200 #1538 | 6 | 20/40; 20/30 | ND | ND | N/A | N/A | N/A | N/A |
| 22 | 20/100; 20/60 | 6, 0, 0 | 9, 0, 0 | Clear | Atrophy | Spicules | Pale+1 | |
| LMG186 #1484 | 21 | 20/30; 20/40 | HVF | HVF | Mild PSC | Normal | Spicules | Pale |
| Diameter 5° | Diameter 10° | |||||||
| LMG407 #2149 | 55 | 20/400; 20/300 | 3, 0, 0 | 5, 0, 0 | IOL OU | Atrophy | Spicules | Pale +3 |
| LMG322 #1917 | 22 | 20/60; 20/30 | 140, 30, 0 | 145, 30, 0 | Clear | CME | Spicules | Normal |
| LMG322 #1916 | 11 | 20/25; 20/25 | 110, 35, 0 | 110, 30, 0 | Clear | Normal | Spicules | Normal |
| 16 | 20/25; 20/25 | 110, 35, 0 | 110, 30, 0 | Clear | Normal | Spicules | Normal | |
| LMG125 #1221 | 12 | 20/30; 20/30 | ND | ND | Clear | CME, ERM | Spicules | Pale |
| LMG197 #1831¥ | 30 | 20/50, 20/50 | 80, 7, 0 | 100, 10, 0 | PSC | Normal | Spicules | Pale +1 |
| 38 | 20/60, 20/60 | 40, 0, 0 | 60, 4, 0 | PSC | Atrophy | Spicules | Pale +2 | |
| 50 | 20/160, 20/100 | 15, 0, 0 | 22, 0, 0 | PSC | Atrophy | Spicules | Pale +3 | |
| LMG197 #1839¥ | 27 | 20/60, 20/125 | 140, 15, 0 | 140, 15, 0 | Clear | ERM | RPE atrophy | Pale +1 |
| 37 | 20/125, 20/250 | 65, 13, 0 | 55, 10, 0 | Clear | ERM | Spicules | Pale +3 | |
| 52 | 20/250, 20/250 | 35, 12, 0 | 30, 4, 0 | PSC +1 | Atrophy | Spicules | Pale +3 |
Key resources table
| Reagent type (species) or resource | Designation | Source or reference | Identifiers | Additional information |
|---|---|---|---|---|
| Gene (mouse) | Pcdh15 | GenBank | Gene ID: 11994 | |
| Gene (human) | PCDH15 | GenBank | Gene ID: 65217 | |
| Genetic reagent (Mus musculus) | Pcdh15R250X | This paper | ||
| Antibody | Protocadherin-15 (Rabbit polyclonal) | Ahmed et al., 2003a | PB303;C-terminus | IF (1:200) |
| Antibody | Opsin (Ret-P1; mouse monoclonal) | MilliporeSigma | MAB5316 | IF (1:500) |
| Antibody | Transducin (mouse monoclonal) | Santa Cruz Biotechnology | Sc-517057 | IF (1:100) |
| Antibody | Arrestin(mouse monoclonal) | Drs. Paul Hargrave and Clay Smith, University of Florida, FA | clone C10C10 | IF (1:25) |
| Antibody | Protocadherin-15(Rabbit polyclonal) | Ahmed et al., 2006 | HL5614;N-terminus | IF (1:1200) |
| Antibody | Transducin(mouse monoclonal) | Santa Cruz Biotechnology | Sc-517057 | IF (1:100) |
| Antibody | Rhodopsin clone RET-P1(mouse monoclonal) | EMD Millipore | MAB5316 | IF (1:250) |
| Antibody | Actin clone 13E5(Rabbit polyclonal) | Cell Signaling Technology | 4970S | IF (1:200) |
| Probe | Rhodamine phalloidin | Thermo Fisher Scientific | R415 | IF (1:200) |
| Antibody | IRBP(Rabbit polyclonal) | Santa Cruz Biotechnology | Sc-25787 | WB (1:500) |
| Antibody | CRALBP(Rabbit polyclonal) | Santa Cruz Biotechnology | Sc-28193 | WB (1:1000) |
| Antibody | RPE65(Rabbit polyclonal) | Kind gift from Dr. Michael Redmond, National Institutes of Health, Bethesda, MD | – | WB (1:100) |
| Chemical compound, drug | 9-cis retinal | Sigma-Aldrich | R5754 | |
| Commercial assay or kit | ECL Prime Western Blotting System | Thermo Fisher Scientific | 32,106 | |
| Other | FM1-43 | Thermo Fisher Scientific | T3163 | Dye |
| Other | Chaps Hydrate ≥98% (HPLC) | Sigma-Aldrich | SIG-C3023-25G | Detergent |
Additional files
-
Transparent reporting form
- https://cdn.elifesciences.org/articles/67361/elife-67361-transrepform1-v1.docx
-
Source data 1
Data for all figures and figure supplements.
- https://cdn.elifesciences.org/articles/67361/elife-67361-supp1-v1.xlsx
Download links
A two-part list of links to download the article, or parts of the article, in various formats.
Downloads (link to download the article as PDF)
Open citations (links to open the citations from this article in various online reference manager services)
Cite this article (links to download the citations from this article in formats compatible with various reference manager tools)
Proposed therapy, developed in a Pcdh15-deficient mouse, for progressive loss of vision in human Usher syndrome
eLife 10:e67361.
https://doi.org/10.7554/eLife.67361


