Correlative all-optical quantification of mass density and mechanics of subcellular compartments with fluorescence specificity
- Biotechnology Center, Center for Molecular and Cellular Bioengineering, Technische Universität, Germany
- Max Planck Institute for the Science of Light and Max-Planck-Zentrum für Physik und Medizin, Germany
- Department of Microbiology and Cell Biology, Indian Institute of Science, India
- Translational Neurodegeneration Section "Albrecht Kossel", University Rostock, and German Center for Neurodegenerative Diseases (DZNE), Germany
- Physics of Life, Technische Universität Dresden, Germany
Figures
Figure 1 with 1 supplement

Combined fluorescence, optical diffraction tomography (ODT), and Brillouin microscopy.
(a) Optical setup. The beam paths for epifluorescence/brightfield imaging, ODT, and Brillouin microscopy are shown in light yellow, dark green, and light green, respectively. The laser light illuminating the sample is collimated in ODT mode and focused in Brillouin mode. A moveable mirror enables to switch between the two modes. The Brillouin scattered light is guided to the spectrometer by a single-mode fiber, which acts as confocal pinhole. The light transmitted through the sample interferes with a reference beam. AOM, acousto-optic modulator; CL, cylindrical lens; LED, light-emitting diode; VIPA, virtually imaged phased array. (b–e) Quantitative and spatially resolved maps of a cell phantom consisting of a polydimethylsiloxane (PDMS) bead (indicated by the white arrows) inside a polyacrylamide (PAA) bead stained with Alexa 488 (green fluorescence in b) acquired with the FOB microscope. (b) Epifluorescence intensities, (c) refractive indices, (d) Brillouin shifts, and (e) calculated longitudinal moduli. The size of the Brillouin map is 41 × 41 pixel, resulting in an acquisition duration of 30 min. Scale bars 10 µm.
Figure 1—figure supplement 1

Absolute density of a cell phantom consisting of a polydimethylsiloxane (PDMS) bead inside a polyacrylamide (PAA bead).
Scale bar 10 µm.
Figure 2 with 1 supplement
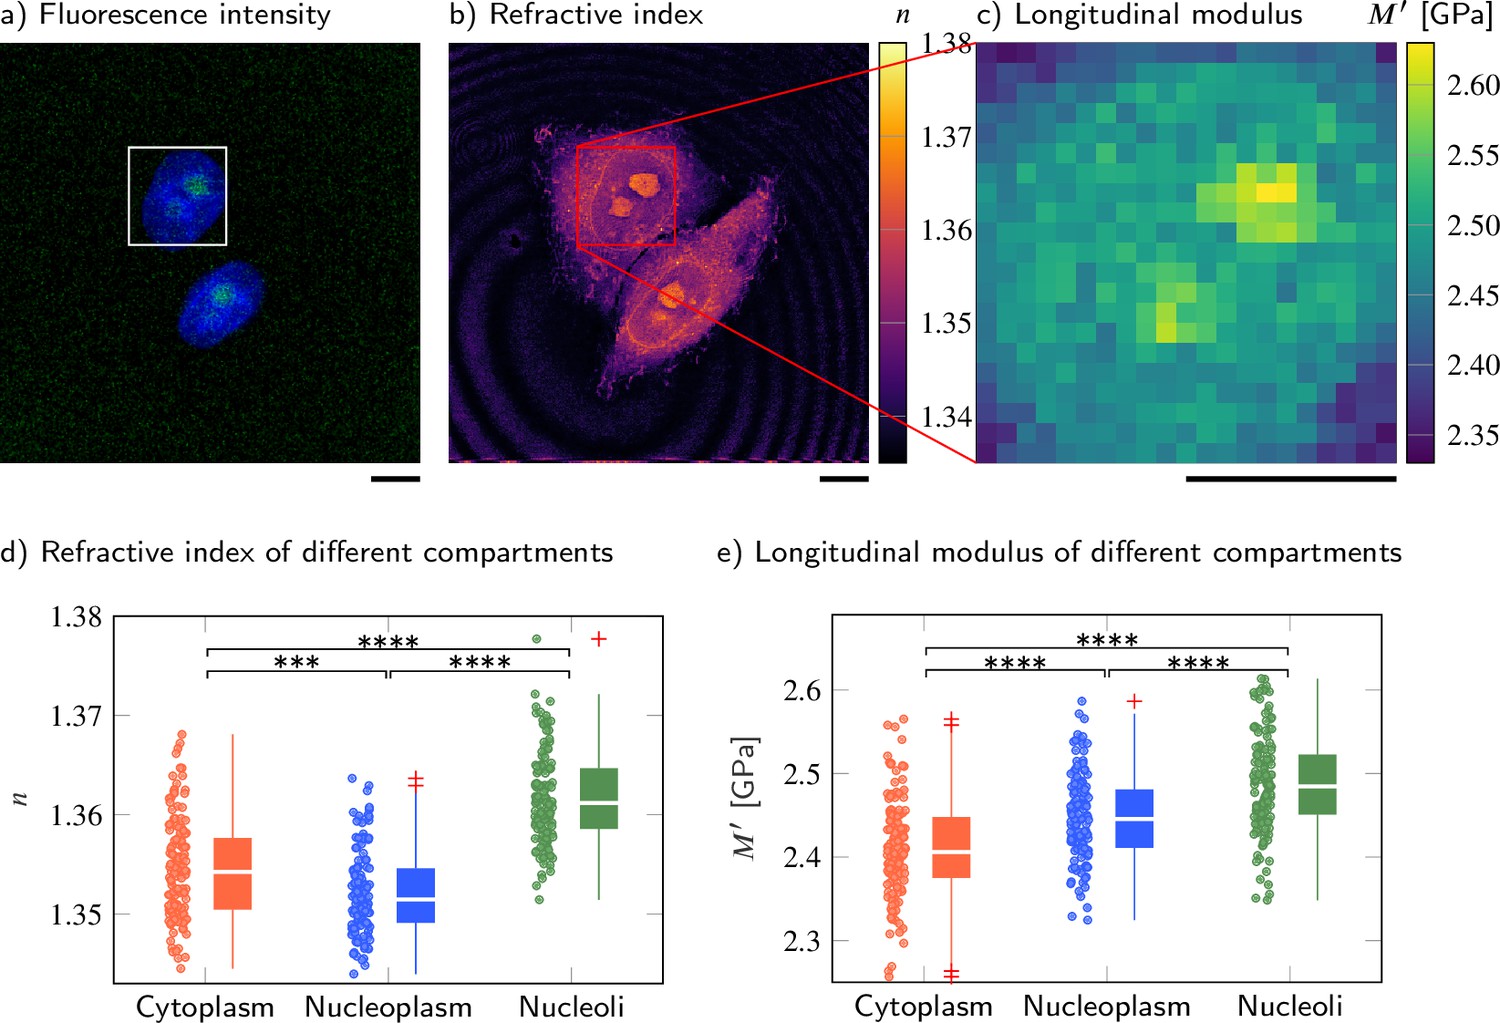
Cell nucleoplasm has lower refractive index (RI) but higher longitudinal modulus than cytoplasm.
(a–c) Representative maps of the (a) epifluorescence intensity distribution, (b) longitudinal moduli, and (c) RIs of a HeLa cell. Nuclei are stained with Hoechst (blue), and the nucleolar protein in the nucleoli is labeled with GFP (green). Quantitative analysis of (d) the RI and (e) the calculated longitudinal modulus taking into account the Brillouin shifts, RIs, and absolute densities of 139 HeLa cells. The size of the Brillouin map is 21 × 21 pixel, resulting in an acquisition duration of 8 min . Scale bars 10 µm. ***p<0.001, ****p<0.0001.
-
Figure 2—source data 1
Refractive index, longitudinal modulus, Brillouin shift, and absolute density values of different compartments in HeLa cells.
- https://cdn.elifesciences.org/articles/68490/elife-68490-fig2-data1-v2.xlsx
Figure 2—figure supplement 1
Brillouin shift and absolute density of cytoplasm, nucleoplasm, and nucleoli in HeLa cells.
Representative maps of the (a) Brillouin shift and (b) absolute density of a HeLa cell. Quantitative analysis of (c) the Brillouin shift υB, (d) the absolute density ρ, and (e) peak linewidth ΔB. **p<0.01, ****p<0.0001. Scale bars 10 µm.
Figure 3
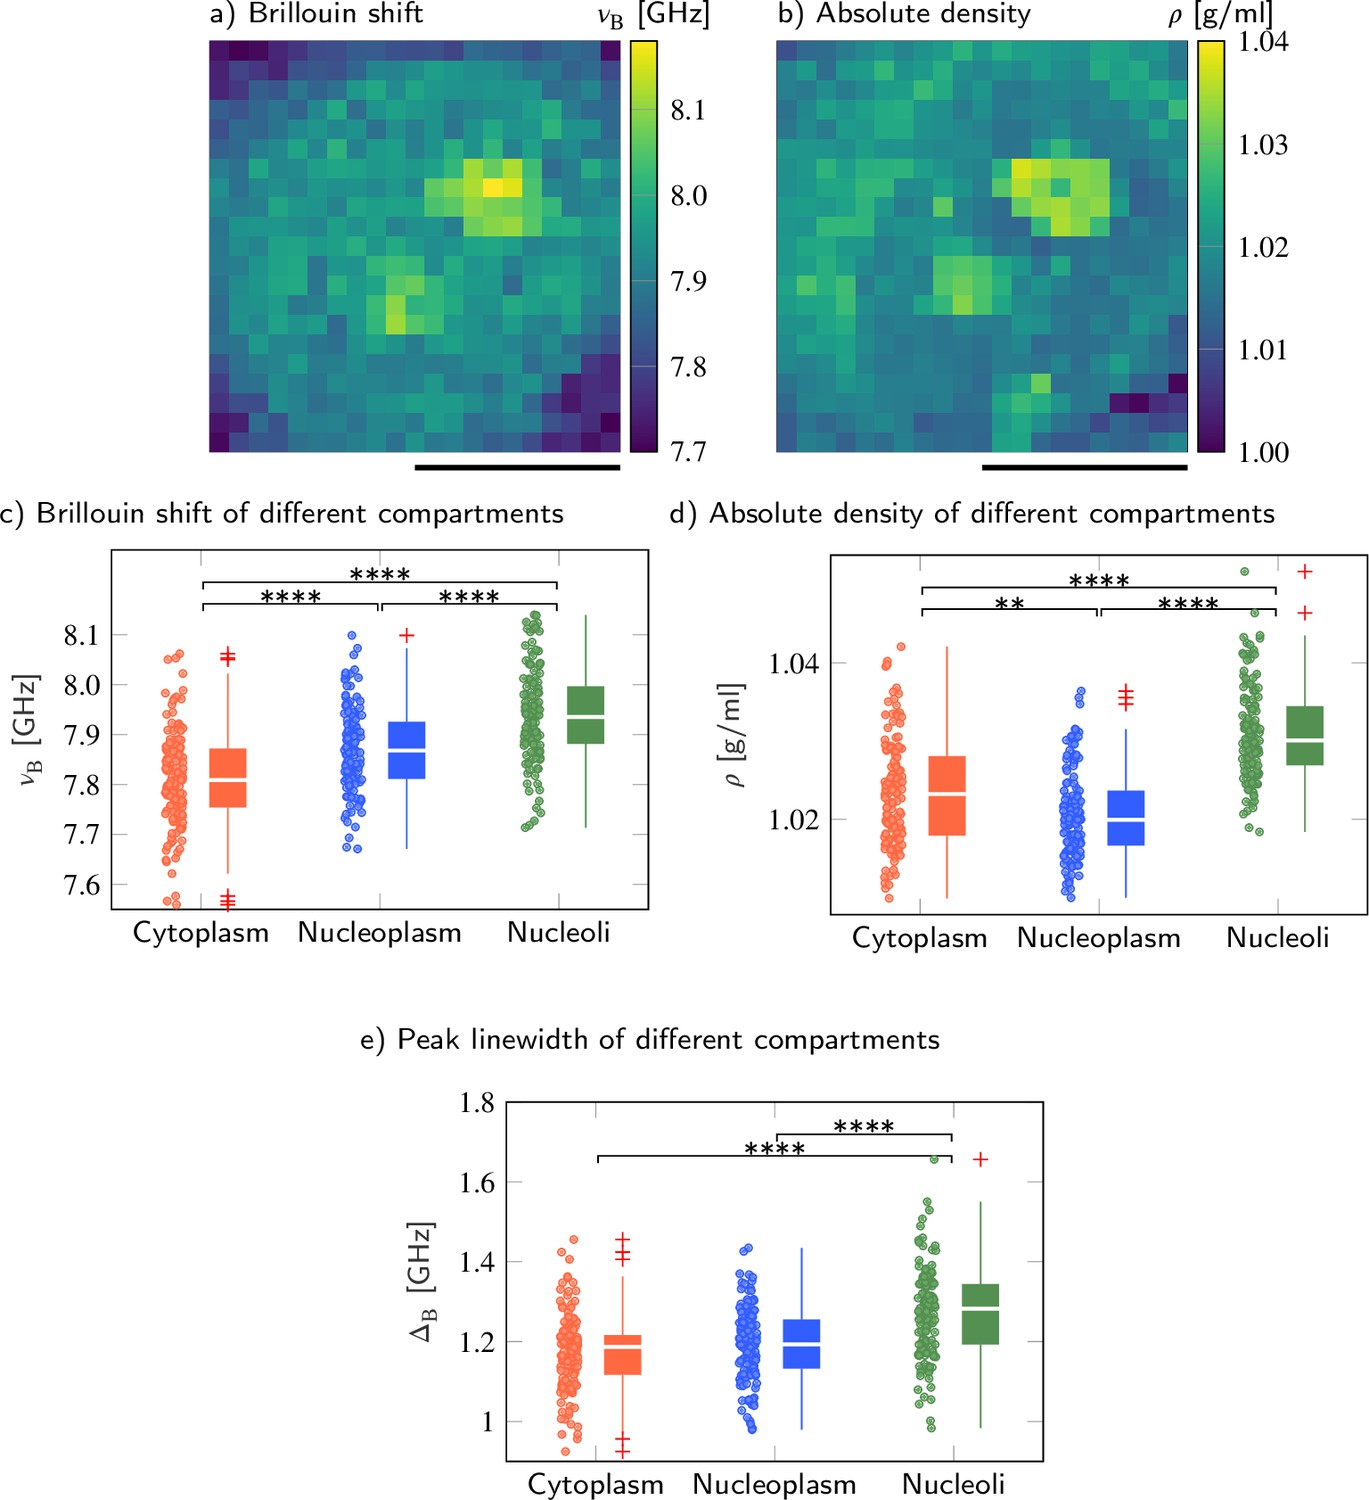
Polyglutamine (polyQ) aggregates have a higher refractive index, Brillouin shift, and longitudinal modulus than the peripheral cytoplasm.
(a–c) Representative maps of (a) the epifluorescence intensity distribution, (b) the refractive indices, and (c) the longitudinal moduli of a HeLa cell transfected with a plasmid encoding HttQ103. The polyQ aggregates are labeled with GFP (green). Quantitative analysis of (d) the refractive index, (e) the Brillouin shift, and (f) the calculated longitudinal modulus taking into account the Brillouin shifts, refractive indices, and absolute densities of 22 polyQ granules. The size of the Brillouin map is 37 × 37 pixel, resulting in an acquisition duration of 23 min. Scale bars µm. ****p<0.0001.
-
Figure 3—source data 1
Refractive index, Brillouin shift, and longitudinal modulus values of polyglutamine (polyQ) aggregates and their periphery.
- https://cdn.elifesciences.org/articles/68490/elife-68490-fig3-data1-v2.xlsx
Figure 4 with 2 supplements
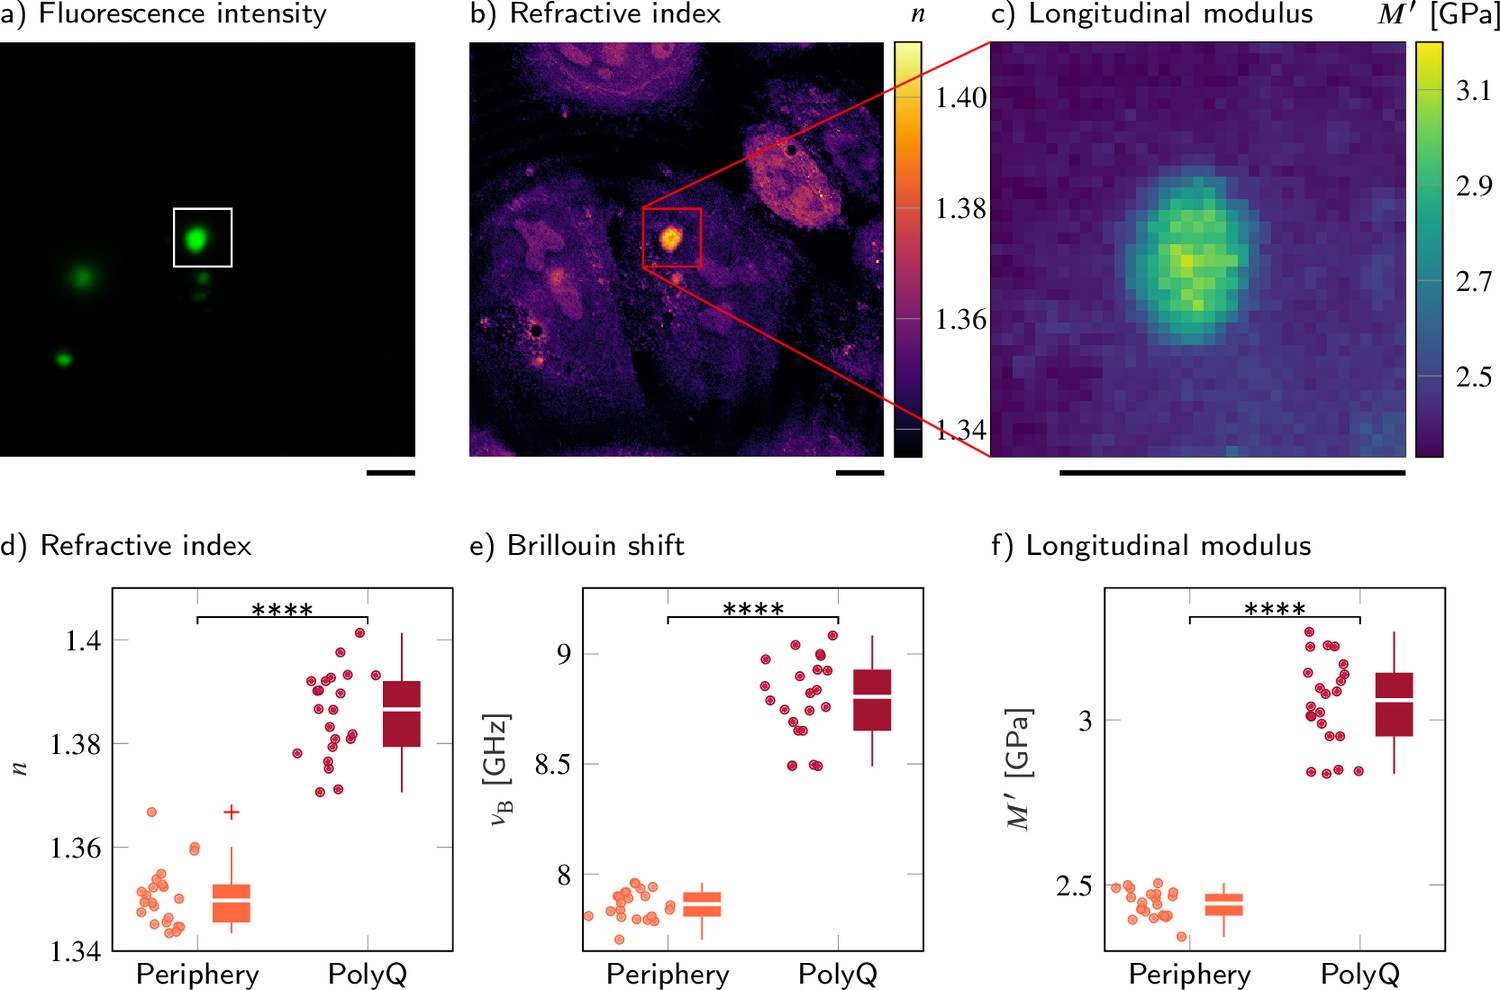
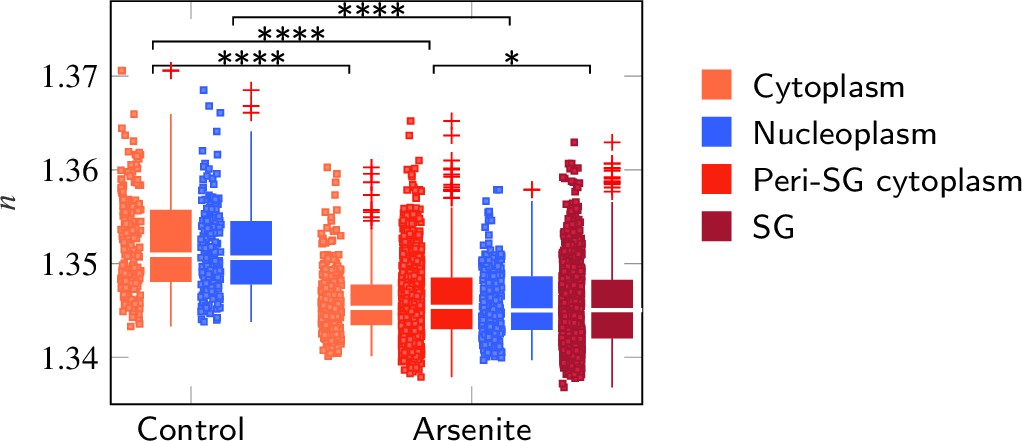
FUS-GFP-labeled stress granules induced by oxidative stress in living P525L FUS HeLa cells show a similar refractive index (RI), and longitudinal modulus as the peripheral cytoplasm.
Representative example of (a–c) the fluorescence intensity and (d−f) the RI distribution under control conditions without arsenite, with arsenite, and with arsenite after fixation, respectively. Quantitative analysis of (g) the RI and (h) the calculated longitudinal modulus taking into account the Brillouin shift and RI. Scale bars 10 µm. *p<0.05, **p<0.01, ***p<0.001, ****p<0.0001.
-
Figure 4—source data 1
Refractive index and longitudinal modulus values of cytoplasm, nucleoplasm, and stress granules (SGs) in P525L HeLa cells after different treatments.
- https://cdn.elifesciences.org/articles/68490/elife-68490-fig4-data1-v2.xlsx
Figure 4—figure supplement 1
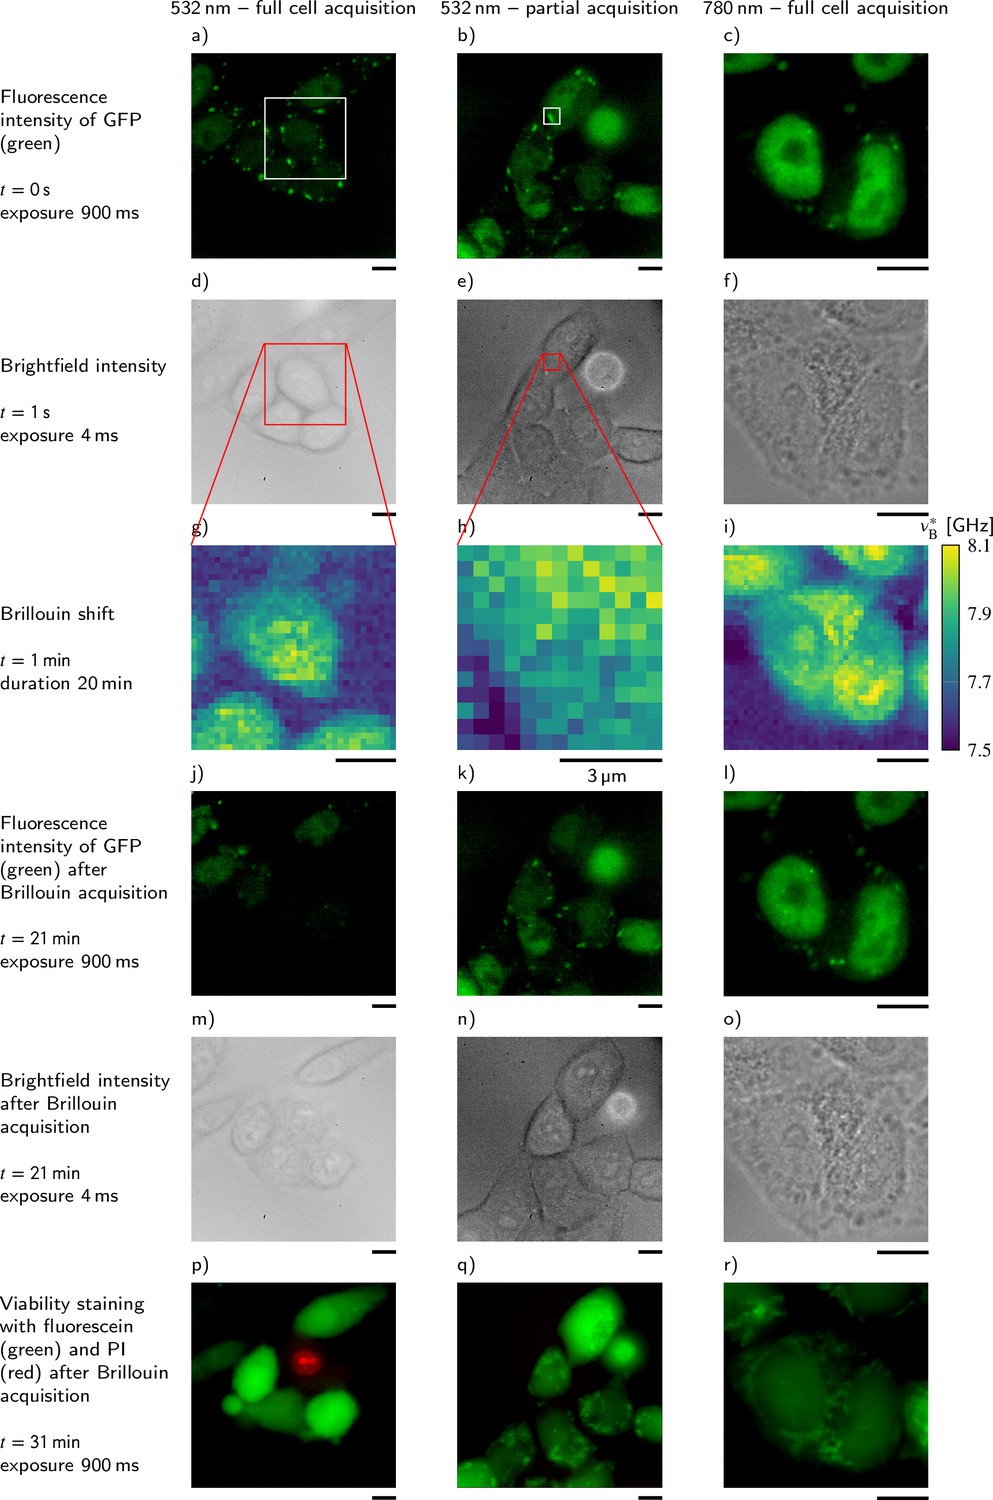
Comparison of the influence of different acquisition schemes and laser wavelengths on the viability of P525L HeLa cells that express GFP-tagged FUS.
For better comparability, the Brillouin shift υB∗ measured with the 780 nm setup is normalized to a wavelength of 532 nm. Scale bars 10 μm.
Figure 4—figure supplement 2
Evaluation of the refractive index (RI) of P525L FUS HeLa cells taking into account the complete cell.
FUS-GFP-labeled stress granules induced by oxidative stress show a similar RI as the peripheral cytoplasm. *p<0.05; ****p<0.0001.
Figure 5
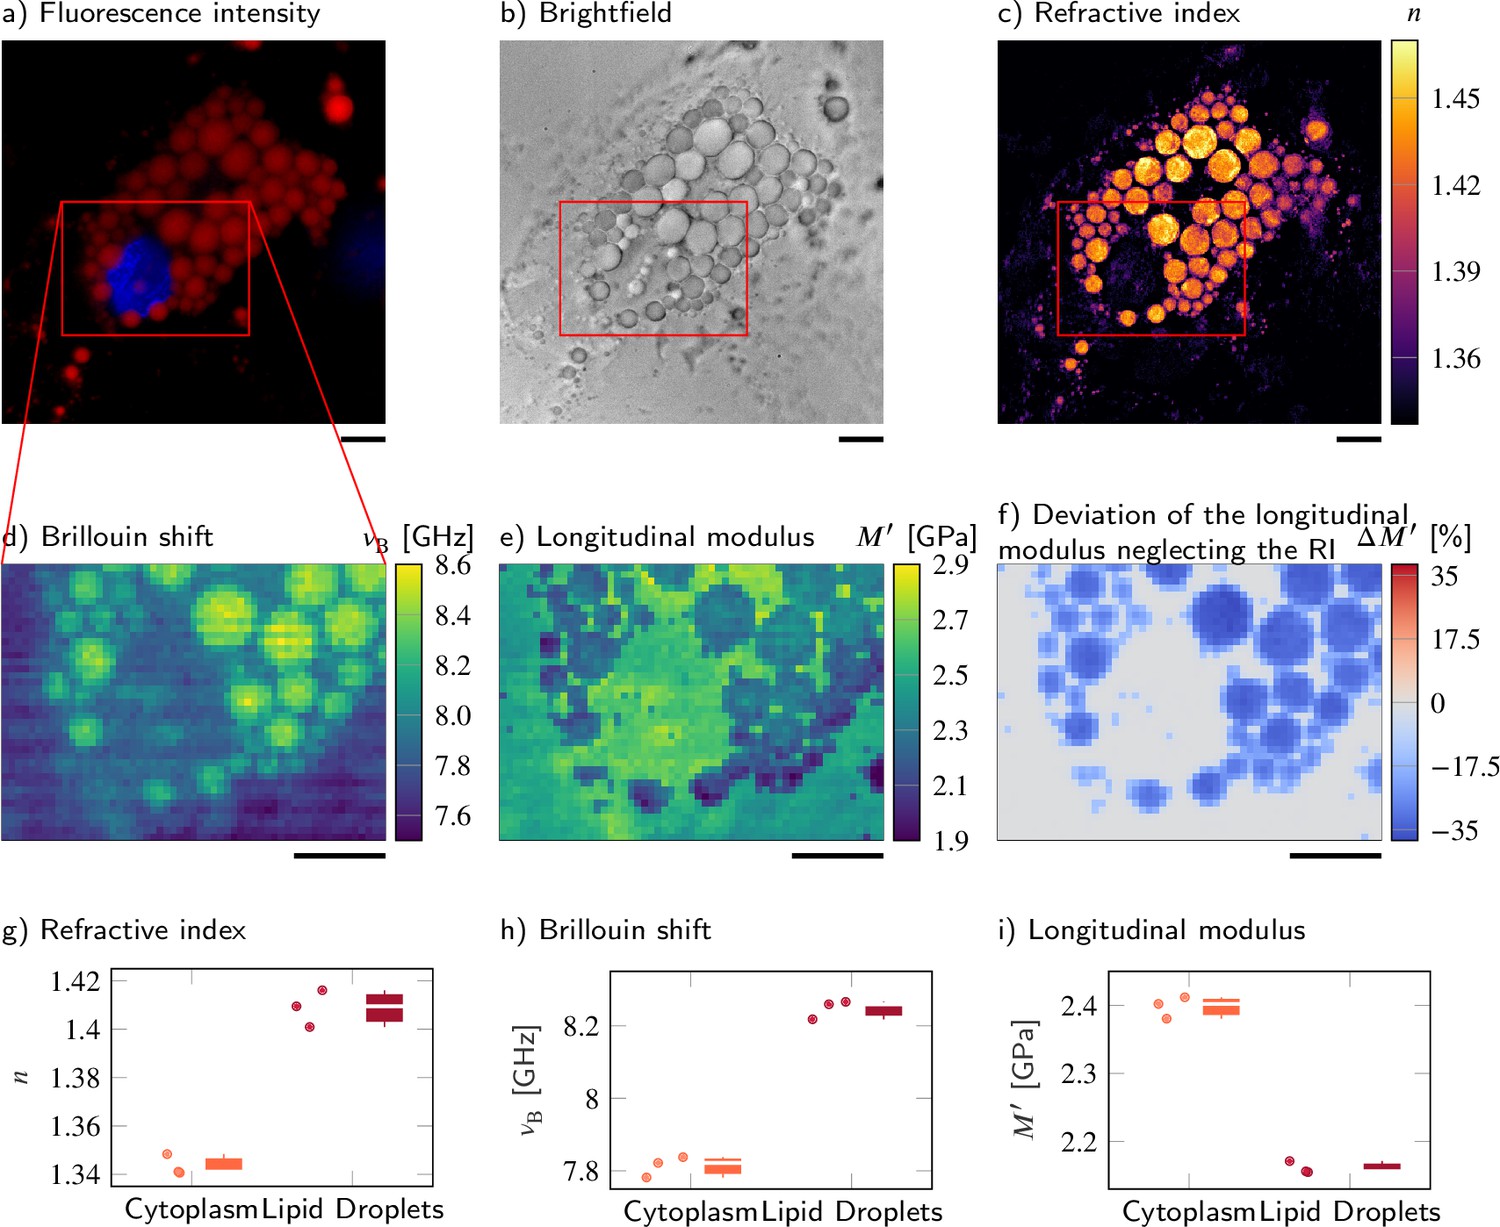
Despite a higher refractive index (RI) and Brillouin shift, the longitudinal modulus of lipid droplets is lower than that of the surrounding cytoplasm.
(a–d) Representative maps of the (a) epifluorescence intensities, (b) brightfield intensities, (c) RIs, and (d) Brillouin shifts of an adipocyte cell. The nucleus is stained with Hoechst (blue in a) and lipid droplets are stained with Nile red (red in a). (e) Longitudinal modulus calculated from the RIs, absolute densities, and Brillouin shifts. (f) Deviation of the longitudinal modulus calculated with a homogeneous RI and absolute density value when compared to the precise longitudinal modulus in (e). Quantitative analysis of (g) the RI, (h) the Brillouin shift, and (i) the calculated longitudinal modulus taking into account the Brillouin shifts, refractive indices, and absolute densities of adipocytes. The size of the Brillouin map is 57 × 41 pixel, resulting in an acquisition duration of 40 min. Scale bars 10 µm.
Additional files
-
Supplementary file 1
Average values and standard errors of the mean of the refractive index (RI) , Brillouin shift , absolute density , longitudinal modulus , and linewidth for the cytoplasm (cyto), nucleoplasm (np), and nucleoli (nl) of 139 wild-type HeLa cells.
- https://cdn.elifesciences.org/articles/68490/elife-68490-supp1-v2.docx
-
Supplementary file 2
Kruskal−Wallis p-values when comparing the refractive index (RI) , Brillouin shifts , mass densities , longitudinal moduli , and linewidths of the cytoplasm (cyto), nucleoplasm (np), and nucleoli (nl) of 139 wild-type HeLa cells, respectively.
- https://cdn.elifesciences.org/articles/68490/elife-68490-supp2-v2.docx
-
Supplementary file 3
Average values and standard errors of the mean of the refractive index (RI) , Brillouin shift , absolute density , and longitudinal modulus for the cytoplasm and polyglutamine (polyQ) aggregates of 22 wild-type HeLa cells.
- https://cdn.elifesciences.org/articles/68490/elife-68490-supp3-v2.docx
-
Supplementary file 4
Average values and standard errors of the mean of the refractive index (RI) and longitudinal modulus for different conditions and compartments of P525L HeLa cells.
- https://cdn.elifesciences.org/articles/68490/elife-68490-supp4-v2.docx
-
Transparent reporting form
- https://cdn.elifesciences.org/articles/68490/elife-68490-transrepform1-v2.pdf
Download links
A two-part list of links to download the article, or parts of the article, in various formats.
Downloads (link to download the article as PDF)
Open citations (links to open the citations from this article in various online reference manager services)
Cite this article (links to download the citations from this article in formats compatible with various reference manager tools)
Correlative all-optical quantification of mass density and mechanics of subcellular compartments with fluorescence specificity
eLife 11:e68490.
https://doi.org/10.7554/eLife.68490


