Multiple 9-1-1 complexes promote homolog synapsis, DSB repair, and ATR signaling during mammalian meiosis
- Department of Biomedical Sciences, Cornell University, United States
- Division of Mathematics and Natural Sciences, Elmira College, United States
- Department of Obstetrics and Gynecology, Brown University, United States
- Sex Chromosome Biology Laboratory, The Francis Crick Institute, United Kingdom
- Department of Molecular Biology and Genetics, Weill Institute for Cell and Molecular Biology, Cornell University, United States
- Department of Biochemistry and Immunology, FMRP, University of São Paulo, Brazil
- Division of Immunology, The Netherlands Cancer Institute, Netherlands
- Department of Human Genetics, University of Utah, United States
- Unidad de Investigación, Hospital Universitario de Canarias, Spain
- Instituto de Tecnologías Biomédicas, Universidad de La Laguna, Spain
- Universidad Fernando Pessoa Canarias, Spain
- Magee-Womens Research Institute, Department of Obstetrics, Gynecology and Reproductive Sciences, University of Pittsburgh, United States
Figures
Figure 1 with 1 supplement
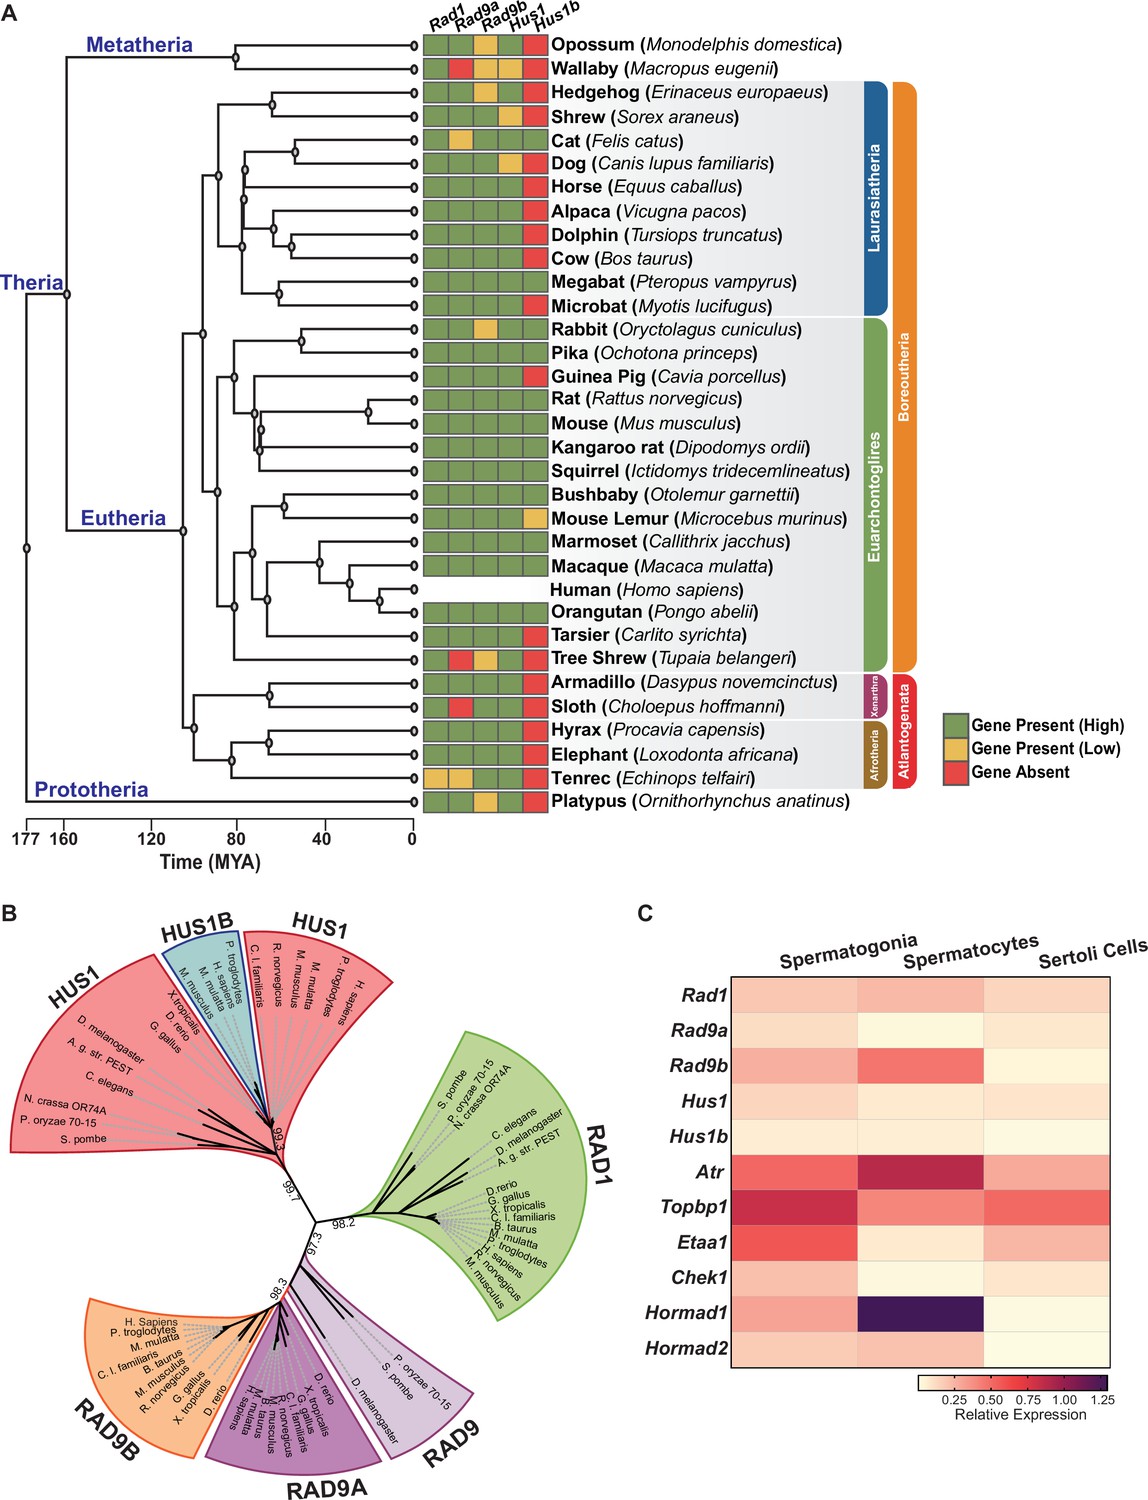
Phylogenetic analysis of 9-1-1 complex subunits.
(A) Gene presence and absence matrix of human 9-1-1 subunit ortholog genes in 33 representative mammals. High confidence was determined if the genomic sequence had ≥50% of both target and query sequence identity, and a pairwise whole genomic alignment score of ≥50 when compared to human or if the genomic region containing the gene was syntenic with human. If an ortholog did not reach the threshold, then it was annotated as low confidence (yellow). If no ortholog was found, then it was considered absent (red). A cladogram was obtained from timetree.org. (B) Maximum likelihood unrooted phylogenetic tree of 9-1-1 subunit genes based on JTT + I + G + F. Protein sequences were obtained from NCBI HomoloGene and include bacteria (Pleomorphomonas oryzae), fungi (Schizosaccharomyces pombe, Neurospora crassa), nematode (Caenorhabditis elegans), true flies (Drosophila melanogaster, Anopheles gambiae str. Pest), fish (Danio rerio), frog (Xenopus tropicalis), bird (Gallus gallus), carnivora (Canis lupus), rodents (Rattus norvegicus, Mus musculus), and primates (Homo sapiens, Mus musculus, Macaca mulatta, Pan troglodytes). Sequences were aligned by Clustal Omega, and substitution model was tested on ProtTest. Ultrafast bootstrap (×1000 replicates) was performed in IQ-TREE web server, and nodes below 70% branch support were collapsed. Branch distance represents substitution rate. The lighter purple RAD9 denotes RAD9 prior to the duplication event. (C) Heatmap of single-cell RNA-sequencing data from mouse testes was queried to assess the expression of the indicated genes in spermatogonia, spermatocytes, and Sertoli cells. Expression of Rad9b in spermatocytes, p-value ≤ 5.47e–10, Rad1 p-value ≤ 1.20e–09, Hus1b p-value ≤ 1.08e–08. Expression of Rad9a and Hus1 in spermatogonia p-value ≤ 5.61e–19; p-value ≤ 3.78e–09. Relative expression is shown for each gene, with highest expression observed in purple and lowest expression observed in yellow.
-
Figure 1—source data 1
Phylogenetic analysis of the 9-1-1 complexes.
Data in this source file was used for Figure 1B.
- https://cdn.elifesciences.org/articles/68677/elife-68677-fig1-data1-v1.txt
-
Figure 1—source data 2
Gene expression analysis in mouse testes.
Relative expression of 9-1-1 complex subunits and genes involved in ATR signaling. These data were used for Figure 1C. Original data are accessible through GEO series accession number GSE121904.
- https://cdn.elifesciences.org/articles/68677/elife-68677-fig1-data2-v1.xlsx
-
Figure 1—source data 3
tSNE plots showing single-cell RNA expression of 9-1-1 complex subunits in testes.
These data were used to create tSNE plots for Figure 1—figure supplement 1B–D. Source code is available at https://github.com/nyuhuyang/scRNAseq-SSCs (copy archived at swh:1:rev:9e17b2b7a8871b9aa4f506fdb723f637fc9f0b2c, Hu, 2022).
- https://cdn.elifesciences.org/articles/68677/elife-68677-fig1-data3-v1.pdf
Figure 1—figure supplement 1
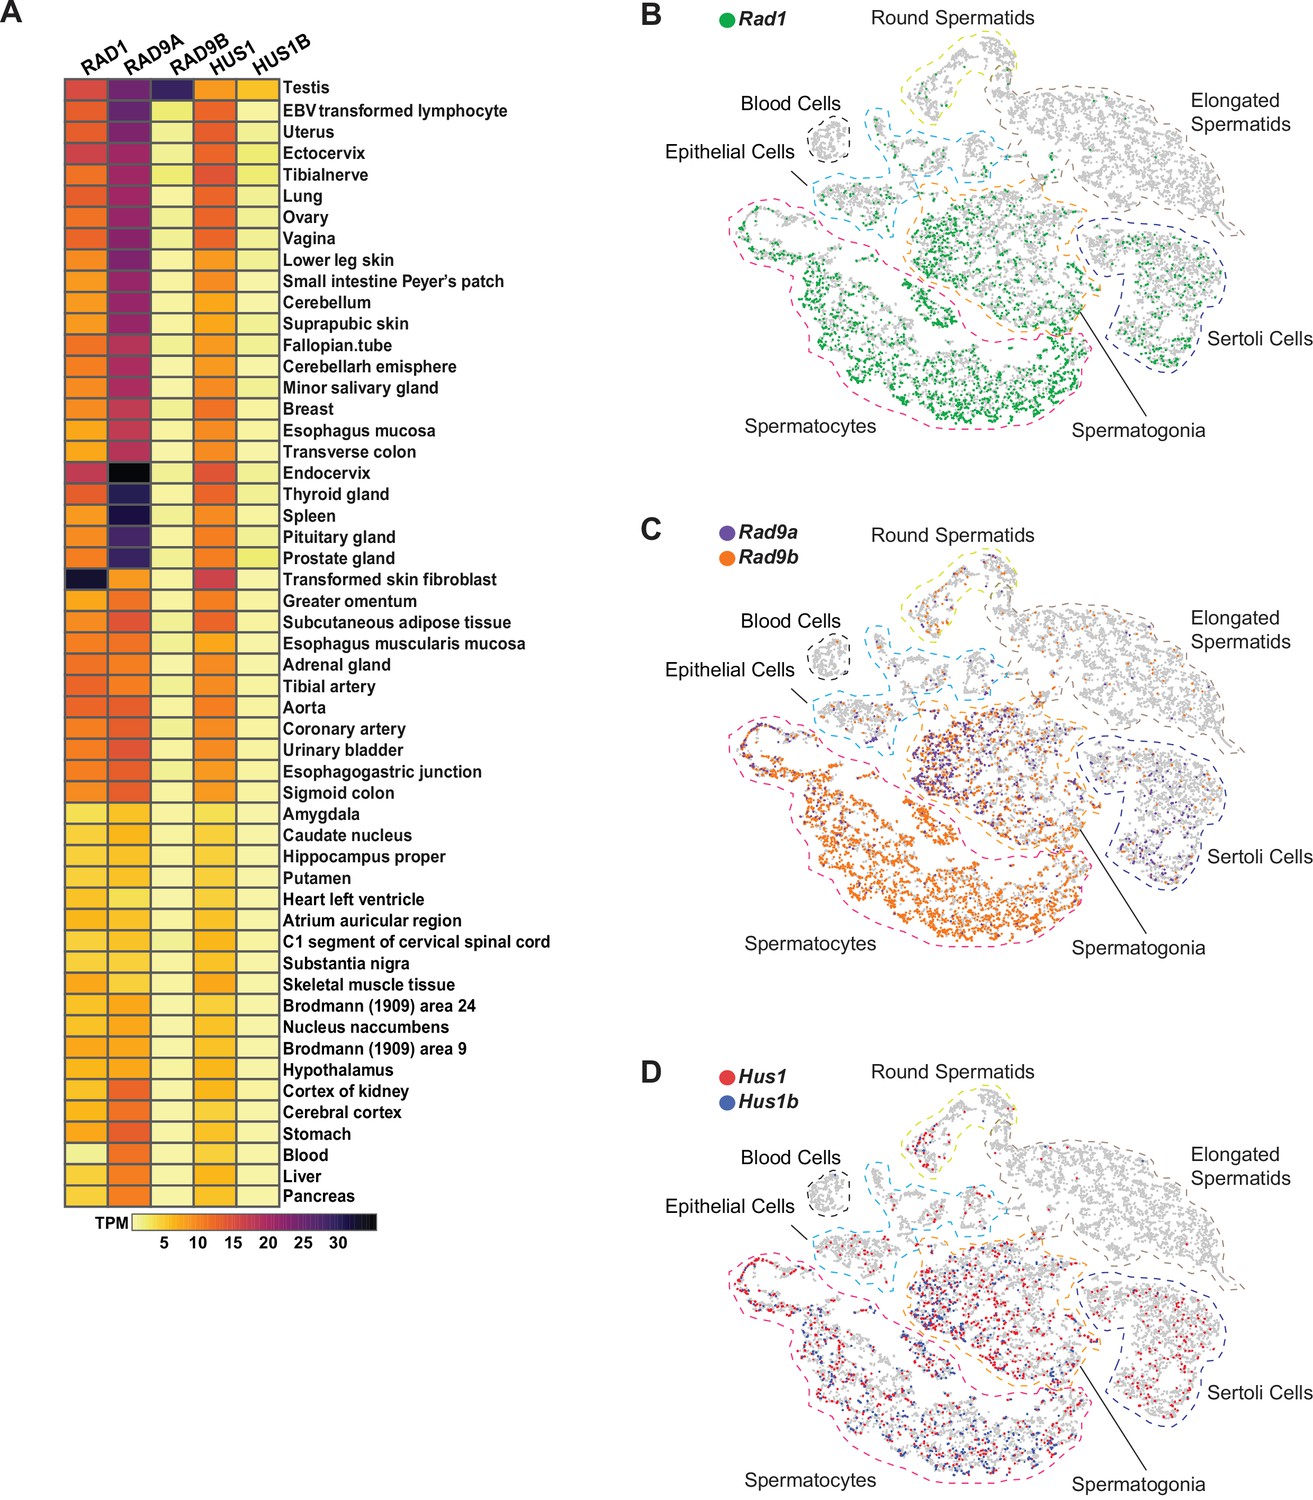
Expression of 9-1-1 complex subunits.
(A) Expression of 9-1-1 subunits in various human tissues. Data from the Genotype-Tissue Expression (GTEx) project was obtained in Expression Atlas – EMBL-EBI. Gene expression values are shown as transcript per million (TPM). (B–D) tSNE plots of single-cell RNA-seq analysis of mouse testes demonstrating the expression of 9-1-1 subunits in single cells from round spermatids, elongated spermatids, blood cells, epithelial, spermatocytes, spermatogonia, and Sertoli cells population within testes. Gray circles are individual cells. (B) Rad1-expressing cells are shown in green. (C) Rad9a-expressing cells are shown in purple, and Rad9b-expressing cells are in orange. (D) Hus1-expressing cells are in red, and Hus1b-expressing cells are in blue.
Figure 2 with 2 supplements
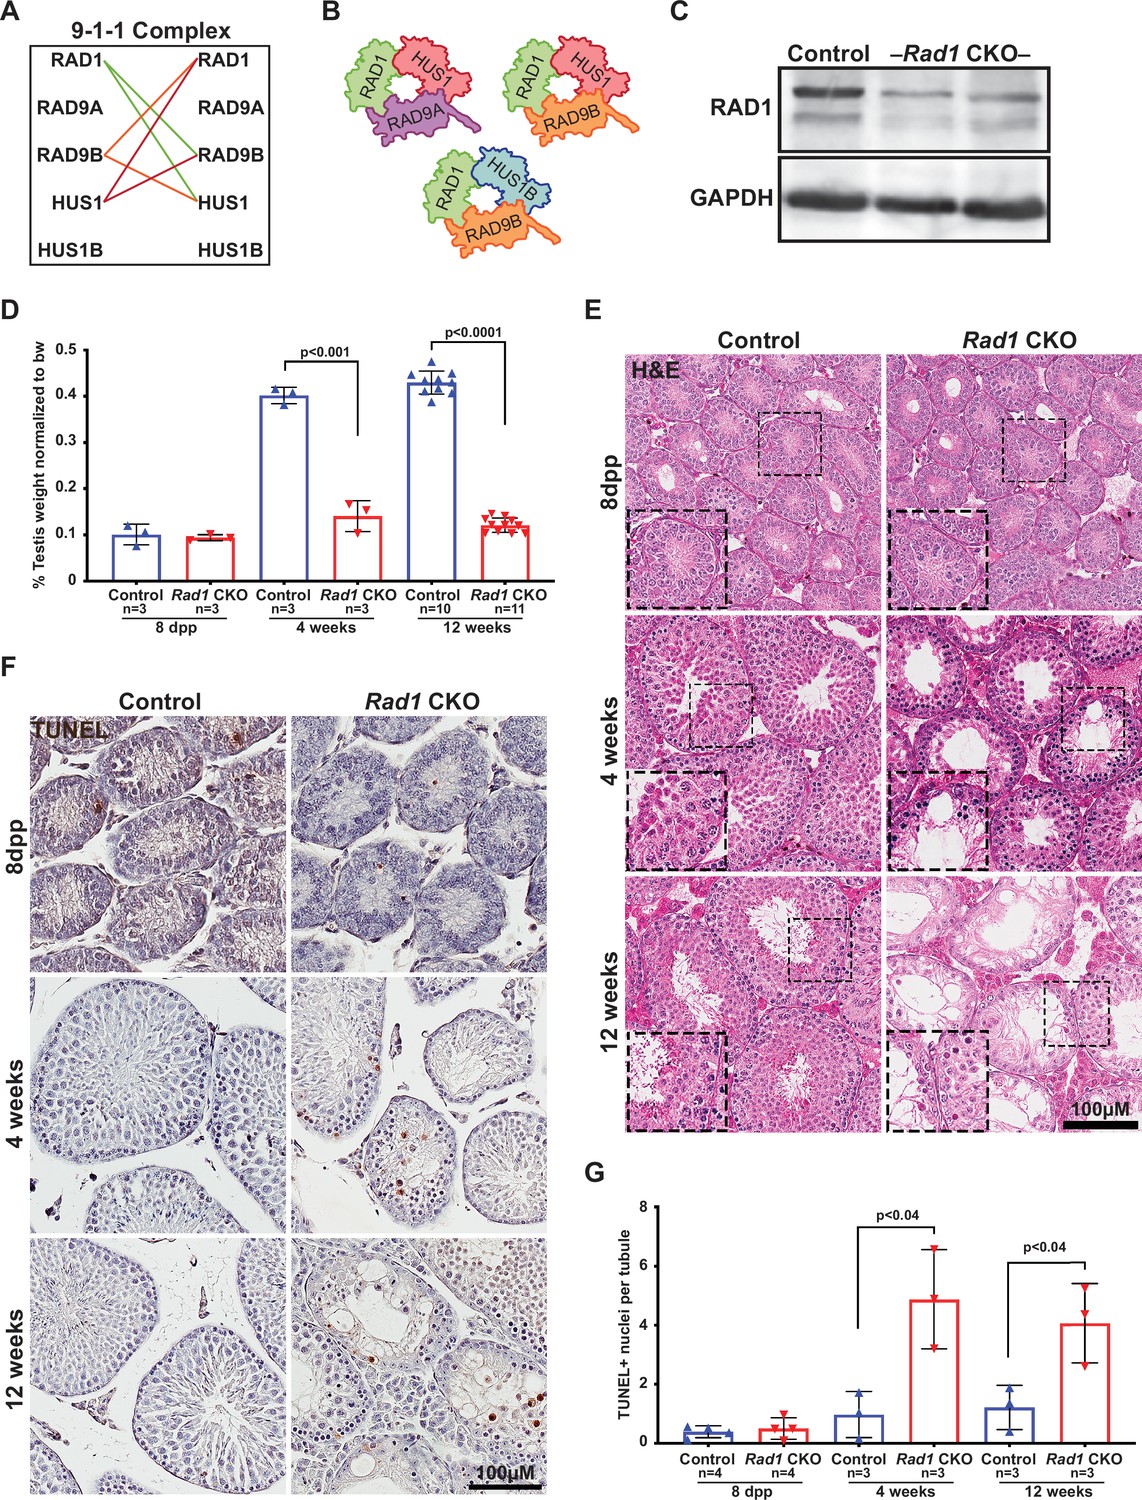
Conditional knockout (CKO) of the 9-1-1 complex subunit RAD1 causes severe germ cell loss in testes.
(A) Evolutionary rate covariation analysis between 9-1-1 subunits. Lines depict significant covariance between 9-1-1 subunits. (B) Schematic showing putative meiotic 9-1-1 complexes: 9A-1-1, 9B-1-1, and 9B-1-1B. (C) Representative immunoblot for RAD1 in control and Rad1 CKO whole testes lysates from 12-week-old mice (n = 5 control and 5 CKO samples analyzed in total). (D) Testis weight normalized to body weight from 8-day postpartum (dpp), 4-week-old, and 12-week-old control and Rad1 CKO mice. (E) Seminiferous tubule cross sections from 8-dpp, 4-week-old, and 12-week-old mice were stained with H&E (representative images from three mice analyzed per age group per genotype). (F, G) Representative images (F) and quantification (G) of TUNEL-positive cells per tubule in control and Rad1 CKO mice (50 tubules per mouse quantified; n = number of mice analyzed). p-Value calculated using Welch’s unpaired t-test in GraphPad.
-
Figure 2—source data 1
Control and Rad1 conditional knockout (CKO) testes weights.
- https://cdn.elifesciences.org/articles/68677/elife-68677-fig2-data1-v1.xlsx
-
Figure 2—source data 2
Control and Rad1 conditional knockout (CKO) TUNEL+ cell counts.
- https://cdn.elifesciences.org/articles/68677/elife-68677-fig2-data2-v1.xlsx
-
Figure 2—source data 3
Control and Rad1 conditional knockout (CKO) TRA98+ cell counts.
- https://cdn.elifesciences.org/articles/68677/elife-68677-fig2-data3-v1.xlsx
-
Figure 2—source data 4
Control and Rad1 conditional knockout (CKO) LIN28+ cell counts.
- https://cdn.elifesciences.org/articles/68677/elife-68677-fig2-data4-v1.xlsx
Figure 2—figure supplement 1

RAD1 levels are reduced in juvenile testes.
Immunoblotting for RAD1 in control (n = 2) and Rad1 conditional knockout (CKO) (n = 4) whole testes lysates from 14-day-old mice. The last lane contains cell lysate from 293T cells transiently overexpressing (OE) mouse RAD1. Arrowhead marks the location of the RAD1 band.
Figure 2—figure supplement 2

Rad1 inactivation in testis causes germ cell loss.
(A) Representative images of zygotene/pachytene-stage TUNEL-positive cells from 4 week-old and 12 week-old Rad1 conditional knockout (CKO) testes. (B, C) Representative images of TRA98-positive cells (B) and LIN-28-positive spermatogonial stem cells (C) in testis sections from control and Rad1 CKO mice. (D) Quantification of TRA98-positive cells (n = number of mice; 50 tubules per mouse quantified). (E) Quantification of LIN28-positive spermatogonial stem cells (n = number of mice; 50 tubules per mouse quantified). p-Value calculated using Welch’s unpaired t-test in GraphPad.
Figure 3 with 2 supplements

Testis-specific RAD1 loss disrupts 9-1-1 complex localization and causes defects in homolog synapsis and DNA damage signaling.
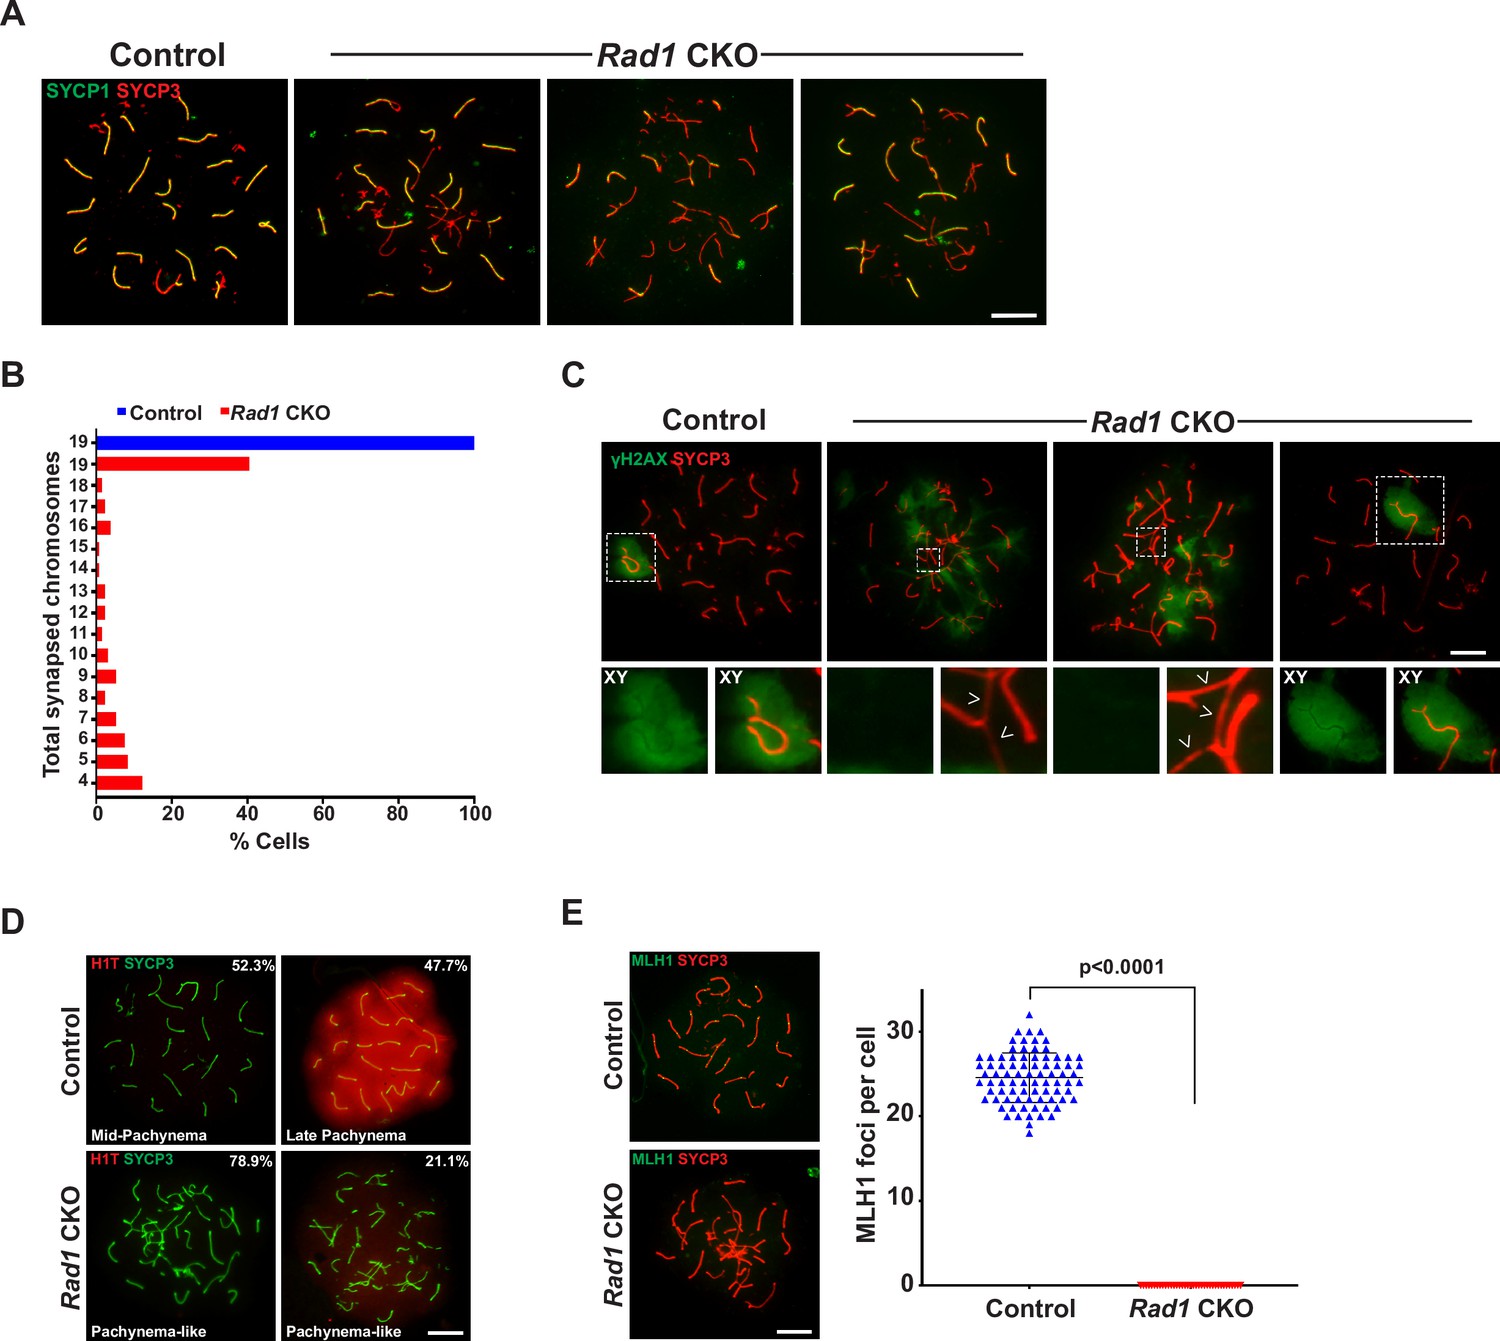
(A-C) Meiotic spreads from 12-week-old control and Rad1 conditional knockout (CKO) mice stained for RAD1 (A), RAD9B (B), or RAD9A (C). (D) Co-staining for SYCP1 and SYCP3 in meiotic spreads from 12-week-old control and Rad1 CKO mice (three control mice, n = 156 cells; three CKO mice, n = 131 cells). Rad1 CKO meiocytes with four or more synapsed chromosomes were categorized as pachytene-like. (E) γH2AX staining of meiotic spreads from control and Rad1 CKO mice. Arrowheads in Rad1 CKO spreads highlight regions of asynapsis lacking γH2AX staining (three control mice, n = 127 cells; five CKO mice, n = 205 cells). p-Values were calculated using Welch’s unpaired t-test using GraphPad. Scale bar for A-E 10μm.
-
Figure 3—source data 1
RAD1 foci counts in control and Rad1 conditional knockout (CKO) spermatocytes.
- https://cdn.elifesciences.org/articles/68677/elife-68677-fig3-data1-v1.xlsx
-
Figure 3—source data 2
Quantification of synapsed chromosomes in control and Rad1 conditional knockout (CKO) spermatocytes.
- https://cdn.elifesciences.org/articles/68677/elife-68677-fig3-data2-v1.xlsx
-
Figure 3—source data 3
Total MLH1 foci in control and Rad1 conditional knockout (CKO) spermatocytes.
- https://cdn.elifesciences.org/articles/68677/elife-68677-fig3-data3-v1.xlsx
Figure 3—figure supplement 1
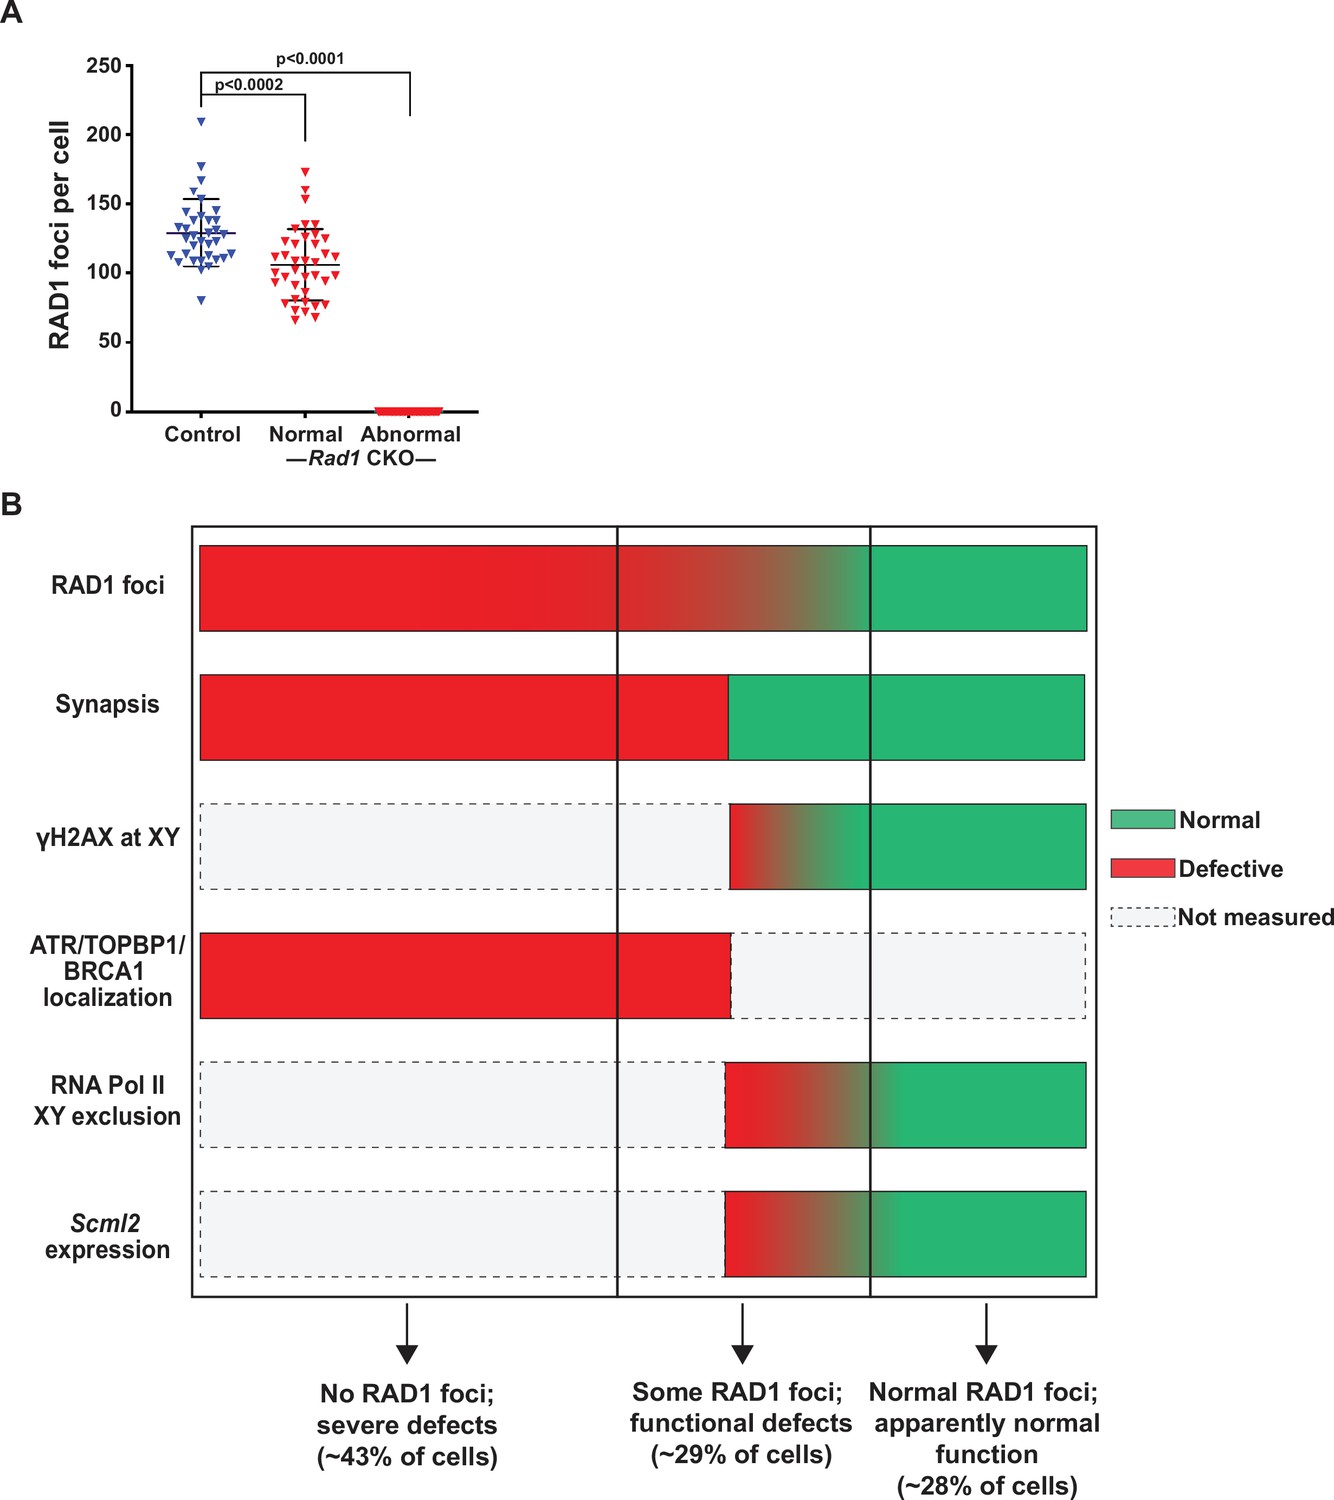
Rad1 conditional knockout (CKO) spermatocytes vary in the extent of RAD1 loss and meiotic defects.
(A) Total RAD1 foci counts in mid-pachytene control and Rad1 CKO cells. Approximately equal numbers of Rad1 CKO cells with apparently normal homolog synapsis (normal) or with synapsis defects (abnormal) were quantified (three control mice, n = 34 cells; three CKO mice, n = 38 normal and n = 40 abnormal cells). p-Values were calculated using Welch’s unpaired t-test in GraphPad. (B) Summary image depicting three distinct RAD1 cell populations that are observed in Rad1 CKO mice, based on RAD1 staining of meiotic chromosome spreads as well as the indicated functional assays. Cells in the first category (approximately 43% of CKO cells) lack RAD1 focus formation and have synapsis defects. Cells in the second category (approximately 29% of CKO cells) have detectable RAD1 focus formation but show at least one functional defect, including asynapsis or defects in meiotic sex chromosome inactivation. Cells in the third category (approximately 28% of CKO cells) display RAD1 focus formation and no apparent functional defects. See text for a detailed description of phenotyping and quantitation.
Figure 3—figure supplement 2
RAD1-deficient spermatocytes have synapsis defects and do not progress to mid-pachynema.
(A) Examples of SYCP1/3 co-staining in control and Rad1 conditional knockout (CKO) meiotic spreads (three control mice; n = 156 cells; three CKO mice; n = 131 cells). (B) Total synapsed chromosomes per cell in control (blue) and Rad1 CKO (red) spermatocytes (three control mice, n = 156 cells; three CKO mice, n = 131 cells). (C) Additional examples of γH2AX meiotic spread staining in cells from control and Rad1 CKO mice (three control mice, n = 127 cells; five CKO mice, n = 205 cells). Arrowheads in Rad1 CKO spreads highlight regions of asynapsis lacking γH2AX staining. (D) H1T meiotic spread staining in cells from control and Rad1 CKO mice. Of 174 pachynema staged cells analyzed from control mice, 52.3% of cells showed no H1T staining (two control mice, n = 258 cells). Of 104 pachynema-like staged cells from Rad1 CKO mice, 78.9% of cells displayed no H1T and 21.1% showed low levels of H1T staining (two Rad1 CKO mice, n = 104 cells). (E) Representative images of MLH1 staining in control and Rad1 CKO spreads, and quantification of MLH1 foci (two control mice, n = 81 cells; two Rad1 CKO mice, n = 37 cells). p-Values were calculated using Welch’s unpaired t-test in GraphPad. Scale bars for A and C-E 10μM.
Figure 4 with 1 supplement

Double-strand break (DSB) repair is compromised in the absence of 9-1-1 complexes.
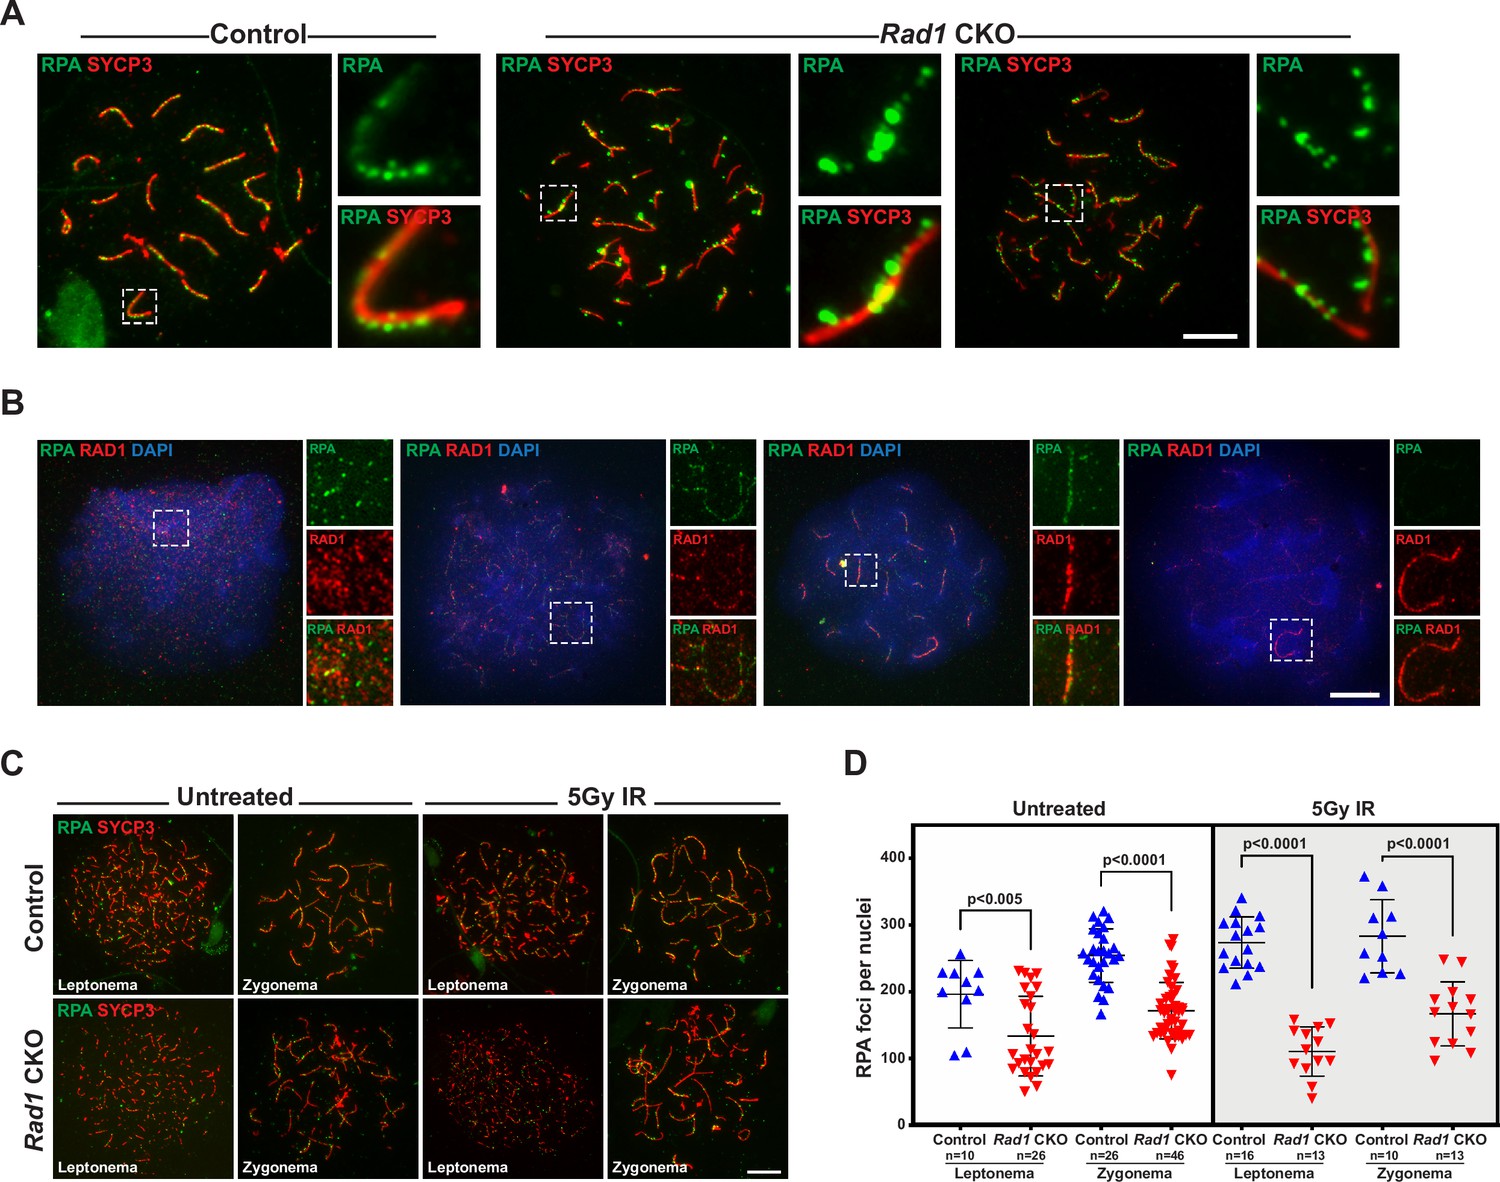
(A, B) Representative images (A) and quantification (B) of RPA2 staining of meiotic spreads from 12-week-old control and Rad1 conditional knockout (CKO) mice (three mice per genotype analyzed; n = total cells analyzed). (C, D) Representative meiotic spread images for ssDNA marker MEIOB (C) and quantifications (D) from 12-week-old control and Rad1 CKO mice (three mice per genotype analyzed; n = total cells analyzed). (E, F) Representative meiotic spread images of RAD51 (E) and quantifications (F) from 12-week-old control and Rad1 CKO mice (five control and six CKO mice; n = total cells analyzed). (G, H) 8-week-old control and Rad1 CKO mice were irradiated with 5 Gy ionizing radiation (IR) and collected 1 hr post IR. Representative RAD51 meiotic spread images (G) and quantifications (H) (two control and two CKO mice; n = total cells analyzed). p-Values were calculated using Welch’s unpaired t-test in GraphPad. Scale bars for A, C, E and G 10μm.
-
Figure 4—source data 1
Total foci counts for RPA, MEIOB, and RAD51 in spermatocytes from control and Rad1 conditional knockout (CKO) mice, as well as RAD51 and RPA in spermatocytes from irradiated control and Rad1 CKO mice.
- https://cdn.elifesciences.org/articles/68677/elife-68677-fig4-data1-v1.xlsx
Figure 4—figure supplement 1
The 9-1-1 complexes are critical for proper localization of meiotic double-strand break (DSB) repair proteins.
(A) Representative images of wild-type spermatocytes co-stained for RAD1 and RPA2 (three mice analyzed, n = 107 cells). (B) Representative images of control and Rad1 conditional knockout (CKO) spermatocytes stained for RPA2 and SYCP3. Insers highlight the size of RPA2 foci observed in Rad1 CKO spreads (three mice analyzed per genotype; n = 82 control cells; n = 122 CKO cells). (C, D) 8-week-old control and Rad1 CKO mice were irradiated with 5 Gy ionizing radiation (IR and collected 1 hr post IR). Representative images (C) and quantification (D) of RPA2 staining of meiotic spreads prepared from mice of the indicated genotypes (two control and two Rad1 CKO mice analyzed; n = total cells analyzed). p-Value calculated using Welch’s unpaired t-test in GraphPad. Scale bars for A-C 10μm.
Figure 5 with 2 supplements
Key ATR phosphorylation events for double-strand break (DSB) repair and cohesion are dependent upon 9-1-1 complexes.
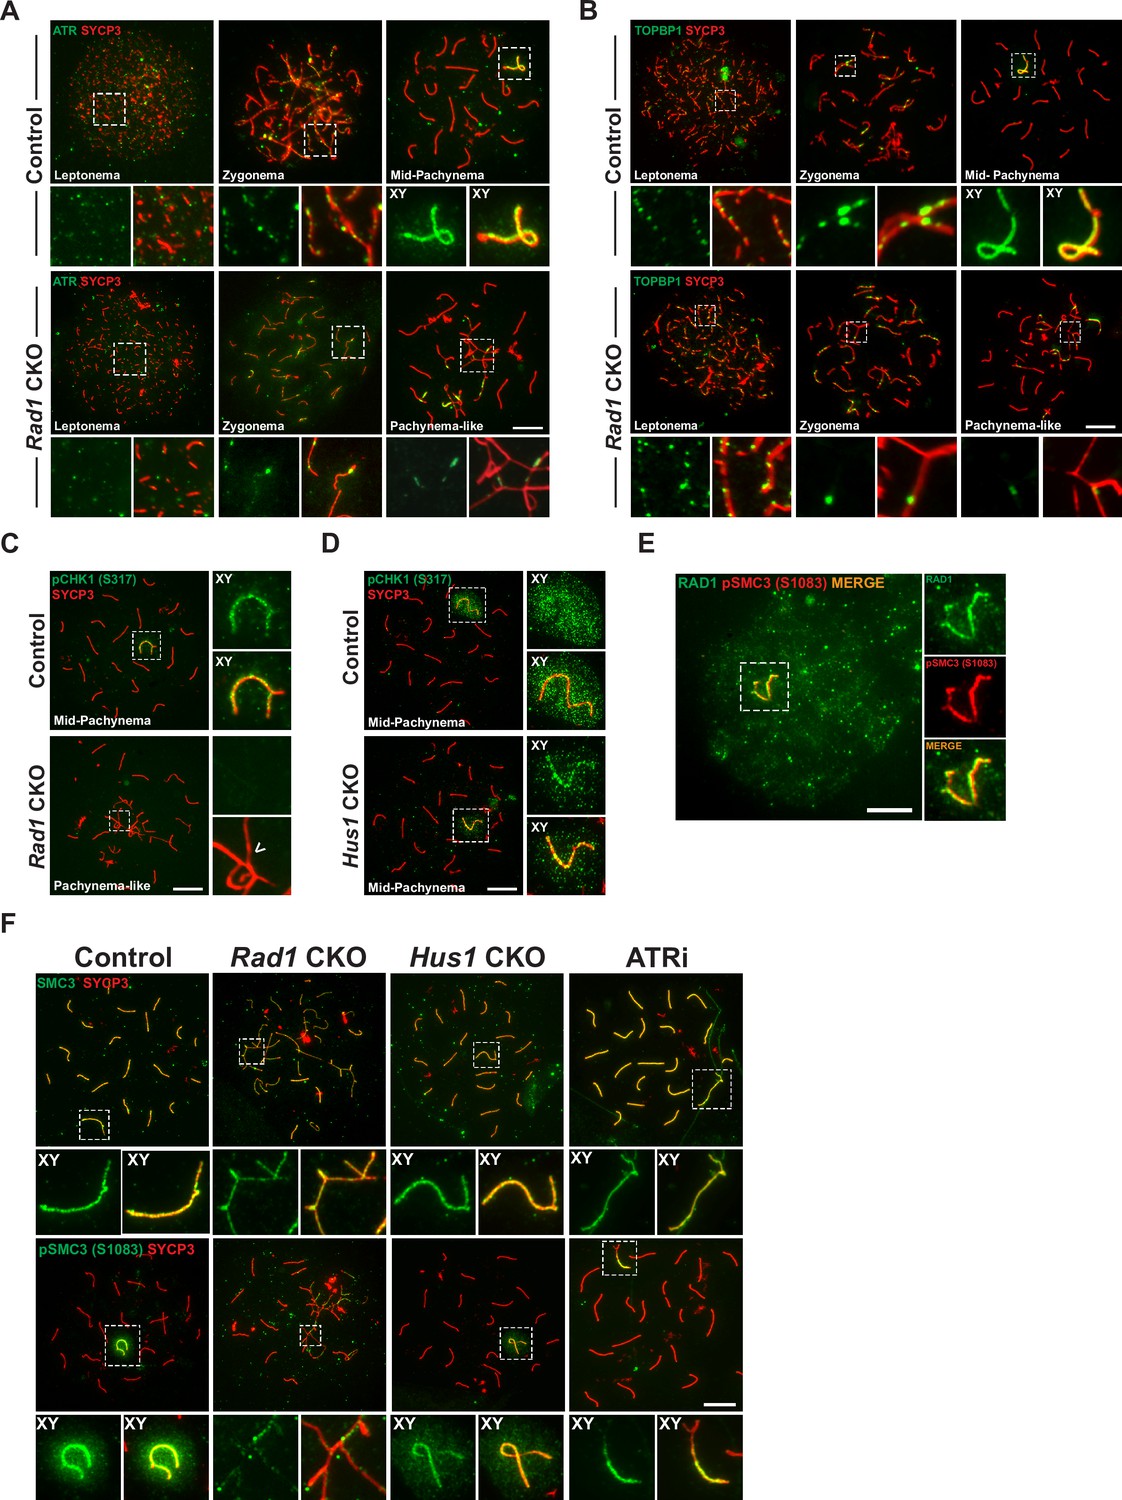
(A) ATR localization in meiotic spreads from control and Rad1 conditional knockout (CKO) 12-week-old mice (three control mice, n = 171 cells; three CKO mice, n = 146). (B) Representative images of TOPBP1 localization in meiotic spreads from 12-week-old control and Rad1 CKO mice (three control mice, n = 130 cells; three CKO mice, n = 129). (C, D) Representative images of phospho-CHK1 (S317) localization in Rad1 CKO (C) and Hus1 CKO mice (D) (Rad1 CKO: three control mice, n = 125 cells; three CKO mice, n = 120 cells; Hus1 CKO: two control mice, n = 107 cells; three CKO mice, n = 191 cells). Arrowhead indicates a region of asynapsis. (E) Co-staining of RAD1 and pSMC3 (S1083) in wild-type spermatocytes. (F) Representative images of SMC3 and pSMC3 (S1083) localization in pachytene and pachytene-like cells from control, Rad1 CKO, Hus1 CKO, and ATRi-treated mice. Scale bars 10μm.
-
Figure 5—source data 1
Evolutionary rate covariation (ERC) calculations for 9-1-1 complex subunits and meiosis I-related proteins.
Data in this source file were used to generate Figure 2A, Figure 5—figure supplement 1B and C, and Figure 5—figure supplement 2A and B.
- https://cdn.elifesciences.org/articles/68677/elife-68677-fig5-data1-v1.txt
Figure 5—figure supplement 1
Phosphorylation of CHK1 and SMC3 is reduced in the absence of 9-1-1 complexes.
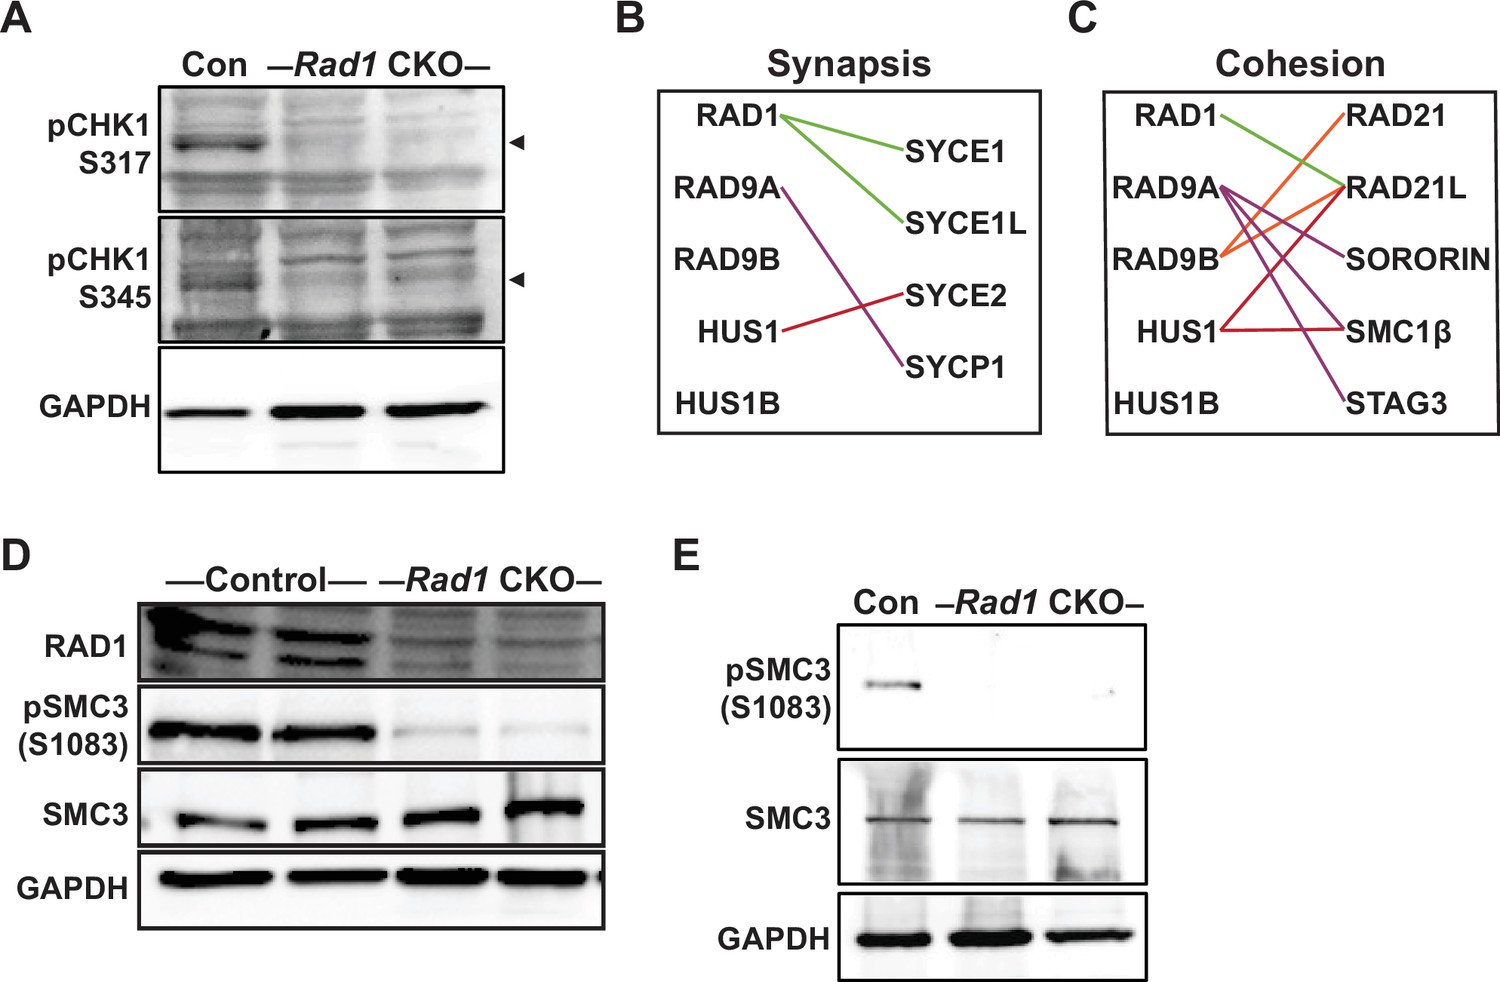
(A) Representative immunoblots for phosphorylated pCHK1 (S317 and S345) in whole testis lysates from 8-week-old control and Rad1 conditional knockout (CKO) mice. Arrowheads denote the pCHK1 band. (B, C) Evolutionary rate covariation (ERC) analysis between 9-1-1 complex subunits and synaptonemal complex (B) and cohesin (C) factors. Lines depict significant correlations observed between 9-1-1 complex subunits and synapsis or cohesin factors. (D) Representative immunoblot for phosphorylated SMC3 (S1083) and total SMC3 in whole testis lysates from 12-week-old control and Rad1 CKO mice. (E) Representative immunoblot for pSMC3 (S1083) and SMC3 in whole testis lysates from 14-day-old control and Rad1 CKO mice.
Figure 5—figure supplement 2

Evolutionary rate covariation (ERC) network of meiosis I proteins.
(A) Heatmap of proteins found under Gene Ontology term meiosis I (GO:0007127) that showed ERC values ≥ 0.4 for each subunit. Pink labeling denotes proteins with no significant ERC values (p>0.05). ND: no value exists in dataset for paired comparison between the two proteins. NA: not applicable for comparisons between the same protein. PTTG3P* has a high ERC and significance with RAD1 only. (B) ERC values between subunits and meiosis I proteins were used to plot the network with force-directed layout. The Fruchterman and Reingold algorithm features attraction between highly connected nodes, identifying protein clusters based on ERC data. The distance between nodes is proportional to absolute edge weight (ERC value of each protein), with shorter distances between nodes reflecting higher ERC values.
Figure 6
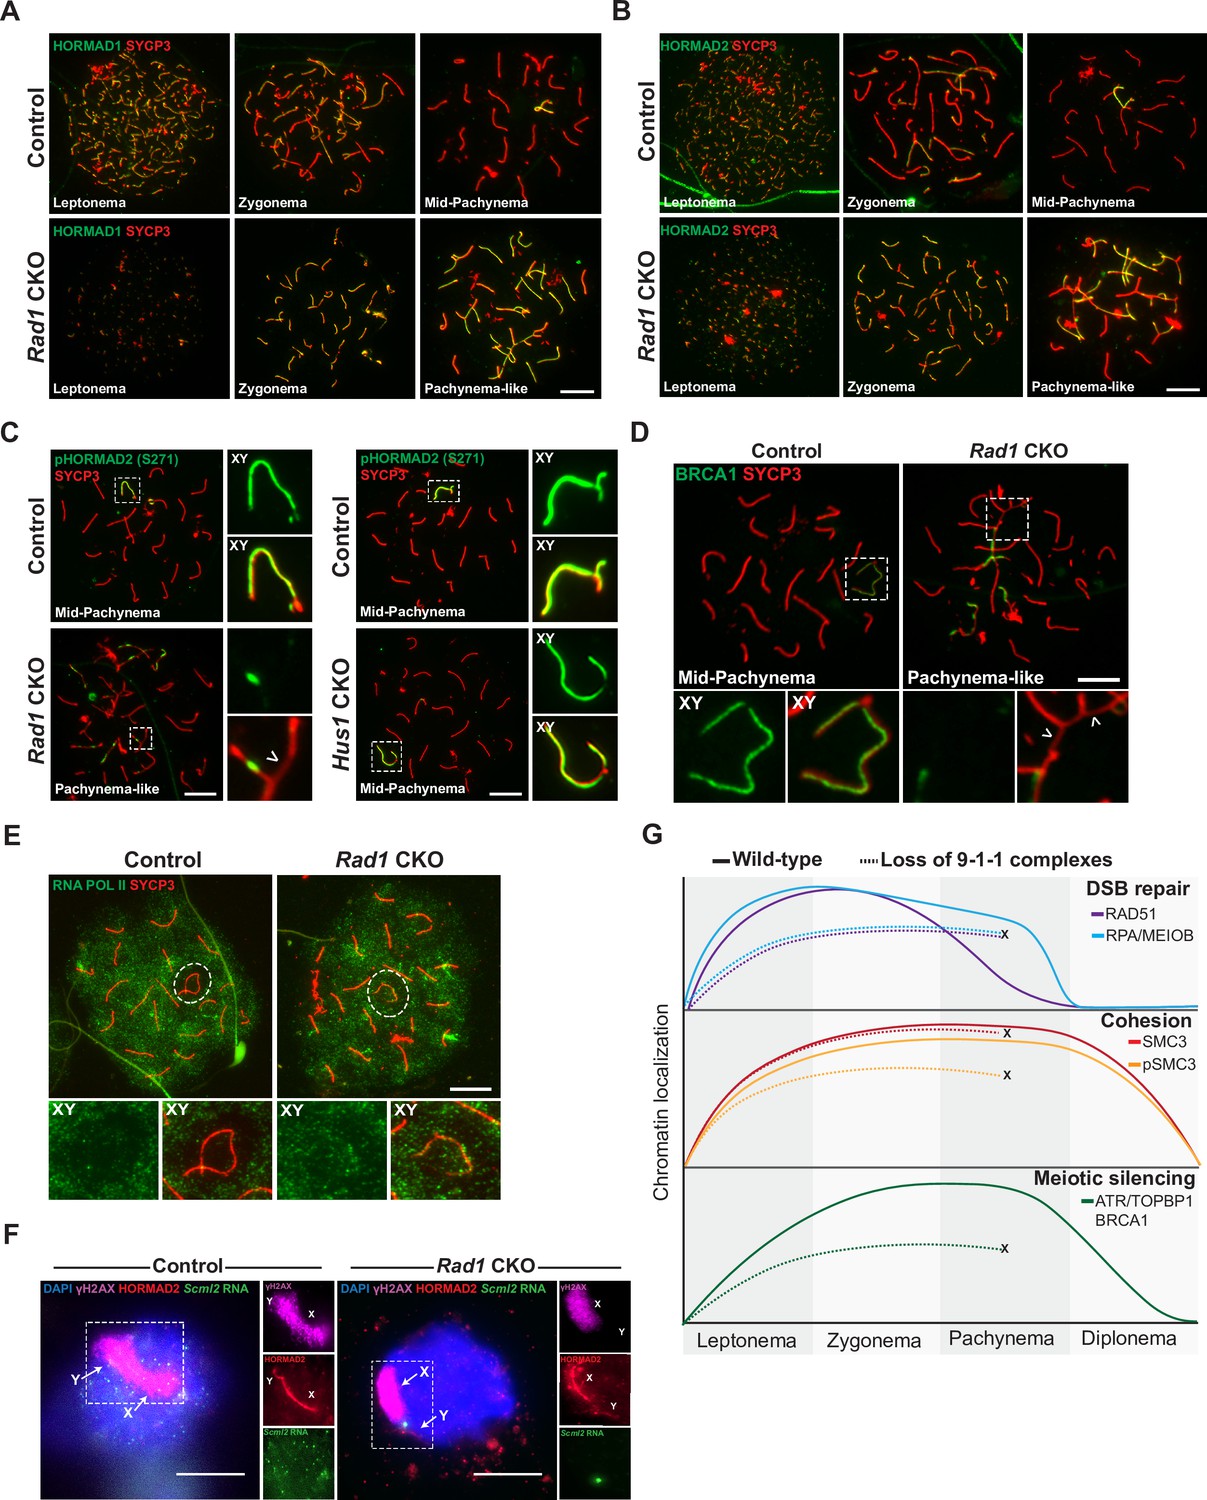
9-1-1 complexes are required for ATR-mediated meiotic sex chromosome inactivation.
(A, B) Representative images of HORMAD1 (A) and HORMAD2 (B) localization in meiotic spreads from 12-week-old control and Rad1 conditional knockout (CKO) mice (three control mice, n = 146 cells; three CKO mice, n = 119 cells). (C) Representative images of phospho-HORMAD2 (S271) localization in meiotic spreads from 12-week-old control and Rad1 CKO mice (Rad1 CKO: three control mice, n = 178 cells; three CKO mice, n = 146 cells; Hus1 CKO: two control mice, n = 189 cells; three CKO mice, n = 145 cells). Arrowhead indicates a region of asynapsis. (D) Representative images of BRCA1 localization in meiotic spreads from 12-week-old control and Rad1 CKO mice (two control, n = 110 cells; two CKO, n = 149 cells). Arrowheads indicate regions of asynapsis. (E) Representative images of RNA Pol II staining in meiotic spreads from 12-week-old control and Rad1 CKO mice (three control, n = 125 cells; three CKO, n = 98 cells). Note that the Rad1 CKO cell has apparently normal synapsis but incomplete exclusion of RNA Pol II from the sex body. (F) RNA fluorescent in situ hybridization for Scml2 in fully synapsed, pachytene-stage control and Rad1 CKO cells, with co-staining for γH2AX and HORMAD2 (three control mice, n = 29 cells; three CKO mice, n = 45 cells). (G) Summary graphic depicting the localization of key meiotic factors in wild-type versus Rad1 CKO spermatocytes. Loss of 9-1-1 complexes resulted in failure to progress to late pachytene, as depicted by the ‘X.’ Double-strand break (DSB) repair markers, such as RAD51, were reduced in the absence of the 9-1-1 complexes. The cohesin subunit SMC3 localized properly in the absence of 9-1-1 subunits, but its phosphorylation was impaired in Rad1 CKO spermatocytes. Meiotic silencing factors such as ATR, TOPBP1, and BRCA1 also failed to localize properly in the absence of the 9-1-1 complexes. Scale bars for A-F 10μm.
Tables
Table 1
Analysis of epididymal sperm counts and fertility in Rad1 conditional knockout (CKO) and control mice.
| Genotype | No. males | Epididymal sperm count(×106) | No. matings | No. copulatory plugs | No. pregnancies | Total viable pups |
|---|---|---|---|---|---|---|
| Control | 3 | 16.6 ± 4.5 | 12 | 12 | 10 | 66 |
| Rad1 CKO | 3 | 0.0 ± 0 | 15 | 15 | 0 | 0 |
-
Male Rad1 CKO mice at 8-12 weeks of age were bred to 6-week-old wild-type FVB female mice.
Key resources table
| Reagent type (species) or resource | Designation | Source or reference | Identifiers | Additional information |
|---|---|---|---|---|
| Antibody | Anti-RAD1; HM454(rabbit polyclonal) | Lyndaker et al., 2013a | IF (1:100) WB (1:1000) | |
| Antibody | Anti-RAD9A; HM456(rabbit polyclonal) | Lyndaker et al., 2013b | IF (1:100) | |
| Antibody | Anti-RAD9B(rabbit polyclonal) | Pérez-Castro and Freire, 2012 | IF (1:100) | |
| Antibody | Anti-phospho-histone H2A.X (Ser139) antibody, clone JBW301 (mouse monoclonal) | Millipore | Cat# 05-636;RRID:AB_309864 | IF (1:1000) |
| Antibody | SCP3 antibody [Cor 10G11/7](mouse polyclonal) | Abcam | Cat# ab97672;RRID:AB_10678841 | IF (1:1000) |
| Antibody | Anti-SYCP3(rabbit polyclonal) | Lenzi et al., 2005 | IF (1:1000) | |
| Antibody | Rabbit anti-SCP1 polyclonal antibody, unconjugated | Abcam | Cat# ab15090;RRID:AB_301636 | IF (1:1000) |
| Antibody | Anti-Rad51 (Ab-1) rabbit pAb antibody(rabbit polyclonal) | Millipore | Cat# PC130;RRID:AB_2238184 | IF (1:1000) |
| Antibody | Anti-RPA2; UP2436(rabbit polyclonal) | Shi et al., 2019 | IF (1:500) | |
| Antibody | Anti-MEIOB; UP2327(rabbit polyclonal) | Luo et al., 2013 | IF (1:500) | |
| Antibody | Anti-replication protein A, clone RPA34-20(mouse monoclonal) | Millipore | Cat# MABE285;RRID:AB_11205561 | IF (1:100) |
| Antibody | ATR antibody(rabbit polyclonal) | Cell Signaling | Cat# 2790;RRID:AB_2227860 | IF (1:100) |
| Antibody | Anti-TOBP1(rabbit polyclonal) | Rendtlew Danielsen et al., 2009 | IF (1:500) | |
| Antibody | Anti-phospho-Chk1 (ser317) (D12H3) XP(rabbit monoclonal) | Cell Signaling | Cat# 12302;RRID:AB_2783865 | IF (1:100) |
| Antibody | Anti-MLH1(mouse monoclonal) | BD Biosciences | Cat# 550838;RRID:AB_2297859 | IF (1:1000) |
| Antibody | Anti-H1T(guinea pig polyclonal) | Inselman et al., 2003 | IF (1:500) | |
| Antibody | Anti-HORMAD2; AB324(rabbit polyclonal) | Wojtasz et al., 2009 | IF (1:500) | |
| Antibody | Anti-HORMAD1; AB211(rabbit polyclonal) | Wojtasz et al., 2009 | IF (1:500) | |
| Antibody | Rabbit anti-SMC3 antibody, affinity purified(rabbit polyclonal) | Bethyl | Cat# A300-060A; RRID:AB_67579 | IF (1:100) WB (1:1000) |
| Antibody | Rabbit anti-phospho SMC3 (S1083) IHC antibody(rabbit polyclonal) | Bethyl | Cat# IHC-00070;RRID:AB_2255076 | IF (1:100) WB (1:1000) |
| Antibody | Anti-mouse TRA98 monoclonal antibody, unconjugated(mouse monoclonal) | BioAcademia | Cat# 73-003; RRID:AB_1056334 | IF (1:100) |
| Antibody | Rabbit anti-Lin28 polyclonal antibody, unconjugated(rabbit polyclonal) | Abcam | Cat# ab63740; RRID:AB_1310410 | IF (1:100) |
| Antibody | GAPDH monoclonal antibody (6C5)(mouse monoclonal) | Thermo Fisher Scientific | Cat# AM4300; RRID:AB_2536381 | WB (1:5000) |
| Antibody | β-Actin antibody(rabbit polyclonal) | Cell Signaling | Cat# 4967; RRID:AB_330288 | WB (1:5000) |
| Antibody | Goat anti-rabbit IgG (H + L) highly cross-adsorbed secondary antibody, Alexa Fluor 488(rabbit polyclonal) | Thermo Fisher Scientific | Cat# A-11034; RRID:AB_2576217 | IF (1:1000) |
| Antibody | Goat anti-mouse IgG (H + L) antibody, Alexa Fluor 488 conjugated(mouse polyclonal) | Thermo Fisher Scientific | Cat# A-11017; RRID:AB_143160 | IF (1:1000) |
| Antibody | Goat anti-rabbit IgG (H + L) antibody, Alexa Fluor 594 conjugated(rabbit polyclonal) | Thermo Fisher Scientific | Cat# A-11012; RRID:AB_141359 | IF (1:1000) |
| Antibody | Goat anti-mouse IgG (H + L) highly cross-adsorbed secondary antibody, Alexa Fluor Plus 594(mouse polyclonal) | Thermo Fisher Scientific | Cat# A32742; RRID:AB_2762825 | IF (1:1000) |
| Antibody | Goat anti-guinea pig IgG (H + L) highly cross-adsorbed secondary antibody, Alexa Fluor 647(guinea pig polyclonal) | Thermo Fisher Scientific | Cat# A-21450; RRID:AB_141882 | IF (1:1000) |
| Sequence-based reagent | Cre ic318R | Lyndaker et al., 2013a | PCR primers | AGGGACACA GCATTGGAGTC |
| Sequence-based reagent | Cre ic202F | Lyndaker et al., 2013b | PCR primers | GTGCAAGCT GAACAACAGGA |
| Sequence-based reagent | Rad1 G1F | Wit et al., 2011 | PCR primers | AGGTACGTC AGTGCGATTACCCT |
| Sequence-based reagent | Rad1 G3R | Wit et al., 2011 | PCR primers | CCCTCAAGAT GTAACCTC ATCTAC |
| Sequence-based reagent | Hus1 3.107 | Lyndaker et al., 2013a | PCR primers | GGGCTGATGC GGAGGGTG CAGGTT |
| Sequence-based reagent | Hus1 Neo1 | Lyndaker et al., 2013b | PCR primers | GCTCTTTACT GAAGGCTCTTTAC |
| Sequence-based reagent | Hus1 5-OSMCS2 | Lyndaker et al., 2013a | PCR primers | GCGAAGACGG AATTGATCA GGCCACG |
| Sequence-based reagent | Hus1 5.-20 | Lyndaker et al., 2013b | PCR primers | CCGTCGGCCT GGTATCC GCCATGA |
| Sequence-based reagent | Hus1 3.159 | Lyndaker et al., 2013b | PCR primers | CTCACAACTGCT ACAAGGTTAGGC |
| Commercial assay or kit | ApopTag Plus Peroxidase In Situ Apoptosis Kit | Millipore | Sigma-Aldrich: S7101 | |
| Chemical compound, drug | AZ20, ATR inhibitor | Selleckchem | Selleckchem: S7050 | |
| Software, algorithm | GraphPad Prism 9 | GraphPad | RRID:SCR_002798 |
Additional files
Download links
A two-part list of links to download the article, or parts of the article, in various formats.
Downloads (link to download the article as PDF)
Open citations (links to open the citations from this article in various online reference manager services)
Cite this article (links to download the citations from this article in formats compatible with various reference manager tools)
Multiple 9-1-1 complexes promote homolog synapsis, DSB repair, and ATR signaling during mammalian meiosis
eLife 11:e68677.
https://doi.org/10.7554/eLife.68677


