An open label randomized controlled trial of tamoxifen combined with amphotericin B and fluconazole for cryptococcal meningitis
- Department of Tropical Medicine, Cho Ray Hospital, Viet Nam
- Oxford University Clinical Research Unit, Viet Nam
- The Hospital for Tropical Diseases, Viet Nam
- Liverpool School of Tropical Medicine, United Kingdom
- Centre of Excellence in Infectious Disease Research, Institute of Translational Medicine, Liverpool University, United Kingdom
- The University of Sydney, Marie Bashir Institute, NSW, Australia
- Westmead Institute for Medical Research, Australia
- Mahidol Oxford Research Unit, Faculty of Tropical Medicine, Mahidol University, Thailand
- Centre for Tropical Medicine and Global Health, Nuffield Department of Medicine, University of Oxford, United Kingdom
- Department of Paediatrics and Microbiology/Immunology, Carver College of Medicine, University of Iowa, United States
Figures
Figure 1
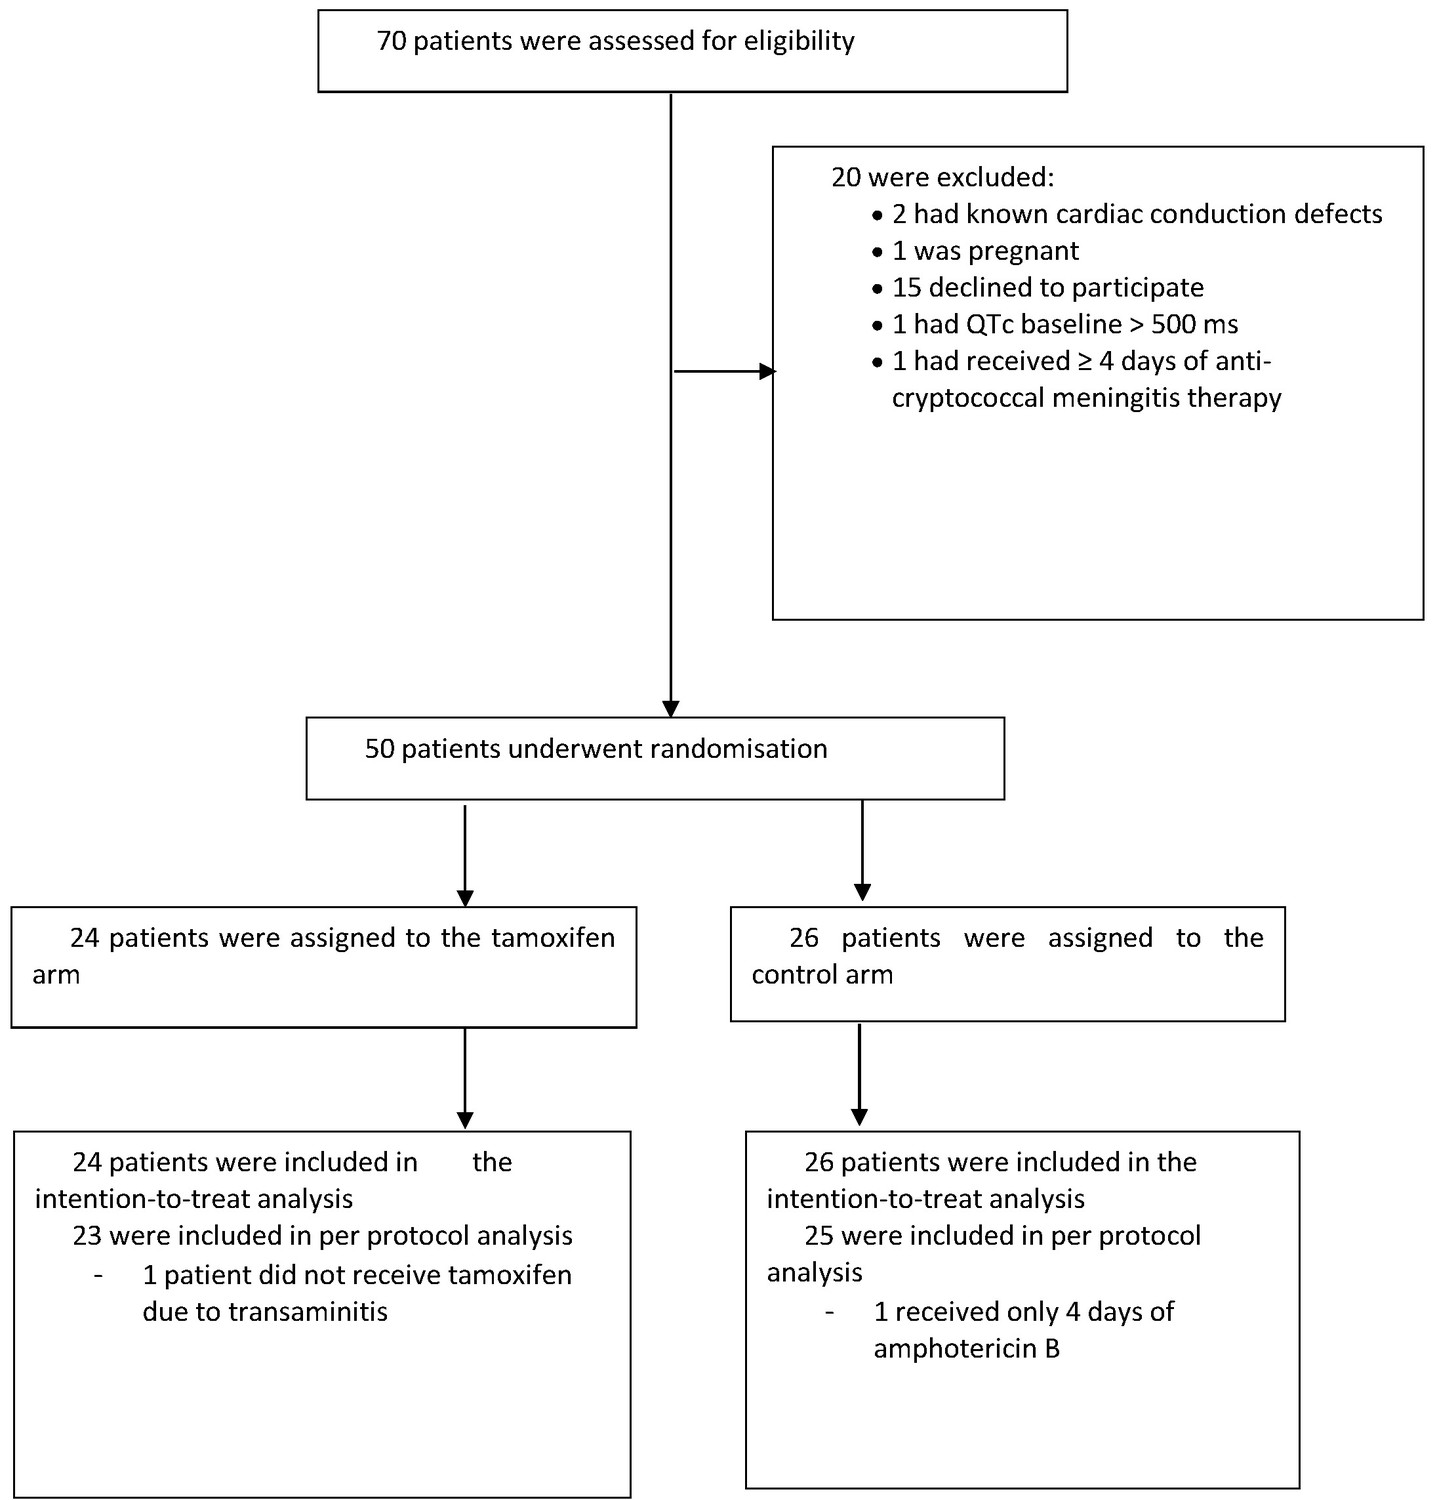
Trial flow chart: enrollment, randomization, and follow-up.
Figure 2
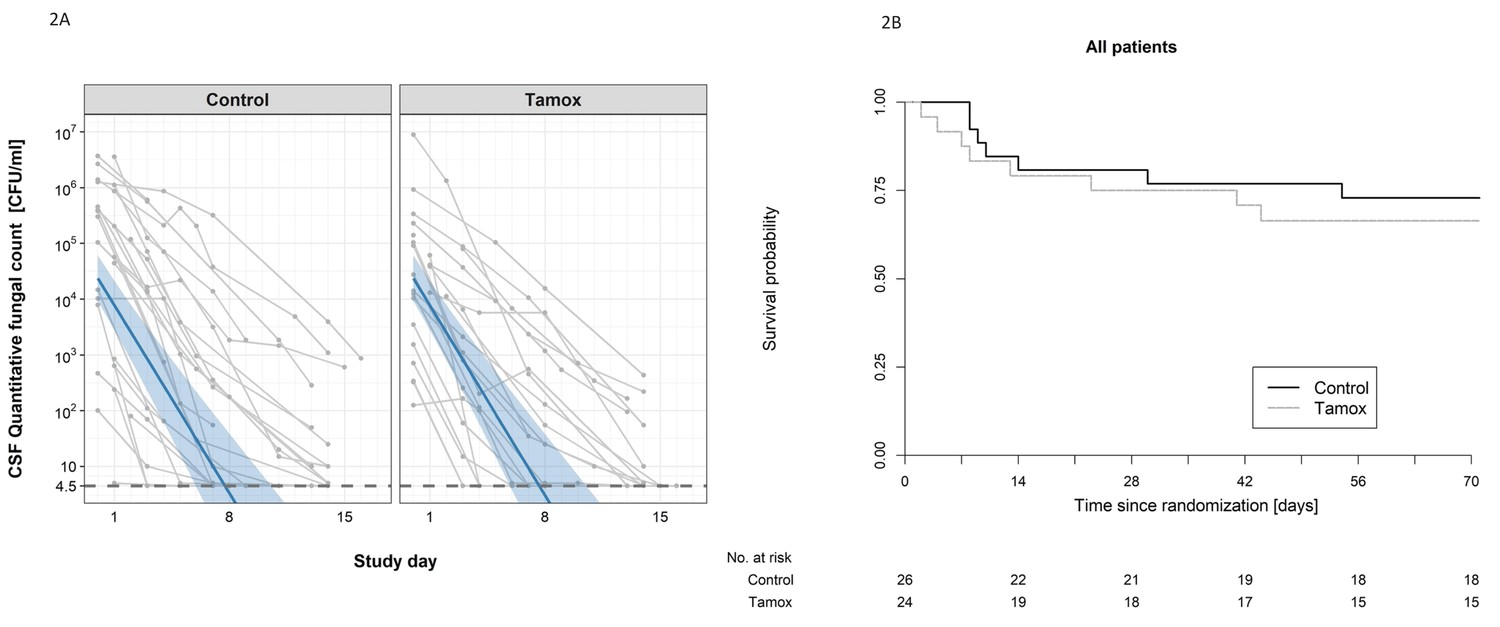
The impact of addition of tamoxifen to standard treatment on (A) the rate of sterilzation of cerebrospinal fluid, and (B) survival until 10 weeks after randomisation.
(A) Decline in fungal count in CSF as measured in colony-forming units (CFU) per milliliter over the first 2 weeks of treatment by treatment arm. Data from individual patients are shown in grey lines. Bold blue lines show estimated mean with 95% credible intervals (shaded band) of CSF fungal counts based on the joint model described in the statistical analysis. The rate of decline was −0.49 log10CFU/ml/day in patients receiving tamoxifen versus −0.48 log10CFU/ml/day in control patients. The horizontal dashed lines represent the value of detection limit (4.5 CFU/ml). The fitted line crosses the horizontal dashed lines of the detection limit value after day 8 because 25% and 75% of patients had fungal counts under the detection limit at days 8 and 15, respectively. (B) Kaplan-Meier survival cures for each study arm over the 10-week study period. Seven death events occurred in the control arm versus 8 in the tamoxifen intervention arm by 10 weeks (estimated risk 27% versus 34%, absolute risk difference = 6.5%) (95% Confidence Interval −19.2 to 32.1%, p = 0.62).
Figure 3
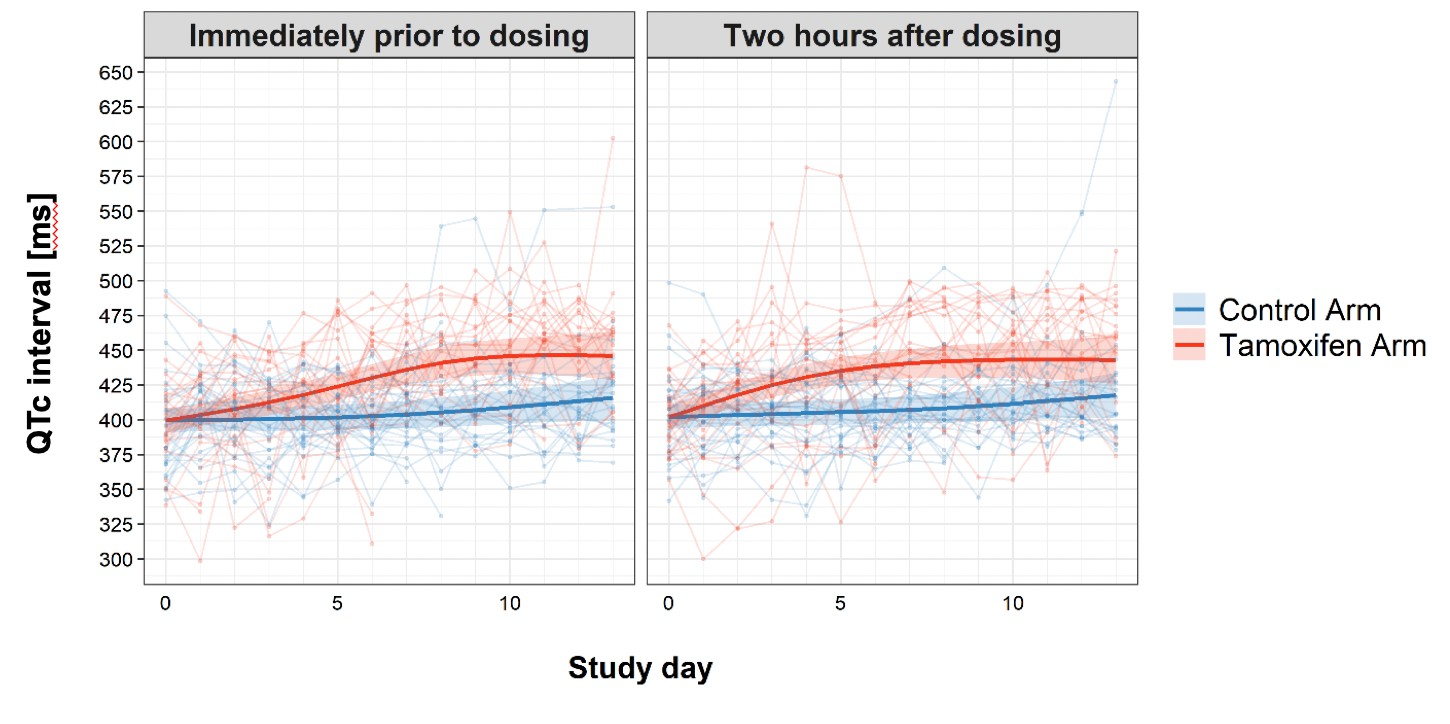
Change in QTc interval over the first 2 weeks of treatment by study arm.
Faint lines display change in individual patient QTcs; bold lines display the estimated mean and shaded bands the 95% Confidence Intervals; blue = control arm, red = tamoxifen arm. The maximum median difference in the QTc intervals between study arms immediately prior to drug administration was 37.07 ms (95% CI: 21.09, 53.04) and occurred on day 9 of the study. The largest difference in median QTc 2 hr post-drug administration was 33.44 ms (95% CI: 18.67, 48.21) and occurred on day 8 of the study. Additional details regarding change in QTc are provided in the Supplementary Appendix.
Appendix 1—figure 1
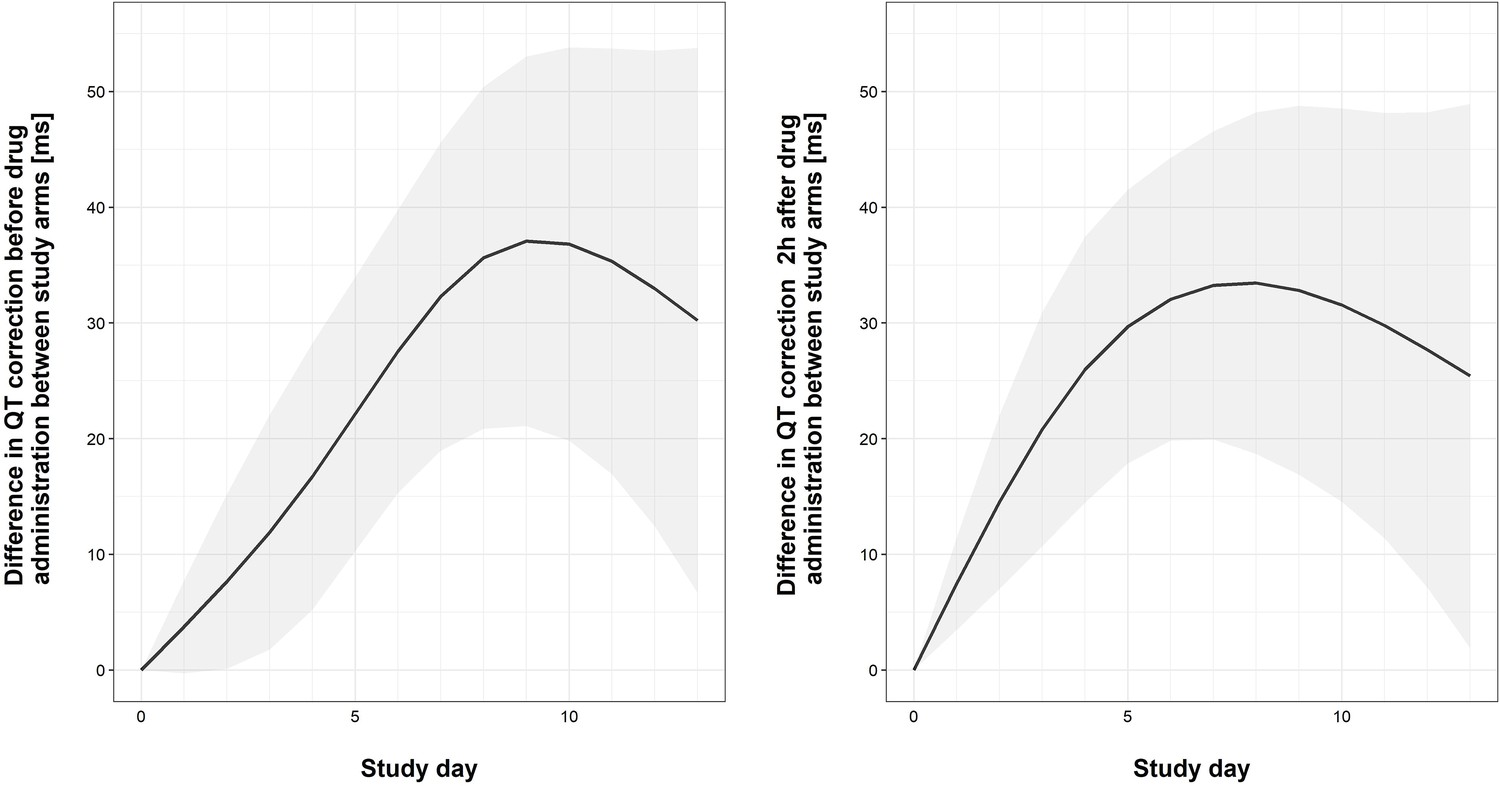
Graphical representation of differences in QTc between study arm of ther first 2 weeks of the trial.
The bold lines and the shaded bands represent the estimated mean difference with 95% Confidence Interval of QTc between two study arms. The output of the fitted linear mixed effect model computes the differences in QTc between study arms by study day, separately for pre-dose and 2 hours post-dose measurements.
Tables
Table 1
Clinical and investigation characteristics of patients at study entry.
| Characteristic | Total | Tamoxifen | Total | Control |
|---|---|---|---|---|
| N | N (%) or IQR* | N | N (%) or IQR* | |
| Male sex | 24 | 17 (71) | 26 | 18 (69) |
| Median age in years | 24 | 35 (31, 39) | 26 | 32 (25, 35) |
| History of intravenous drug use | 24 | 3 (13) | 26 | 3/26 (12) |
| HIV infection | 24 | 19 (83) | 26 | 21/26 (81) |
| Current antiretroviral-therapy use | ||||
| None | 24 | 18 (75) | 26 | 22 (84) |
| ≤3 months duration | 24 | 4 (17) | 26 | 2 (8) |
| >3 months duration | 24 | 2 (8) | 26 | 2 (8) |
| Median duration of illness — days | 24 | 14 (10, 25) | 26 | 12 (7, 28) |
| Symptoms | ||||
| Headache | 24 | 24 (100) | 26 | 26 (100) |
| Fever | 24 | 22 (92) | 26 | 23 (88) |
| Neck stiffness | 22 | 20 (91) | 26 | 21 (81) |
| Seizures | 24 | 2 (8) | 26 | 3 (12) |
| Abnormal visual acuity | 22 | 6 (27) | 26 | 4 (15) |
| Papilledema | 21 | 2 (10) | 25 | 1 (4) |
| Glasgow Coma Scale score | 24 | 26 | ||
| 15 | 19 (79) | 24 (92) | ||
| 11–14 | 5 (21) | 2 (8) | ||
| <11 | 0 (0) | 0 (0) | ||
| Cranial nerve palsy | ||||
| None | 24 | 19 (79) | 26 | 23 (88) |
| Cranial nerve VI | 24 | 4 (17) | 26 | 1 (4) |
| Other cranial nerve | 24 | 1 (4) | 26 | 3 (11) |
| Investigations | ||||
| Median CSF opening pressure — cm of CSF | 19 | 26.5 (18, 37) | 23 | 24.5 (16, 47) |
| Median CSF white-cell count in HIV infected patients — cells/mm3 | 18 | 38.5 (7, 52) | 20 | 27 (10, 55) |
| Median CSF white-cell count in HIV uninfected patients — cells/mm3 | 5 | 122 (64, 187) | 5 | 94 (45, 117) |
| Median CSF glucose — mmol/l | 24 | 2.47 (1.70, 3.14) | 25 | 2.31 (1.44, 2.76) |
| Median blood glucose — mmol/l | 24 | 5.86 (4.92, 6.84) | 26 | 6.21 (5.11, 7.81) |
| Median CSF: blood glucose ratio | 24 | 0.40 (0.24, 0.53) | 25 | 0.37 (0.16, 0.45) |
| Median CSF fungal count — log10 CFU/ml | 24 | 4.60 (3.90, 5.17) | 26 | 5.16 (3.17, 5.87) |
| Median CD4 count in HIV infected patients — cells/mm3 | 17 | 20 (8, 49) | 21 | 17 (9, 45) |
| Median CD4 count in HIV uninfected patients — cells/mm3 | 5 | 376 (348, 382) | 5 | 504 (305, 968) |
| Median creatinine — mg/dl | 24 | 0.82 (0.66, 1.05) | 26 | 0.78 (0.66, 0.98) |
| QTc interval — ms | 24 | 395.03 (377.55, 410.45) | 26 | 401.20 (374.76, 420.06) |
-
* Median, interquartile range (IQR) for continuous data and N (%) for categorical data.
Table 2
Primary outcome: Early Fungicidal Activity over the first 2 weeks following randomization (log10 colony-forming units (CFU)/ml/day).
| Treatment Arm | ||||||
|---|---|---|---|---|---|---|
| Analysis populations | Total | Tamoxifen | Total | Standard of Care | Difference in change | p-value† |
| N | Change/day (95% CI*) | N | Change/day (95% CI*) | (95% CI*) | ||
| Intention-to-treat | 24 | −0.49 (−0.62,–0.37) | 26 | −0.48 (−0.61,–0.37) | −0.005 (−0.16, 0.15) | 0.95 |
| Per-protocol | 23 | −0.48 (−0.61,–0.36) | 25 | −0.48 (−0.61,–0.37) | 0.004 (−0.17, 0.17) | 0.96 |
| HIV-infected patients | 19 | −0.49 (−0.65,–0.37) | 21 | −0.42 (−0.55,–0.31) | −0.072 (−0.25, 0.10) | 0.41 |
| HIV-uninfected patients | 5 | −0.42 (−0.74,–0.21) | 5 | −0.57 (−0.93,–0.33) | 0.16 (−0.18, 0.55) | 0.37 |
-
*95% CI corresponds to Bayesian 95% credible intervals.
†p-value refers to crude ‘Wald-type’ tests of the mean estimate divided by its standard deviation of the Monte Carlo Markov chain sampling of coefficients derived from the joint model.
Table 3
Secondary outcomes: death, disability, and change in CD4 count.
| Death by 10 weeks | Tamoxifen N/total (%) | Control N/total (%) | Risk difference % (95% CI) | p- value* | |
|---|---|---|---|---|---|
| Intention-to-treat population | 8/24 (34) | 7/26 (27) | 6.47 (−19.15, 32.09) | 0.62 | |
| Per-protocol population | 7/23 (31) | 6/25 (24) | 6.50 (−18.90, 31.89) | 0.62 | |
| HIV infected patients | 7/19 (37) | 6/21 (29) | 8.39 (−20.99, 37.77) | 0.58 | |
| HIV uninfected patients | 1/5 (20) | 1/5 (20) | 0.00 (−49.58, 49.58) | 1.00 | |
| Disability at 10 weeks | 0.14 | ||||
| Good | 2/23 (9) | 9/25 (36) | |||
| Intermediate | 7/23 (30) | 6/25 (24) | |||
| Severe disability | 6/23 (26) | 3/25 (12) | |||
| Death | 8/23 (35) | 7/25 (28) | |||
| Disability at 10 weeks in HIV infected patients | 0.05 | ||||
| Good | 2/18 (11) | 8/20 (40) | |||
| Intermediate | 5/18 (28) | 6/20 (30) | |||
| Severe disability | 4/18 (22) | 0/20 (0) | |||
| Death | 7/18 (39) | 6/20 (30) | |||
| Disability at 10 weeks in HIV uninfected patients | 0.68 | ||||
| Good | 0/5 (0) | 1/5 (20) | |||
| Intermediate | 2/5 (40) | 0/5 (0) | |||
| Severe disability | 2/5 (40) | 3/5 (60) | |||
| Death | 1/5 (20) | 1/5 (20) | |||
| Change in CD4 count over 10 weeks (cells/uL) | Median Change (IQR) (N) | Median Change (IQR) (N) | |||
| HIV-infected patients | 50.0 (5.00, 142.5) (10) | 40.0 (7.0, 76.0) (13) | 0.5 | ||
| HIV-uninfected patients | 393.5 (211.3, 613.8) (4) | −257.5 (−413.7,–171.0) (4) | 0.02 | ||
-
*p-Values not corrected for multiple testing.
Table 4
Grade 3 or 4 adverse events by 10 weeks.
| Event | Tamoxifen (N = 24) | Control (N = 26) | p-value* | |
|---|---|---|---|---|
| Number of patients with Grade 3 or 4 adverse events (%) | ||||
| Any adverse event | 24 (100) | 26 (100) | 1.0 | |
| New neurological events | 9 (38) | 7 (27) | 0.62 | |
| New AIDS-defining illness (HIV patients only) | 3 (16) | 5 (24) | 0.58 | |
| New cardiac events | 9 (38) | 4 (15) | 0.145 | |
| Supraventricular tachycardia | 1 (4) | 0 (0) | 0.48 | |
| Ventricular extrasystoles | 3 (13) | 0 (0) | 0.21 | |
| Right Bundle Branch Block | 0 (0) | 1 (4) | 1.00 | |
| QTc prolongation | 8 (33) | 1 (4) | 0.02 | |
| Myocardial infarction | 0 (0) | 1 (4) | 1.00 | |
| Cardiac arrest | 1 (4) | 0 (0) | 0.48 | |
| Other cardiac adverse events | 1 (4) | 1 (4) | 1.0 | |
| Laboratory abnormalities | ||||
| Anemia | 18 (75) | 18 (69) | 0.89 | |
| Leukopenia | 2 (8) | 2 (8) | 1.0 | |
| Thrombocytopenia | 2 (8) | 4 (15) | 0.74 | |
| Elevated aminotransferase | 2 (8) | 4 (15) | 0.74 | |
| Raised Creatinine | 3 (13) | 6 (23) | 0.55 | |
| Hyperkalemia | 2 (8) | 6 (23) | 0.48 | |
| Hypokalemia | 17 (71) | 20 (77) | 0.87 | |
| Hyponatremia | 18 (75) | 23 (88) | 0.39 | |
-
*p-Values were not corrected for multiple testing.
Additional files
Download links
A two-part list of links to download the article, or parts of the article, in various formats.
Downloads (link to download the article as PDF)
Open citations (links to open the citations from this article in various online reference manager services)
Cite this article (links to download the citations from this article in formats compatible with various reference manager tools)
An open label randomized controlled trial of tamoxifen combined with amphotericin B and fluconazole for cryptococcal meningitis
eLife 10:e68929.
https://doi.org/10.7554/eLife.68929


