Addressing shortfalls of laboratory HbA1c using a model that incorporates red cell lifespan
- Abbott Diabetes Care, United States
- International Diabetes Center, Park Nicollet, HealthPartners, United States
- Leeds Institute of Cardiovascular and Metabolic Medicine, University of Leeds, United Kingdom
Figures
Figure 1
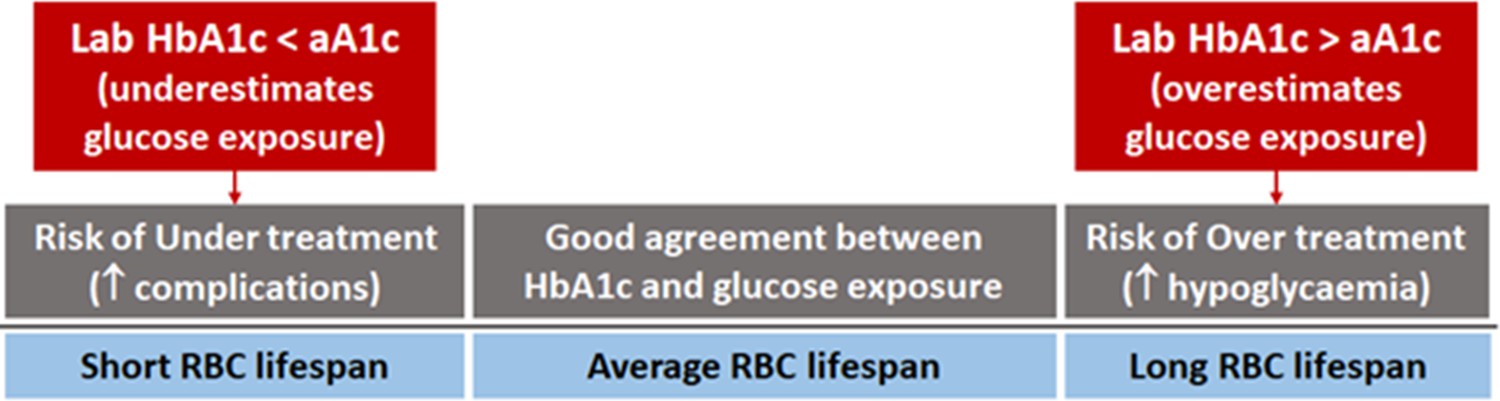
Individual red blood cell (RBC) lifespan can affect HbA1c and diabetes treatment.
In some individuals, laboratory HbA1c can be misleading and resulting in undertreatment, thus increasing the risk of complications, or overtreatment, predisposing to hypoglycaemia.
Figure 2
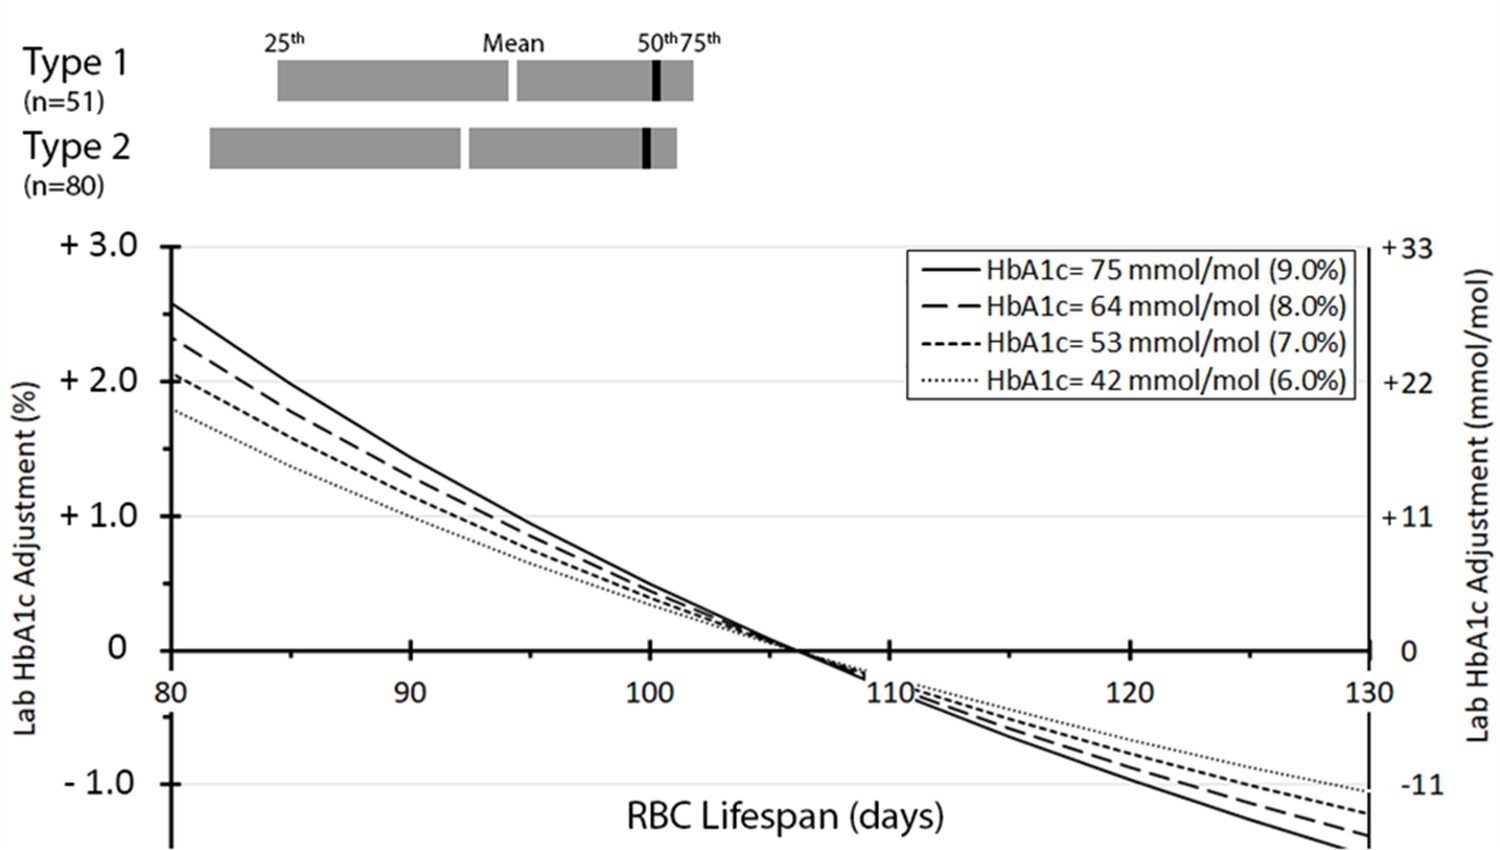
Distribution of red blood cell (RBC) lifespan for type 1 (n = 51) and type 2 (n = 80) diabetes and adjustment to laboratory HbA1c by RBC lifespan.
The number (percentage) of individuals having HbA1c adjustments < 1 % (<11 mmol/mol), 1–2% (11–22 mmol/mol), 2–3% (22–33 mmol/mol), and >3% (>33 mmol/mol) were 90 (68%), 21 (16%), 12 (9%), and 8 (6%), respectively.
Tables
Table 1
Main characteristics of the cohort studied.
| N | 131 |
|---|---|
| Age [years; mean ± SD (range)] | 53.5 ± 13.7 (18, 77) |
| Gender, male [number (percentage)] | 86 (66%) |
| T1D [number (percentage)]T2D [number (percentage)]BMI [kg/m2; mean ± SD (range)] | 51 (39%)80 (61%)29.8 ± 5.9 (18.8, 54.1) |
| Duration of diabetes (years) | 17.7 ± 8.7 (2, 46) |
| Hypoglycaemic therapy | Multiple daily injections of insulin |
| Data are presented as mean ± SD (min, max) or n (%) | |
Appendix 1—table 1
Summary of kinetic model validation studies.
The mean absolute deviation differences between calculated HbA1c (cHbA1c) and glucose management indicator (GMI) are statically significant with p < 0.0001.
| Study | T1D SAP [22] | DPV T1D [23] | Replace/mpact [9] | ||||
|---|---|---|---|---|---|---|---|
| Country | Japan | Germany | Europe | ||||
| Subject count (male) | 51 (14) | 352 (171) | 120 (79) [TID 54 (37), T2D 66 (42)] | ||||
| Age median (range) | 42 (6–73) | 12.5 (3–19) | 52 (18–77) | ||||
| HbA1c test | Central lab | POC+ central lab | Central lab | ||||
| CGM device | Medtronic | Abbott | Abbott | ||||
| Method | cHbA1c | GMI (14-day AG) | cHbA1c | GMI (14-day AG) | cHbA1c | GMI (14-day AG) | |
| Abs. dev.% (mmol/mol) | Mean | 0.11 (1.2) | 0.47 (5.1) | 0.32 (3.5) | 0.57 (6.2) | 0.31 (3.4) | 0.66 (7.2) |
| SD | 0.06 (0.7) | 0.46 (5.0) | 0.28 (3.0) | 0.55 (6.0) | 0.22 (2.4) | 0.46 (5.0) | |
| Median | 0.10 (1.1) | 0.36 (3.9) | 0.26 (2.8) | 0.46 (5.0) | 0.27 (3.0) | 0.5 (5.5) | |
| Average bias% (mmol/mol) | 0 (0) | –0.3 (–3.3) | 0 (0) | 0.4 (4.4) | 0 (0) | –0.6 (–6.6) | |
| R2 | 0.91 | 0.65 | 0.79 | 0.52 | 0.88 | 0.63 | |
Appendix 1—table 2
Main characteristics of markers assessing average glycaemic control.
| Intracellular (I) or extracellular (E) glucose | Affected by mean red blood cell (RBC) lifespan | Advantages | Disadvantages | ||
|---|---|---|---|---|---|
| CGM-derived | Average glucose | E | No |
|
|
| Time in range | |||||
| Average fasting plasma glucose | E | No | |||
| Glycated albumin | E | No |
| ||
| HbA1c | I | Yes |
|
| |
| Adjusted HbA1c | I | No |
|
| |
| Intracellular glucose | I | No |
|
| |
Additional files
Download links
A two-part list of links to download the article, or parts of the article, in various formats.
Downloads (link to download the article as PDF)
Open citations (links to open the citations from this article in various online reference manager services)
Cite this article (links to download the citations from this article in formats compatible with various reference manager tools)
Addressing shortfalls of laboratory HbA1c using a model that incorporates red cell lifespan
eLife 10:e69456.
https://doi.org/10.7554/eLife.69456


