High-intensity interval training remodels the proteome and acetylome of human skeletal muscle
- Section of Integrative Physiology, Department of Nutrition, Exercise and Sports, University of Copenhagen, Denmark
- Novo Nordisk Foundation Center for Basic Metabolic Research, Faculty of Health and Medical Sciences, University of Copenhagen, Denmark
- The Novo Nordisk Foundation Center for Biosustainability, Technical University of Denmark, Denmark
- The Novo Nordisk Foundation Center for Protein Research, Clinical Proteomics, Faculty of Health and Medical Sciences, University of Copenhagen, Denmark
Figures
Figure 1 with 2 supplements
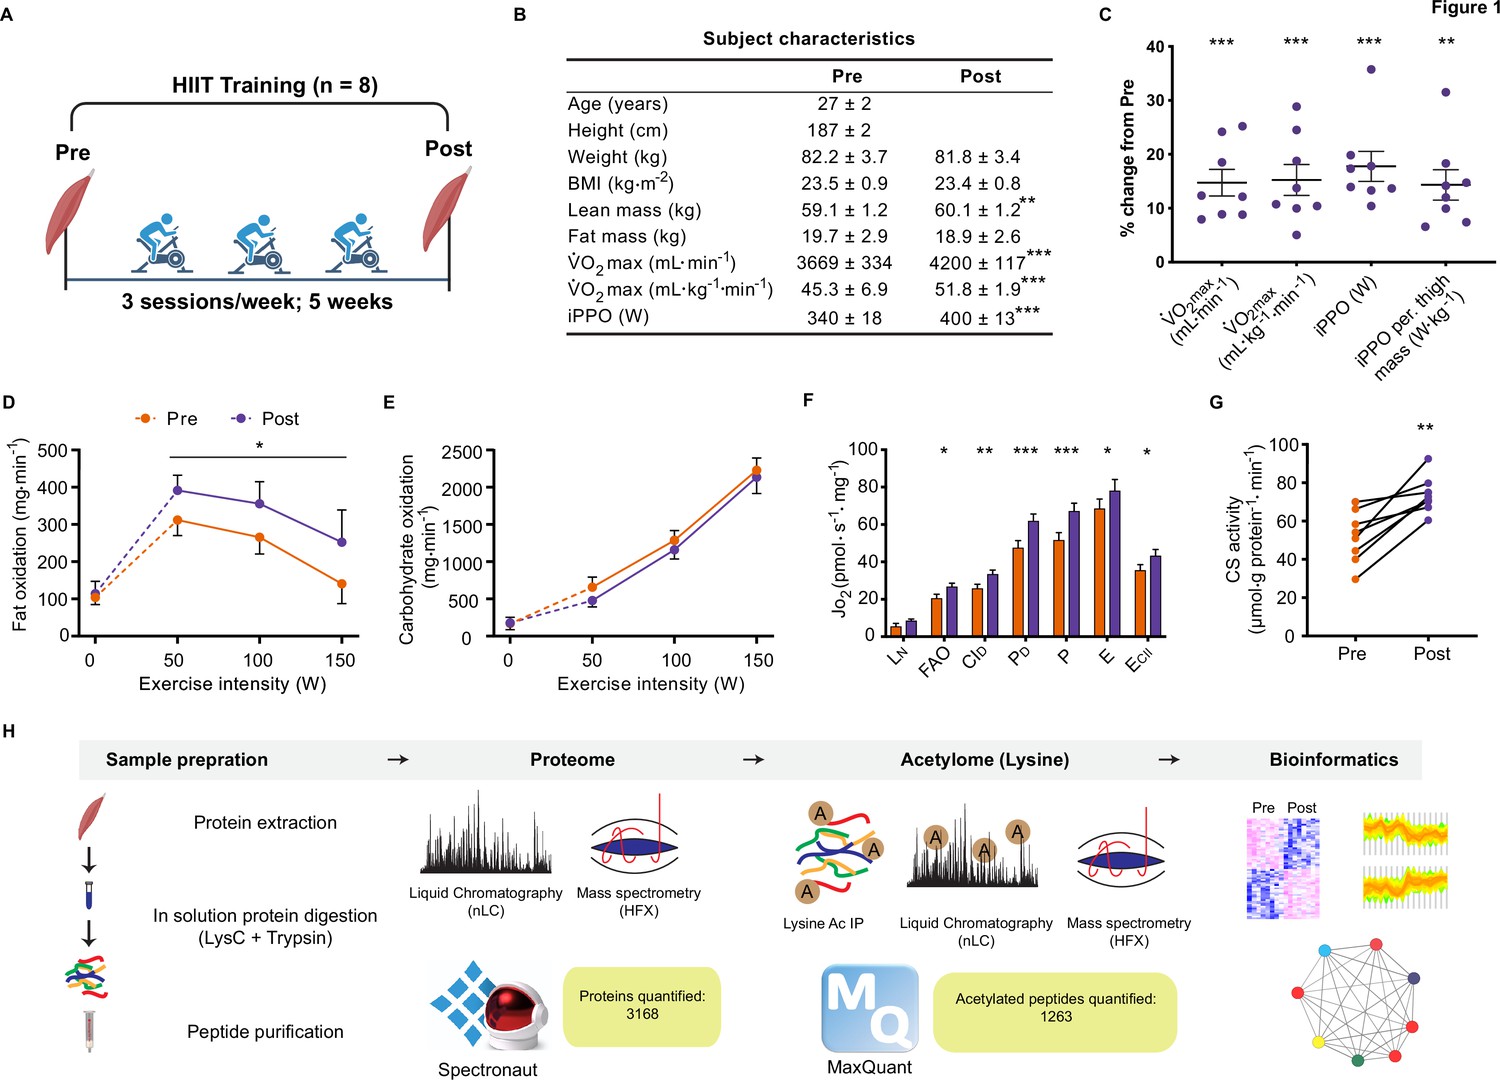
Physiological adaptations to HIIT.
(A) Experimental overview. (B). Subject characteristics. (C). Five weeks of HIIT increased maximal oxygen uptake (V̇O2max) and incremental peak power output (iPPO). (D) HIIT increased whole-body fat oxidation during submaximal exercise (50–150 W) without altering (E). carbohydrate oxidation. (F). HIIT increased mitochondrial respiration in skeletal muscle (LN: leak respiration, FAO: fatty acid oxidation, CID: submaximal CI respiration, PD: submaximal CI +II respiration, P: oxidative phosphorylation capacity, E: electron transport system capacity, ECII: succinate-supported electron transport system capacity). (G). HIIT increased skeletal muscle citrate synthase (CS) activity. (H). Analytical workflow. Summary statistics are mean ± SEM (n=8). * p<0.05, ** p<0.01, *** p<0.001.
-
Figure 1—source data 1
Source data for Figure 1.
- https://cdn.elifesciences.org/articles/69802/elife-69802-fig1-data1-v1.xlsx
Figure 1—figure supplement 1
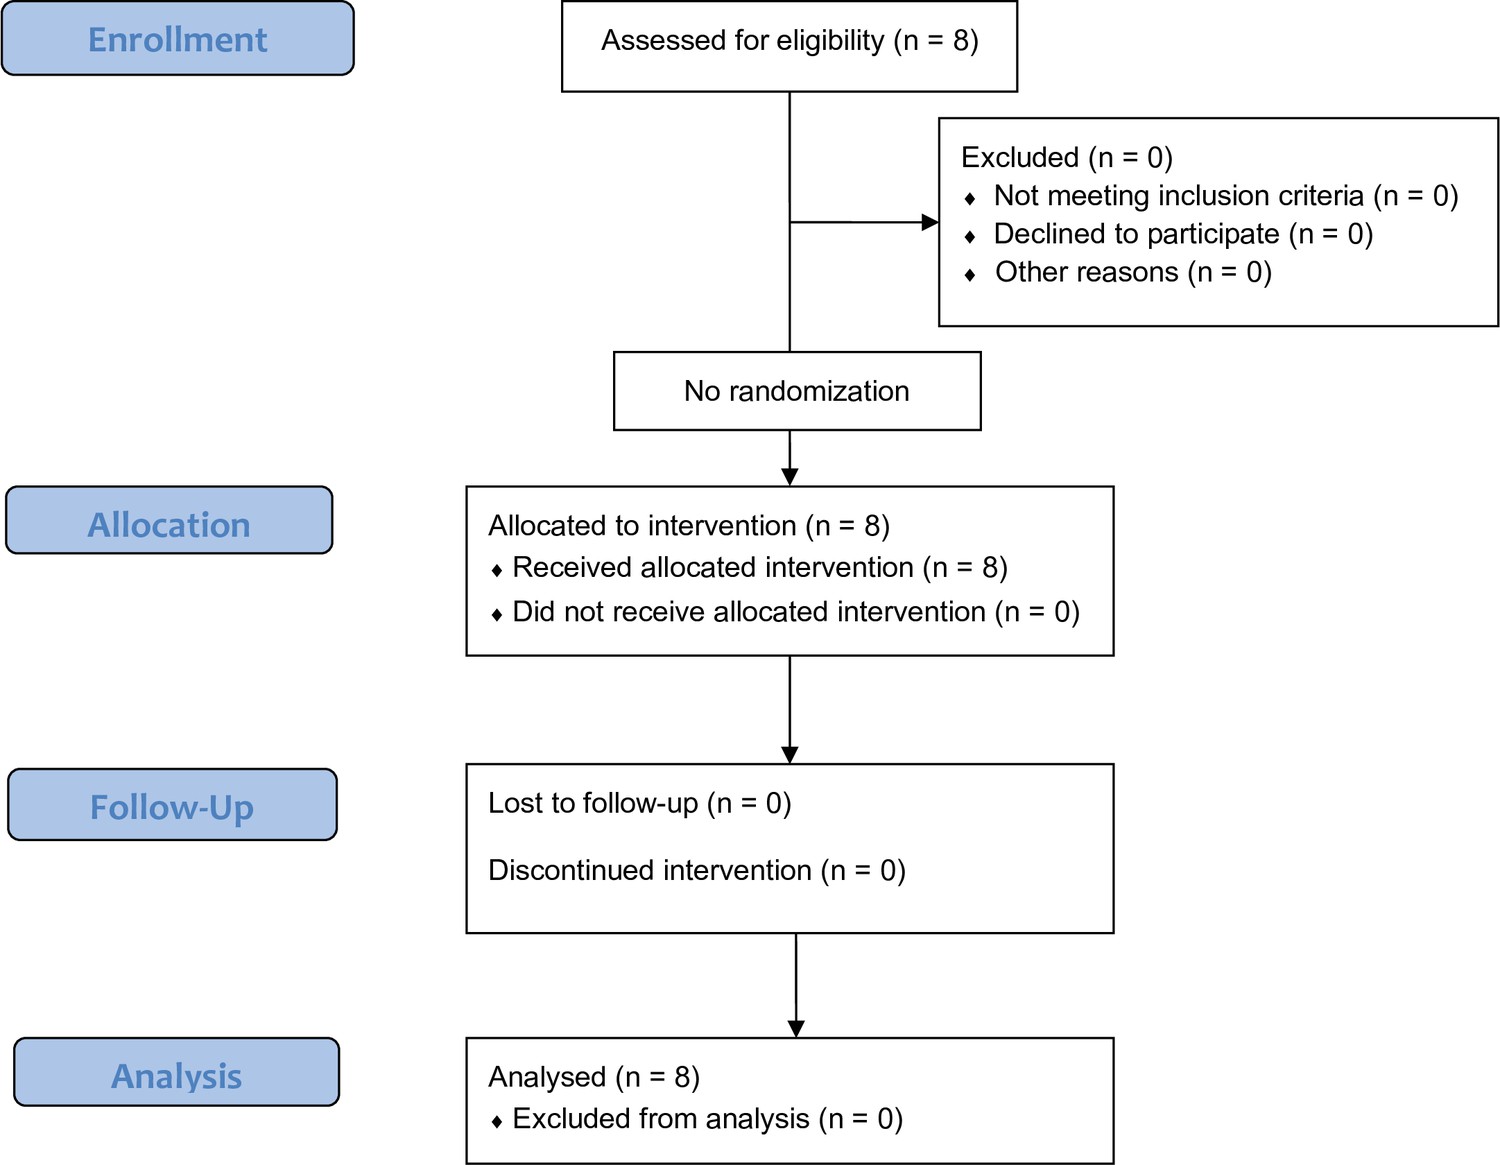
CONSORT flow diagram of enrolled participants.
Figure 1—figure supplement 2
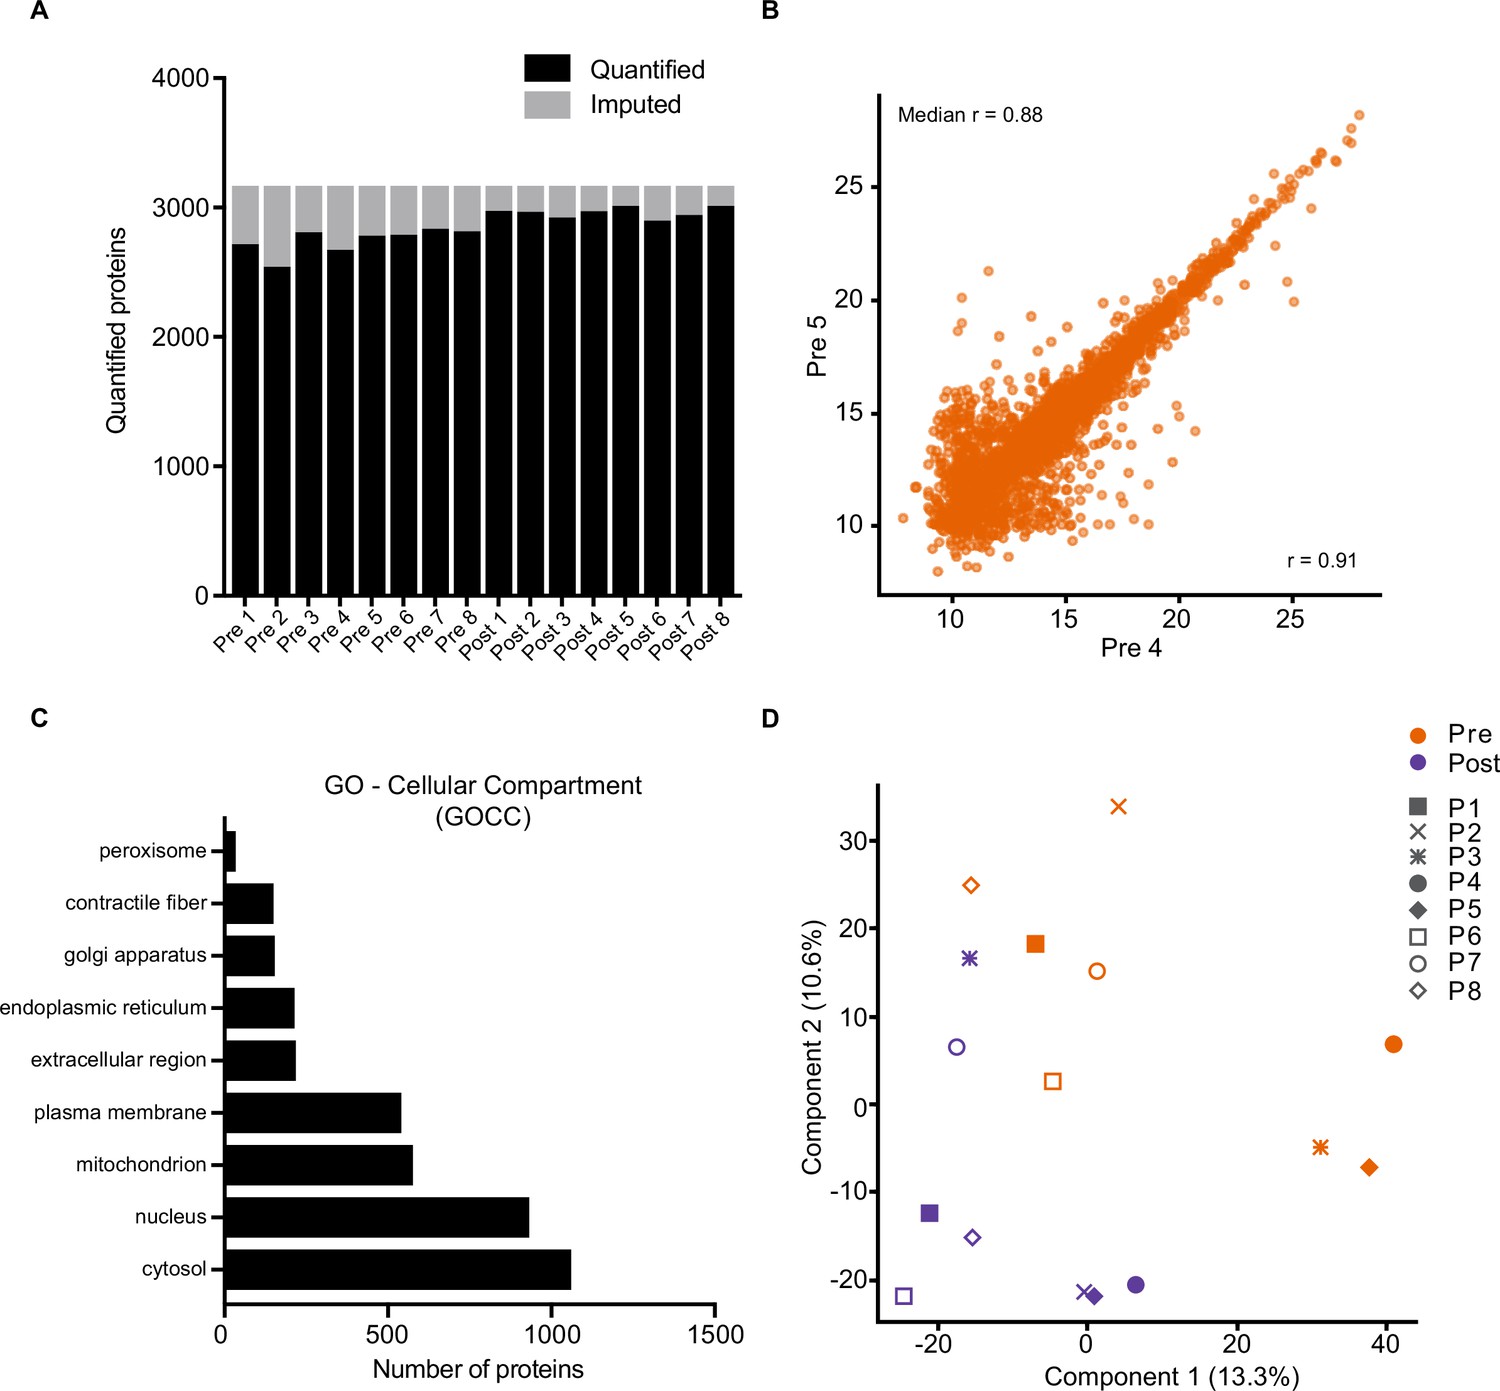
Proteome quality control.
(A) Quantified proteins from each sample. (B). Representative Pearson correlation between biological replicates (Pre 4 v Pre 5). (C). Cellular compartment (GOCC) coverage of the proteome. (D). Principal component analysis of the proteome. P: participant.
Figure 2 with 1 supplement
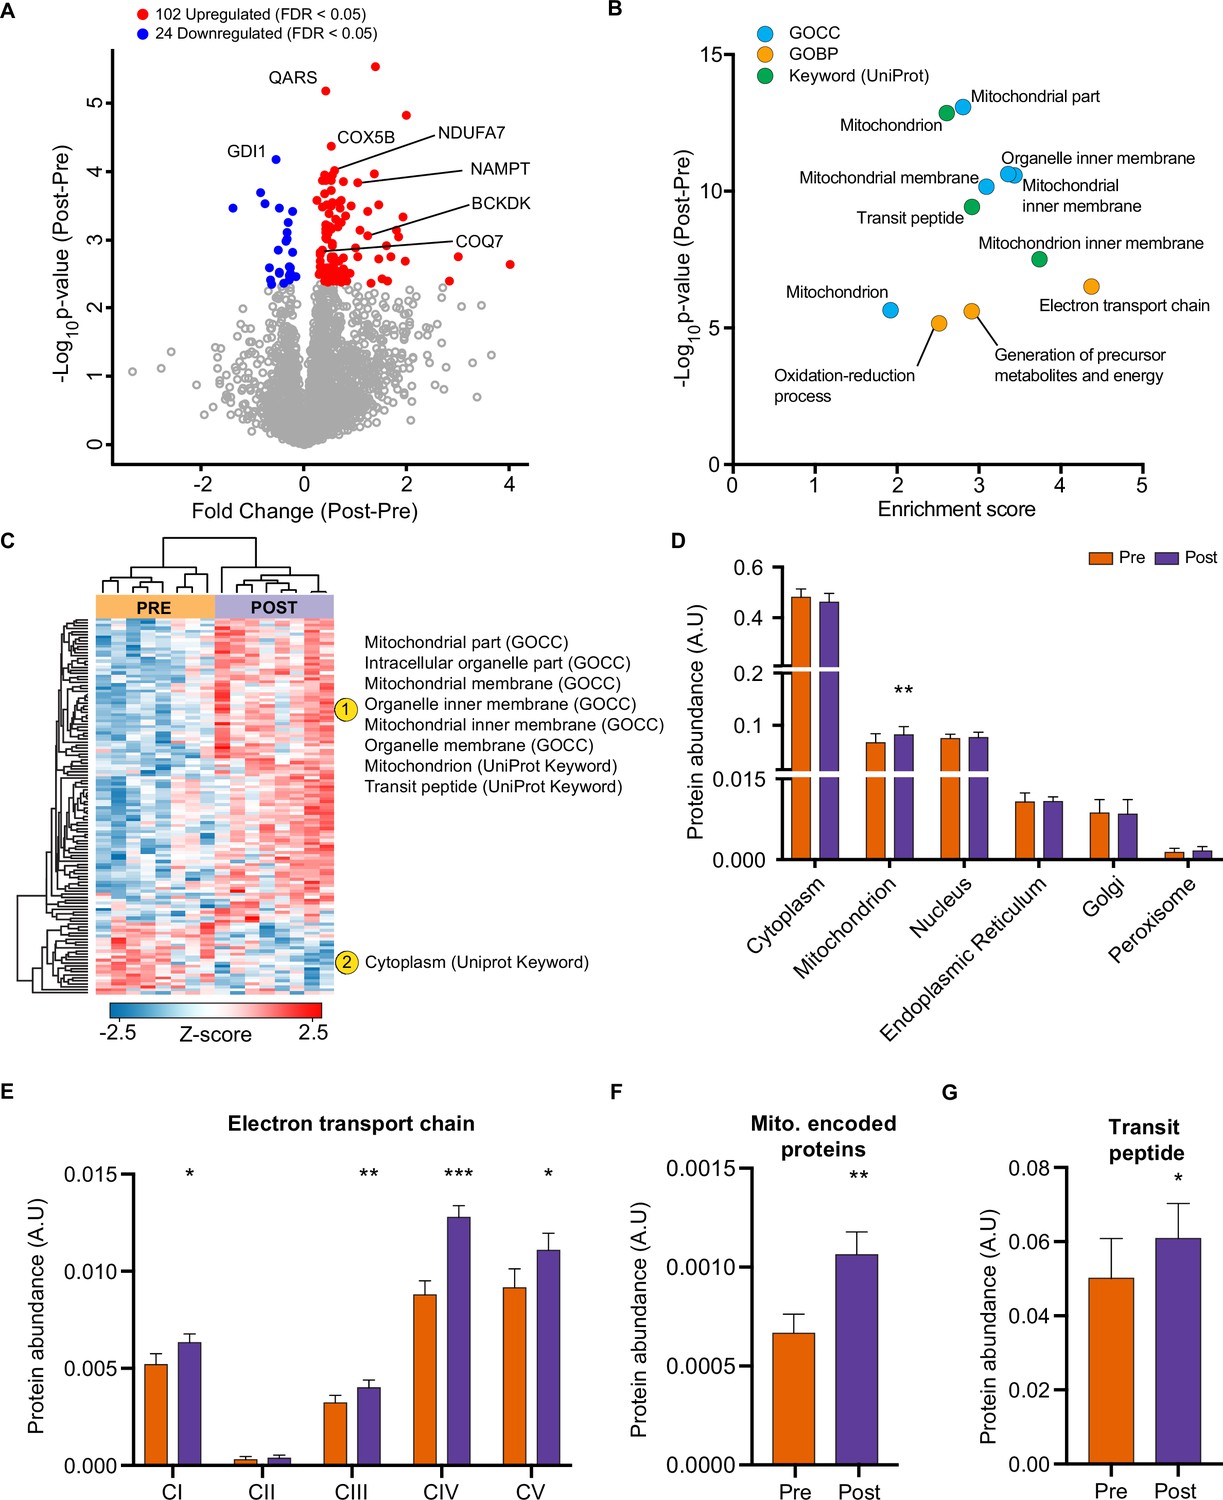
HIIT increases mitochondrial proteins and reduces a subset of contractile fiber associated proteins.
(A) Volcano plot displaying 102 upregulated and 24 downregulated proteins following HIIT (FDR <0.05). (B). Fisher’s exact tests identified the enrichment of mitochondrial terms within the differentially regulated proteins (enrichment analysis FDR <0.02). (C). Hierarchical clustering and enrichment analysis (enrichment analysis FDR <0.02) on differentially regulated proteins identified that mitochondrial terms are enriched within the upregulated proteins, while cytoplasm (UniProt Keyword) is enriched amongst the downregulated proteins. (D). Summed total protein abundances for different organelles (UniProt Keyword) shows upregulation of the mitochondrial protein content. (E–G). Summed total protein abundances display upregulation of electron transport chain complexes (E), mitochondrially encoded proteins (F) and proteins with a transit peptide (G). Summary statistics are mean ± SEM (n=8). * p<0.05, ** p<0.01, *** p<0.001.
Figure 2—figure supplement 1
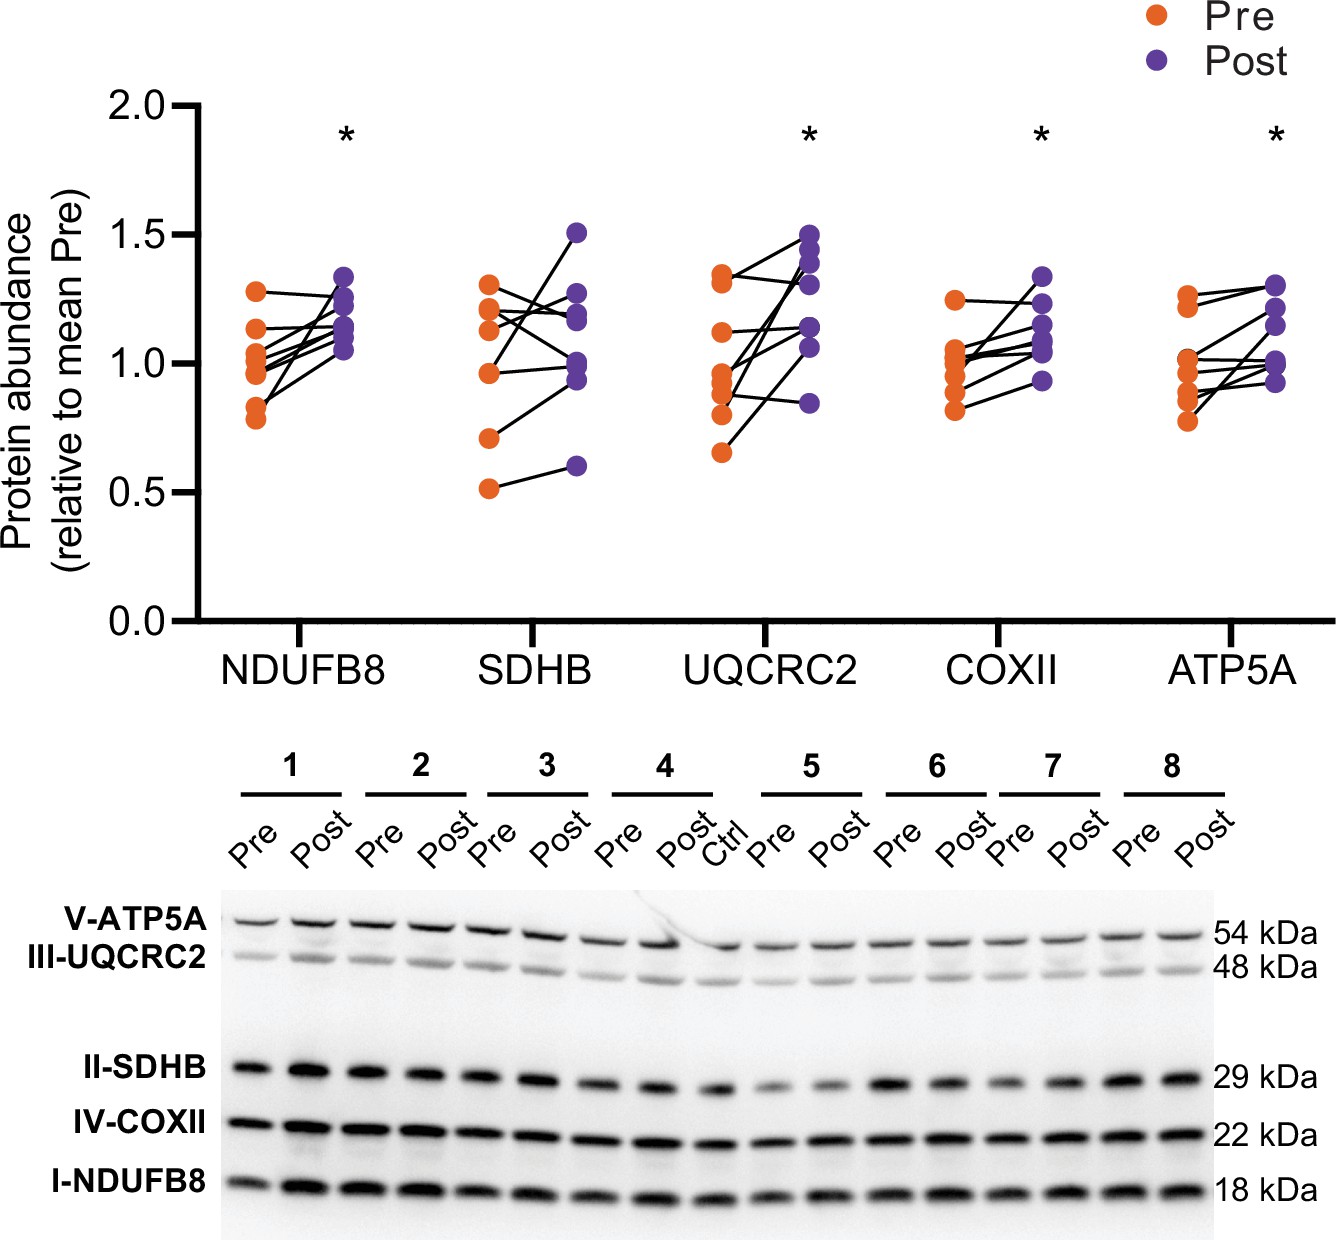
HIIT increases electron transport chain subunits.
Immunoblotting analyses confirmed the upregulation of electron transport chain proteins. Representative images confirming equal loading are displayed in Figure 5—figure supplement 2. Summary statistics are mean ± SEM (n=8). * p<0.05, ** p<0.01, *** p<0.001.
-
Figure 2—figure supplement 1—source data 1
Full image and annotation of OXPHOS immunoblot.
- https://cdn.elifesciences.org/articles/69802/elife-69802-fig2-figsupp1-data1-v1.pdf
-
Figure 2—figure supplement 1—source data 2
Raw ImageLab file of OXPHOS immunoblot.
- https://cdn.elifesciences.org/articles/69802/elife-69802-fig2-figsupp1-data2-v1.zip
-
Figure 2—figure supplement 1—source data 3
Raw quantification data of OXPHOS immunoblot.
- https://cdn.elifesciences.org/articles/69802/elife-69802-fig2-figsupp1-data3-v1.xlsx
Figure 3 with 1 supplement

HIIT regulates proteins involved in skeletal muscle calcium sensitivity and handling HIIT did not alter the abundance of myosin heavy chain (MYH1: MyHC2x, MYH2: MyHC2a, MYH4: MyHC2x, MYH7: MyHCβ; A) or light chain (B) isoforms.
(C). HIIT regulates proteins controlling myosin phosphorylation. (D). HIIT reduces abundance of subunits of the dihydropyridine receptor. (E). Summed total protein abundances display downregulation of the dihydropyridine receptor. (F). HIIT does not alter the abundance of ryanodine receptor 1. Summary statistics are mean ± SEM (n=8). ^ FDR <0.05. * p<0.05, ** p<0.01, *** p<0.001.
Figure 3—figure supplement 1
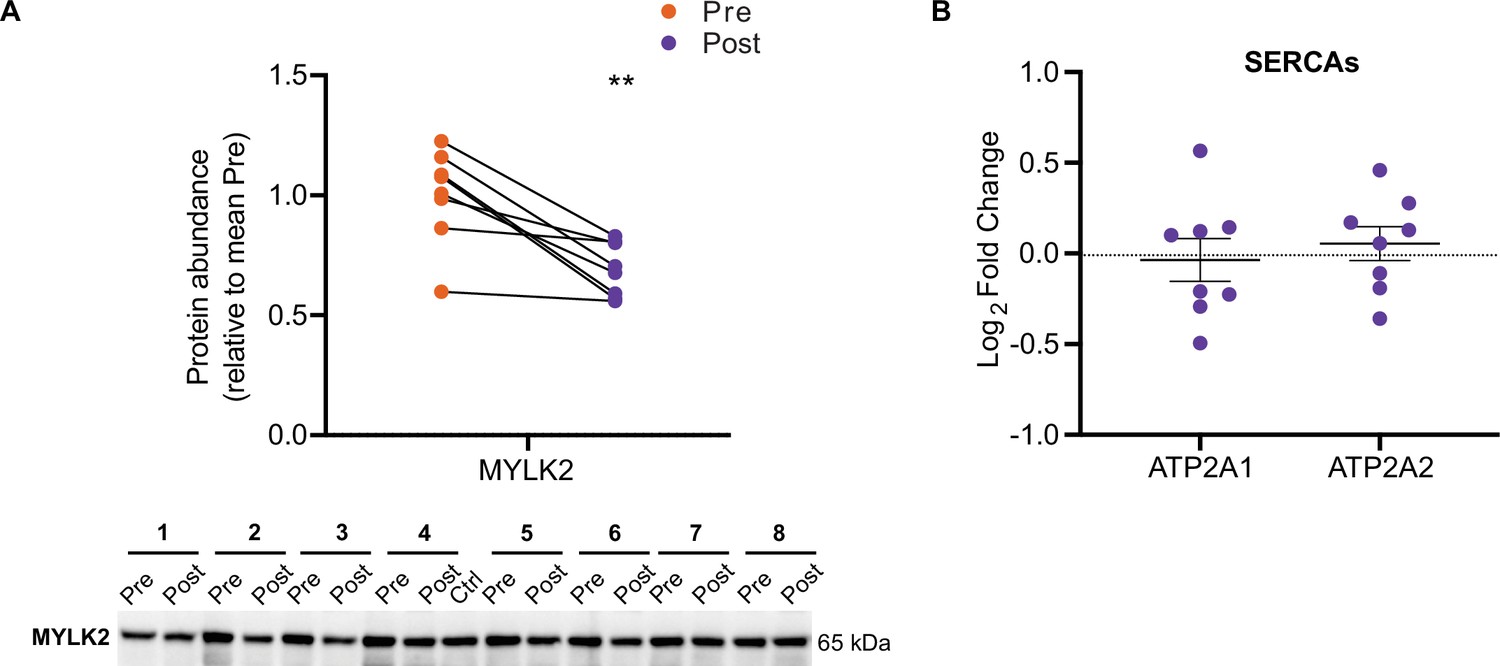
HIIT decreases MYLK2 abundance.
(A) Immunoblotting analysis confirms the downregulation of MYLK2. Representative images confirming equal loading are displayed in Figure 5—figure supplement 2. (B). No change in the abundance of sarcoplasmic/endoplasmic reticulum calcium ATPases 1–3 (SERCAs). Summary statistics are mean ± SEM (n=8). * p<0.05, ** p<0.01, *** p<0.001.
-
Figure 3—figure supplement 1—source data 1
Full image and annotation of MYLK2 immunoblot.
- https://cdn.elifesciences.org/articles/69802/elife-69802-fig3-figsupp1-data1-v1.pdf
-
Figure 3—figure supplement 1—source data 2
Raw ImageLab file of MYLK2 immunoblot.
- https://cdn.elifesciences.org/articles/69802/elife-69802-fig3-figsupp1-data2-v1.zip
-
Figure 3—figure supplement 1—source data 3
Raw quantification data of MYLK2 immunoblot.
- https://cdn.elifesciences.org/articles/69802/elife-69802-fig3-figsupp1-data3-v1.xlsx
Figure 4 with 1 supplement

The human skeletal muscle acetylome displays higher stoichiometry on mitochondrial proteins and lower stoichiometry on contractile proteins.
(A) We quantified 1263 acetyl-sites corresponding to 464 proteins (n=7). Of these, 421 proteins were also quantified in the proteome with 1232 of the quantified acetyl-sites located on these 421 proteins. (B). Distribution of acetyl-sites on proteins within the pre-HIIT acetylome. (C). Top 10 highest intensity acetylated proteins (acetyl-peptide intensities were summed for each protein) within the pre-HIIT acetylome. (D). Cumulative protein abundance and rank within the proteome (the top 10 highest intensity acetyl-proteins are highlighted). (E). One-dimensional enrichment analysis of acetylated protein intensity identified mitochondrial proteins, particularly those involved in carboxylic acid metabolism and monovalent inorganic cation transport (e.g. complex V) as having systematically high acetylation intensities (enrichment analysis FDR <0.02). (F). Top 10 acetyl-sites with highest abundance-corrected intensities (ACIs). (G). One-dimensional enrichment analysis of acetyl-site ACIs identified mitochondrial and carboxylic acid catabolic proteins as higher stoichiometry (positive enrichment factor), while contractile fiber cytosolic and plasma membrane proteins were enriched as lower stoichiometry negative enrichment factor; (enrichment analysis FDR <0.02; enrichment performed on leading protein IDs). (H). Histogram depicting the ACI distribution of the total acetylome (blue), the mitochondrial acetyl-sites (green) and the contractile fiber acetyl-sites (yellow). Mitochondrial proteins were distributed at higher ACI values and contractile fiber proteins at lower ACI values than the total acetylome.
Figure 4—figure supplement 1
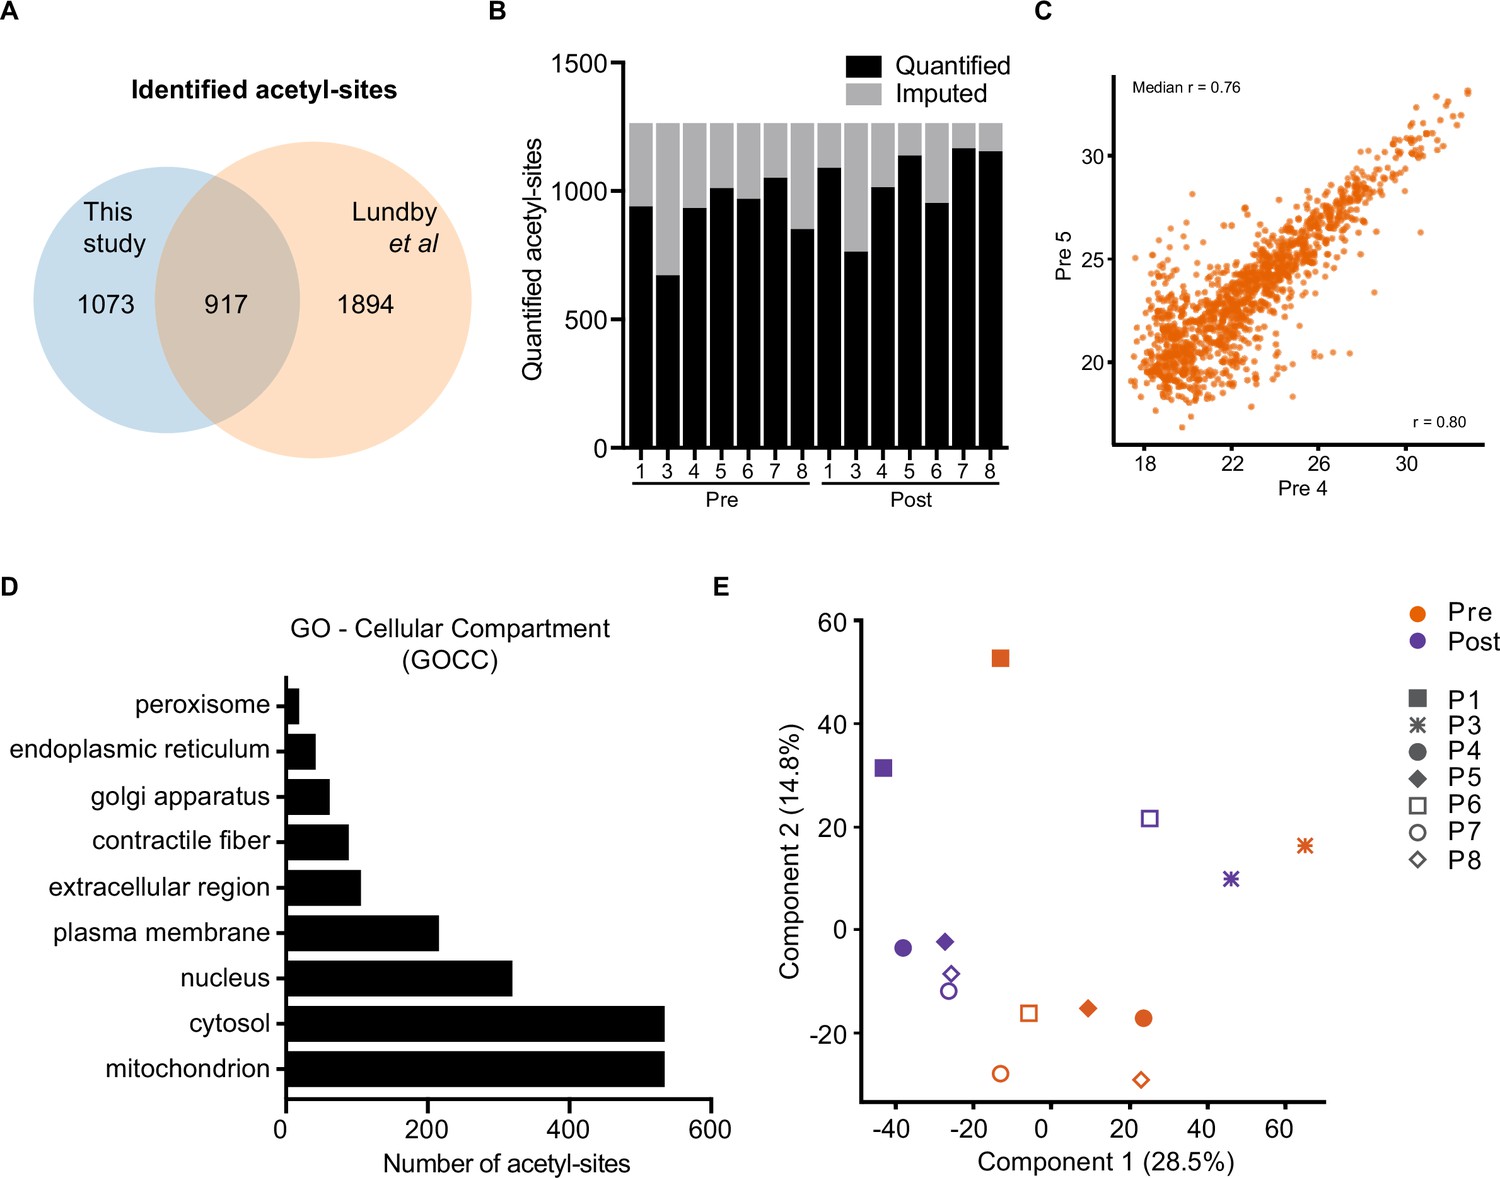
Acetylome quality control.
(A) Overlap between identified acetyl-site with those identified in human skeletal muscle by Lundby et al., 2012. (B). Quantified acetyl-sites from each sample. (C). Representative Pearson correlation between biological replicates (Pre 4 v Pre 5). (D). Cellular compartment (GOCC) coverage of the acetylome. (E). Principal component analysis of the acetylome. P: participant.
Figure 5 with 2 supplements
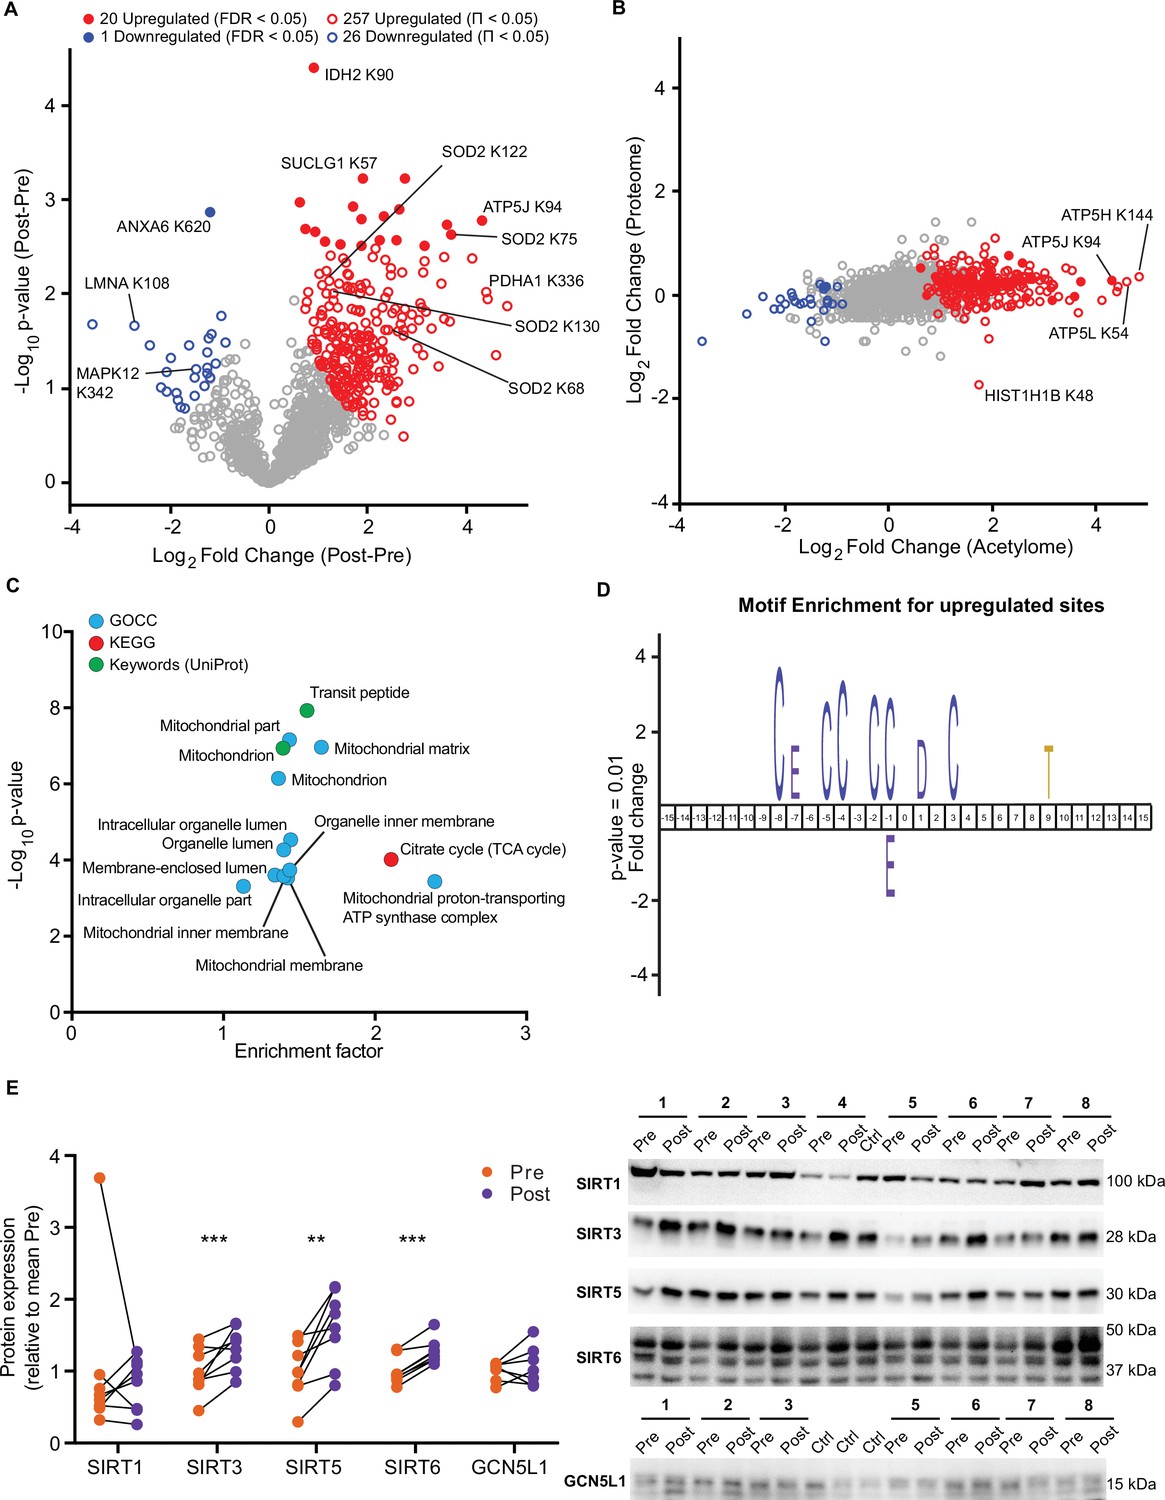
HIIT increases acetylation of mitochondrial and TCA cycle proteins concomitantly with an increase in SIRT3 abundance.
(A) Volcano plot displaying 20 upregulated (filled red circles) and 1 downregulated (filled blue circle) acetyl-sites following HIIT at an FDR <0.05, while 257 acetyl-sites were upregulated (red circles) and 26 downregulated (blue circles) at Π<0.05 (n=7). (B). Scatter plot indicating that HIIT-induced changes in acetyl-site intensity typically exceeded that of the corresponding protein. (C). Fisher’s exact tests identified the enrichment of mitochondrial and TCA cycle terms within the differentially regulated acetyl-proteins (enrichment analysis FDR <0.02; enrichment performed on leading protein IDs). (D). IceLogo motif enrichment (p<0.01) for the upregulated sites displayed a predominance of proximal cysteine residues relative to the acetylated lysine (position 0). (E). Immunoblotting analysis identified the upregulation of the deacetylases SIRT3, SIRT5, and SIRT6, but no change in SIRT1, whilst the mitochondrial acetyltransferase GCN5L1 remained unchanged following HIIT (n=7–8). Representative images confirming equal loading are displayed in Figure 5—figure supplement 2. * p<0.05, ** p<0.01, *** p<0.001.
-
Figure 5—source data 1
Full image and annotation of SIRT1 immunoblot.
- https://cdn.elifesciences.org/articles/69802/elife-69802-fig5-data1-v1.pdf
-
Figure 5—source data 2
Raw ImageLab file of SIRT1 immunoblot.
- https://cdn.elifesciences.org/articles/69802/elife-69802-fig5-data2-v1.zip
-
Figure 5—source data 3
Raw quantification data of SIRT1 immunoblot.
- https://cdn.elifesciences.org/articles/69802/elife-69802-fig5-data3-v1.xlsx
-
Figure 5—source data 4
Full image and annotation of SIRT3 immunoblot.
- https://cdn.elifesciences.org/articles/69802/elife-69802-fig5-data4-v1.pdf
-
Figure 5—source data 5
Raw ImageLab file of SIRT3 immunoblot.
- https://cdn.elifesciences.org/articles/69802/elife-69802-fig5-data5-v1.zip
-
Figure 5—source data 6
Raw quantification data of SIRT3 immunoblot.
- https://cdn.elifesciences.org/articles/69802/elife-69802-fig5-data6-v1.xlsx
-
Figure 5—source data 7
Full image and annotation of SIRT5 immunoblot.
- https://cdn.elifesciences.org/articles/69802/elife-69802-fig5-data7-v1.pdf
-
Figure 5—source data 8
Raw ImageLab file of SIRT5 immunoblot.
- https://cdn.elifesciences.org/articles/69802/elife-69802-fig5-data8-v1.zip
-
Figure 5—source data 9
Raw quantification data of SIRT5 immunoblot.
- https://cdn.elifesciences.org/articles/69802/elife-69802-fig5-data9-v1.xlsx
-
Figure 5—source data 10
Full image and annotation of SIRT6 immunoblot.
- https://cdn.elifesciences.org/articles/69802/elife-69802-fig5-data10-v1.pdf
-
Figure 5—source data 11
Raw ImageLab file of SIRT6 immunoblot.
- https://cdn.elifesciences.org/articles/69802/elife-69802-fig5-data11-v1.zip
-
Figure 5—source data 12
Raw quantification data of SIRT6 immunoblot.
- https://cdn.elifesciences.org/articles/69802/elife-69802-fig5-data12-v1.xlsx
-
Figure 5—source data 13
Full image and annotation of GCN5L1 immunoblot.
- https://cdn.elifesciences.org/articles/69802/elife-69802-fig5-data13-v1.pdf
-
Figure 5—source data 14
Raw ImageLab file of GCN5L1 immunoblot.
- https://cdn.elifesciences.org/articles/69802/elife-69802-fig5-data14-v1.zip
-
Figure 5—source data 15
Raw quantification data of GCN5L1 immunoblot.
- https://cdn.elifesciences.org/articles/69802/elife-69802-fig5-data15-v1.xlsx
Figure 5—figure supplement 1
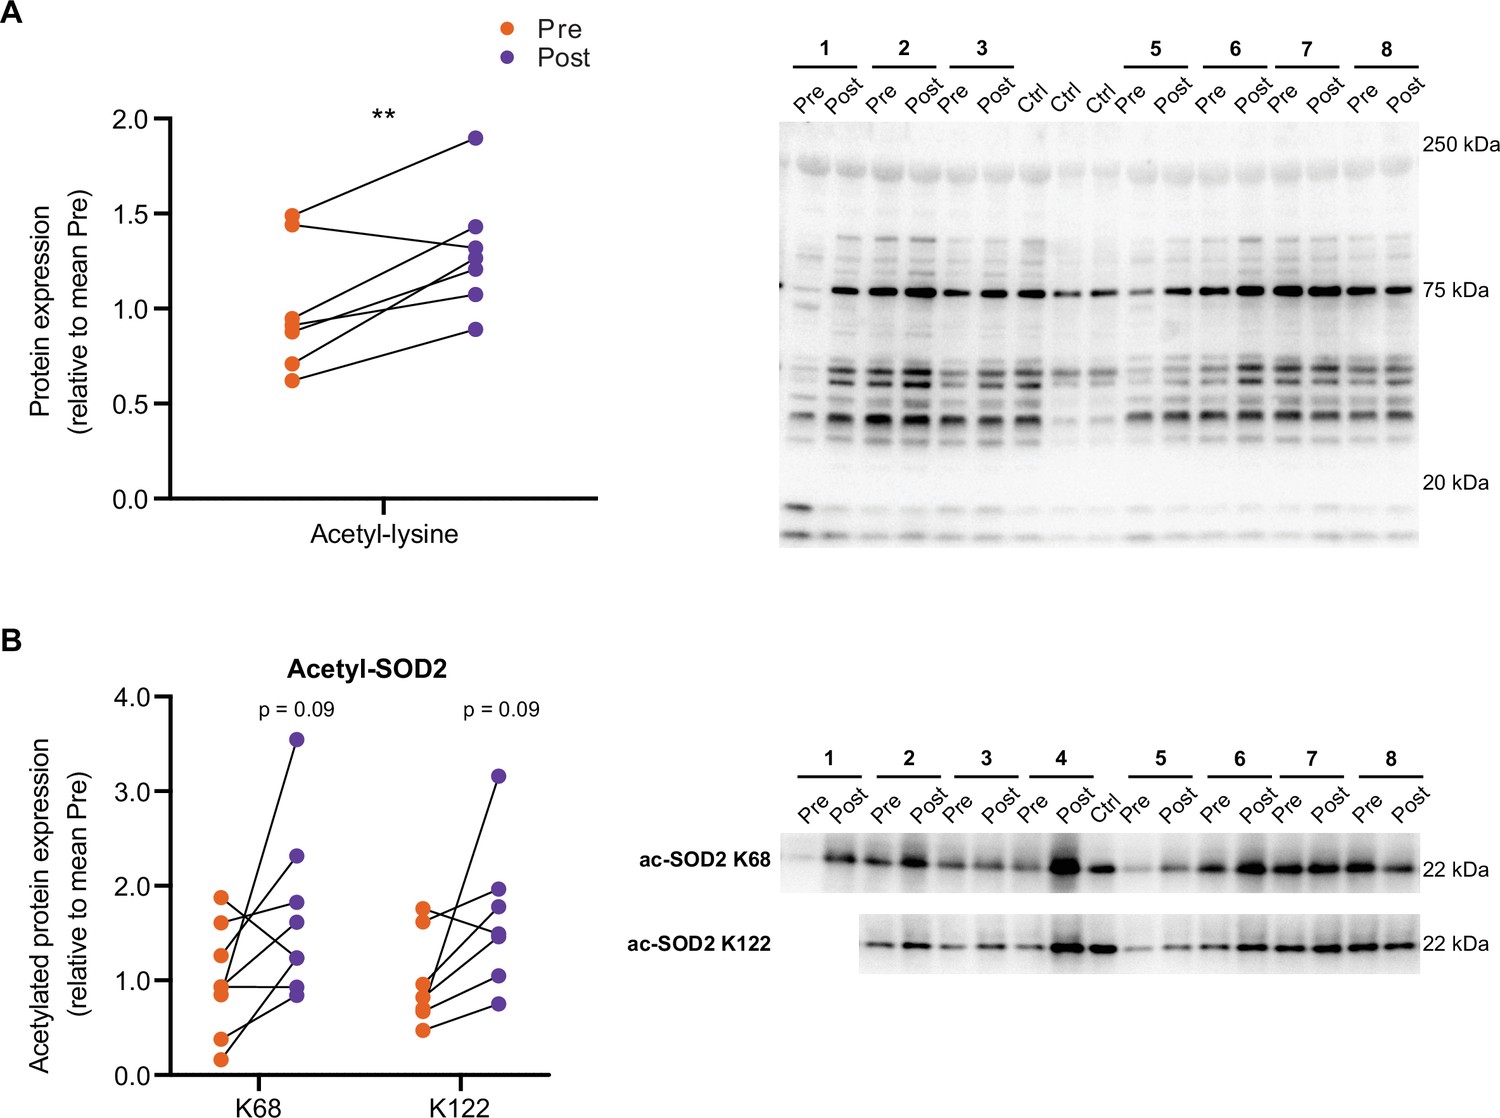
HIIT increases protein acetylation.
(A) Immunoblotting analysis confirmed the upregulation of acetylation following HIIT (n=7). (B) Immunoblotting analysis confirmed the upregulation of acetylation on K68 (n=8) and K122 (n=7) of SOD2 following HIIT. Representative images confirming equal loading are displayed in Figure 5—figure supplement 2. * p<0.05, ** p<0.01, *** p<0.001.
-
Figure 5—figure supplement 1—source data 1
Full image and annotation of Pan-acetyl immunoblot.
- https://cdn.elifesciences.org/articles/69802/elife-69802-fig5-figsupp1-data1-v1.pdf
-
Figure 5—figure supplement 1—source data 2
Raw ImageLab file of Pan-acetyl immunoblot.
- https://cdn.elifesciences.org/articles/69802/elife-69802-fig5-figsupp1-data2-v1.zip
-
Figure 5—figure supplement 1—source data 3
Raw quantification data of Pan-acetyl immunoblot.
- https://cdn.elifesciences.org/articles/69802/elife-69802-fig5-figsupp1-data3-v1.xlsx
-
Figure 5—figure supplement 1—source data 4
Full image and annotation of ac-SOD2 K68 immunoblot.
- https://cdn.elifesciences.org/articles/69802/elife-69802-fig5-figsupp1-data4-v1.pdf
-
Figure 5—figure supplement 1—source data 5
Raw ImageLab file of ac-SOD2 K68 immunoblot.
- https://cdn.elifesciences.org/articles/69802/elife-69802-fig5-figsupp1-data5-v1.zip
-
Figure 5—figure supplement 1—source data 6
Raw quantification data of ac-SOD2 K68 immunoblot.
- https://cdn.elifesciences.org/articles/69802/elife-69802-fig5-figsupp1-data6-v1.xlsx
-
Figure 5—figure supplement 1—source data 7
Full image and annotation of ac-SOD2 K122 immunoblot.
- https://cdn.elifesciences.org/articles/69802/elife-69802-fig5-figsupp1-data7-v1.pdf
-
Figure 5—figure supplement 1—source data 8
Raw ImageLab file of ac-SOD2 K122 immunoblot.
- https://cdn.elifesciences.org/articles/69802/elife-69802-fig5-figsupp1-data8-v1.zip
-
Figure 5—figure supplement 1—source data 9
Raw quantification data of ac-SOD2 K122 immunoblot.
- https://cdn.elifesciences.org/articles/69802/elife-69802-fig5-figsupp1-data9-v1.xlsx
Figure 5—figure supplement 2
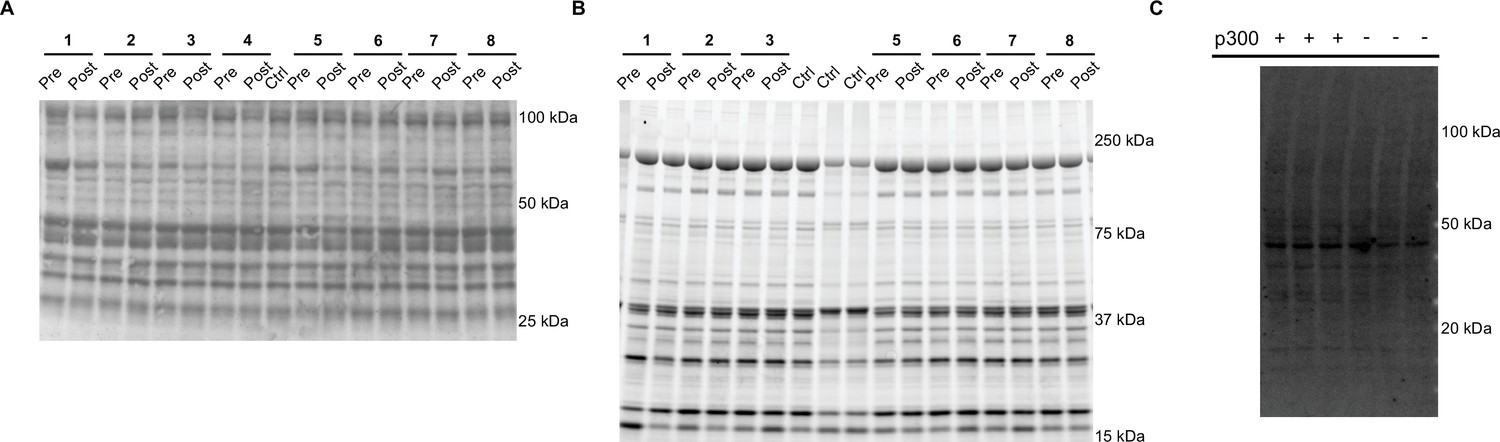
Representative images of equal loading for immunoblot analyses.
(A) Coomassie stain for n=8 immunoblots of human skeletal muscle (Figure 5E (SIRT1-6), Figure 7E, Figure 2—figure supplement 1, and Figure 3—figure supplement 1). (B). Stain-free image for n=7 immunoblots of human skeletal muscle (Figure 5E (GCN5L1), and Figure 5—figure supplement 1A). (C). Stain-free image for EP300 KD immunoblots (Figure 7F).
-
Figure 5—figure supplement 2—source data 1
Full image and annotation of n=8 Coomassie stain.
- https://cdn.elifesciences.org/articles/69802/elife-69802-fig5-figsupp2-data1-v1.pdf
-
Figure 5—figure supplement 2—source data 2
Raw ImageLab file of n=8 Coomassie stain.
- https://cdn.elifesciences.org/articles/69802/elife-69802-fig5-figsupp2-data2-v1.zip
-
Figure 5—figure supplement 2—source data 3
Full image and annotation of n=7 stain-free blot.
- https://cdn.elifesciences.org/articles/69802/elife-69802-fig5-figsupp2-data3-v1.pdf
-
Figure 5—figure supplement 2—source data 4
Raw ImageLab file of n=7 stain-free blot.
- https://cdn.elifesciences.org/articles/69802/elife-69802-fig5-figsupp2-data4-v1.zip
-
Figure 5—figure supplement 2—source data 5
Full image and annotation of C2C12 stain-free blot.
- https://cdn.elifesciences.org/articles/69802/elife-69802-fig5-figsupp2-data5-v1.pdf
-
Figure 5—figure supplement 2—source data 6
Raw ImageLab file of C2C12 stain-free blot.
- https://cdn.elifesciences.org/articles/69802/elife-69802-fig5-figsupp2-data6-v1.zip
Figure 6
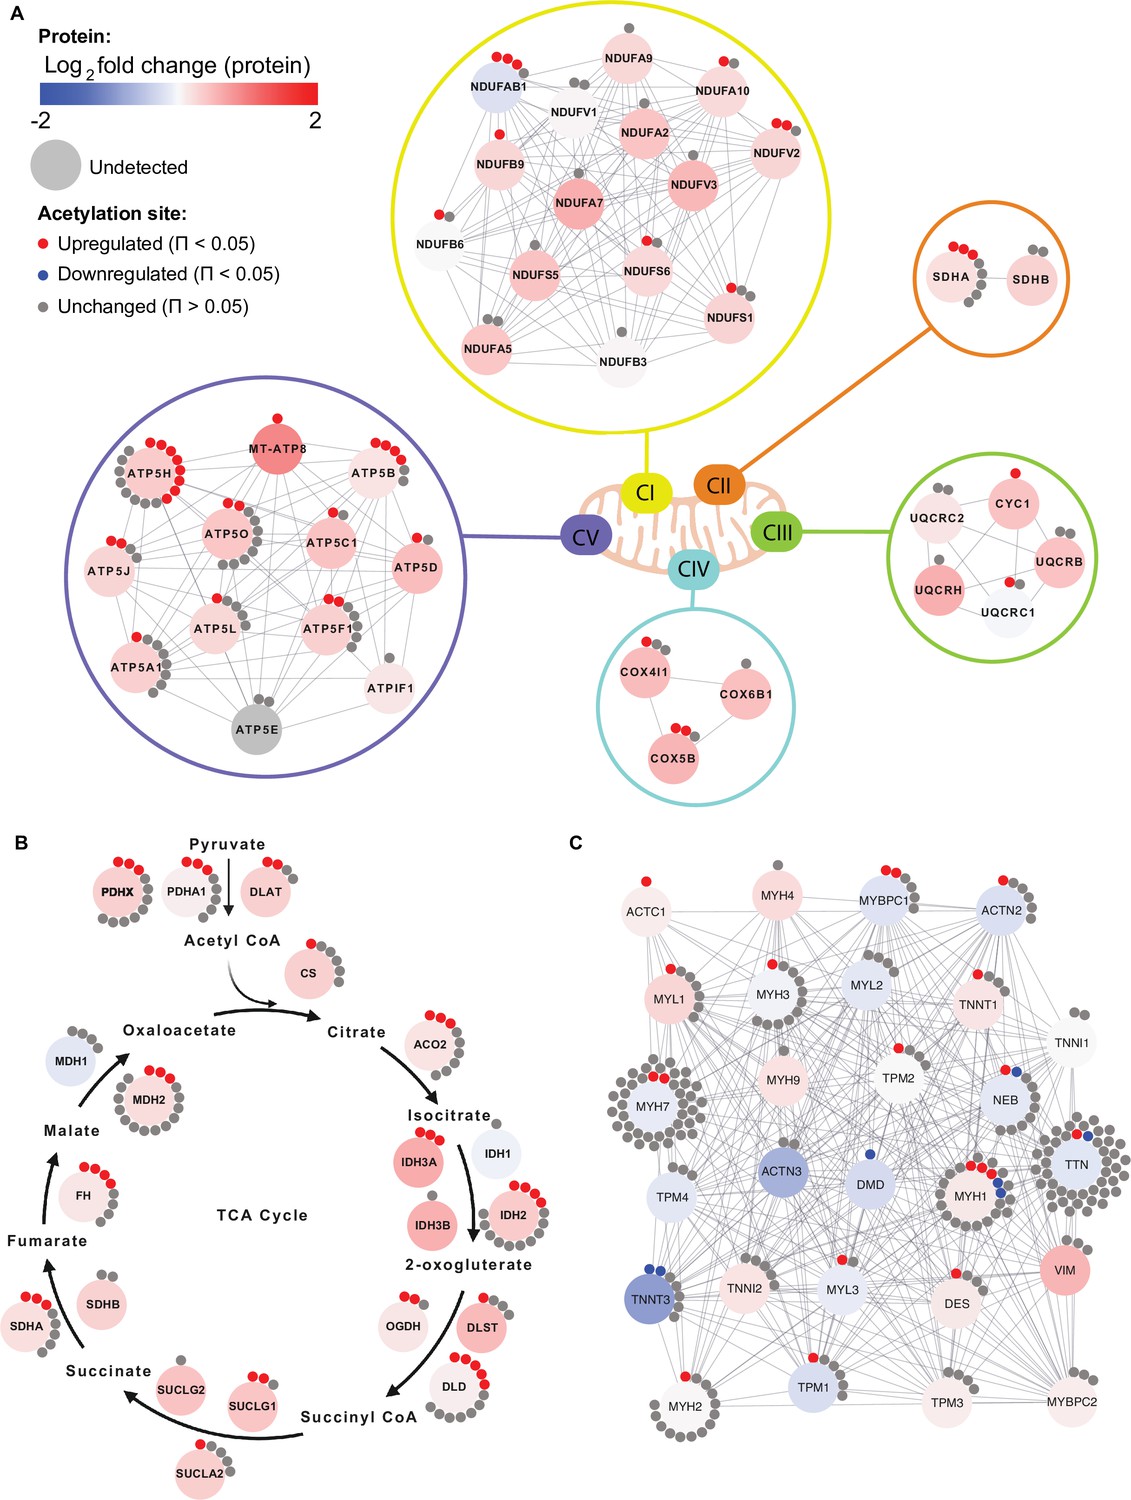
Individual acetyl-site regulation of mitochondrial, TCA cycle and contractile proteins following HIIT.
Regulation of acetyl-sites on (A). electron transport chain complex subunits (annotated by HUGO), (B) TCA cycle proteins (annotated by KEGG) and (C) muscle contraction proteins (annotated by REACTOME).
Figure 7 with 1 supplement
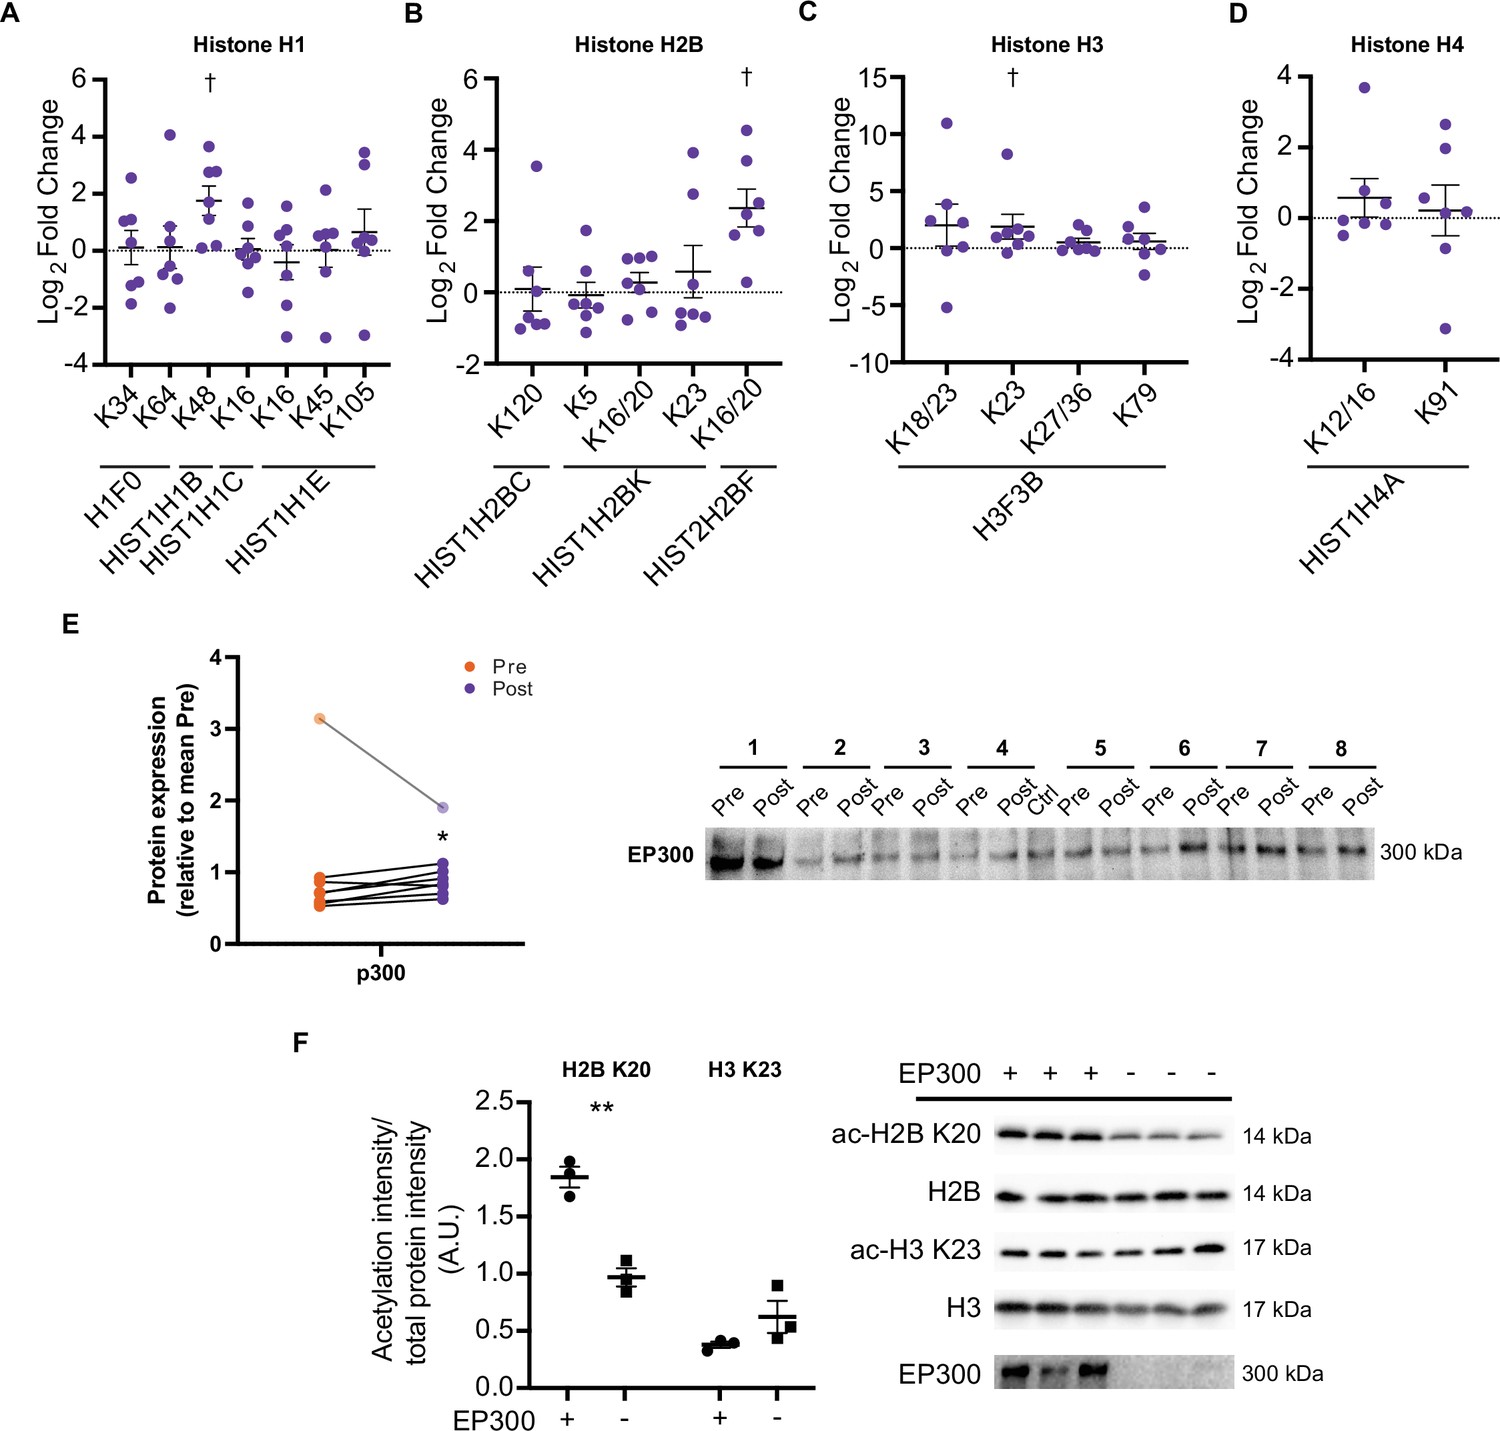
HIIT increases acetylation on specific histone acetyl-sites.
HIIT increased acetylation on (A). H1.5 K48, (B). H2B type 2F K16/20 and (C). H3 K23. (D). HIIT did not alter H4 acetylation (n=7). (E) Immunoblotting analysis identified the upregulation of the nuclear-localized acetyltransferase EP300 (n=8, mean of three technical replicates; participant 1 was excluded as an outlier from statistical analysis (pre, post and fold-change values were all >3 median absolute deviations from the respective median), data for participant 1 is shown in the translucent data points). (F) Knockdown of EP300 reduces acetylation of H2B K20 but not H3 K23 in C2C12 myotubes (n=3). Representative images confirming equal loading are displayed in Figure 5—figure supplement 2. Summary statistics are mean ± SEM. † Π<0.05. * p<0.05, ** p<0.01, *** p<0.001.
-
Figure 7—source data 1
Full image and annotation of H2B immunoblot.
- https://cdn.elifesciences.org/articles/69802/elife-69802-fig7-data1-v1.pdf
-
Figure 7—source data 2
Raw ImageLab file of H2B immunoblot.
- https://cdn.elifesciences.org/articles/69802/elife-69802-fig7-data2-v1.zip
-
Figure 7—source data 3
Full image and annotation of H2B K20 immunoblot.
- https://cdn.elifesciences.org/articles/69802/elife-69802-fig7-data3-v1.pdf
-
Figure 7—source data 4
Raw ImageLab file of H2B K20 immunoblot.
- https://cdn.elifesciences.org/articles/69802/elife-69802-fig7-data4-v1.zip
-
Figure 7—source data 5
Raw quantification data of H2B K20/H2B immunoblots.
- https://cdn.elifesciences.org/articles/69802/elife-69802-fig7-data5-v1.xlsx
-
Figure 7—source data 6
Full image and annotation of H3 immunoblot.
- https://cdn.elifesciences.org/articles/69802/elife-69802-fig7-data6-v1.pdf
-
Figure 7—source data 7
Raw ImageLab file of H3 immunoblot.
- https://cdn.elifesciences.org/articles/69802/elife-69802-fig7-data7-v1.zip
-
Figure 7—source data 8
Full image and annotation of H3 K23 immunoblot.
- https://cdn.elifesciences.org/articles/69802/elife-69802-fig7-data8-v1.pdf
-
Figure 7—source data 9
Raw ImageLab file of H3 K23 immunoblot.
- https://cdn.elifesciences.org/articles/69802/elife-69802-fig7-data9-v1.zip
-
Figure 7—source data 10
Raw quantification data of H3 K20/H3 immunoblots.
- https://cdn.elifesciences.org/articles/69802/elife-69802-fig7-data10-v1.xlsx
-
Figure 7—source data 11
Full image and annotation of EP300 immunoblots (human skeletal muscle).
- https://cdn.elifesciences.org/articles/69802/elife-69802-fig7-data11-v1.pdf
-
Figure 7—source data 12
Raw ImageLab file of EP300 immunoblots (human skeletal muscle, replicate 1).
- https://cdn.elifesciences.org/articles/69802/elife-69802-fig7-data12-v1.zip
-
Figure 7—source data 13
Raw ImageLab file of EP300 immunoblots (human skeletal muscle, replicates 2 & 3).
- https://cdn.elifesciences.org/articles/69802/elife-69802-fig7-data13-v1.zip
-
Figure 7—source data 14
Raw quantification data of EP300 immunoblot (human skeletal muscle).
- https://cdn.elifesciences.org/articles/69802/elife-69802-fig7-data14-v1.xlsx
Figure 7—figure supplement 1
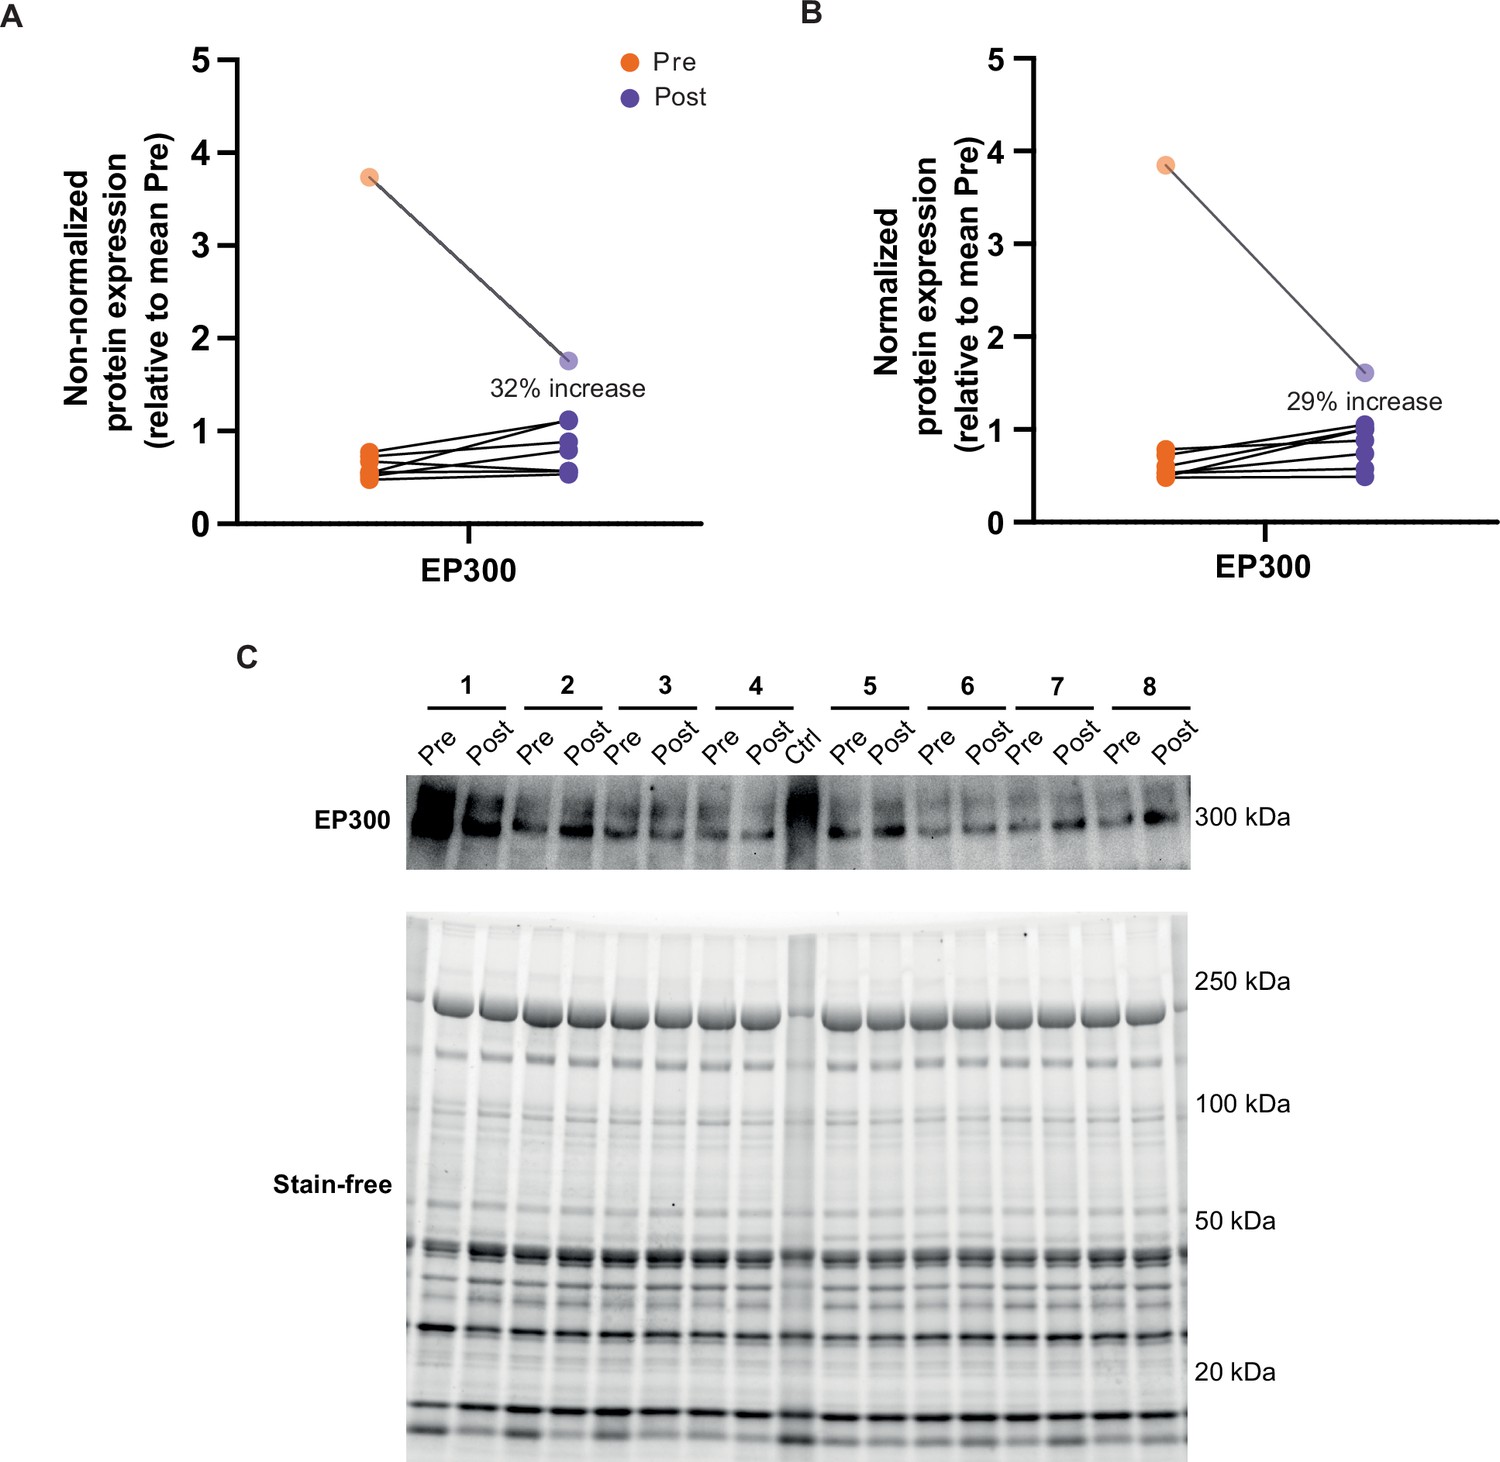
Normalization of EP300.
Normalization of EP300. EP300 displays a similar increase following HIIT without normalization (A) or when normalized to a stain-free blot (B). Data taken from replicate 1 of EP300 immunoblotting. (C) Images of EP300 immunoblot and stain-free blot for replicate 1 of EP300 immunoblotting.
-
Figure 7—figure supplement 1—source data 1
Full image and annotation of EP300 (human skeletal muscle) replicate 1 stain-free blot.
- https://cdn.elifesciences.org/articles/69802/elife-69802-fig7-figsupp1-data1-v1.pdf
-
Figure 7—figure supplement 1—source data 2
Raw ImageLab file of EP300 (human skeletal muscle) replicate 1 stain-free blot.
- https://cdn.elifesciences.org/articles/69802/elife-69802-fig7-figsupp1-data2-v1.zip
-
Figure 7—figure supplement 1—source data 3
Raw quantification data of EP300 (human skeletal muscle) replicate 1 with and without normalization.
- https://cdn.elifesciences.org/articles/69802/elife-69802-fig7-figsupp1-data3-v1.xlsx
Author response image 1
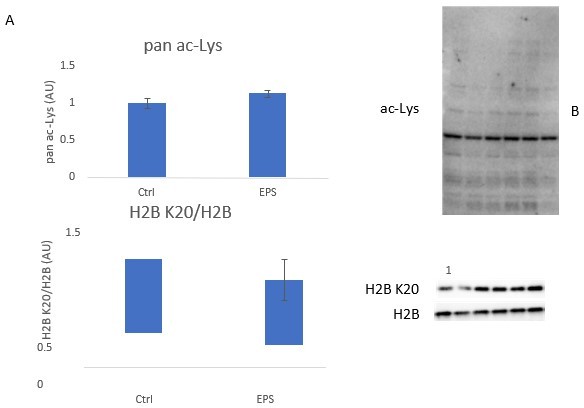
No change in (A) pan-lysine acetylation, or (B) H2B K20 acetylation following 24 hours of electrical pulse stimulation in C2C12 myotubes (n = 6/ group).
Tables
Appendix 1—key resources table
| Reagent type (species) or resource | Designation | Source or reference | Identifiers | Additional information |
|---|---|---|---|---|
| Antibody | MYLK2 Antibody, rabbit polyclonal | Invitrogen | Cat#PA5-29324 RRID: AB_2546800 | (1:1000) |
| Antibody | Total OXPHOS Human WB Antibody Cocktail, mouse monoclonal | Abcam | Cat#ab110411 RRID: AB_2756818 | (1:1000) |
| Antibody | Sirt1(Sir2) Antibody, rabbit polyclonal | Millipore Sigma | Cat#07–131 RRID: AB_10067921 | (1:1000) |
| Antibody | Sirt3 (D22A3) Antibody, rabbit monoclonal | Cell Signaling Technologies | Cat#5490 RRID: AB_10828246 | (1:2000) |
| Antibody | Sirt5 Antibody, rabbit monoclonal | Cell Signaling Technologies | Cat#8782 RRID: AB_2716763 | (1:1000) |
| Antibody | Sirt6 Antibody, rabbit monoclonal | Cell Signaling Technologies | Cat#12486 RRID: AB_2636969 | (1:1000) |
| Antibody | Acetyl-lysine Antibody, rabbit polyclonal | Cell Signaling Technologies | Cat#9441 RRID: AB_331805 | (1:1000) |
| Antibody | Ac-SOD2 K68 Antibody, rabbit monoclonal | Abcam | Cat#ab13737 RRID: AB_2784527 | (1:1000) |
| Antibody | Ac-SOD2 K122 Antibody, rabbit monoclonal | Abcam | Cat#ab214675 RRID: AB_2892634 | (1:1000) |
| Antibody | P300 Mouse Antibody, mouse monoclonal | Santa Cruz Biotechnologies | Cat#sc48343 RRID: AB_628075 | (1:200) |
| Antibody | P300 Mouse Antibody, mouse monoclonal | Santa Cruz Biotechnologies | Cat#sc32244 RRID: AB_628076 | (1:500) |
| Antibody | Ac-H2B K20 Antibody, rabbit monoclonal | Abcam | Cat#ab177430 | (1:1000) |
| Antibody | H2B Antibody, rabbit monoclonal | Cell Signaling Technologies | Cat#12364 RRID: AB_2714167 | (1:3000) |
| Antibody | Ac-H3 K23 Antibody, rabbit monoclonal | Cell Signaling Technologies | Cat#14932 RRID: AB_2798650 | (1:1000) |
| Antibody | H3 Antibody, rabbit monoclonal | Cell Signaling Technologies | Cat#4499 RRID: AB_10544537 | (1:3000) |
| Antibody | Goat Anti-Rabbit Ig, Human ads-HRP, goat polyclonal | Southern Biotech | Cat#4010–05 RRID: AB_2632593 | (1:5000) |
| Antibody | Goat Anti-Mouse, goat polyclonal | Dako (Agilent) | Cat# P0447 RRID: AB_2617137 | (1:5000) |
| Biological sample (human) | Human skeletal muscle (vastus lateralis) | This paper | Not externally available | |
| Cell line (mouse) | C2C12 (ATCC CRL-1772) | ATCC | Cat#1722 RRID: CVCL_0188 | Authenticated by ATCC – CO1 assay. Tested in-house for mycoplasma – negative. |
| Chemical compound, drug | Glycerol | Millipore Sigma | Cat# G5516; CAS# 56-81-5 | |
| Chemical compound, drug | Sodium pyrophosphate decahydrate | Millipore Sigma | Cat# 221368; CAS# 13472-36-1 | |
| Chemical compound, drug | Sodium chloride | Millipore Sigma | Cat# S9888; CAS# 7647-14-5 | |
| Chemical compound, drug | HEPES | Millipore Sigma | Cat# H3375; CAS# 7365-45-9 | |
| Chemical compound, drug | IGEPAL CA-630, NP-40 | Millipore Sigma | Cat# I8896; CAS# 9002-93-1 | |
| Chemical compound, drug | β-Glycerophosphate disodium salt hydrate | Millipore Sigma | Cat# G9422; CAS# 154804-51-0 | |
| Chemical compound, drug | Sodium orthovanadate | Millipore Sigma | Cat# S6508; CAS# 13721-39-6 | |
| Chemical compound, drug | Sodium fluoride | Millipore Sigma | Cat# S1504; CAS# 7681-49-4 | |
| Chemical compound, drug | Phenylmethanesulfonyl fluoride | Millipore Sigma | Cat# P7626; CAS# 329-98-6 | |
| Chemical compound, drug | EDTA (for electrophoresis) | Millipore Sigma | Cat# E5134; CAS# 6381-92-6 | |
| Chemical compound, drug | EGTA | Millipore Sigma | Cat# E4378; CAS# 67-42-5 | |
| Chemical compound, drug | Aprotinin from bovine lung | Millipore Sigma | Cat# A1153; CAS# 9087-70-1 | |
| Chemical compound, drug | Leupeptin | Millipore Sigma | Cat# L2884; CAS# 103476-89-7 | |
| Chemical compound, drug | Benzamidine hydrochloride hydrate | Millipore Sigma | Cat# B6506; CAS# 206752-36-5 | |
| Chemical compound, drug | Bovine serum albumin | Millipore Sigma | Cat# A7906; CAS# 9048-46-8 | |
| Chemical compound, drug | Trizma base | Millipore Sigma | Cat# T1503; CAS# 77-86-1 | |
| Chemical compound, drug | DL-Dithiothreitol | Millipore Sigma | Cat# D0632 and 43819; CAS# 3483-12-3 | |
| Chemical compound, drug | Sodium dodecyl sulfate | Millipore Sigma | Cat# L3771; CAS# 151-21-3 | |
| Chemical compound, drug | Bromophenol Blue sodium salt | Millipore Sigma | Cat# B8026; CAS# 34725-61-6 | |
| Chemical compound, drug | Tween 20 | Millipore Sigma | Cat# P9416; CAS# 9005-64-5 | |
| Chemical compound, drug | Skimmed milk powder | Easis | Cat# 801,300 | |
| Chemical compound, drug | Glycine | Millipore Sigma | Cat# G7126; CAS# 56-40-6 | |
| Chemical compound, drug | 2-propanol | Millipore Sigma | Cat# 109634; CAS# 67-63-0 | |
| Chemical compound, drug | Ethanol 96% | Plum | Cat# 201146; CAS# 64-17-5 | |
| Chemical compound, drug | Brilliant Blue R | Millipore Sigma | Cat# B7920; CAS# 6104-59-2 | |
| Chemical compound, drug | Acetic acid (glacial) 100% | Millipore Sigma | Cat# 100063; CAS# 64-19-7 | |
| Chemical compound, drug | Precision plus all blue | BioRad | Cat# 1610373 | |
| Chemical compound, drug | Precision plus dual color | BioRad | Cat# 1610374 | |
| Chemical compound, drug | Immobilon Forte Western HRP substrate | Millipore Sigma | Cat# WBLUF 0500 | |
| Chemical compound, drug | Bovine Serum Albumin Standard | Thermo Fisher Scientific | Cat# 23,209 | |
| Chemical compound, drug | BCA Protein Assay Reagent A | Thermo Fisher Scientific | Cat# 23,223 | |
| Chemical compound, drug | BCA Protein Assay Reagent B | Thermo Fisher Scientific | Cat# 23,224 | |
| Chemical compound, drug | Potassium phosphate dibasic trihydrate | Millipore Sigma | Cat# P9666; CAS# 16788-57-1 | |
| Chemical compound, drug | Potassium dihydrogen phosphate | Millipore Sigma | Cat# 1.04873; CAS# 7778-77-0 | |
| Chemical compound, drug | BCA Protein Assay Kit | Thermo Fisher Scientific | Cat# 23,225 | |
| Chemical compound, drug | Trizma hydrochloride | Millipore Sigma | Cat# T3253; CAS# 1185-53-1 | |
| Chemical compound, drug | EDTA | Millipore Sigma | Cat# E9884; CAS# 60-00-4 | |
| Chemical compound, drug | NAD | Millipore Sigma | Cat# NAD100-RO; CAS# 53-84-9 | |
| Chemical compound, drug | L-(−)-Malic acid sodium salt | Millipore Sigma | Cat# M1125; CAS# 68303-40-2 | |
| Chemical compound, drug | Acetyl-Coenzyme A | Millipore Sigma | Cat# ACOA-RO | |
| Chemical compound, drug | L-Malate Dehydrogenase (L-MDH) | Millipore Sigma | Cat# LMDH-RO | |
| Chemical compound, drug | NADH | Millipore Sigma | Cat# 10107735001 | |
| Chemical compound, drug | Sucrose | Millipore Sigma | Cat# S7903; CAS# 57-50-1 | |
| Chemical compound, drug | Magnesium chloride hexahydrate | Millipore Sigma | Cat# M2670; CAS# 7791-18-6 | |
| Chemical compound, drug | Taurine | Millipore Sigma | Cat# T0625; CAS# 107-35-7 | |
| Chemical compound, drug | Potassium Dihydrogen Phosphate | Millipore Sigma | Cat# P9791; CAS# 7778-77-0 | |
| Chemical compound, drug | HEPES | Millipore Sigma | Cat# H3375; CAS# 7365-45-9 | |
| Chemical compound, drug | Bovine serum albumin (fatty acid free) | Millipore Sigma | Cat# A7030; CAS# 9048-46-8 | |
| Chemical compound, drug | Catalase from bovine liver | Millipore Sigma | Cat# C9322; CAS# 9001-05-2 | |
| Chemical compound, drug | Lactobionic acid | Millipore Sigma | Cat# 153516; CAS# 96-82-2 | |
| Chemical compound, drug | MES potassium salt | Millipore Sigma | Cat# M0895; CAS# 39946-25-3 | |
| Chemical compound, drug | ATP | Millipore Sigma | Cat# A3377; CAS# 34369-07-8 | |
| Chemical compound, drug | Sodium creatine phosphate dibasic tetrahydrate | Millipore Sigma | Cat# 27920; CAS# 71519-72-7 | |
| Chemical compound, drug | Imidazole | Millipore Sigma | Cat# I0250; CAS# 288-32-4 | |
| Chemical compound, drug | Potassium hydroxide | Millipore Sigma | Cat# P1767; CAS# 1310-58-3 | |
| Chemical compound, drug | Calcium carbonate | Millipore Sigma | Cat# C4830; CAS# 471-34-1 | |
| Chemical compound, drug | Saponin from quillaja bark | Millipore Sigma | Cat# S7900; CAS# 8047-15-2 | |
| Chemical compound, drug | L-(−)-Malic acid sodium salt | Millipore Sigma | Cat# M1125; CAS# 68303-40-2 | |
| Chemical compound, drug | Octanoyl-L-carnitine | Millipore Sigma | Cat# 50892; CAS# 25243-95-2 | |
| Chemical compound, drug | ADP | Millipore Sigma | Cat# A5285; CAS# 72696-48-1 | |
| Chemical compound, drug | L-glutamic acid monosodium salt monohydrate | Millipore Sigma | Cat# 49621; CAS# 6106-04-3 | |
| Chemical compound, drug | Sodium succinate dibasic hexahydrate | Millipore Sigma | Cat# S2378; CAS# 6106-21-4 | |
| Chemical compound, drug | Cytochrome c from equine heart | Millipore Sigma | Cat# C2506; CAS# 9007-43-6 | |
| Chemical compound, drug | FCCP | Millipore Sigma | Cat# C2920; CAS# 370-86-5 | |
| Chemical compound, drug | Rotenone | Millipore Sigma | Cat# R8875; CAS# 83-79-4 | |
| Chemical compound, drug | Malonic acid | Millipore Sigma | Cat# M1296; CAS# 141-82-2 | |
| Chemical compound, drug | Myxothiazol | Millipore Sigma | Cat# T5580; CAS# 76706-55-3 | |
| Chemical compound, drug | Antimycin A from Streptomyces sp. | Millipore Sigma | Cat# A8674; CAS# 1397-94-0 | |
| Chemical compound, drug | Sodium deoxycholate | Sigma-Aldrich | Cat# D6750 CAS# 302-95-4 | |
| Chemical compound, drug | Tris(2-carboxyethyl)phosphine hydrochloride | Sigma-Aldrich | Cat# C4706 CAS# 51805-45-9 | |
| Chemical compound, drug | 2-Chloroacetamide | Sigma-Aldrich | Cat# 22,790 CAS# 79-07-2 | |
| Chemical compound, drug | Trypsin | Sigma-Aldrich | Cat# T7575 | |
| Chemical compound, drug | Lysine | Wako | Cat# 124–06871 | |
| Chemical compound, drug | DMEM high glucose | Gibco | Cat# 41965039 | |
| Chemical compound, drug | Fetal bovine serum(FBS) | Sigma-Aldrich | Cat# F7524 | |
| Chemical compound, drug | Penicillin-Streptomycin, liquid | Gibco | Cat# 15070–063 | |
| Chemical compound, drug | Opti-MEM I Reduced Serum Medium | Gibco | Cat# 31985062 | |
| Chemical compound, drug | TransIT-X2 Dynamic Delivery System | Mirus Bio | Cat# MIR6003 | |
| Sequence-based reagent | EP300 siRNA | Merck Sigma | Cat# SASI_Mm01_00159721 | |
| Commercial assay or kit | PTMScan Acetyl-Lysine Motif [Ac-K] Kit | Cell Signaling Technologies | Cat#13,416 | |
| Software, algorithm, | Graphpad Prism 8.0 | https://www.graphpad.com/ | RRID: SCR_002798 | |
| Software, algorithm | MaxQuant 1.5.3.30 | https://maxquant.org/ | RRID: SCR_014485 | |
| Software, algorithm | Spectronaut v14 | https://biognosys.com/shop/spectronaut | ||
| Software, algorithm | Perseus 1.6.10.50 | http://www.coxdocs.org/doku.php?id=perseus:start | RRID: SCR_015753 | |
| Software, algorithm | R Studio | https://rstudio.com/ | RRID: SCR_000432 | |
| Software, algorithm | Cytoscape v3.7.2 | https://www.cytoscape.org | RRID: SCR_003032 | |
| Software, algorithm | iceLogo | https://iomics.ugent.be/icelogoserver/ | RRID: SCR_012137 | |
| Software, algorithm | Adobe Illustrator 24.3 | https://www.adobe.com/products/illustrator | RRID: SCR_010279 | |
| Software, algorithm | Bio-Rad Image Studio | https://www.licor.com/bio/products/Software, algorithm/image_studio/ | RRID: SCR_014210 | |
| Software, algorithm | Oroboros DatLab 6 V. 6.1.0.7 | https://www.oroboros.at/index.php/product/datlab/ | ||
| Other | Stainless Steel Beads 5 mm | Qiagen | Cat# 69989 | Lysis reagent |
| Other | Stuart Rotator Drive STR4 | Stuart-equipment | Cat# STR4 | Lysis reagent |
| Other | Hettich universal 320 R centrifuge | Andrea Hettich GmbH, Germany | Cat# 1406 | Lysis reagent |
| Other | Emax precision microplate reader | Molecular Devices | Cat# LR88026 | Protein concentration quantification |
| Other | White 96-Well Immuno Plates | Fischer Scientific | Cat# 10415985 | Protein concentration quantification |
| Other | Fluoroskan, Microplate Fluorometer, one dispenser | Fischer Scientific | Cat# 5200111 | Protein concentration quantification |
| Other | Multiskan FC Microplate Photometer | Fischer Scientific | Cat# 11500695 | Protein concentration quantification |
| Other | PowerPac HC Power Supply | BioRad | Cat# 1645052 | Immunoblotting reagent |
| Other | TE 77 ECL Semi-Dry Transfer Unit | Amersham Biosciences | Cat# 80-6211-86 | Immunoblotting reagent |
| Other | ChemiDoc MP Imaging System | BioRad | Cat# 731BR00119 | Immunoblotting reagent |
| Other | 10% Criterion TGX Stain-Free gel | BioRad | Cat# 567–8035 | Immunoblotting reagent |
| Other | 16.5% Criterion Tris-Tricine/Peptide gel | BioRad | Cat# 345–0065 | Immunoblotting reagent |
| Other | Immobilon-P PVDF membrane | Millipore Sigma | Cat# IPVH00010 | Immunoblotting reagent |
| Other | Whatman cellulose chromatography papers | Millipore Sigma | Cat# WHA3030917 | Immunoblotting reagent |
| Other | Sep-Pak C18 Cartrige | Waters | Cat# WAT054955 | Proteomic sample preparation |
| Other | Non-treated 96-Well Microplates | Fischer Scientific | Cat# 10252711 | Proteomic sample preparation |
Additional files
-
Supplementary file 1
Identified proteins.
- https://cdn.elifesciences.org/articles/69802/elife-69802-supp1-v1.xlsx
-
Supplementary file 2
Quantified proteins and their regulation by HIIT.
- https://cdn.elifesciences.org/articles/69802/elife-69802-supp2-v1.xlsx
-
Supplementary file 3
Fisher’s exact test of HIIT-regulated proteins (FDR <0.05).
- https://cdn.elifesciences.org/articles/69802/elife-69802-supp3-v1.xlsx
-
Supplementary file 4
Identified acetyl-sites.
- https://cdn.elifesciences.org/articles/69802/elife-69802-supp4-v1.xlsx
-
Supplementary file 5
Quantified acetyl-sites and their regulation by HIIT.
- https://cdn.elifesciences.org/articles/69802/elife-69802-supp5-v1.xlsx
-
Supplementary file 6
Summed acetylation intensity per protein.
- https://cdn.elifesciences.org/articles/69802/elife-69802-supp6-v1.xlsx
-
Supplementary file 7
One-dimensional enrichment analysis of summed acetylation intensity.
- https://cdn.elifesciences.org/articles/69802/elife-69802-supp7-v1.xlsx
-
Supplementary file 8
Abundance corrected intensities (ACIs) of acetyl-sites pre-HIIT.
- https://cdn.elifesciences.org/articles/69802/elife-69802-supp8-v1.xlsx
-
Supplementary file 9
One-dimensional enrichment analysis of pre-HIIT acetyl-site ACI (Leading protein ID was used for relative enrichment).
- https://cdn.elifesciences.org/articles/69802/elife-69802-supp9-v1.xlsx
-
Supplementary file 10
Fisher’s exact test of HIIT-regulated (Π<0.05) acetyl-sites (Leading protein ID was used for relative enrichment).
- https://cdn.elifesciences.org/articles/69802/elife-69802-supp10-v1.xlsx
-
Transparent reporting form
- https://cdn.elifesciences.org/articles/69802/elife-69802-transrepform1-v1.docx
Download links
A two-part list of links to download the article, or parts of the article, in various formats.
Downloads (link to download the article as PDF)
Open citations (links to open the citations from this article in various online reference manager services)
Cite this article (links to download the citations from this article in formats compatible with various reference manager tools)
High-intensity interval training remodels the proteome and acetylome of human skeletal muscle
eLife 11:e69802.
https://doi.org/10.7554/eLife.69802


