Novel insights from a multiomics dissection of the Hayflick limit
- Calico Life Sciences, LLC, United States
Figures
Figure 1 with 5 supplements
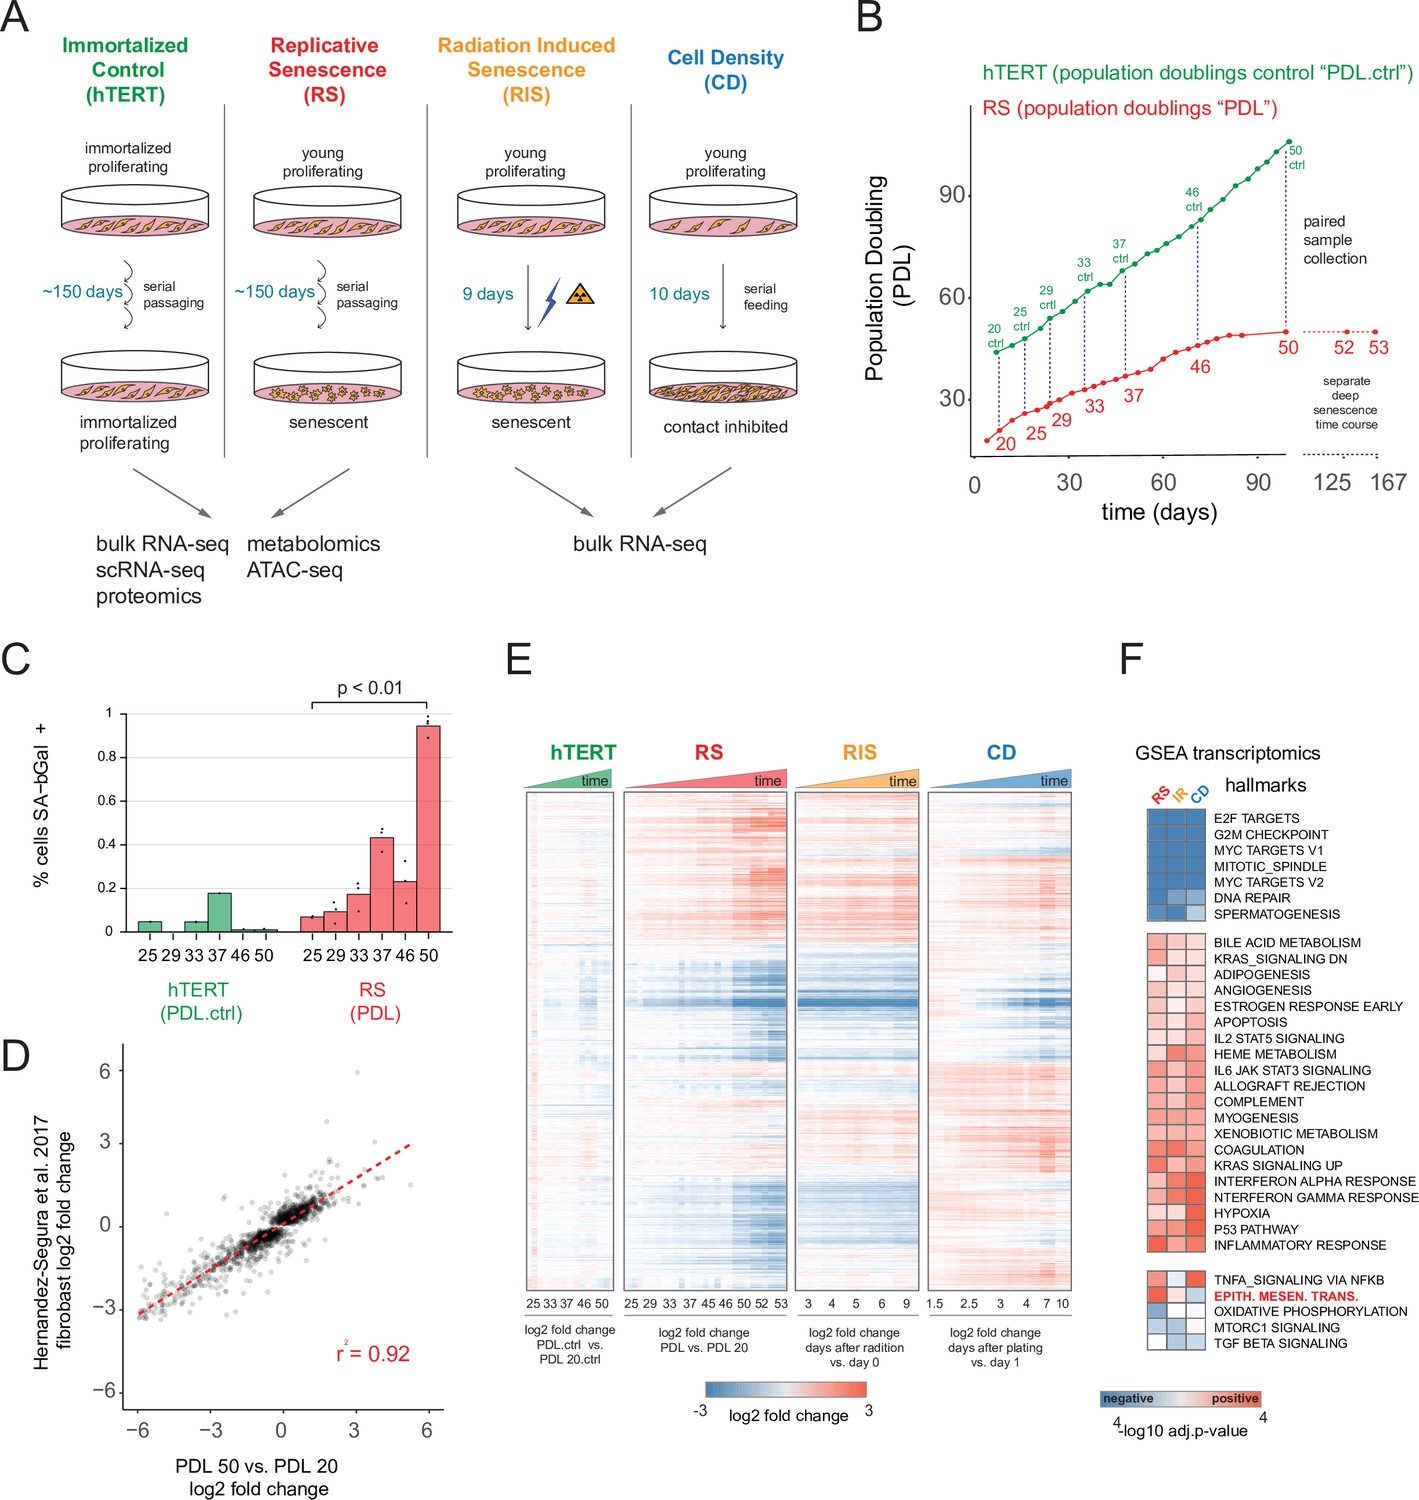
Expression dynamics of replicative senescence (RS), radiation induced senescence (RIS), increasing cell density (CD) and hTERT WI-38 cells.
(A) Experimental design for the RS, RIS, CD and hTERT experiments. (B) Days in culture vs. population doublings (PDL) for WT WI-38 cells (red) and hTERT immortalized cells (green). Labeled points denote sample collection and are expressed in PDLs for RS time course or PDL controls (PDL.ctrl) for the hTERT time course. Temporally paired samples indicated by vertical dotted lines. PDLs 52 and 53 were collected in a separate ‘deep’ senescence time course. (C) Percent cells staining positive for SA-β gal staining (y-axis) at increasing PDLs (x-axis) for WI-38 cells (red) and hTERT (green). Points represent replicate values. (D) Scatterplot of log2 fold changes in gene expression for PDL 50 vs. PDL 20 (x-axis) vs. senescence log2 fold change derived from a generalized linear model compiling gene expression changes across multiple fibroblast cell lines during replicative senescence (y-axis) (Hernandez-Segura et al., 2017). (E) Hierarchical clustering of significant gene expression changes (FDR adjusted p-value < 0.01) across all conditions (n=3 replicates). Values are log2 fold change vs. the average of the first time point of each condition. Reference time point not shown. (F) Significant (FDR adjusted p-value < 0.01) Gene Set Enrichment Analysis (GSEA) results for RS, RIS, and CD using the MSigDB Hallmarks annotation set. The -log10 p-value is colored by direction of enrichment (red=up, blue=down).
-
Figure 1—source data 1
RNA-seq quality control metrics.
- https://cdn.elifesciences.org/articles/70283/elife-70283-fig1-data1-v3.xlsx
-
Figure 1—source data 2
RNA-seq Gene expression data and differential analysis.
- https://cdn.elifesciences.org/articles/70283/elife-70283-fig1-data2-v3.xlsx
-
Figure 1—source data 3
RNA-seq GSEA.
- https://cdn.elifesciences.org/articles/70283/elife-70283-fig1-data3-v3.xlsx
-
Figure 1—source data 4
RNA-seq GSEA for indivdual timepoints.
- https://cdn.elifesciences.org/articles/70283/elife-70283-fig1-data4-v3.xlsx
Figure 1—figure supplement 1

Sample manifest.
Sample manifest for WT and hTERT WI-38 cells.
Figure 1—figure supplement 2
Senescence markers.
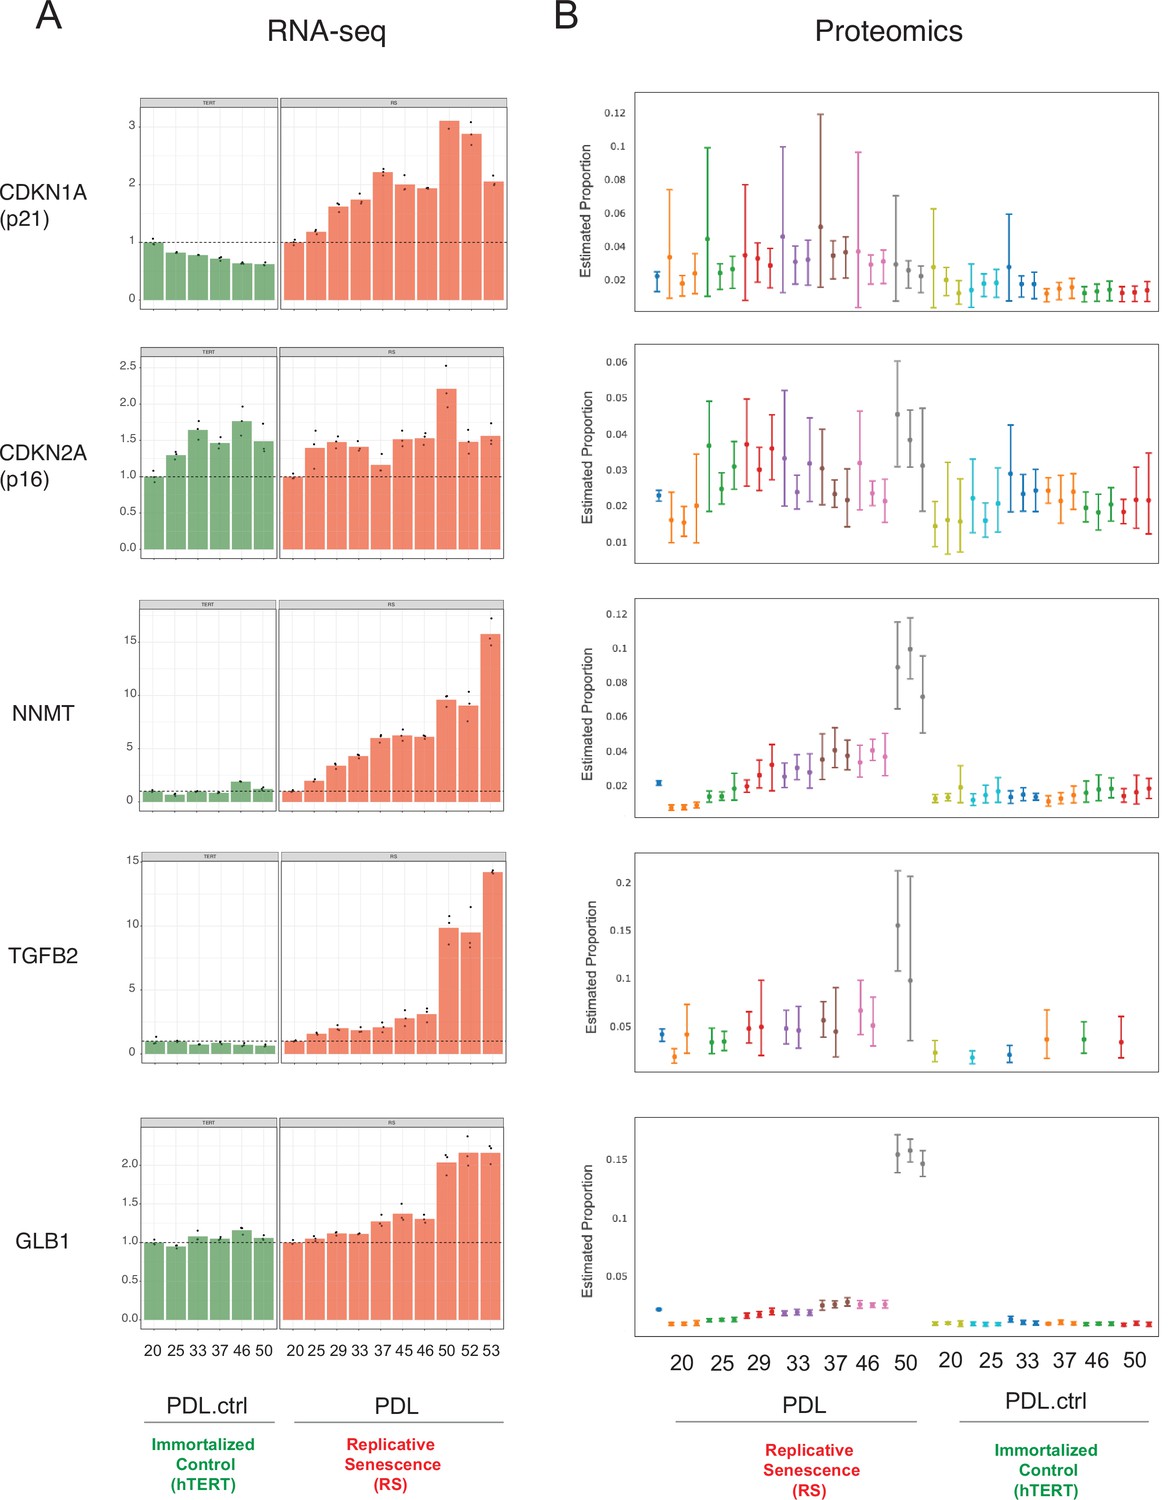
Expression of canonical and novel senescence induced genes (A) RNA-seq quantification for p21, p16, NNMT, TGFB2, and GLB1 (beta-galactosidase) transcripts expressed as fold change relative to reference sample: PDL 20 for WT replicative senescence and PDL.ctrl 20 for hTERT. Bar height represents replicate average (n=3) and each point is an individual sample. (B) Proteomics quantification for same genes as in A. Estimates of relative protein abundance are provided as proportions of one biological replicate (n=3) relative to the total abundance observed across all other replicates in the experiment. This is obtained across multiple plexes with a Bayesian modeling of the intensities as log2 ratios to a bridge channel (blue sample far left). Protein level estimates from these models are then transformed with the inverse additive log-ratio transformation, resulting in a posterior distribution in proportion space.
Figure 1—figure supplement 3
Senescence markers cont’d.
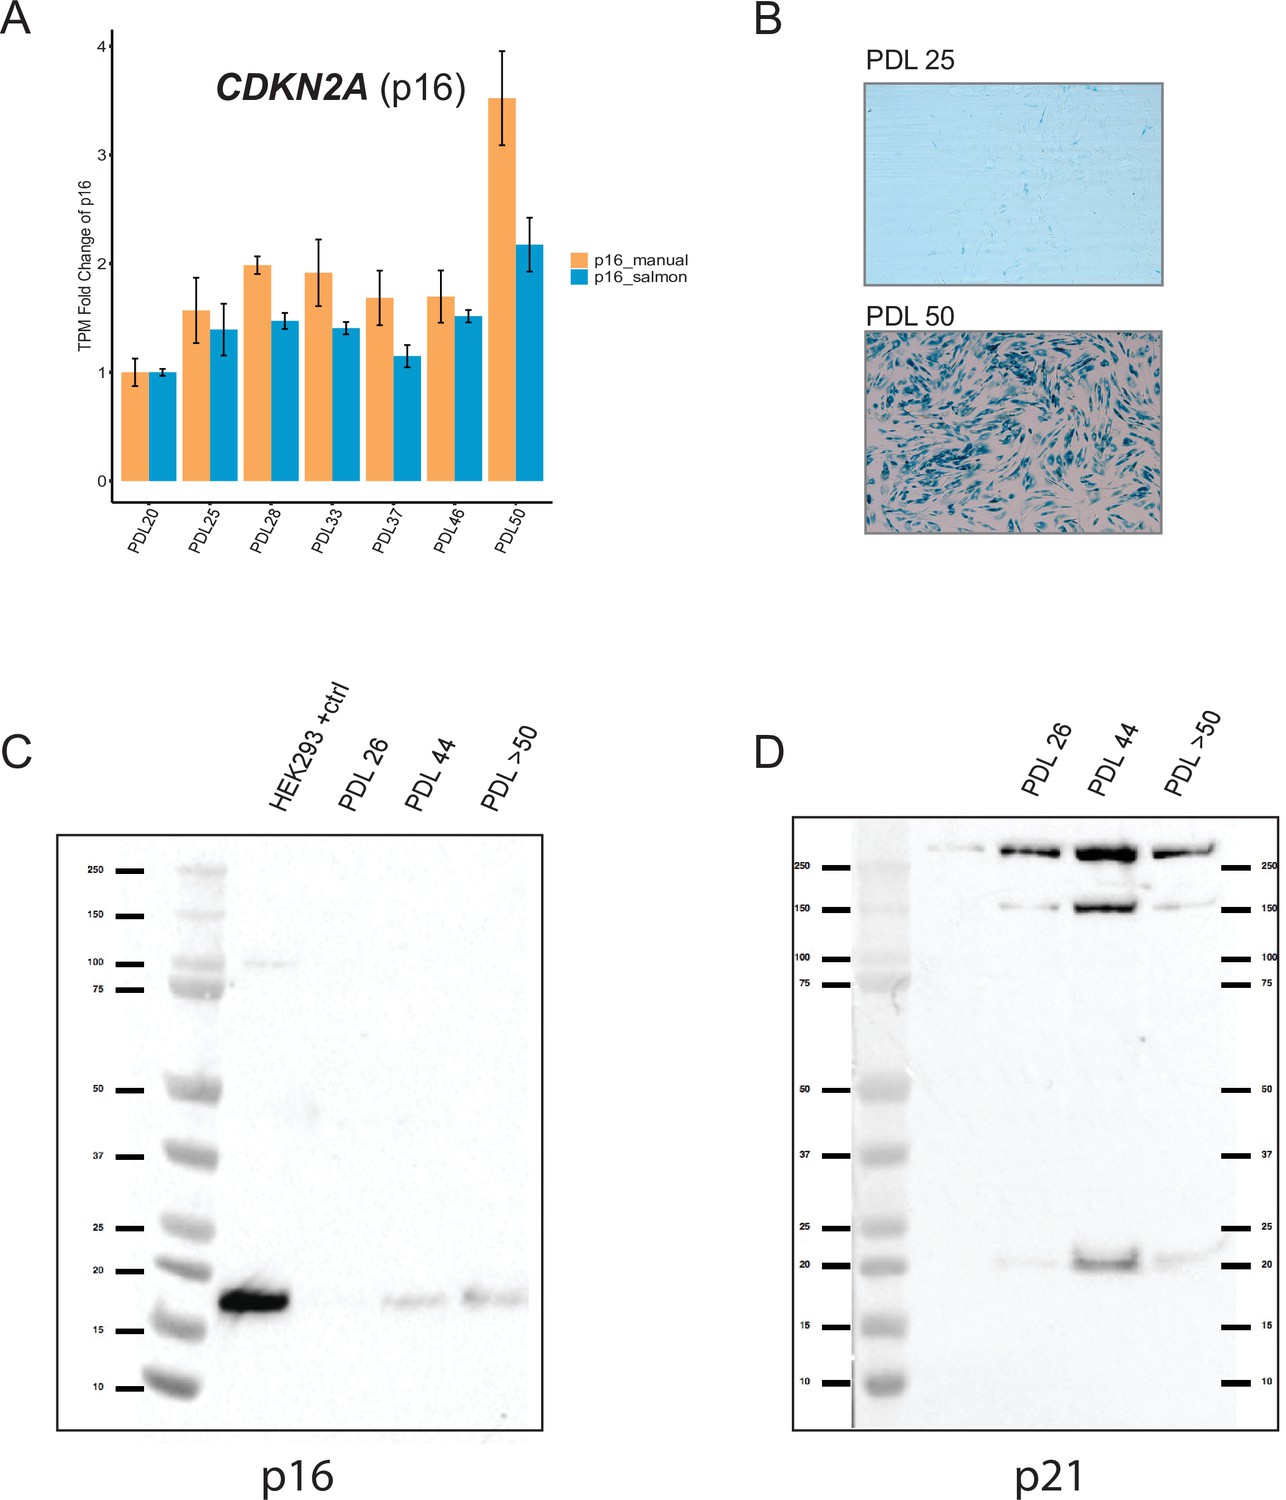
Senescent WI-38 cells express classic senescence markers. (A) Quantification of p16 and p14 gene products from the CDKN1A locus. Values plotted are fold change levels relative to PDL 20. TPM values generated by Salmon using the Gencode v29 annotation set that includes p16 and p14 in one locus (blue). A manual summation of the p16 only transcripts in the locus are shown (orange). Error bars represent the standard deviation of three samples. (B) Representative images for senescence-associated beta-galactosidase assay. (C) Western blot for p16 at three PDLs (26, 44 and >50). Far left lane is p16 positive control derived from HEK293 cells. (D) Western blot for p21 at three PDLs (26, 44 and >50). Far left lane is p21 negative control derived from HEK293 cells.
Figure 1—figure supplement 4
Individual time point GSEA.
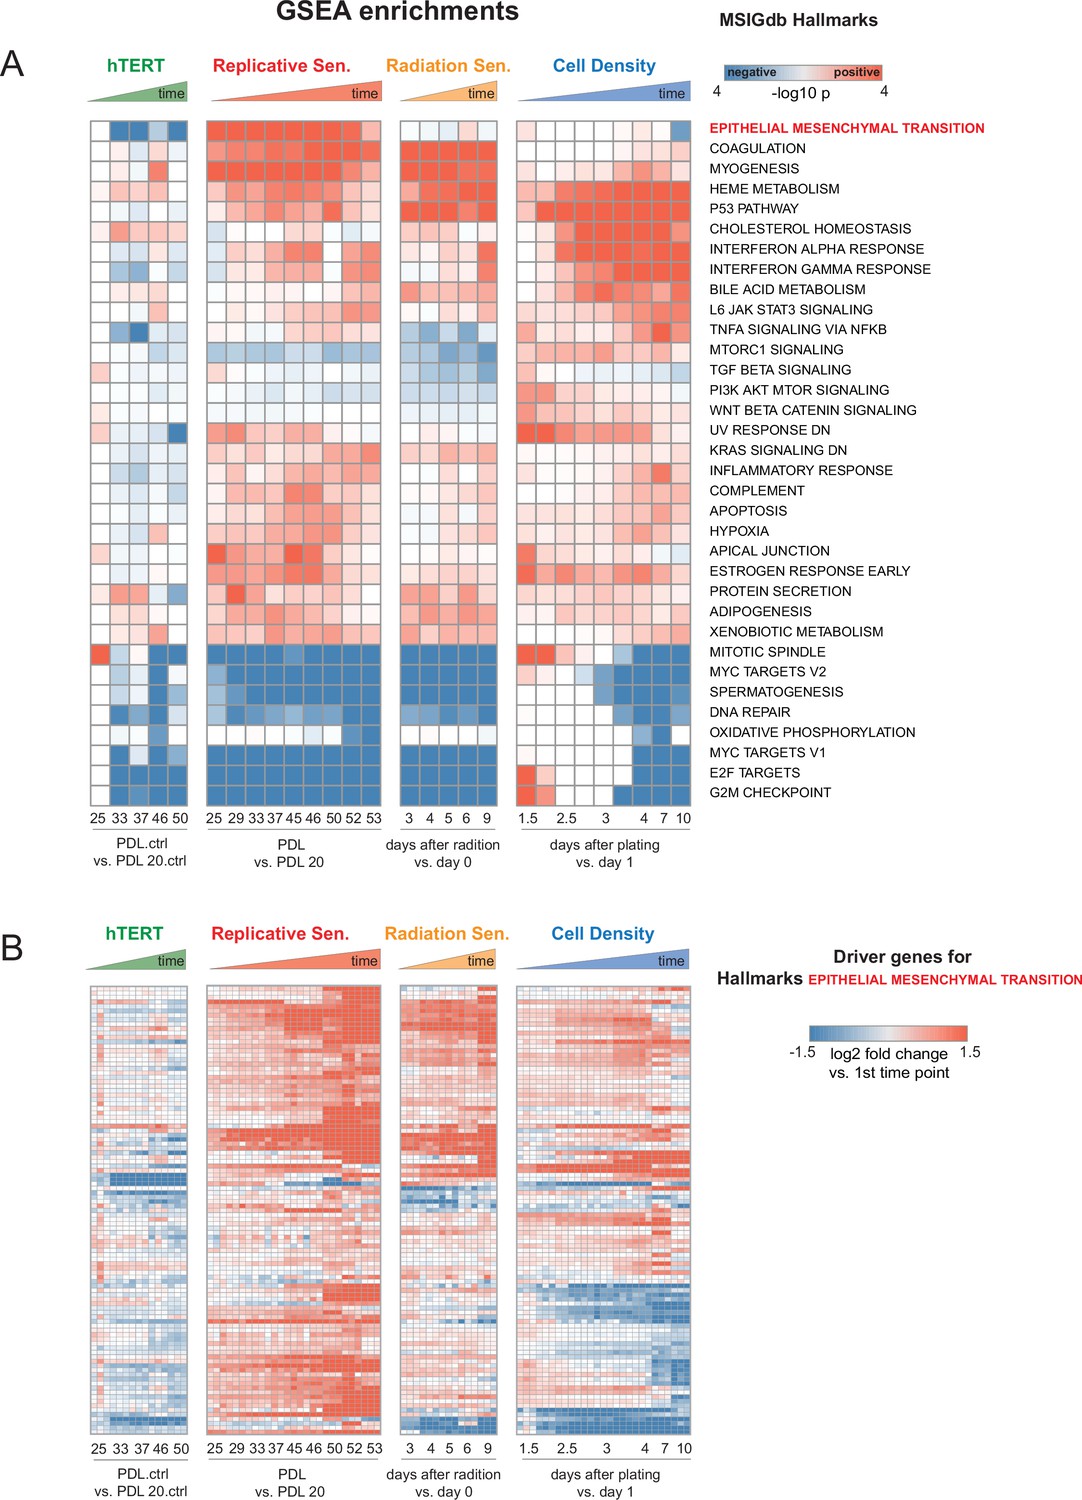
Enrichment and induction of Epithelial to Mesenchymal Transition gene set during approach to replicative senescence. (A) GSEA was run using MSigDB Hallmark gene sets. Data used for ranked list was the log2 fold changes at each time point vs. first the initial time point for each condition as indicated in B (i.e. PDL 20 for replicative senescence). Color indicates -log10 Benjamini-Hochberg p-value and direction of change e.g. red=enriched in up-regulated genes, blue=enriched in down-regulated genes. Epithelial to Mesenchymal Transition is highlighted in red.(B) Heatmap of 150 leading edge genes driving GSEA enrichment of EMT annotation compiled from all timepoints. Values are the log2 fold changes at each time point vs. first the initial time point for each condition as indicated. Values are individual (n=3) replicate samples.
Figure 1—figure supplement 5
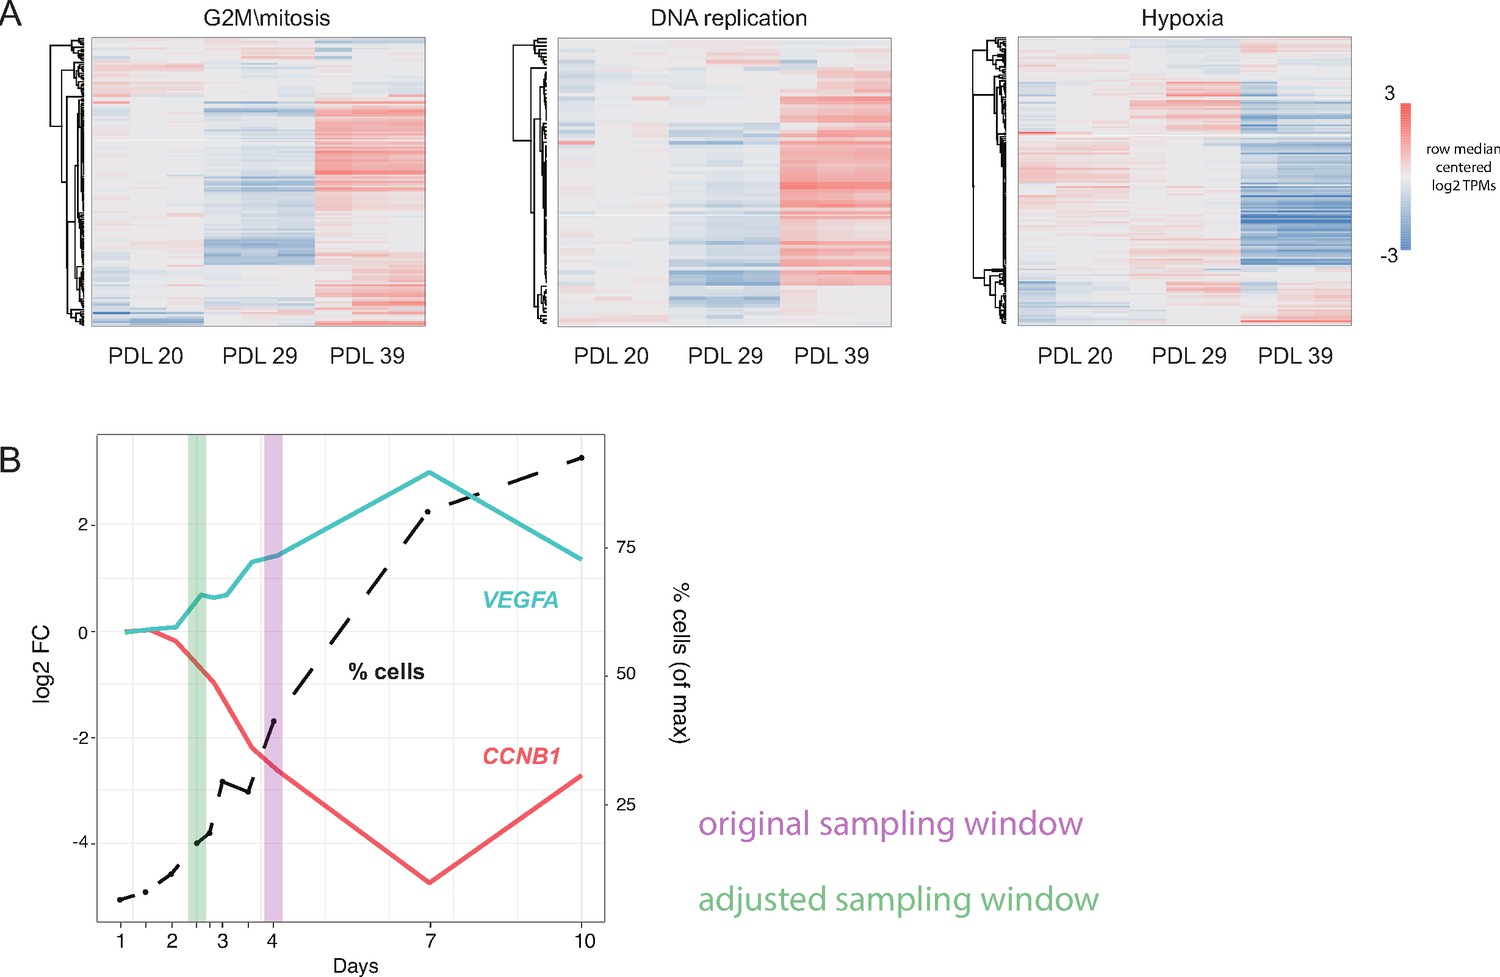
Pilot experiment for WI-38 husbandry.
Pilot WI-38 seeding and sampling experiment. A small pilot experiment was used to determine optimal seeding and sampling cell densities in WI-38 cells at three different population doublings (PDL). We performed RNA-seq on each PDL 4 days after seeding in triplicate and looked for significant genes and gene set annotations at each PDL. In addition, we performed an increasing cell density time course to choose appropriate sampling window and control for cell density effects. (A) Heatmap of three highly enriched or under-enriched GO term gene sets. Values are row centered log2 transcripts per million (TPM). Each column is a sample (n = 3 replicates). Red indicates higher than median gene expression, blue is lower than median gene expression across each row. (B) Results of cell density experiment on PDL23 cells (Figure 1A). y-axis left: Log2 fold change (vs. 1 day after plating) plotted against x-axis: day(s) after plating for markers of stress (VEGFA-cyan) and markers of mitosis (CCNB1-red). y-axis right and dotted line: number of cells present at specified day expressed as percent of maximum collected on day 10. Original sampling window shown in purple interval. Modified sampling window chosen to attenuate reductions in cell cycle arising from cell density shown in green interval.
Figure 2 with 5 supplements
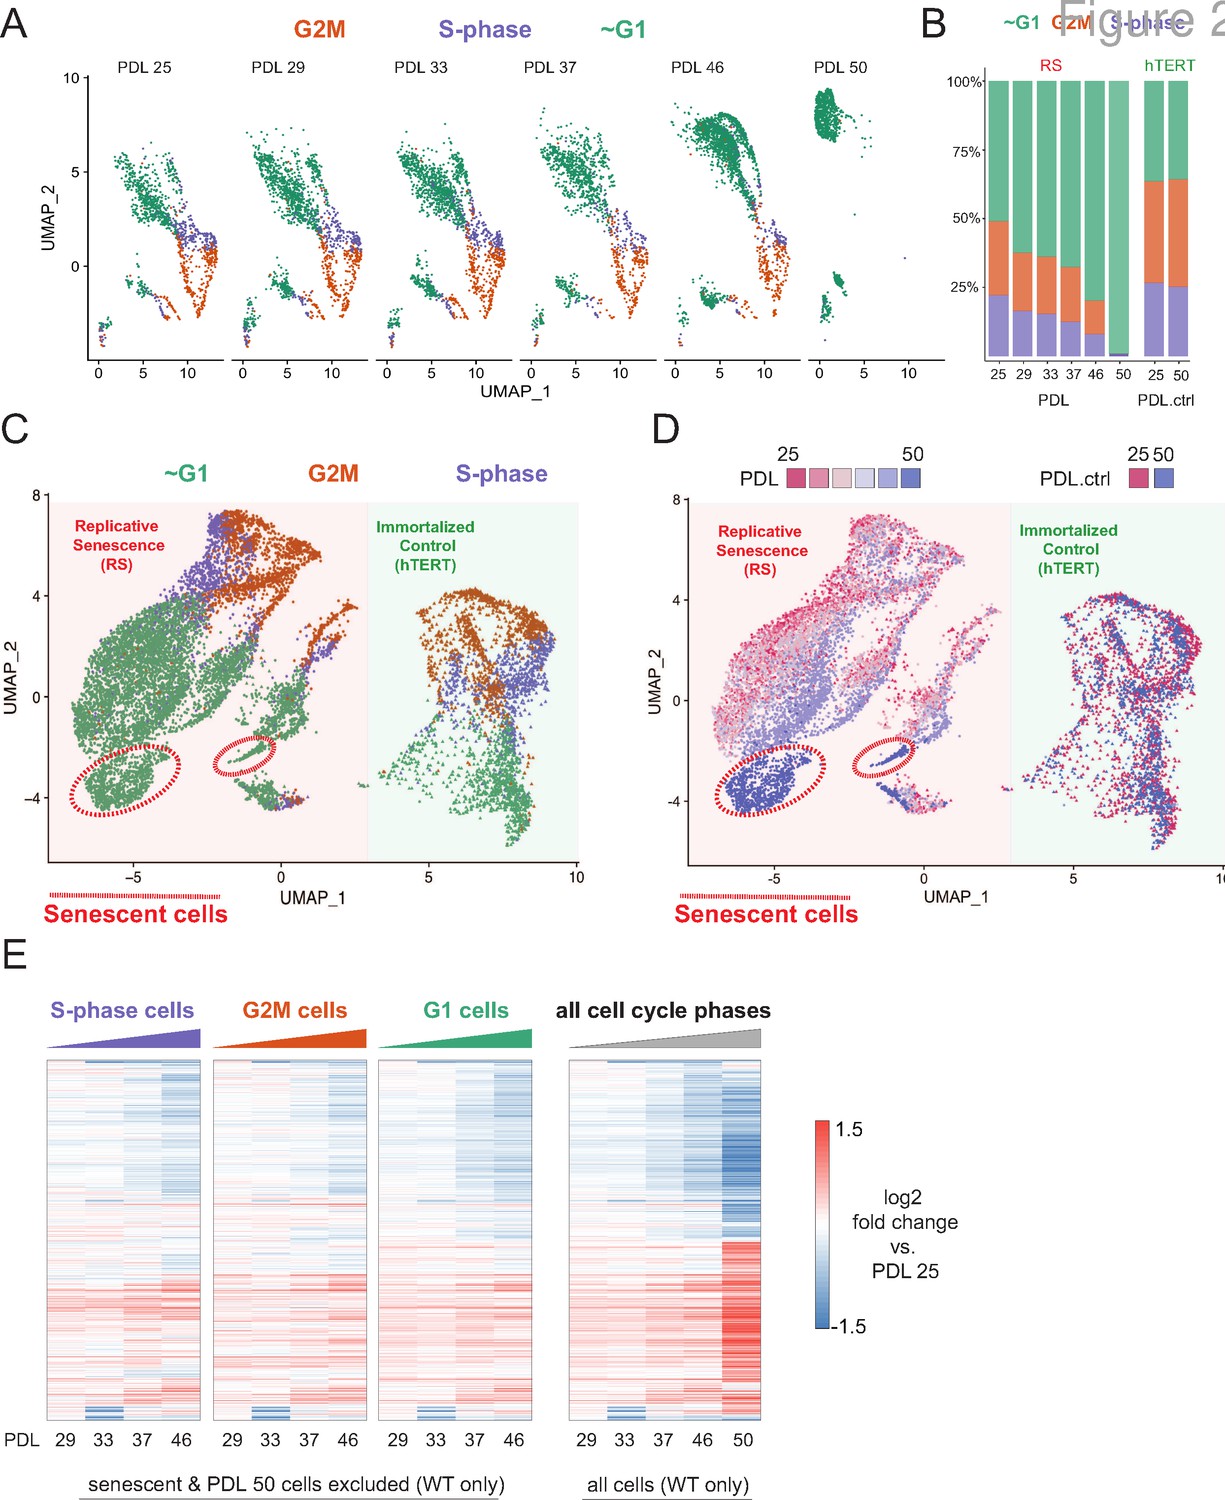
Cell cycle exit and distribution on approach to replicative senescence (RS) does not explain gradual increase in the replicative senescence transcriptome.
(A) Individual UMAP projections of WT WI-38 cells; PDL colored by phases of the cell cycle (G1 = green, G2/M = orange, S-phase = purple). (B) Bar graph of cell cycle state percentages defined by transcriptomic score (y-axis) by PDL (x-axis) for WT WI-38 cells (left) and hTERT WI-38 cells (right). (C) UMAP projections of WT and hTERT WI-38 cells by PDL and PDL.ctrl colored by different phases of the cell cycle defined by transcriptomic score. (D) UMAP projection of all WI-38 cells. Increasing PDLs (RS) or PDL control (hTERT) are colored from early (red) to late (blue). (E) The replicative senescence transcriptome manifests early in all phases of cell cycle. Heatmap of hierarchical clustering of gene expression values of differentially expressed genes as aggregated transcriptomic profiles for each cell cycle phase and PDL (left) versus all cells (right). Values are log2 fold change of each PDL against the reference PDL 25 (not shown).
Figure 2—figure supplement 1
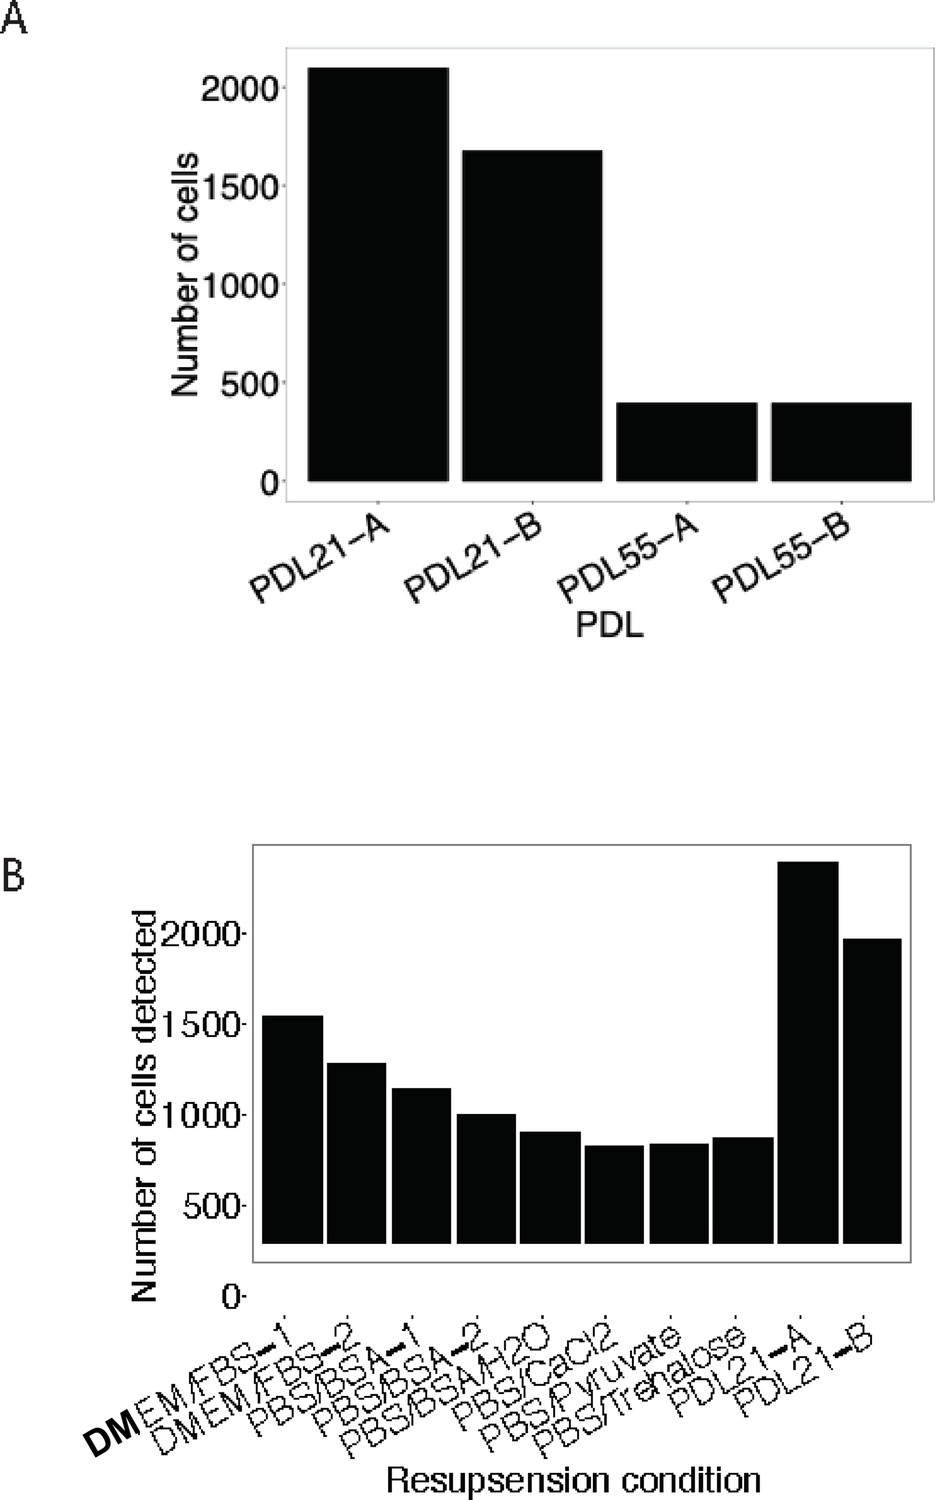
Buffer optimization for scRNA-seq.
Using a modified resuspension buffer of DMEM + FBS increases detection of senescent cells with the 10 x Genomics 3’ single cell RNA-seq protocol. (A) Barplot comparing the number of cells detected (y-axis) as a function of the age of cells (x-axis). (B) Barplot representing the number of cells detected (y-axis) with various cell resuspension buffers (y-axis).
Figure 2—figure supplement 2
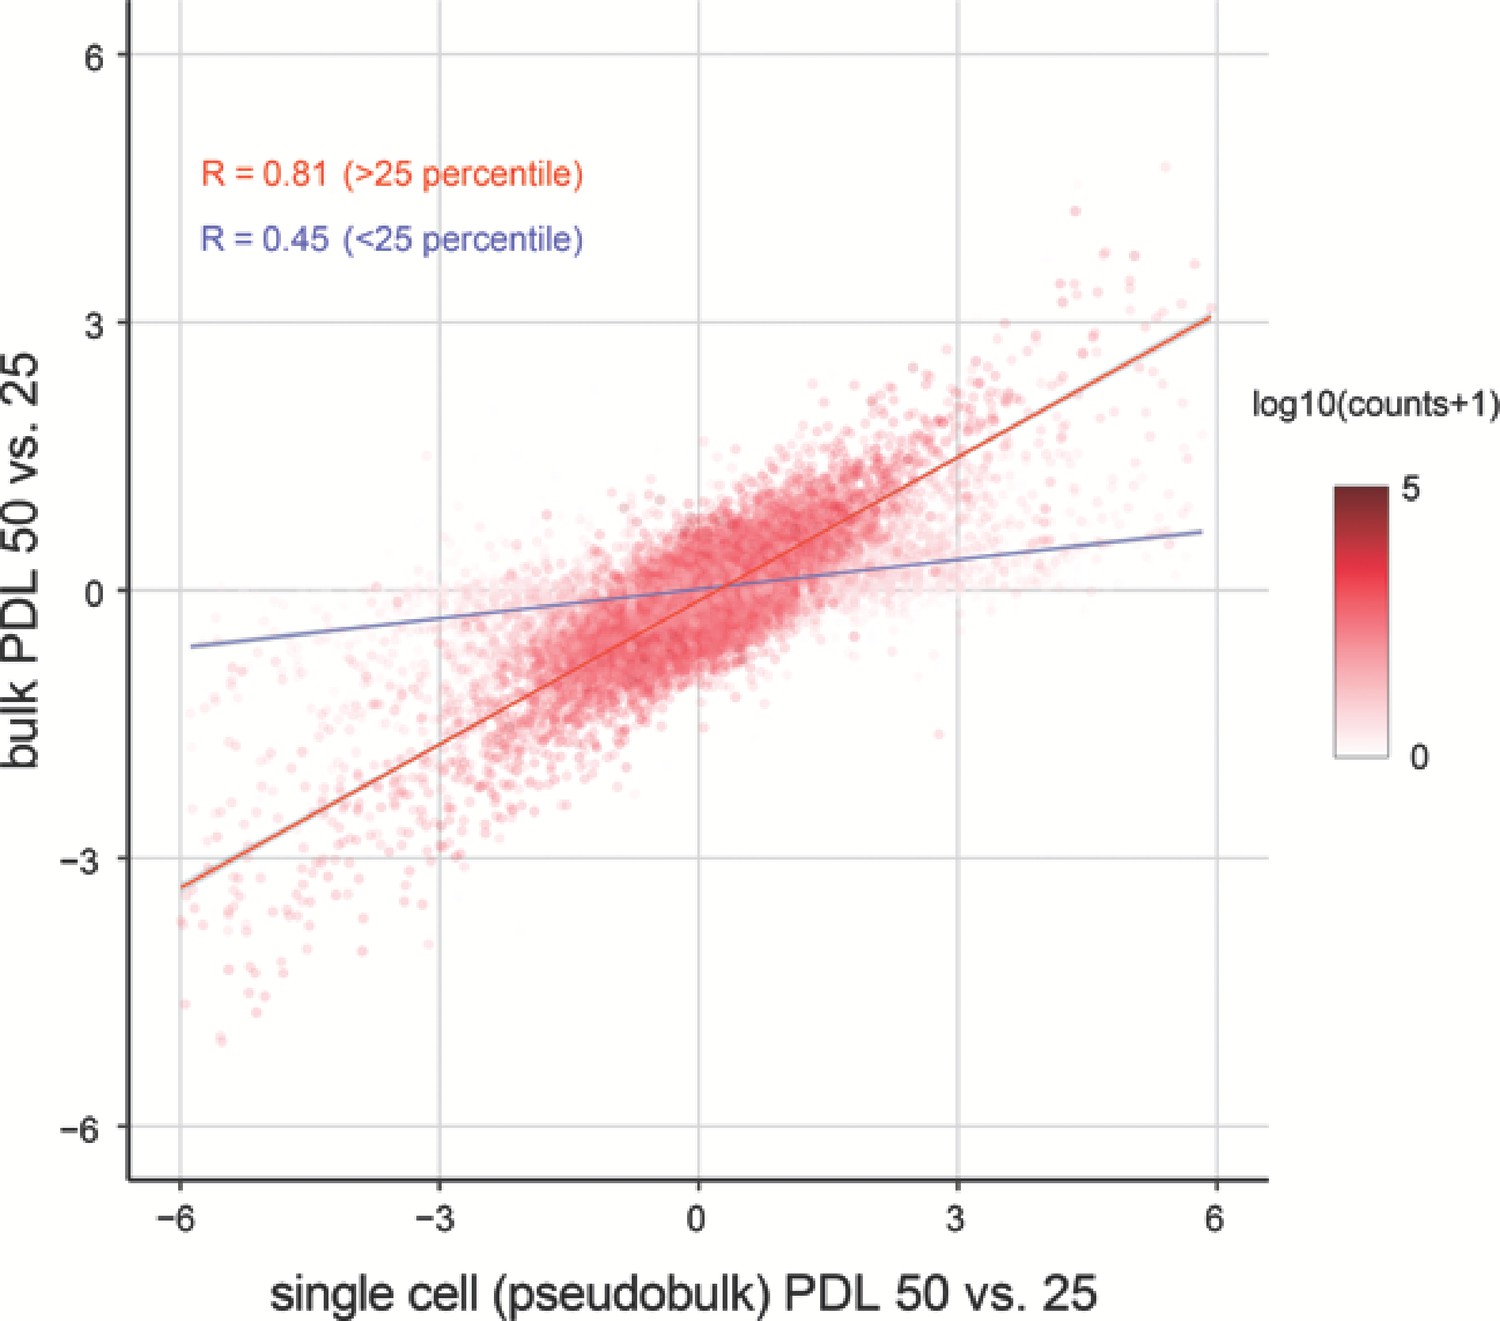
Correlation between bulk and single cell RNA-seq.
Replicative senescence dependent gene expression changes measured by Bulk RNA-seq and single cell RNA-seq are highly concordant.
Scatterplot comparing the log2 fold changes of PDL 50 vs. PDL 25 measured using single-cell pseudo-bulk count summations (x-axis) and actual bulk RNA-seq (y-axis). The color for each gene is the log10 normalized counts. The r for all genes is 0.77. The r for genes filtered at >25 th percentile is 0.81 (red line) and 0.45 for genes < 25 th percentile (blue line).
Figure 2—figure supplement 3
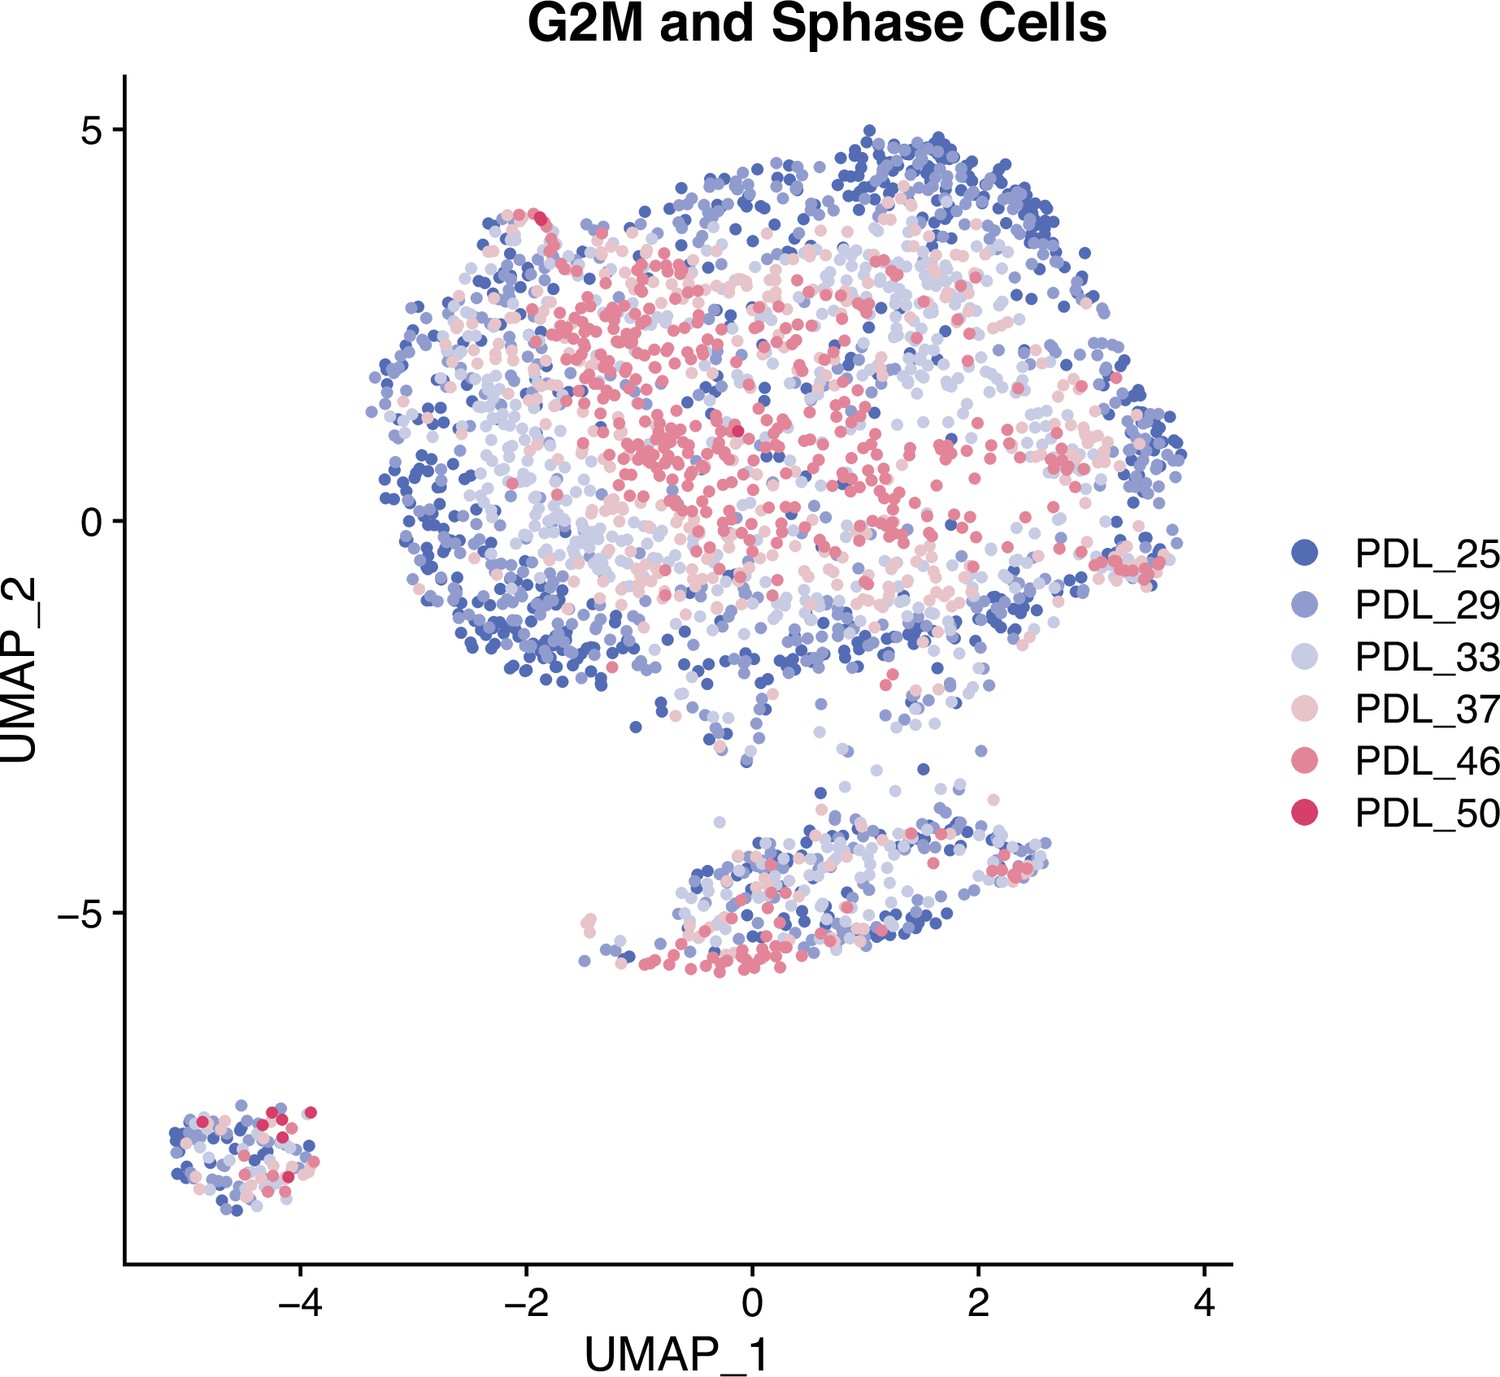
UMAP of mitotic cells.
Single cell UMAPs of high mitotic scoring (gene set) WI-38 cells. S phase and G2M scored cells were separated and reprocessed and visualized with a UMAP projection. In mitotic cells, PDL is the primary source of variance across all PDLs.
Figure 2—figure supplement 4
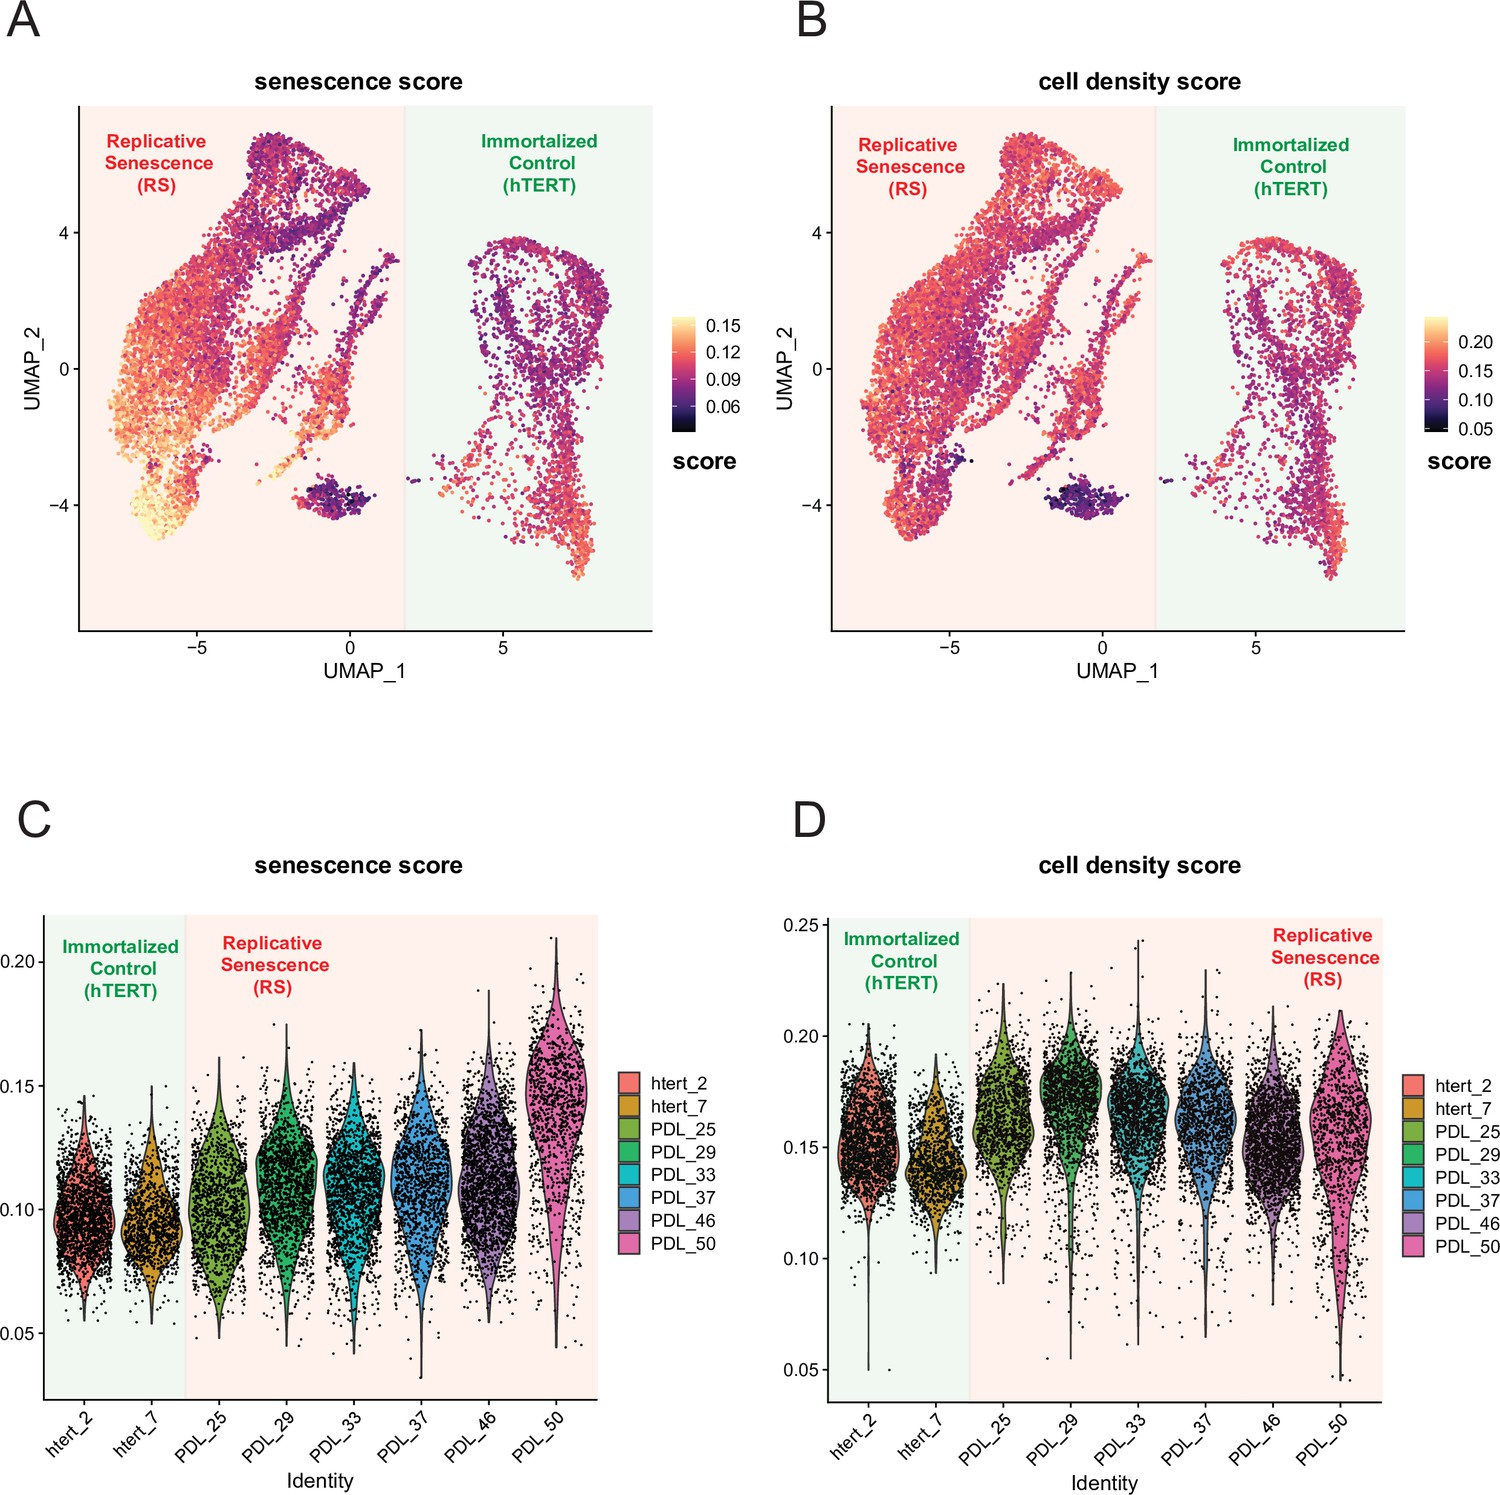
Senescence and cell density scoring of scRNA-seq cells.
WT and hTERT WI-38 cells scored for senescence and cell density signatures. (A) UMAP projection of WT and hTERT single-cell RNA-seq scored with a signature composed of significantly increasing genes with replicative senescence that are not significant in cell density experiments derived from bulk RNA-seq. Yellow represents cells scoring high, while black depicts cells scoring low for the senescence score. (B) As in A but scored for unique cell density signature. (C) Violin plot of cells scored as in A. Y-axis is the score assigned to each cell (point). Each PDL and hTERT PDL.ctrl are on x-axis. Senescence score increases with PDL. (D) Violin plot of cells scored as in B for cell density. Y-axis is the score assigned to each cell (point). Each PDL and hTERT PDL.ctrl on x-axis. Cell density remains flat with increasing PDL.
Figure 2—figure supplement 5
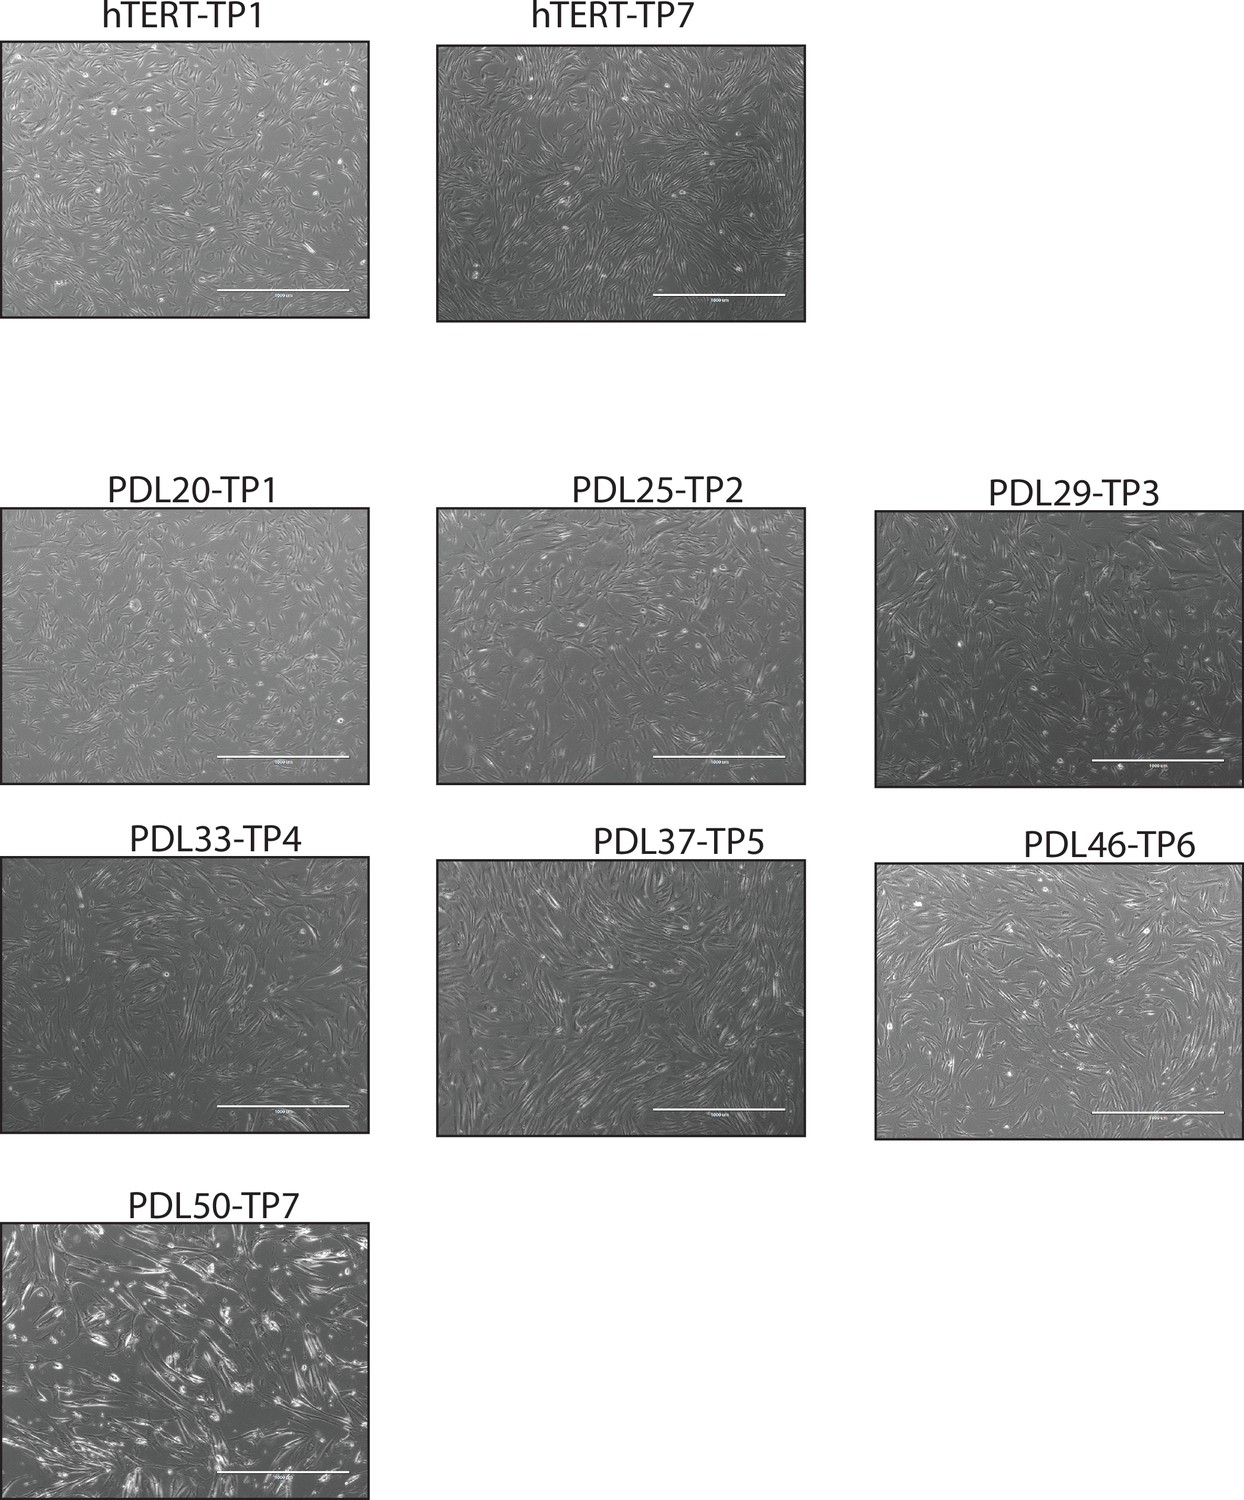
mages of cell density at sampling.
Representative images of WI-38 cells at collection time points.
Figure 3 with 5 supplements
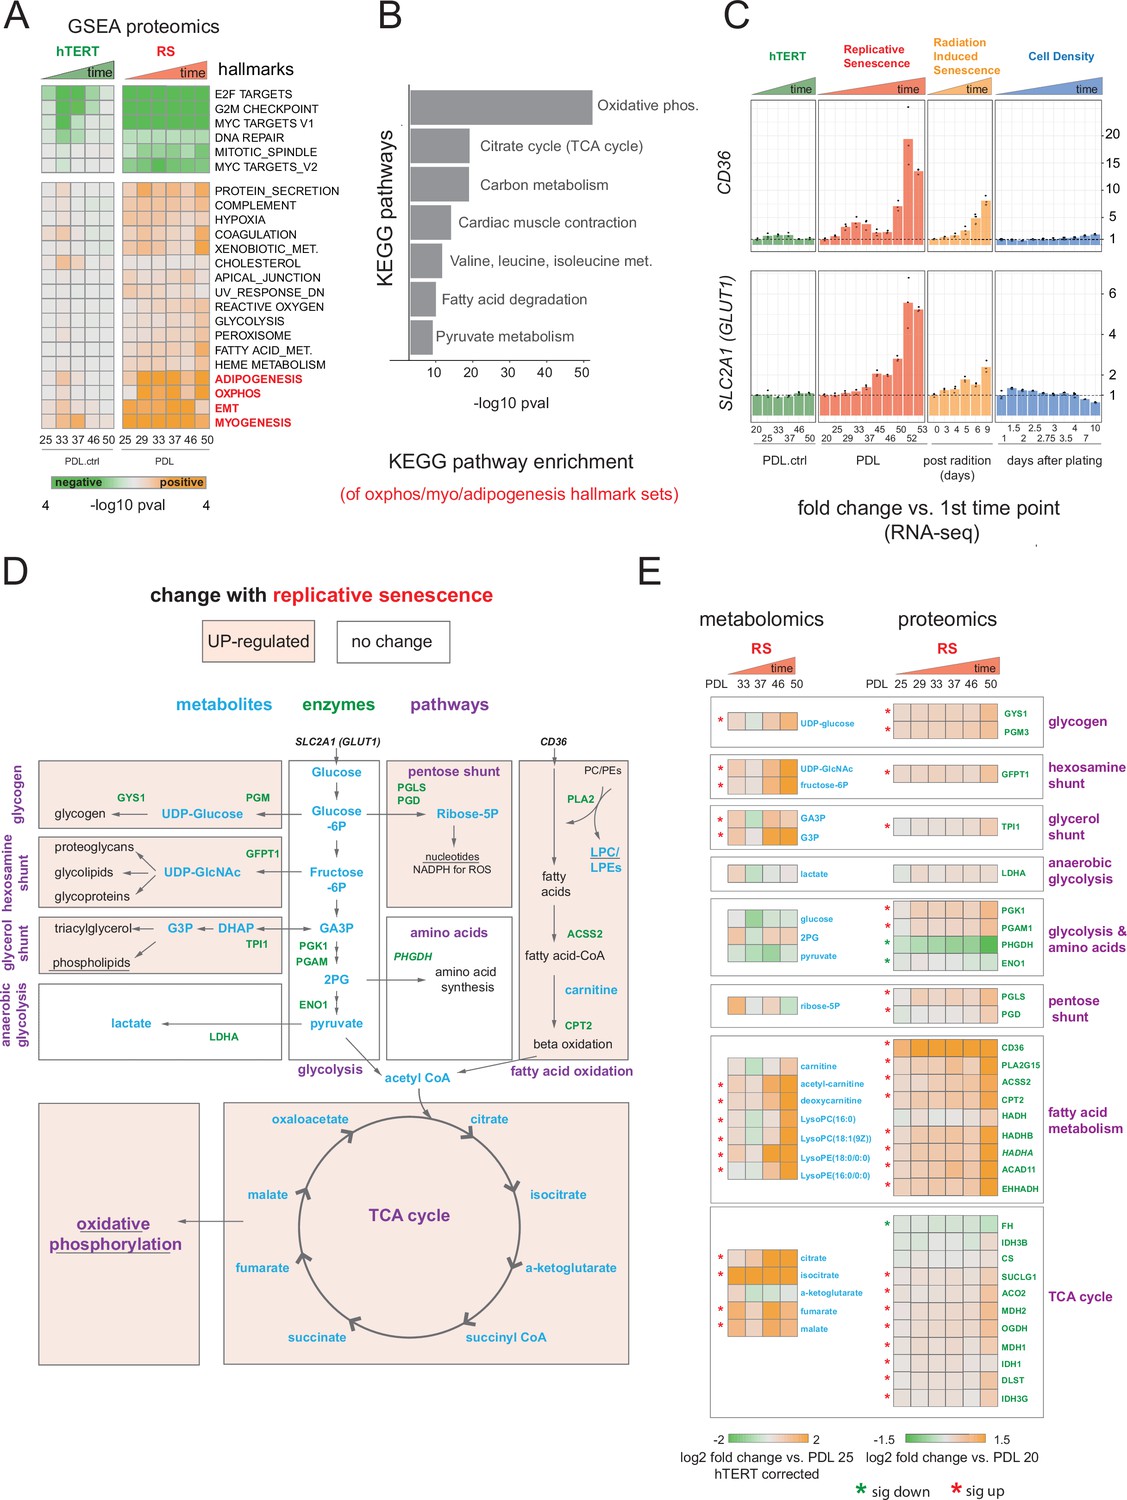
Proteomic and metabolomic changes during replicative senescence.
(A) Significant (Benjamini-Hochberg adjusted pvalue < 0.01) GSEA results for protein changes (n=3) using the MSigDB Hallmarks. Reference time point not shown. Values are -log10 p-value and are colored by the direction (orange=up, green=down). (B) KEGG and GO term enrichment of genes from A for selected annotations. (C) Gene expression changes (n=3) for insulin-independent glucose transporter SLC2A1 (left) and fatty acid transporter CD36 (right) in the hTERT, replicative senescence, radiation induced senescence and cell density time courses. (D) Diagram of glycolysis, glycolytic shunts, fatty acid import and oxidation, TCA cycle/oxidative phosphorylation. Metabolites are blue, proteins are green. (E) Metabolite (n=4) and protein changes (n=3) with senescence from D. Average corrected metabolite log2 fold change vs. PDL 25 as reference (not shown) are plotted. Proteomics values are average log2 fold change vs. PDL 20 as reference (not shown). *:Significant changes (FDR adjusted p-value < 0.05 metabolomics, FDR adjusted p < 0.01 proteomics).
-
Figure 3—source data 1
Proteomics quantification, differential analysis and GSEA.
- https://cdn.elifesciences.org/articles/70283/elife-70283-fig3-data1-v3.xlsx
-
Figure 3—source data 2
Metabolomics quantification and differential analysis.
- https://cdn.elifesciences.org/articles/70283/elife-70283-fig3-data2-v3.xlsx
Figure 3—figure supplement 1
PDL-dependent changes in the senescent proteome vs. hTERT cells.
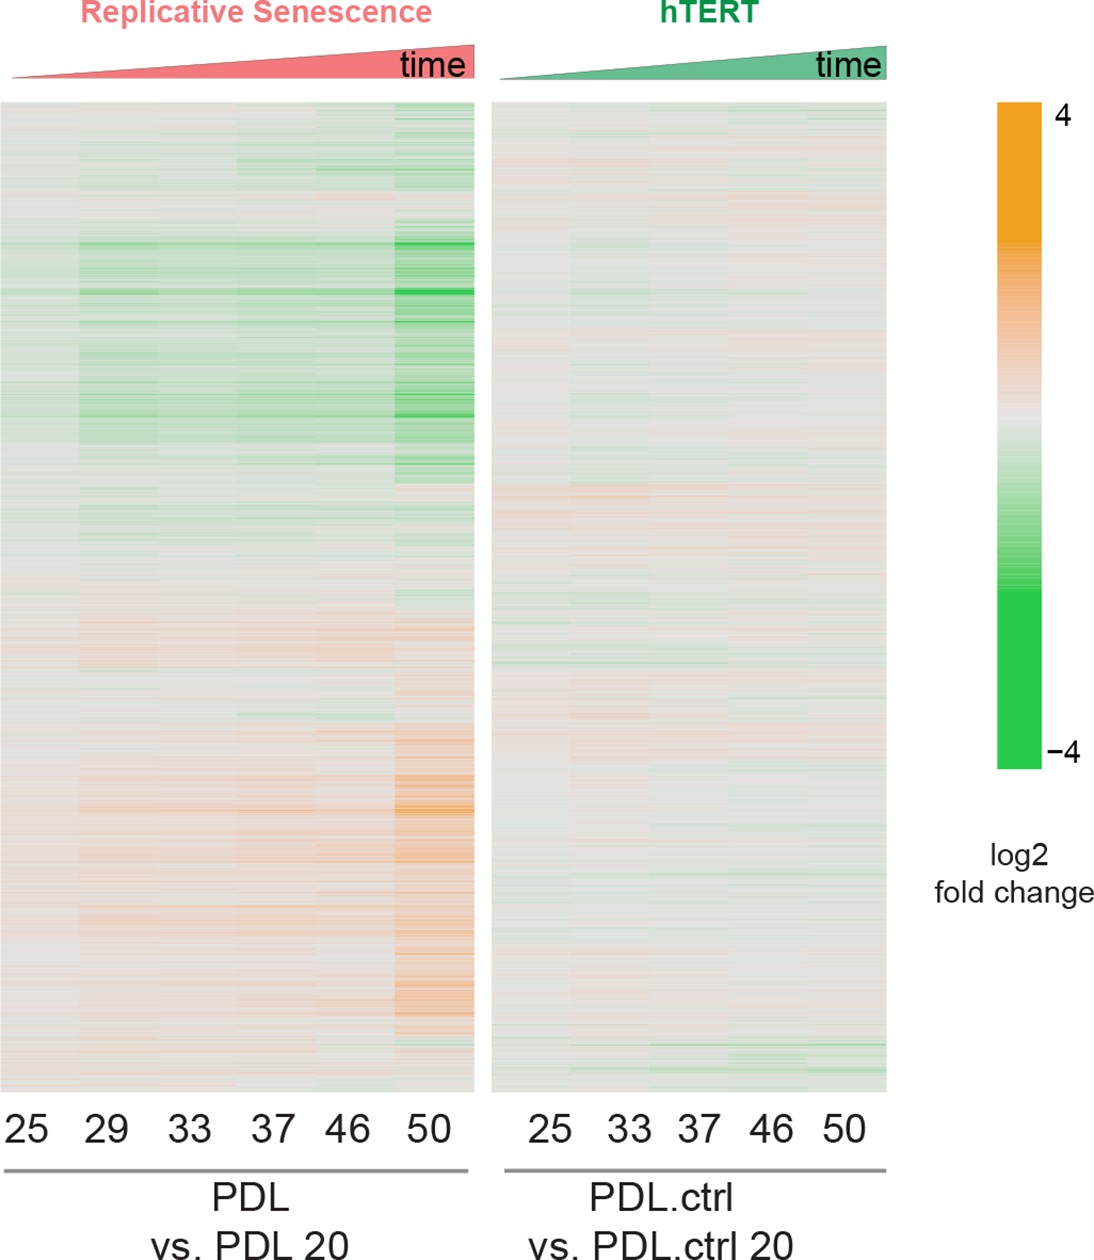
Heatmap of hierarchical clustering of 8000 protein log2 fold changes at each time point/PDL versus first (not shown) for RS WT WI-38 (left) and hTERT WI-38 cells (right) from high induction (orange) to depletion (green).
Figure 3—figure supplement 2

Correlation between bulk RNA-seq and proteomics.
Scatterplot comparing the log2 fold change expression of genes (x-axis) vs. protein (y-axis) in PDL 50 cells relative to PDL 20 cells. Oxidative phosphorylation leading edge genes from GSEA plotted in red. Point density colored from high (white) to low (green).
Figure 3—figure supplement 3
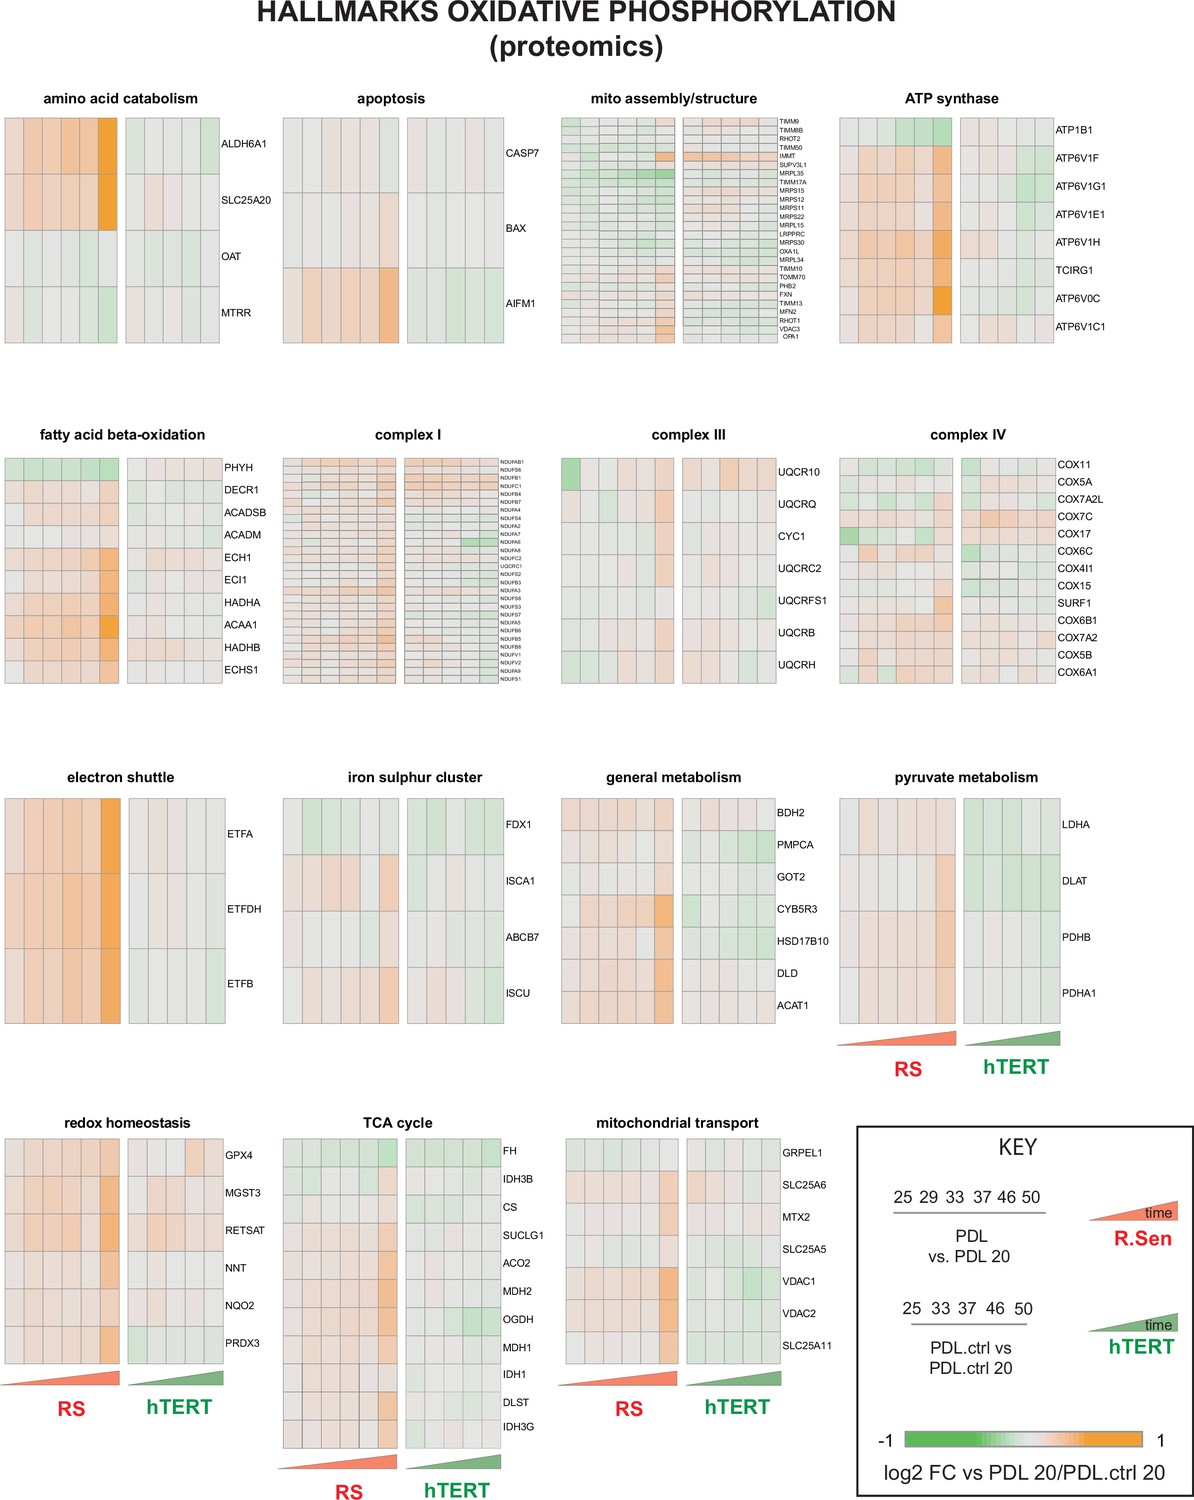
Proteomic changes in oxidative phosphorylation annotation.
Breakdown of the hallmark oxidative phosphorylation gene set into functional subsets reveals up regulation of most mitochondrial functions during replicative senescence. Heatmaps of log2 fold change proteomics data for the MSigDB hallmarks oxidative phosphorylation annotations set broken into constituent functional groups. Key in lower right with x-axis labels and color scale boundaries for all heatmaps.
Figure 3—figure supplement 4

PDL-dependent changes in the senescent metabolome vs. hTERT cells.
PDL-dependent changes in the senescent metabolome vs. hTERT cells. Heatmap of hierarchical clustering of 285 metabolite log2 fold changes at each PDL or PDL.ctrl versus first (not shown) for RS WT WI-38 (left) and hTERT WI-38 cells (right). Values range from high induction (orange) to depletion (green). Values shown are log2 Median values for n=4 replicates.
Figure 3—figure supplement 5

Kennedy pathway utilization during replicative senescence Kennedy Pathway diagram.
Metabolites in blue, proteins in green. Heatmaps of log2 fold changes for metabolites and proteins from A. Median hTERT corrected values for n=4 replicates are shown. Significant changes (FDR adjusted p < 0.05 metabolomics, FDR adjusted p-value < 0.01 proteomics) during replicative senescence are denoted with asterisks.
Figure 4
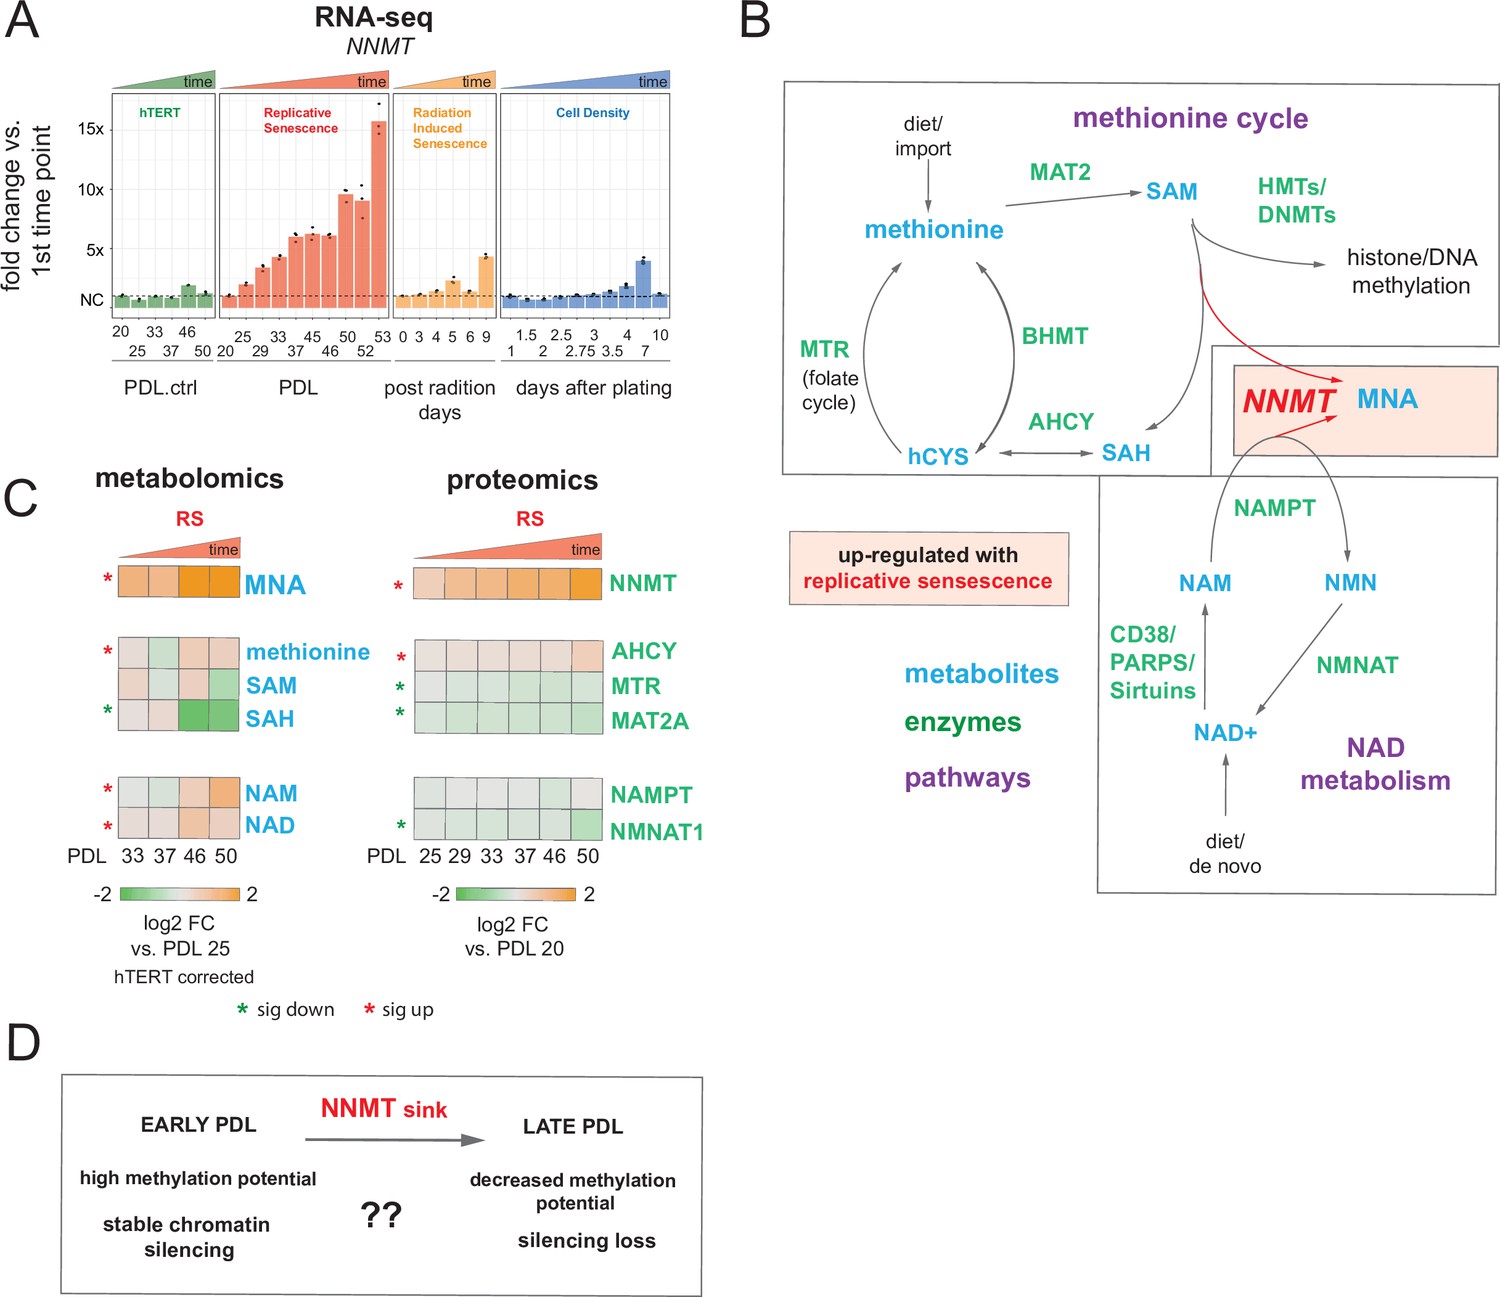
Nicotinamide n-methyltransferase (NNMT) links nicotinamide adenine dinucleotide (NAD) and methionine metabolism during replicative senescence.
(A) Gene expression fold changes for the NNMT (top) in the hTERT, replicative senescence (RS), radiation induced senescence (RIS), and cell density (CD) time courses (three replicate average, each point a replicate). Heatmaps of metabolite and protein changes during replicative senescence from B (bottom-replicate average). (B) Metabolic diagram of the methionine and NAD salvage pathways. Metabolites are blue, proteins are green. Shading indicates inferred pathway direction during replicative senescence based on metabolite/protein changes in A. (C) Heatmaps of metabolite (four replicate average) and protein (three replicate average) changes with replicative senescence from B. Metabolomics data was batch corrected against hTERT samples and expressed as log2 fold change vs. PDL 25 as reference (not shown). Proteomics data expressed as log2 fold change vs. PDL 20 as reference (not shown). Significant changes (FDR adjusted p < 0.05 metabolomics, FDR adjusted p-value < 0.01 proteomics) during replicative senescence are denoted with asterisks. (D) Potential model for NNMT and metabolic regulation of chromatin state during replicative senescence.
Figure 5 with 5 supplements

Increased accessibility within heterochromatin and nucleolar associated domains (NADs) is a dominant feature of the replicative senescence (RS) epigenome.
(A) Percent of ATAC-seq reads falling into four broad chromatin states compiled from the ENCODE IMR-90 25 chromatin state prediction for all samples in WT or hTERT WI-38 cells. Percent of all ATAC-seq reads within two specific states (y-axis) vs PDL (x-axis) for WT (red) and hTERT (green) WI-38 cells (bar height denotes average of 3 replicates). (B) Median log2 fold change in ATAC-seq counts for significantly changing ATAC-seq peaks binned into ENCODE IMR-90 25 chromatin states (row) for each sample (column, n=2 or three replicates). Reference samples are PDL 20 or PDL 20.ctrl for WT and hTERT WI-38 cells respectively (not shown). (C) Observed and expected distribution of overlaps of significantly induced genes (from Figure 1, RNA-seq) with NADs and LADs. Replicative senescence (red), radiation-induced senescence (RIS) (orange), and cell density (CD) (blue). Median expected number of overlaps and observed number of overlaps shown by black and green lines respectively. (D) Average (n=2 or three replicates) log2 fold change distribution (PDL 50 vs. PDL 20) for all ATAC-seq peaks that overlap or are excluded from NADs (left) or LADs (right).
-
Figure 5—source data 1
ENCODE IMR90 chromatin state labels.
- https://cdn.elifesciences.org/articles/70283/elife-70283-fig5-data1-v3.txt
-
Figure 5—source data 2
ATAC-seq peak coordinates and metadata.
- https://cdn.elifesciences.org/articles/70283/elife-70283-fig5-data2-v3.xlsx
-
Figure 5—source data 3
Normalized ATAC-seq coverage in peaks.
- https://cdn.elifesciences.org/articles/70283/elife-70283-fig5-data3-v3.zip
-
Figure 5—source data 4
ATAC-seq fraction of reads in peaks.
- https://cdn.elifesciences.org/articles/70283/elife-70283-fig5-data4-v3.txt
-
Figure 5—source data 5
IMR90 LADs from Salama 2013.
- https://cdn.elifesciences.org/articles/70283/elife-70283-fig5-data5-v3.txt
-
Figure 5—source data 6
IMR90 NADs from Nemeth 2017.
- https://cdn.elifesciences.org/articles/70283/elife-70283-fig5-data6-v3.txt
Figure 5—figure supplement 1
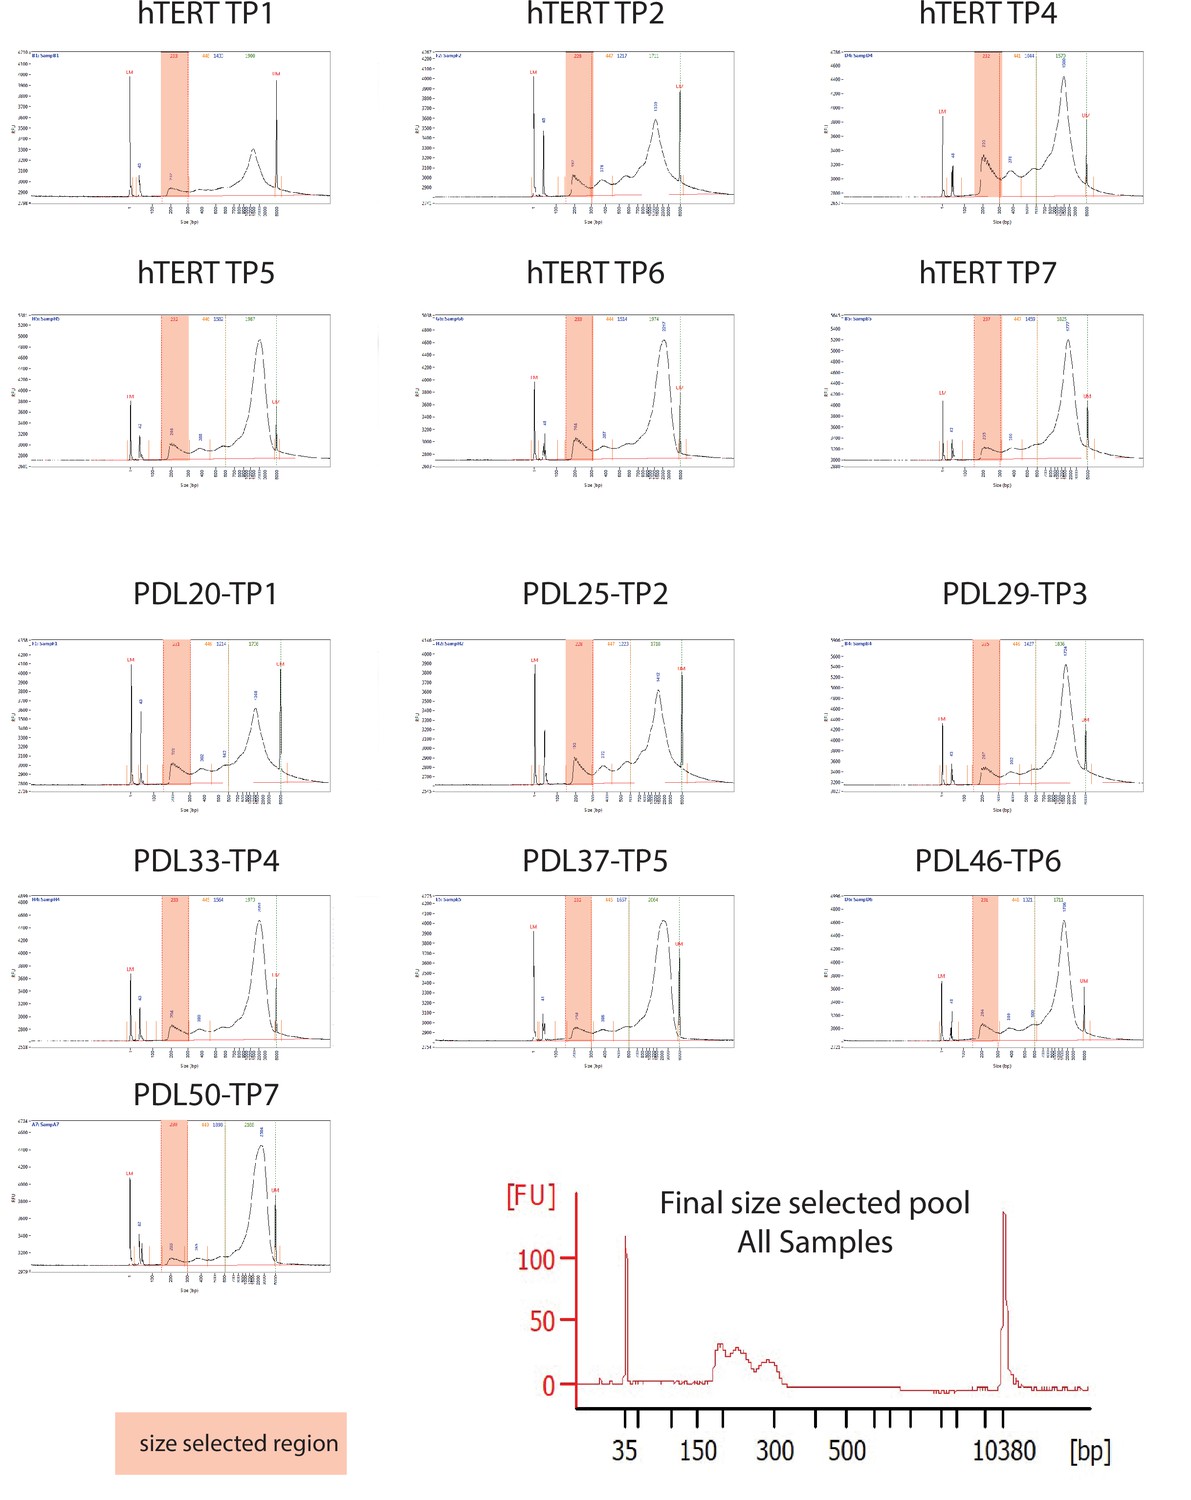
ATAC-seq library fragment distribution and size selection.
ATAC-seq library fragment distribution and size selection.
Figure 5—figure supplement 2
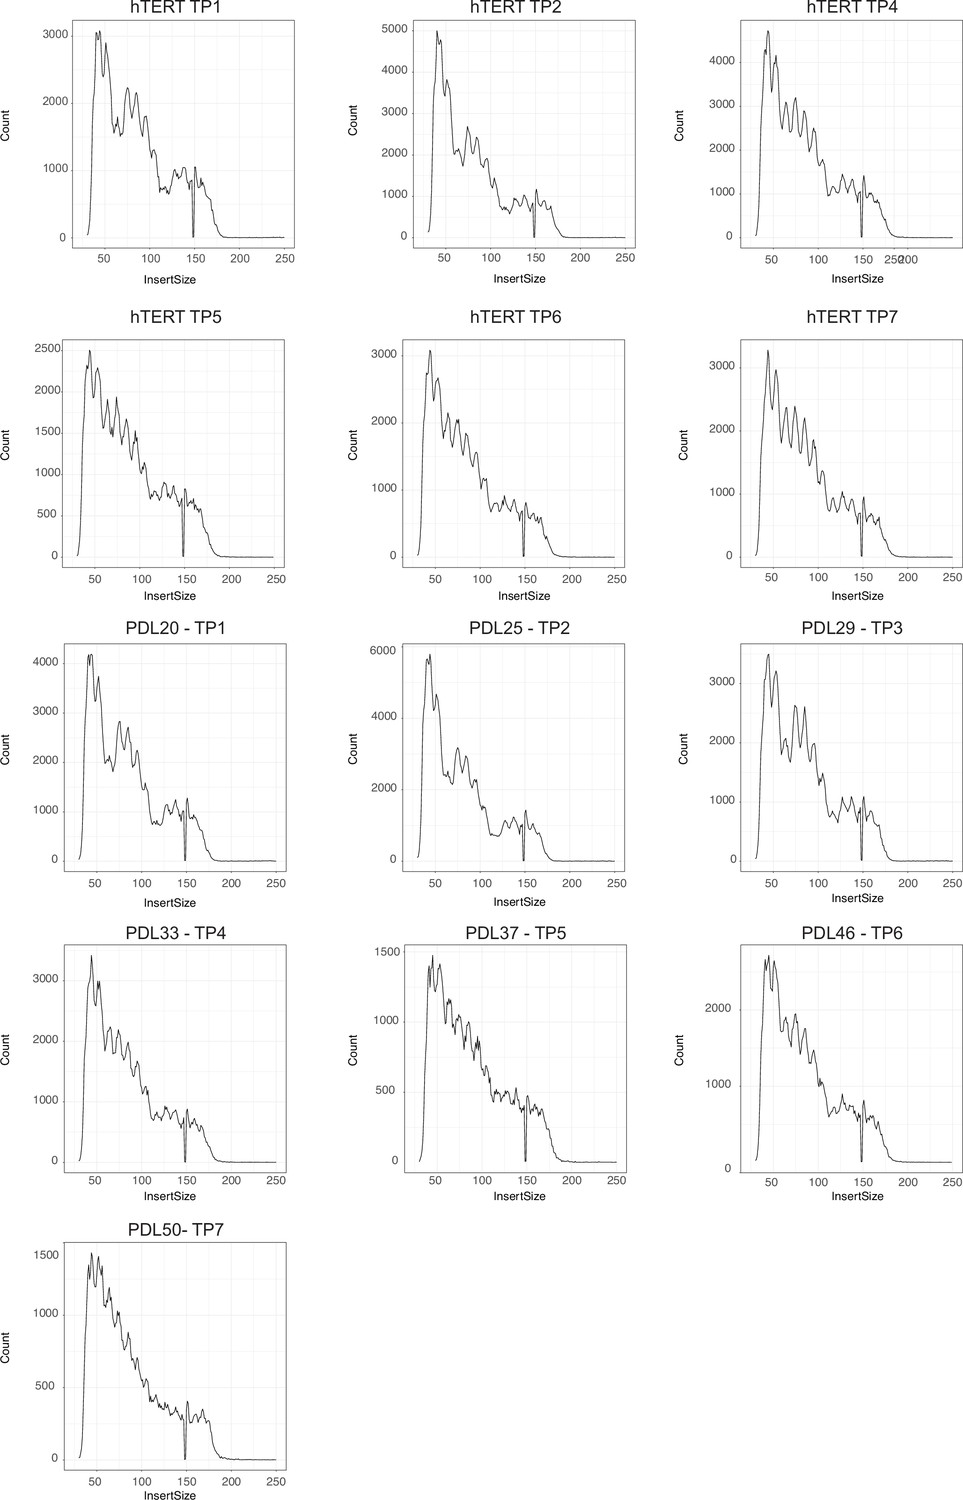
ATAC-seq library fragment distribution after size selection and sequencing.
ATAC-seq library fragment distribution after size selection and sequencing.
Figure 5—figure supplement 3
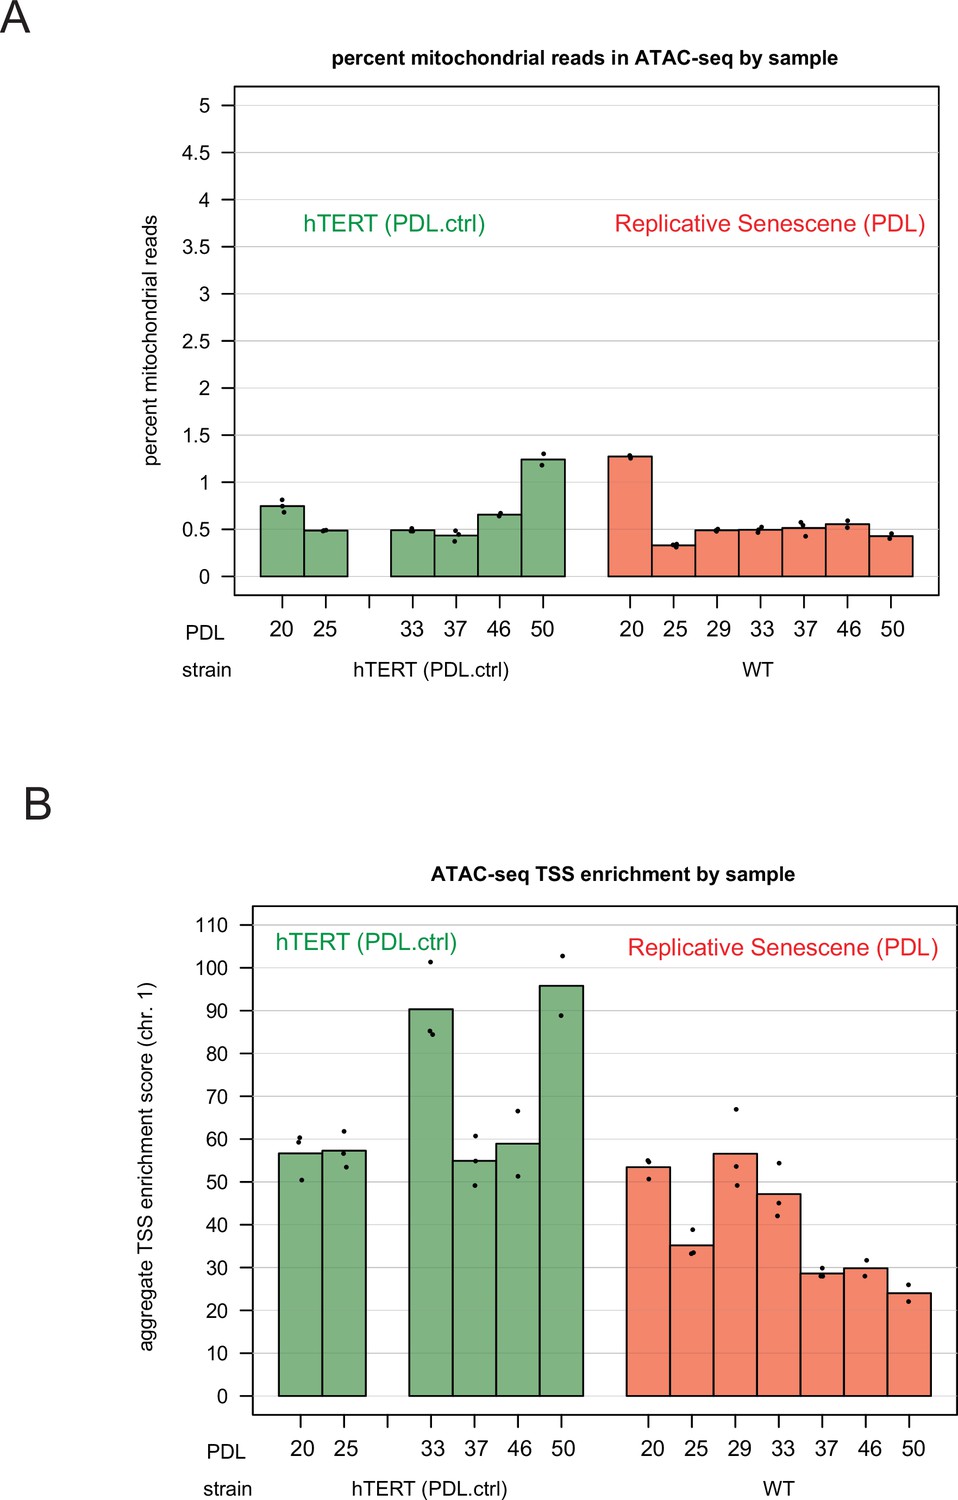
ATAC-seq mitochondrial read percentages and ATAC-seq transcriptional start site enrichment.
ATAC-seq mitochondrial read percentages and ATAC-seq transcriptional start site enrichment. (A) Mitochondrial read percentages in sequenced and aligned ATAC-seq library for WT PDLs (red) hTERT time points (green) in triplicate. (B) Transcriptional start site enrichment in sequenced and aligned ATAC-seq libraries for WT PDLs (red) hTERT time points (green) in triplicate.
Figure 5—figure supplement 4

ATAC-seq QC metrics and extended analysis.
ATAC-seq QC metrics, controls, and NADs/LADs browser shot. (A) Fraction of reads in peak by PDL (WT) and PDL.ctrl (hTERT).p values for linear fit over time are shown. WT cells exhibit a slight ~5% but significant reduction of fraction of reads in peaks. (B) PDL 46 read distribution across chromatin states ± PMA. (C) Chromatin state overlap Z-scores for genes annotations and NADs and gene annotation and LADs. (D) Heatmap of median log2 fold change of ATAC-seq peak accessibility binned by genomic annotations (TxDb.Hsapiens.UCSC.hg38.knownGene–row) for each sample (column, n=2 or three replicates). Reference samples are PDL 20 or PDL 20.ctrl for WT and hTERT WI-38 cells, respectively (not shown). (E) Chromosome level distribution of all ATAC-seq peaks (purple), ATAC-seq peaks increasing in accessibility located within the undefined/quiescent chromatin state annotation (pink), NADs (blue), and LADs (yellow).
Figure 5—figure supplement 5

Chromatin state profiles of ATAC-seq peaks in nucleolar-associated domains (NADs).
Chromatin state profiles of ATAC-seq peaks in NADs vs. rest of the genome. Heatmap of all significant ATAC-seq peaks categorized by 25 chromatin states and then divided into peaks overlapping with NADs (right) and peaks excluded from NADs (left) for hTERT and WT replicative senescence time course. Normalized accessibility counts for peaks were aggregated by chromatin state and NAD overlap group. Values shown are log2 fold change of median accessibility for each time point and grouping versus the reference sample. PDL.ctrl 20 for hTERT and PDL 20 for WT replicative senescence time course. n=2 or 3 replicates.
Figure 6 with 1 supplement
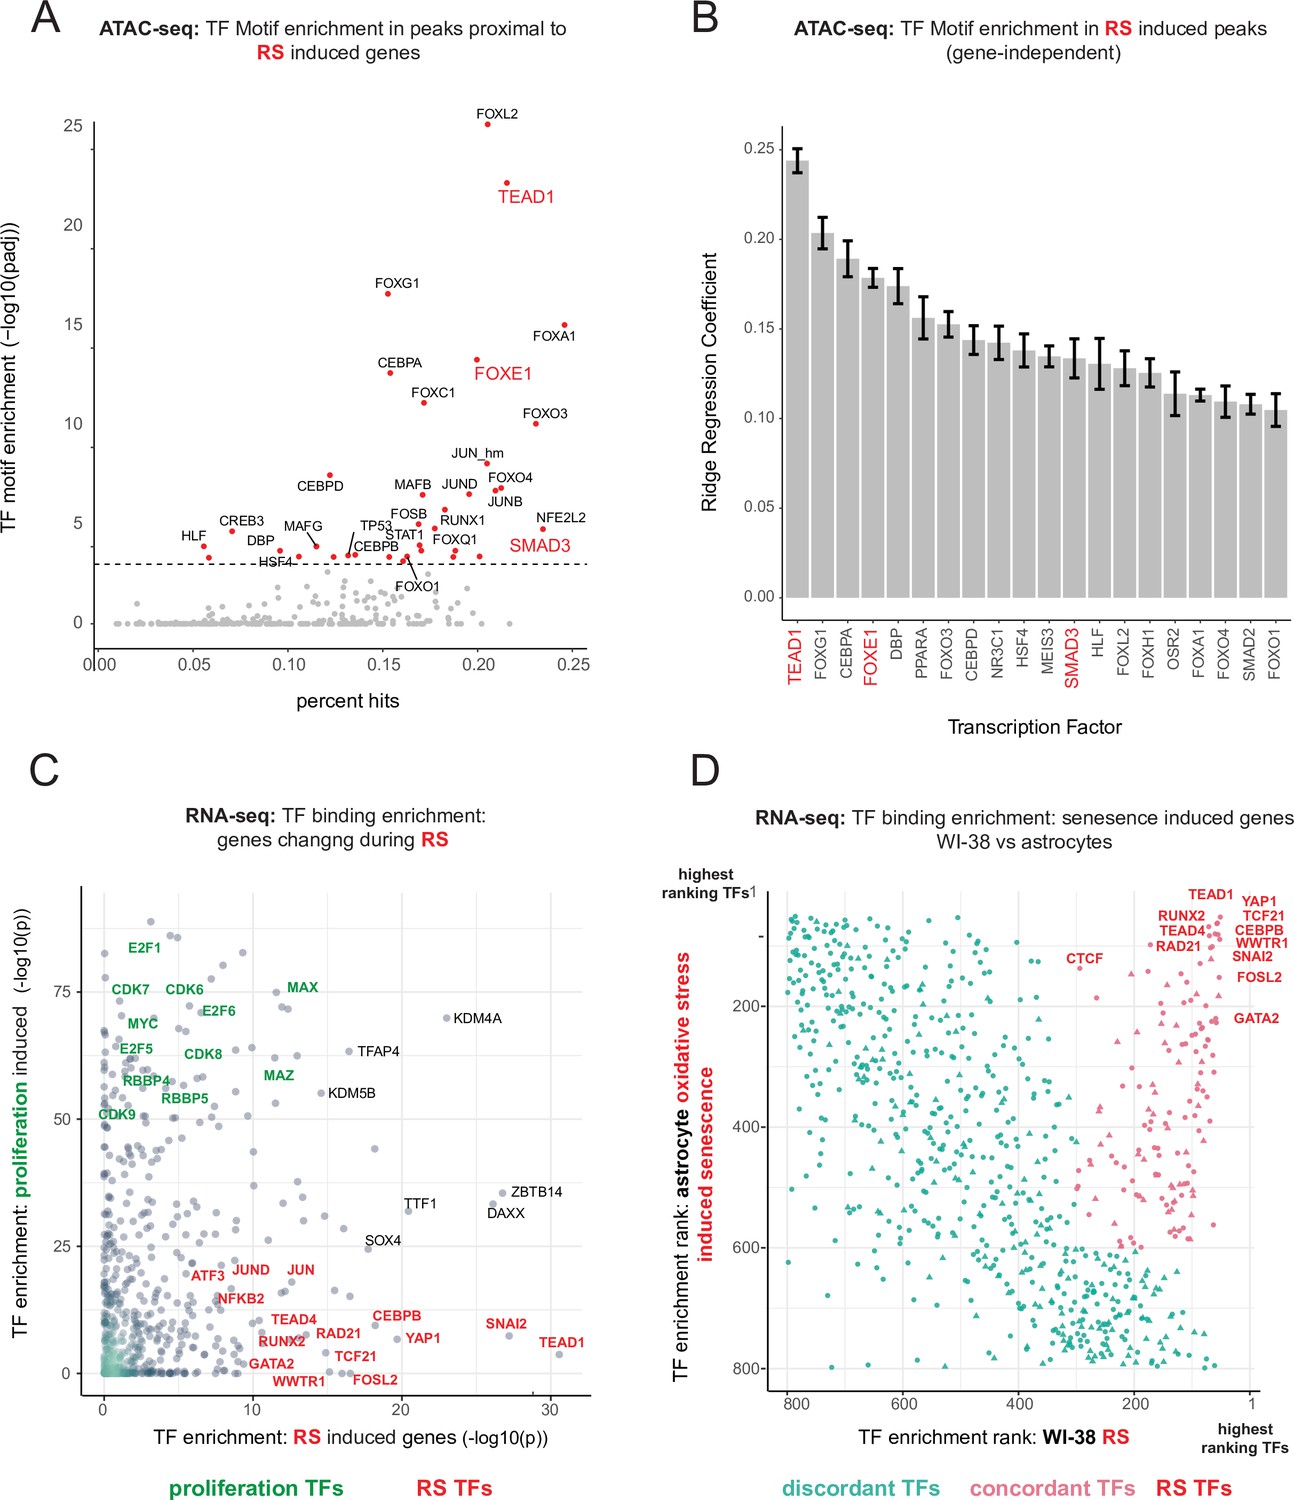
Master transcriptional regulators of replicative senescence.
(A) Scatter plot of transcription factor motif enrichment in ATAC-seq peaks surrounding significantly induced genes (FDR adjusted p-value < 0.01, log2 FC >0.5) during replicative senescence. The Y-axis is the -log10 p-value; x-axis is the percent of input genes with the transcription factor motif. All points are transcription factors. Specific transcription factors of interest are called out in red. (B) Bar graph of ridge regression coefficient of motif predictive power in model of increasing peak accessibility with replicative senescence. Transcription factors of interest are highlighted in red. (C) Scatterplot of transcription factors enriched for binding in regulatory regions around replicative senescence depleted genes (y-axis, FDR adjusted p-value < 0.01, log2 FC <–0.5) vs. replicative senescence induced genes (x-axis, FDR adjusted p-value < 0.01, log2 FC <–0.5). Curated cell cycle transcription factors are colored in green; transcription factors of interest e.g. EMT/AP1/YAP1/TEAD1 etc. are colored in red. (D) Scatterplot of enriched transcription factors rank for binding enrichment in regulatory regions around senescence induced genes in astrocytes (y-axis) vs. replicative senescence induced genes in WI-38 cells (x-axis). transcription factors with discordant ranks/enrichment are colored in turquoise,transcription factors with concordant ranks/enrichment are colored in red; transcription factors of interest are labeled in red.
Figure 6—figure supplement 1
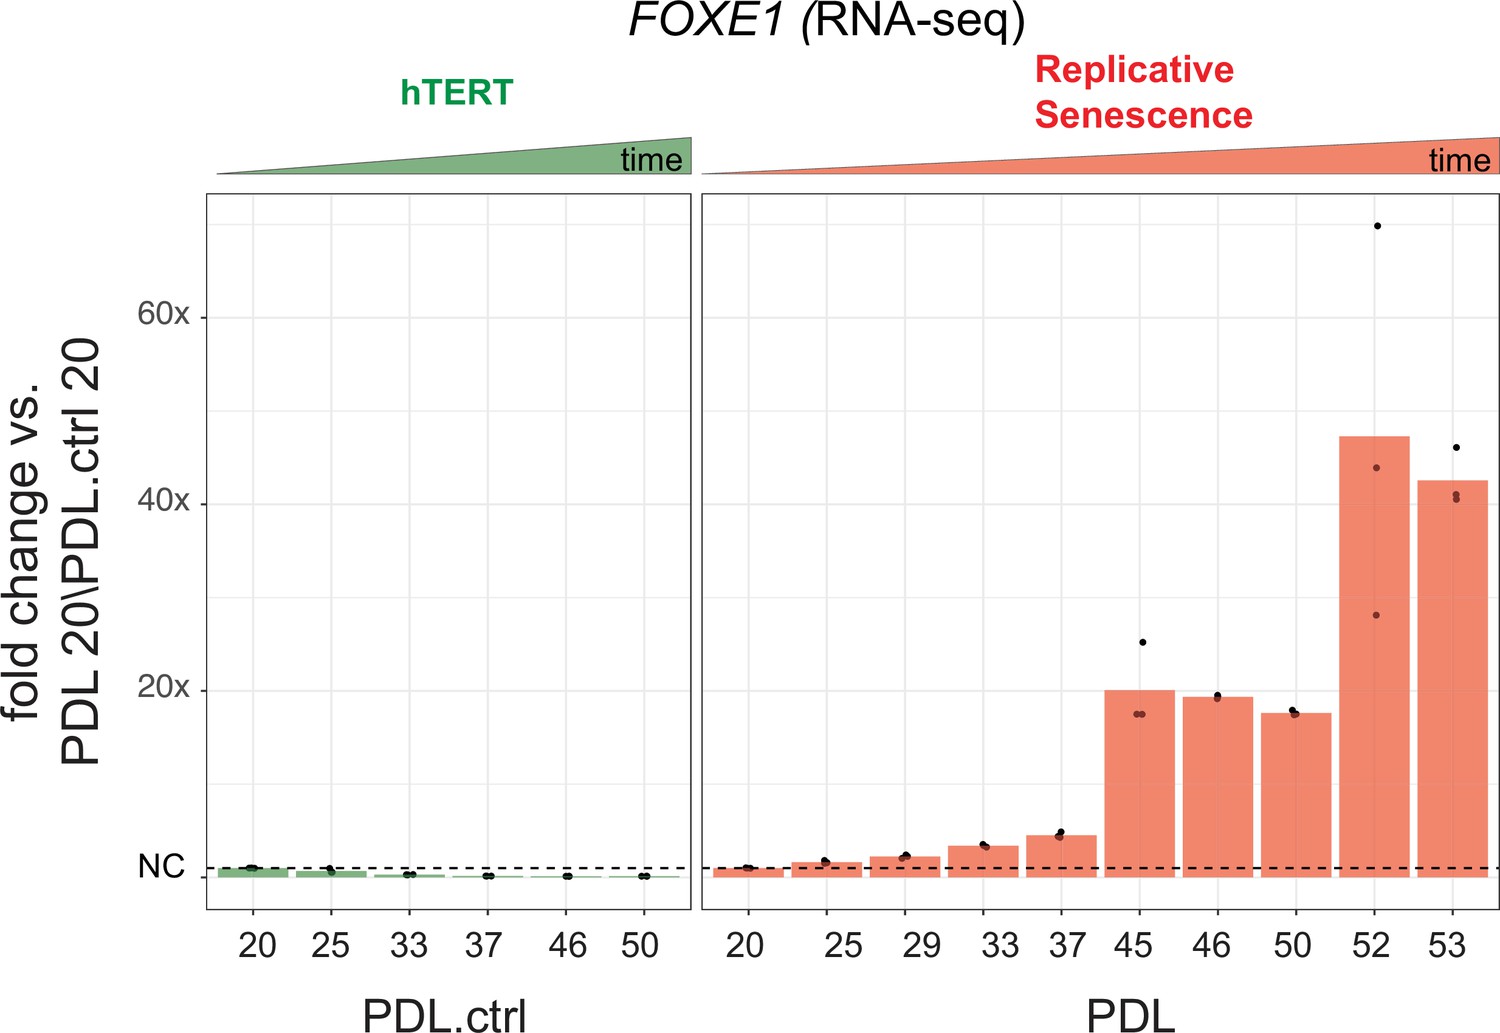
FOXE1 expression during senescence.
Gene expression fold changes for the transcription factor FOXE1 across conditions. Gene expression fold changes (three replicate average, each point a replicate) for the transcription factor FOXE1 in the hTERT and replicative senescence (RS) time courses.
Figure 7 with 2 supplements
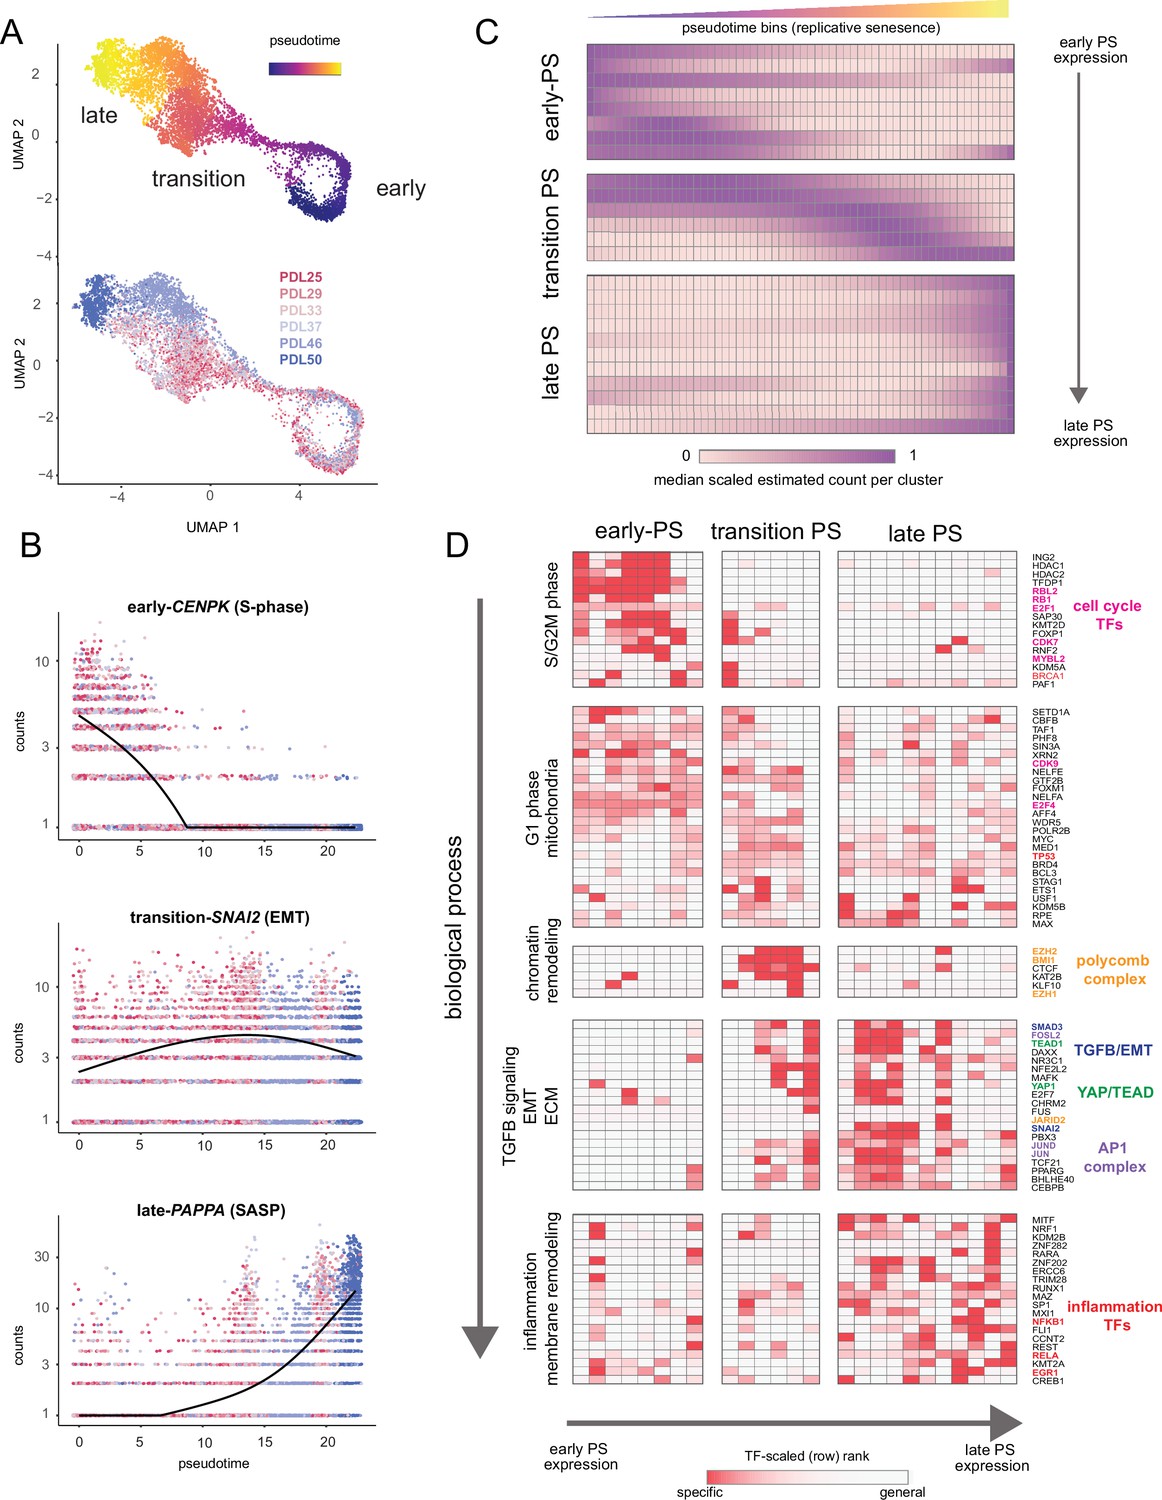
Pseudotime (PS) analysis of WI-38 approach to replicative senescence using single-cell RNA-seq.
(A) UMAP projection of single WI-38 cells collected at increasing PDLs (PDL25-red) to (PDL50-blue) and colored by pseudotime (top). (B) Scatterplot of single-cell gene expression across pseudotime with three genes representative of changes that occur early in pseudotime (top), during the transition phase (middle) and in late pseudotime (bottom). Each point is a cell colored by PDL–PDL25 (red) to PDL50 (blue). x-axis is pseudotime, and y-axis is counts for the gene of interest. Black line is a cubic spline. (C) Hierarchical clustering and heatmap of smoothened gene expression trajectories over 60 pseudotime bins (x-axis) of 25 K-median gene expression clusters (y-axis). Value plotted is the scaled (min expression to max expression; 0–1) median expression of all genes in the cluster. Clusters are divided into three (early, transition, late) pseudotime categories. (D) LISA transcription factor enrichment analysis using the 25 clusters from A divided into the same three (early, transition, late) pseudotime categories. Transcription factors and clusters are further divided on vertical axis into putative groupings based on transcription factor functions and GO term enrichment.
-
Figure 7—source data 1
Gene expression changes with pseudotime.
- https://cdn.elifesciences.org/articles/70283/elife-70283-fig7-data1-v3.txt
-
Figure 7—source data 2
GO term enrichment in pseudotime clusters.
- https://cdn.elifesciences.org/articles/70283/elife-70283-fig7-data2-v3.xlsx
Figure 7—figure supplement 1
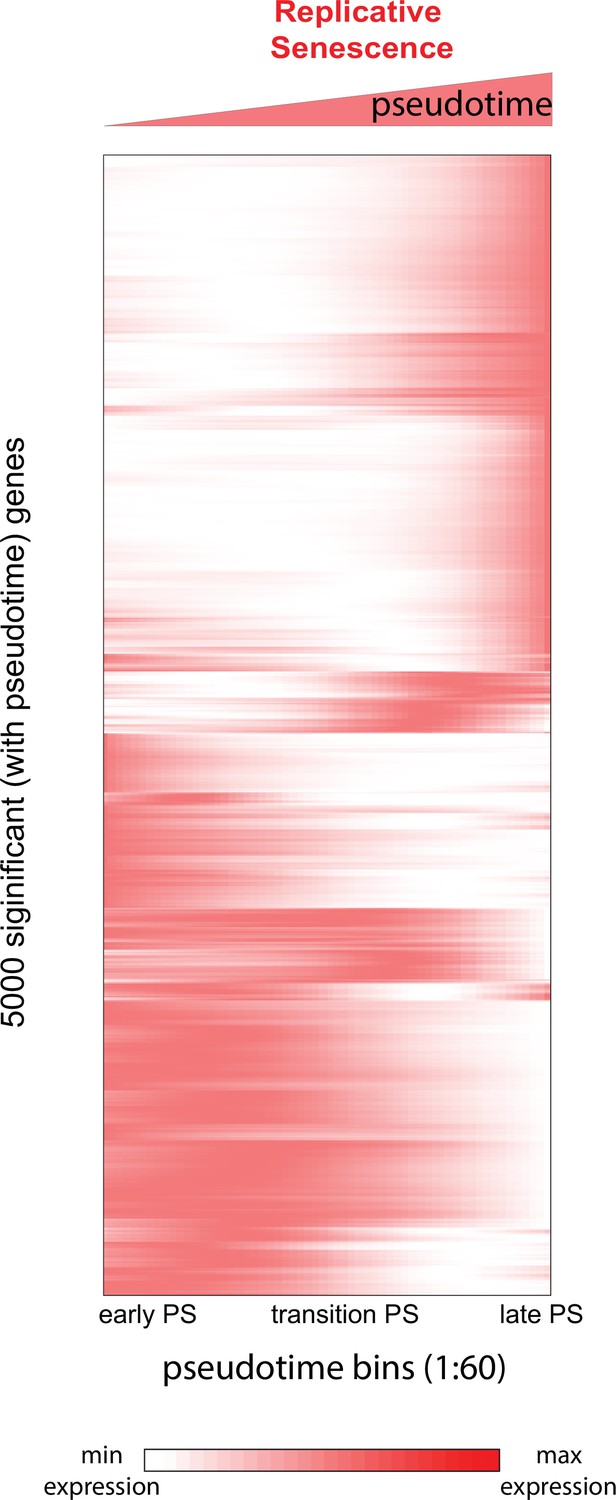
Heatmap of genes changing with senescence pseudotime.
Heatmap of gene expression changes for the top 5000 significantly changing genes during replicative senescence pseudotime. Genes were hierarchically clustered, gene normalized and scaled (0–1) expression levels are depicted (white = low expression, red = high expression).
Figure 7—figure supplement 2
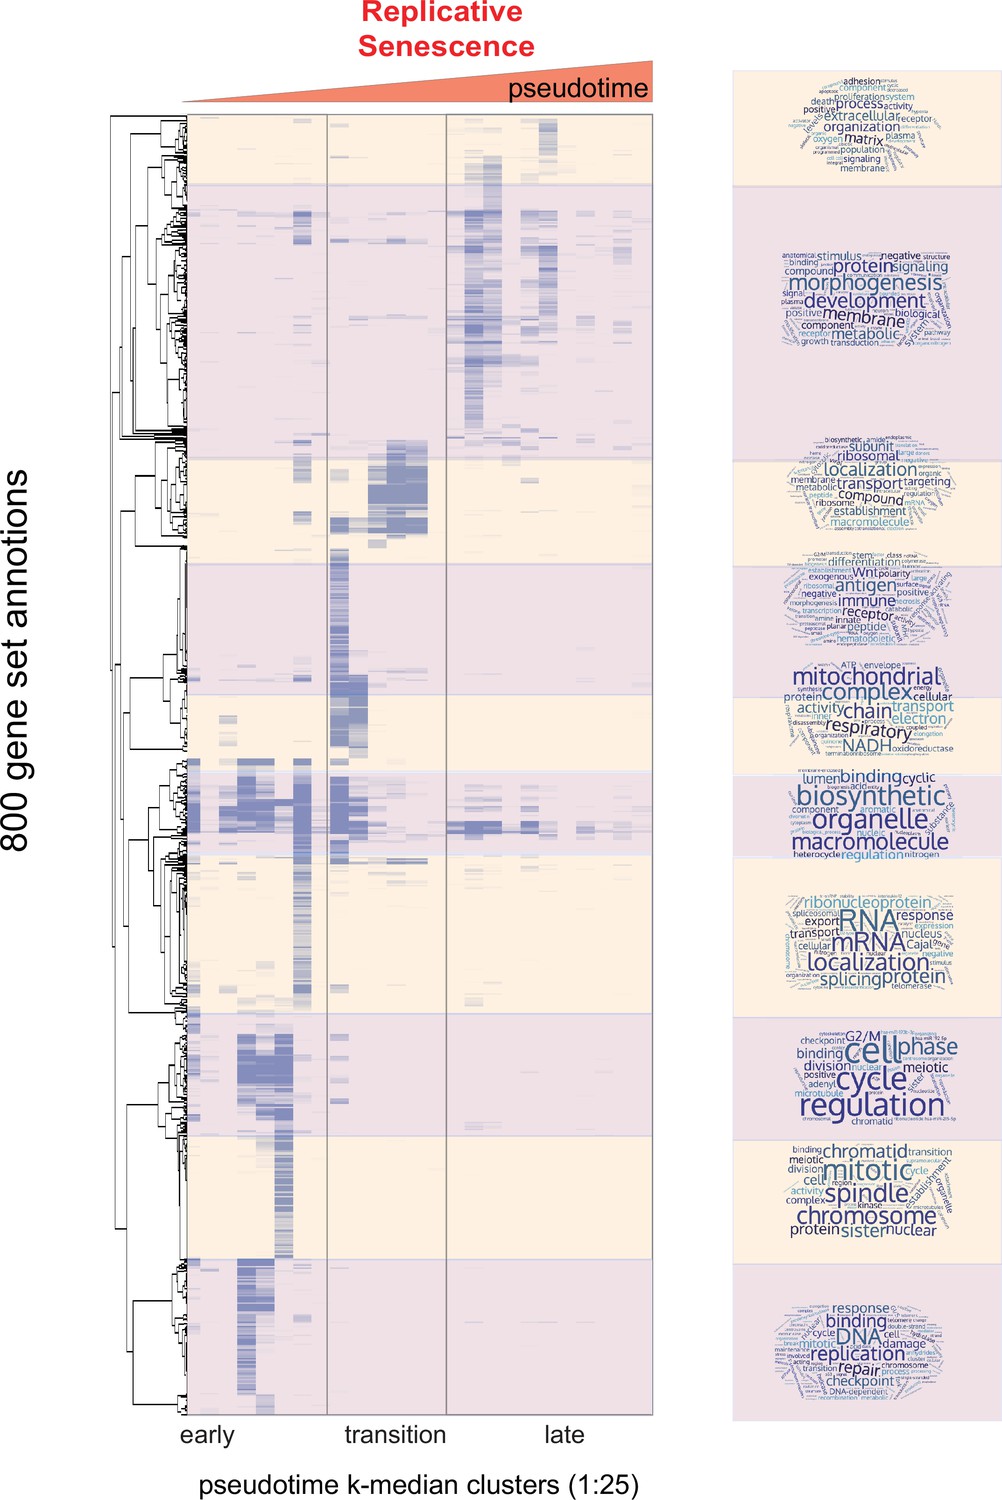
Heatmap of enriched gene sets for replicative senescence pseudotime clusters.
Heatmap of enriched gene sets for replicative senescence pseudotime clusters (k-25). Heatmap of adjusted p-values for GO-term enrichment analysis on individual clusters from 6. Values plotted are row normalized -log10 p-value; light purple to dark purple. The ordered pseudotime clusters are shown on the x-axis while hierarchically clustered gene sets are shown on the y-axis. Hierarchical clustering of gene set enrichment was used to divide gene sets into 10 major clusters. GO-term names were used to create word clouds reflective of the types and functions of enriched gene sets.
Figure 8 with 1 supplement
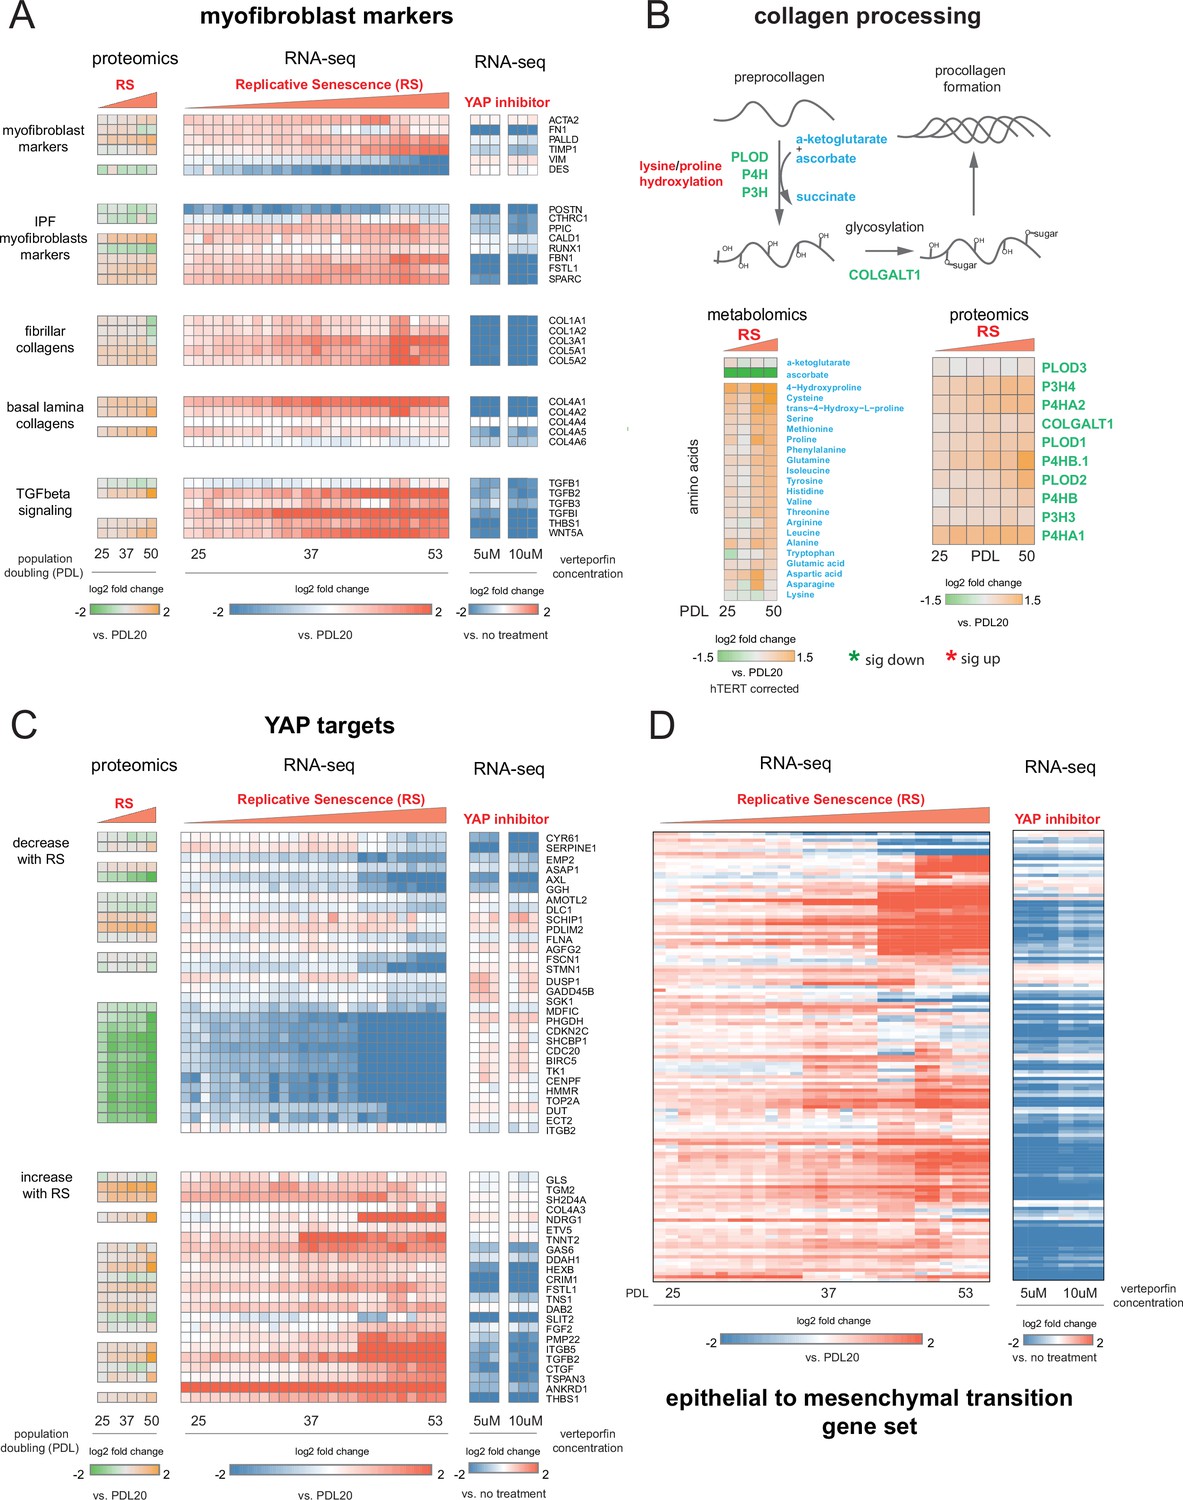
YAP regulation of myofibroblast markers and YAP1/TEAD1 targets during replicative senescence.
(A) RNA-seq and proteomics heatmaps of selected genes based on myofibroblast markers and biology. Values plotted are log2 fold change of each PDL vs. PDL 20 for replicative senescence timecourse and vs. no treatment for late PDL (PDL 40) WI-38 cells treated with the YAP inhibitor verteporfin. Proteomics values are median values for n = 3 replicates. Values for individual RNA-seq replicates (n = 3) are shown. (B) Diagram of collagen processing (left) with metabolites in blue and proteins in green. Collagen specific amino acid derivatives are outlined in red. Heatmap of log2 fold changes for metabolites and proteins involved in collagen processing (right). Proteomics values are median values for n = 3 replicates. Metabolomics values are hTERT batch corrected median values for n = 4 replicates. (C) Heatmaps of YAP1 targets collected by Kurppa et al., 2020. for proteomics and RNA-seq during replicative senescence and in late PDL (PDL 40) WI-38 cells treated with the YAP inhibitor verteporfin. Values plotted are same as in A. (D) Heatmap of log2 fold changes relative to PDL 20 or untreated control of leading edge genes from gene set enrichment analysis driving the hallmark EMT signature in verteporfin-treated WI-38 cells and during replicative senescence. Values for individual RNA-seq replicates (n=3) are shown.
-
Figure 8—source data 1
RNA-seq data for verteporfin treatment.
- https://cdn.elifesciences.org/articles/70283/elife-70283-fig8-data1-v3.xlsx
Figure 8—figure supplement 1

Effect of inhibiting the YAP1/TEAD1 interaction with verteporfin treatment on WI-38 cells.
Effect of inhibiting the YAP1/TEAD1 interaction with verteporfin treatment on WI-38 cells. (A) Barplots of the gene expression of 3 known YAP1 gene targets in verteporfin-treated cells. Values plotted are fold changes relative to the mean of the control samples. Each condition was sampled at triplicate. Error bars indicate the standard deviation from the mean. (B) Barplot representing significant normalized enrichment score for each enrichment term from the MSigDB Hallmarks annotation. FDR adjusted p-values < 0.01. (C) Heatmap comparing gene expression changes in replicative senescence and verteporfin treated WI-38 cells. Values plotted are log2 fold change relative to the first time point in each experiment.
Figure 9
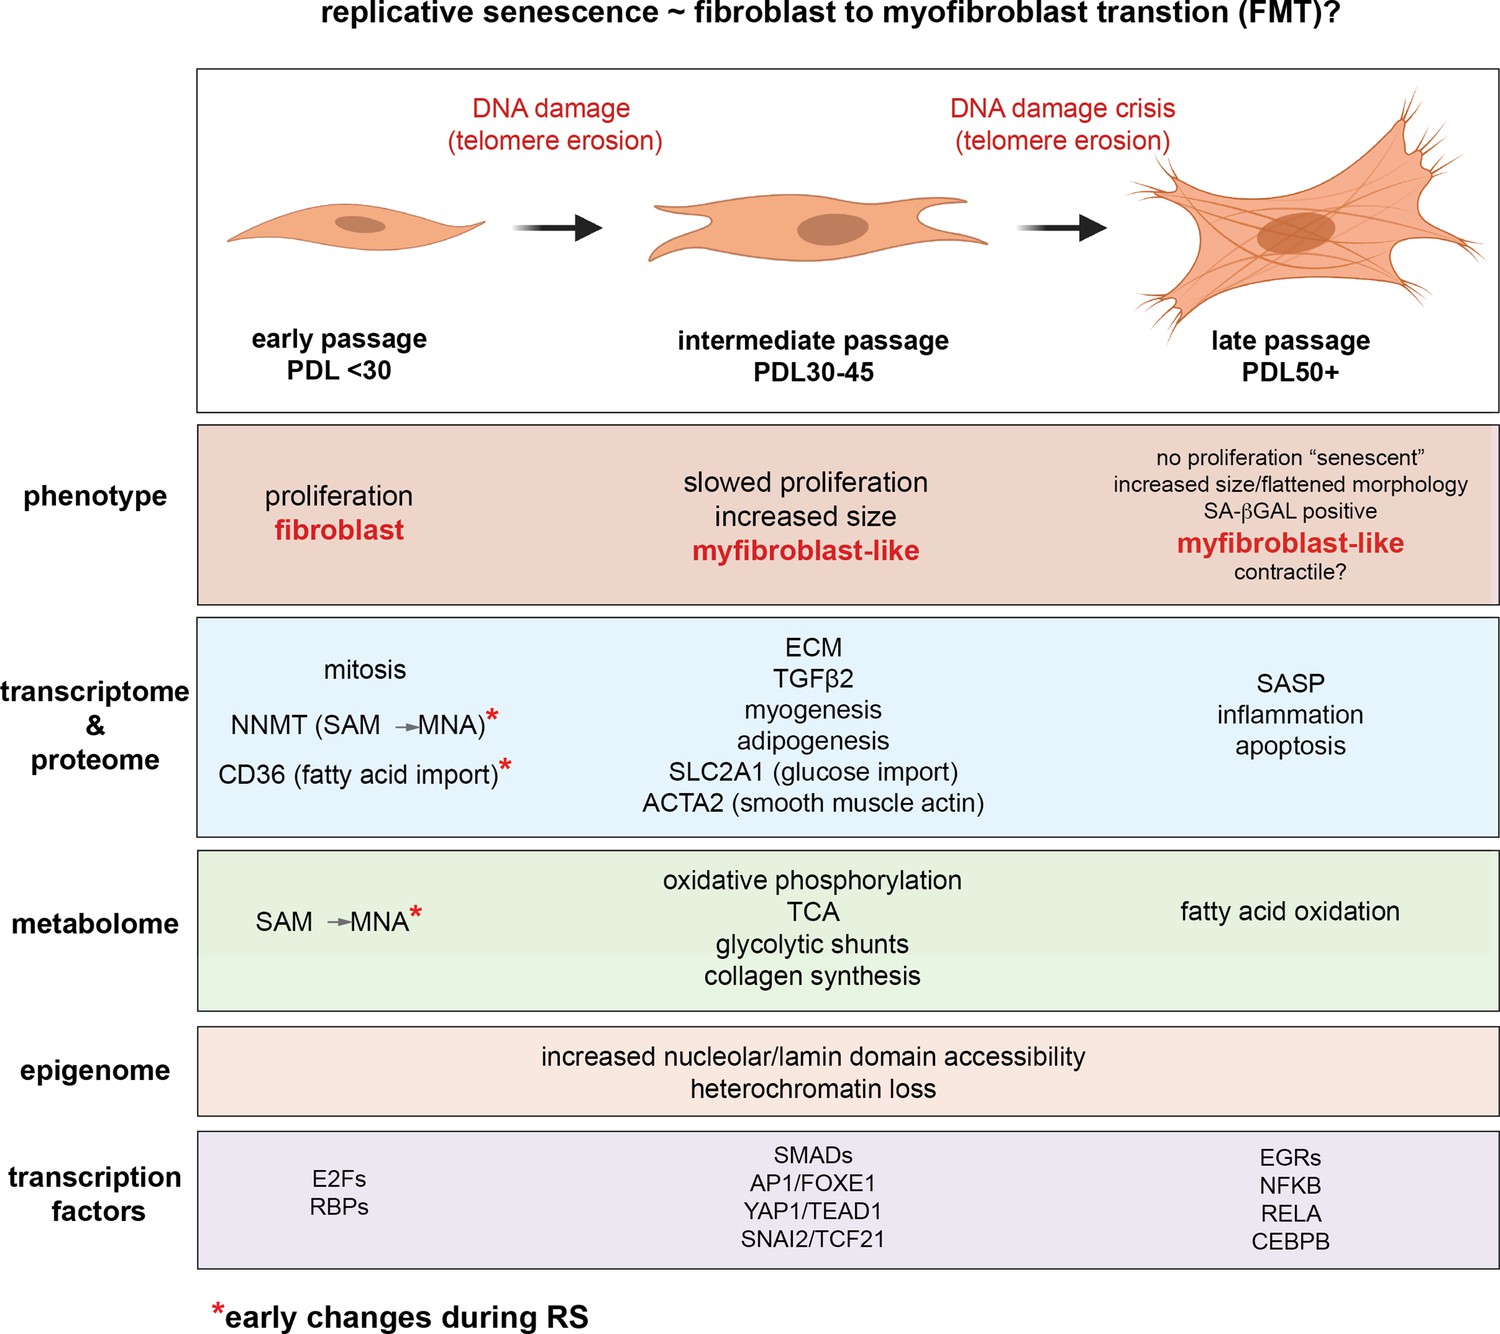
Replicative senescence fibroblast to myofibroblast transition (FMT) model.
We divided Replicative senescence progression into three major categories and summarized our results across all data modalities focusing on features in common with myofibroblasts.
Tables
Key resources table
| Reagent type (species) or resource | Designation | Source or reference | Identifiers | Additional information |
|---|---|---|---|---|
| Cell Line (H. sapiens) | WI-38 fibroblasts | Coriell | AG06814-N | |
| Cell Line (H. sapiens) | WI-38 hTERT | This paper | immortalized WI-38 human fibroblasts, methods | |
| Transfected construct (H. sapiens) | pCDH-CMV-hTERT-EF1a-puro | This paper | Lentiviral plasmid, methods | |
| Commercial assay, kit | Senescence-β-Galactosidase | Cell Signaling Tech. | 9,860 | |
| Commercial assay, kit | MycoAlert Mycoplasma Detection | Lonza | LT07-218 | |
| Commercial assay, kit | Direct-zol RNA Miniprep Plus | Zymo Research | R2072 | |
| Commercial assay, kit | Chromium Single Cell 3’ v2 | 10 x Genomics | 120,237 | |
| Commercial assay, kit | Chromium Single Cell A Chip | 10 x Genomics | 1000009 | |
| Commercial assay, kit | Tagment DNA Enzyme and Buffer | illumina | 20034197 | |
| Commercial assay, kit | Clean-and-Concentrator-5 | Zymo Research | D4014 | |
| Commercial assay, kit | NEBNext High-Fidelity 2 X PCR | NEB | M0541L | |
| Commercial assay, kit | TruSeq Stranded mRNA Library | illumina | 20020595 | |
| Commercial assay | Bioanalyzer High Sensitivity DNA | Agilent | 5067–4626 | |
| Commercial assay, kit | Pierce BCA Protein Assay | Thermo Fisher | 23,227 | |
| antibody | anti-human p16 antibody (Mouse monoclonal) | BD Biosciences | RRID:AB_395229 | (1:250) |
| antibody | anti-human p21 antibody (Mouse monoclonal) | BD Biosciences | RRID:AB_396414 | (1:250) |
| Commercial assay, kit | Pippin Prep 2% 100–600 bp | Sage Science | CDF2010 | |
| Chemical compound, drug | Verteporfin | RD Systems | 1243926 | |
| Other | Zorbax Extend C18 column | Aglient | 759700–902 | |
| Other | SeQuant ZIC-pHILIC column | EMD Millipore | 150,460 | |
| Software, algorithm | R (v4.0.3 and 3.6.2) | r-project.org/ | RRID:SCR_001905 | |
| Software, algorithm | Salmon (v 0.8.2) | combine-lab.github.io/salmon/ | RRID:SCR_017036 | |
| Software, algorithm | DESeq2 (v1.30.1) | bioconductor | RRID:SCR_015687 | |
| Software, algorithm | sva package(v3.38.0) | bioconductor | RRID:SCR_012836 | |
| Software, algorithm | fgsea 1.16.0 | bioconductor | RRID:SCR_020938 | |
| Software, algorithm | CellRanger 3.0 | 10 x Genomics | RRID:SCR_017344 | |
| Software, algorithm | SCTransform (v 0.3.2) | Satijalab.org/seurat | ||
| Software, algorithm | Seurat (v4.0.1.9005) | satijalab.org/seurat | RRID:SCR_007322 | |
| Software, algorithm | monocle3 (v1.0.0) | cole-trapnell-lab.github.io/monocle3 | RRID:SCR_018685 | |
| Software, algorithm | bowtie2 (v2.3.4.1) | bowtie-bio.sourceforge.netbowtie-bio.sourceforge.net | RRID:SCR_016368 | |
| Software, algorithm | samtools (v1.2) | http://ww.htslib.org/ | RRID:SCR_002105 | |
| Software, algorithm | Picard (v2.6.4) | broadinstitute.github.io/picard | RRID:SCR_006525 | |
| Software, algorithm | macs2 (v2 2.1.2) | hbctraining.github.io/main/ | RRID:SCR_013291 | |
| Software, algorithm | GenomicRanges (v1.42.0) | bioconductor | RRID:SCR_000025 | |
| Software, algorithm | cutadapt (v2.4) | https://github.com/marcelm/cutadapt | RRID:SCR_011841 | |
| Software, algorithm | bcl2fastq (v2.20) | Illumina | RRID:SCR_015058 | |
| Software, algorithm | regioneR v1.22.0 | bioconductor | ||
| Software, algorithm | ATACseqQC v1.14.4 | bioconductor | ||
| Software, algorithm | LIMMA v3.46.0 | bioconductor | RRID:SCR_010943 | |
| Software, algorithm | Qvalue v2.26.0 | combine-lab.github.io/salmonQvalue | RRID:SCR_001073 | |
| Software, algorithm | LISA v1 | lisa.cistrome.org |
Additional files
Download links
A two-part list of links to download the article, or parts of the article, in various formats.
Downloads (link to download the article as PDF)
Open citations (links to open the citations from this article in various online reference manager services)
Cite this article (links to download the citations from this article in formats compatible with various reference manager tools)
Novel insights from a multiomics dissection of the Hayflick limit
eLife 11:e70283.
https://doi.org/10.7554/eLife.70283


