Cross-reactive antibodies after SARS-CoV-2 infection and vaccination
- Department of Medical Microbiology, Amsterdam UMC, University of Amsterdam, Amsterdam Institute for Infection and Immunity, Netherlands
- Department of Internal Medicine, Amsterdam UMC, University of Amsterdam, Amsterdam Institute for Infection and Immunity, Netherlands
- Center for Immunology of Viral, Auto-immune, Hematological and Bacterial Diseases (IMVA-HB/IDMIT), Université Paris-Saclay, INSERM, CEA, France
- Center for Experimental and Molecular Medicine, Amsterdam UMC, University of Amsterdam, Amsterdam Institute for Infection and Immunity, Netherlands
- Department of Internal Medicine, Amsterdam UMC, Vrije Universiteit Amsterdam, Amsterdam Institute for Infection and Immunity, Netherlands
- National Institute for Public Health and the Environment, RIVM, Netherlands
- Department of Infectious Diseases, Public Health Service of Amsterdam, GGD, Netherlands
- Department of Internal Medicine, Tergooi Hospital, Netherlands
- Department of Microbiology and Immunology, Peter Doherty Institute for Infection and Immunity, The University of Melbourne, Australia
- Department of Microbiology and Immunology, Weill Medical College of Cornell University, United States
Figures
Figure 1 with 1 supplement
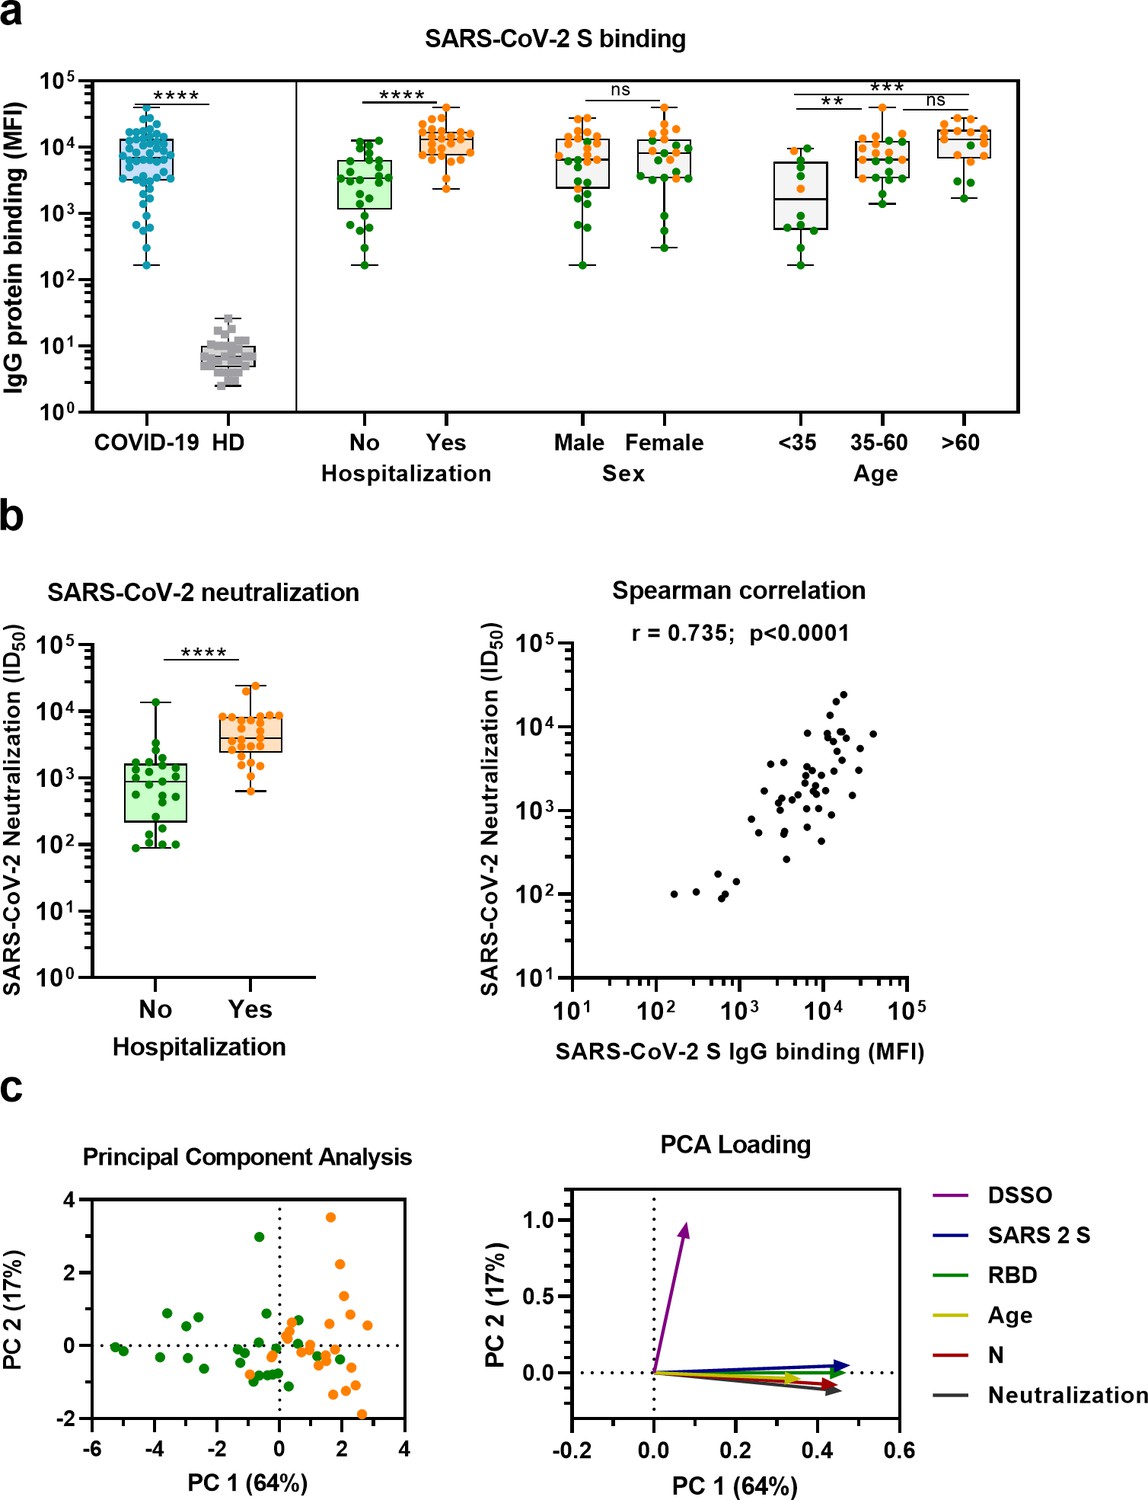
SARS-CoV-2 antibody response in COVID-19 patients.
(a) IgG binding of sera to SARS-CoV-2 S protein measured with a custom Luminex assay. Convalescent COVID-19 sera (COVID-19, blue dots, n = 50) were compared to sera of pre-pandemic healthy donors (HD, gray squares, n = 30) using a Mann–Whitney U test. The cohort of COVID-19 patients was subdivided according to admission status, sex, and age. Admission status is indicated with orange dots for hospitalized patients (Yes) and green dots if no admission to hospital was needed (No). (b) SARS-CoV-2 pseudovirus neutralization capacity compared between hospitalized patients (orange dots) and patients that did not need admission to hospital (green dots) (left). The correlation between the SARS-CoV-2 pseudovirus neutralization and SARS-CoV-2 S antibody levels in the Luminex assay was determined using Spearman’s correlation (right). (c) A principal component analysis (PCA) was performed using the following variables: IgG antibodies binding to SARS-CoV-2 S protein (S), RBD and nucleocapsid protein (N), SARS-CoV-2 neutralization, age and days since symptom onset (DSSO). Admission status is indicated with orange dots for hospitalized patients and green dots if no admission to hospital was needed (left). Loading of the principal component (PC) plot by each variable is indicated with colored arrows to visualize the contribution of each variable on PC 1 and 2 (right). ns, not significant; **p<0.01; ***p<0.001; ****p<0.0001. MFI, median fluorescent intensity; S, spike protein; ID50, serum dilution at which 50% of pseudovirus is neutralized; r, Spearman’s rank correlation coefficient.
-
Figure 1—source data 1
Source data of all panels of Figure 1.
- https://cdn.elifesciences.org/articles/70330/elife-70330-fig1-data1-v2.xlsx
Figure 1—figure supplement 1
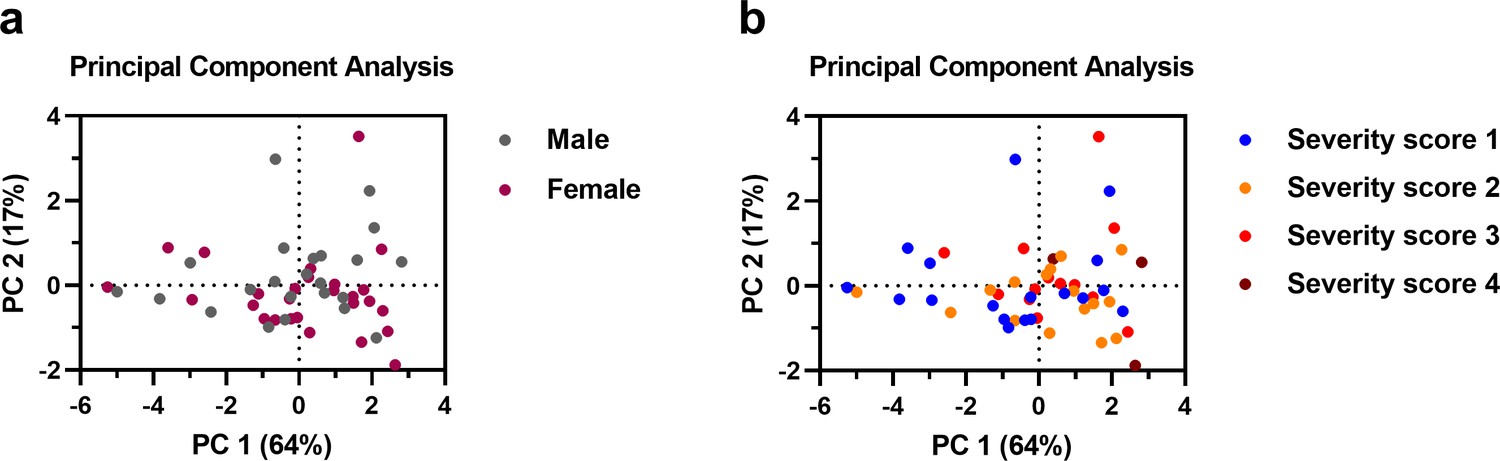
Principal component analysis showing the influence of sex and disease severity on the SARS-CoV-2 IgG response.
A principal component analysis was performed using the following variables: IgG antibodies to SARS-CoV-2 S protein (S), RBD and nucleocapsid protein (N), SARS-CoV-2 neutralization, age and days since symptom onset (DSSO). Patients were subdivided based on sex (a) and WHO severity score (b). A description of the WHO severity scoring is found in Supplementary file 1. The loading of the principal component plot by each variable is shown in Figure 1.
Figure 2 with 6 supplements
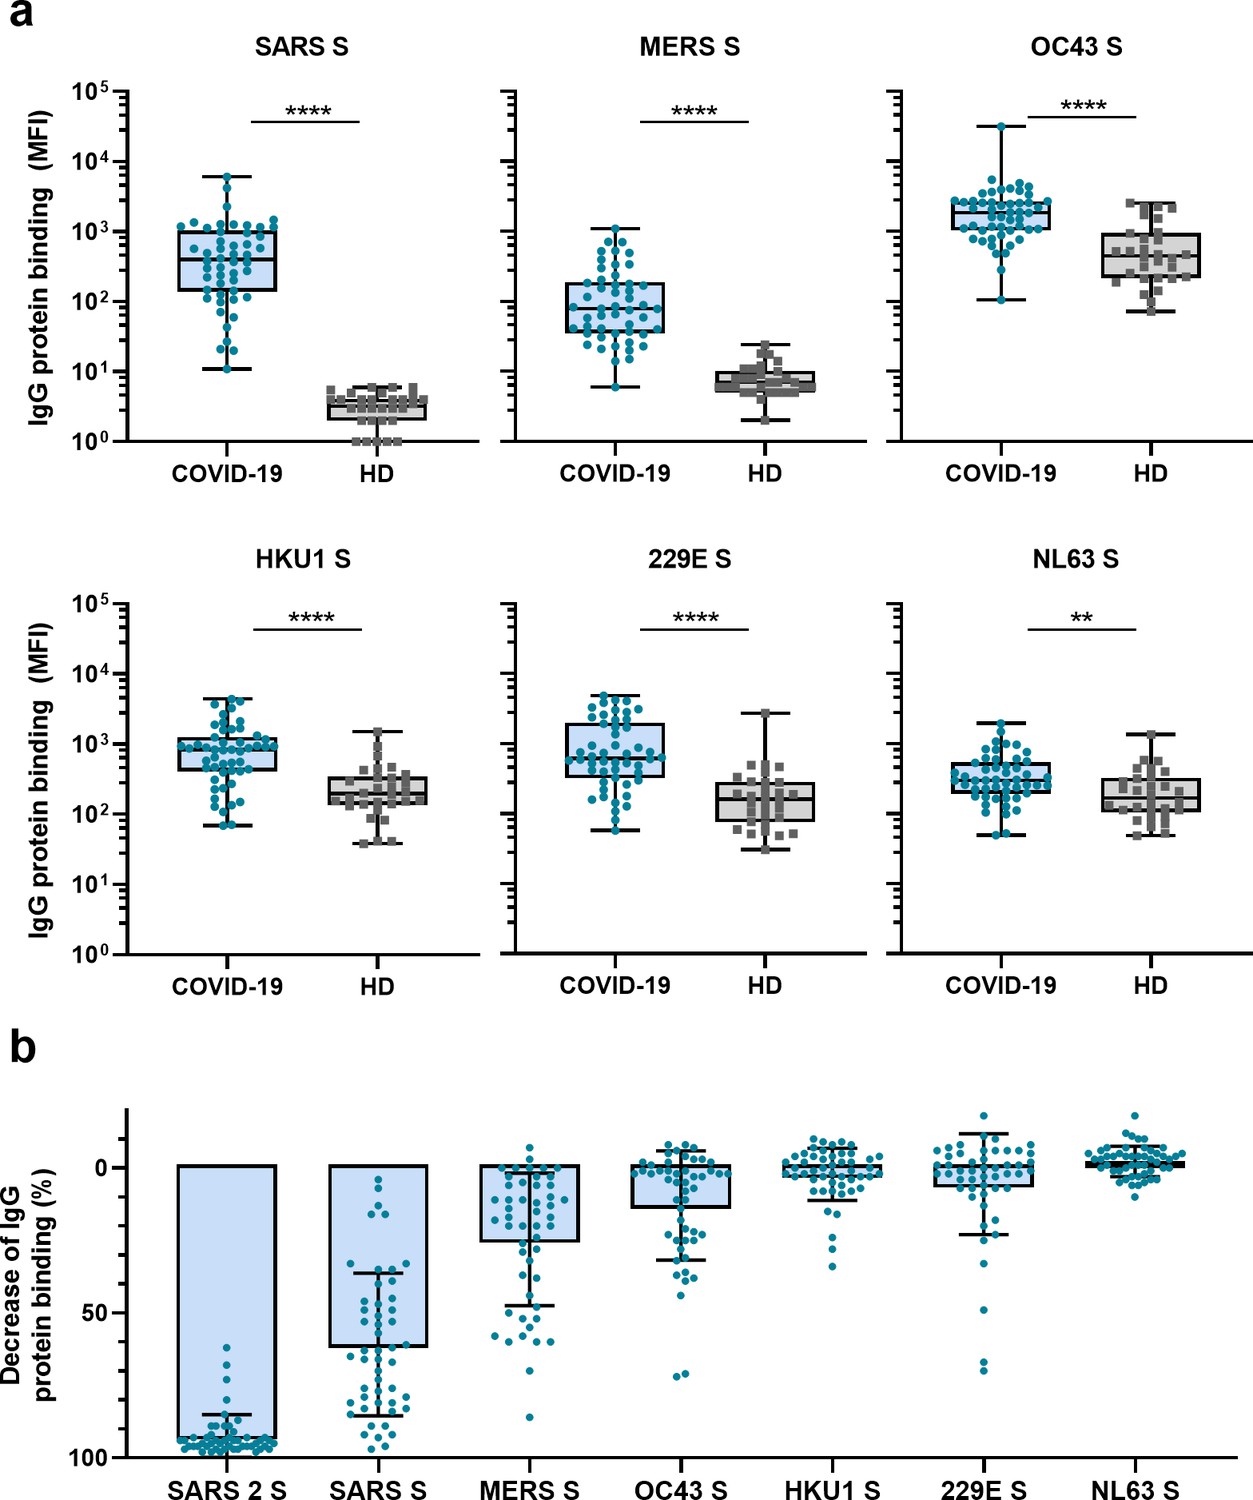
Cross-reactivity to hCoV S proteins in convalescent COVID-19 sera.
(a) IgG binding to all hCoV S proteins measured with a custom Luminex assay in convalescent COVID-19 sera (COVID-19, blue dots, n = 50) were compared to pre-pandemic sera from healthy donors (HD, gray squares, n = 30) using a Mann–Whitney U test. Box plots range the minimum and maximum values. **p<0.01; ****p<0.0001. Serum IgG binding to the tetanus toxoid control protein is shown in Supplementary file 2a. (b) Percent decrease of IgG binding to all other hCoV S proteins in COVID-19 patient sera (n = 50) after depletion with soluble recombinant SARS-CoV-2 S protein. Bars represent the mean decrease of binding IgG as a percentage of the total binding IgG observed in undepleted sera, and error bars represent the standard deviation. Dots represent the percent decrease of binding IgG observed in individual sera. The percent decrease of IgG binding to tetanus toxoid control protein in patient sera and healthy donor sera after SARS-CoV-2 S protein depletion is shown in Figure 2—figure supplement 1b and c, respectively, and depletion of hCoV S IgG binding in healthy donor sera is shown in Figure 2—figure supplement 1d. All absolute median fluorescent intensity (MFI) values are shown in Figure 3—figure supplement 1a and Figure 3—figure supplement 2a. S, spike protein.
-
Figure 2—source data 1
Source data of all panels of Figure 2.
- https://cdn.elifesciences.org/articles/70330/elife-70330-fig2-data1-v2.xlsx
Figure 2—figure supplement 1
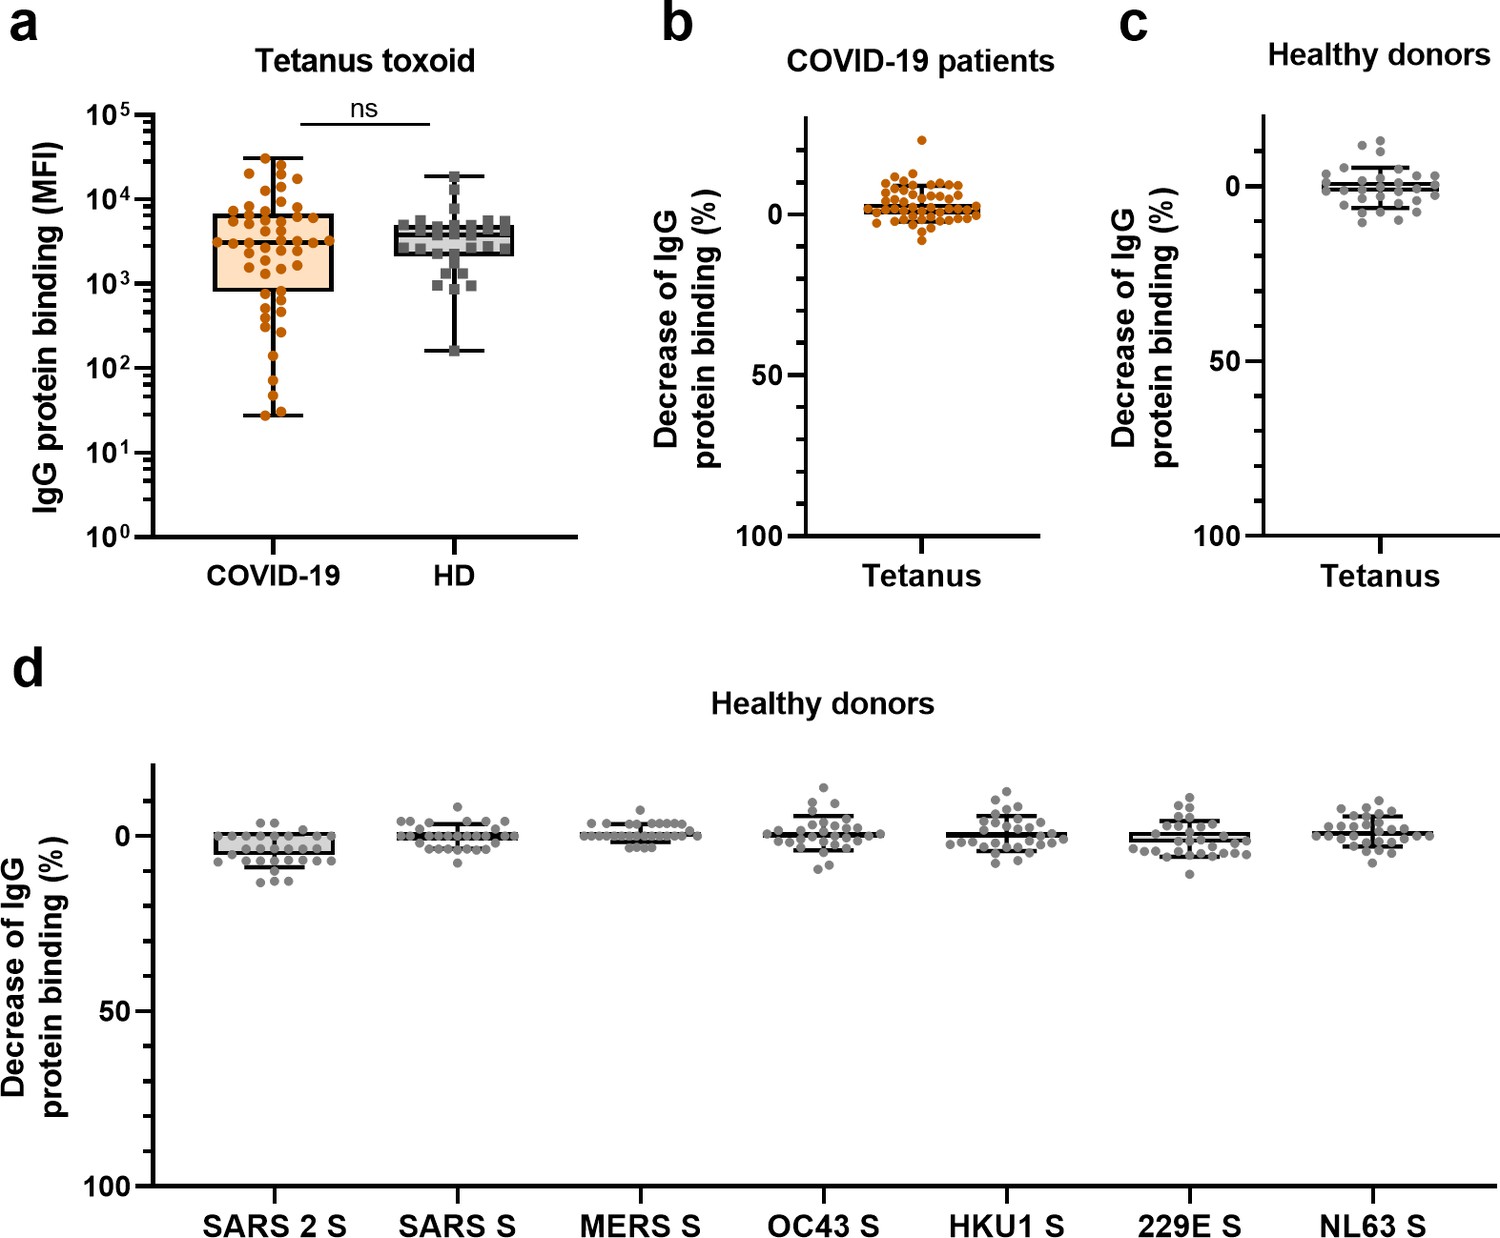
Antibody reactivity to tetanus toxoid in convalescent COVID-19 sera and depletion of antibodies binding to all proteins in healthy donors.
(a) IgG binding to tetanus toxoid protein measured with a custom Luminex assay in sera of convalescent COVID-19 sera (COVID-19, orange dots, n = 50) compared to sera of pre-pandemic healthy donors (HD, gray squares, n = 30) using a Mann–Whitney U test. Box plots range the minimum and maximum values. Ns, nonsignificant. (b) Percent decrease of IgG binding to tetanus toxoid protein in COVID-19 patient sera (n = 50) after depletion with soluble recombinant SARS-CoV-2 S protein. (c) Percent decrease of IgG binding to tetanus toxoid protein after depletion with soluble recombinant SARS-CoV-2 S protein in healthy donors (n = 30), and (d) percent decrease of IgG binding to hCoV S proteins after depletion with soluble recombinant SARS-CoV-2 S protein in healthy donors (n = 30). Bars represent the mean decrease of binding IgG as a percentage of the total binding IgG observed in undepleted sera of all COVID-19 patients (b) or healthy donors (c, d), and error bars represent the standard deviation. Dots represent the percent decrease of binding IgG in individual sera. All median fluorescent intensity (MFI) values are shown in Figure 3—figure supplements 1 and 2.
Figure 2—figure supplement 2
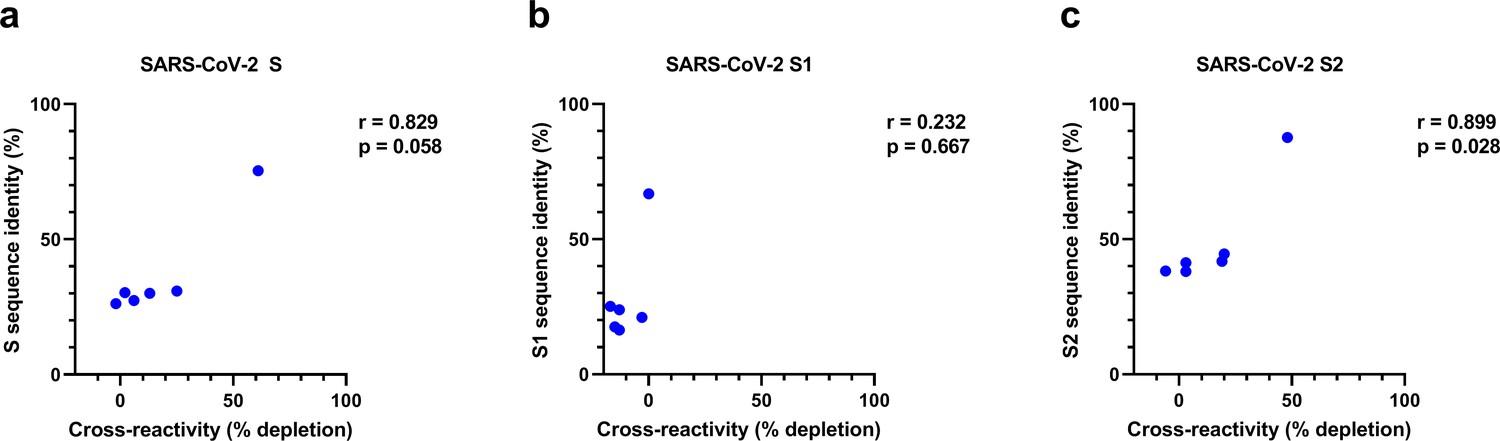
Correlation between sequence identity and reduction of cross-reactive antibodies in depletion assay for S, S1, and S2.
The correlation between S protein (a), S1 subdomain (b), and S2 subdomain (c) sequence identity of SARS-CoV-2 with the different hCoV S proteins (also shown in Supplementary file 2) and the reduction of antibodies binding to hCoV S proteins in the SARS-CoV-2 S protein depletion assay (also shown in Figure 2b) was determined using Spearman’s correlation. S, spike protein; r, Spearman’s rank correlation coefficient.
Figure 2—figure supplement 3
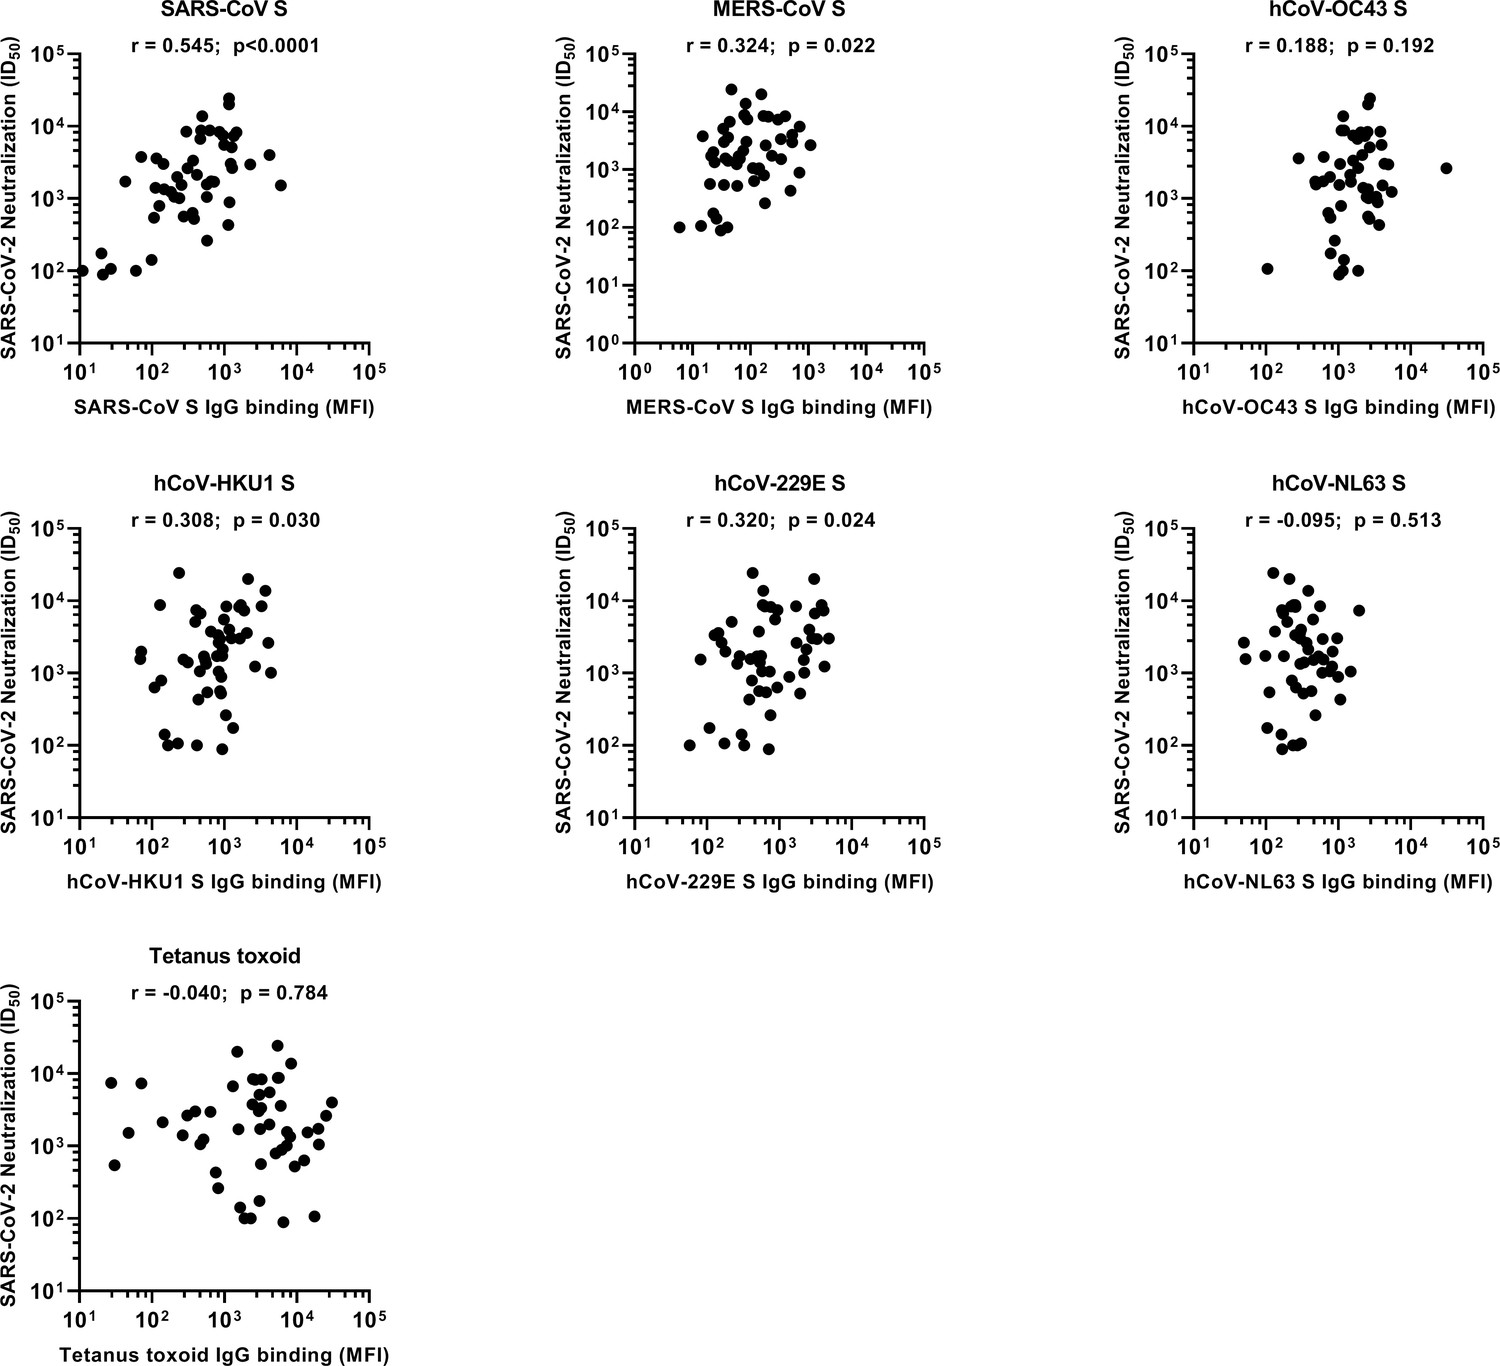
Spearman’s correlations between SARS-CoV-2 neutralization and antibody reactivity to hCoV S and tetanus toxoid.
The correlation between the SARS-CoV-2 pseudovirus neutralization (also shown in Figure 1b) and binding IgG binding measured with a custom Luminex assay (also shown in Figure 2a) in sera of convalescent COVID-19 patients (n = 50) was determined using Spearman’s correlation. MFI, median fluorescent intensity; S, spike protein; ID50, serum dilution at which 50% of pseudovirus is neutralized; r, Spearman’s rank correlation coefficient.
Figure 2—figure supplement 4
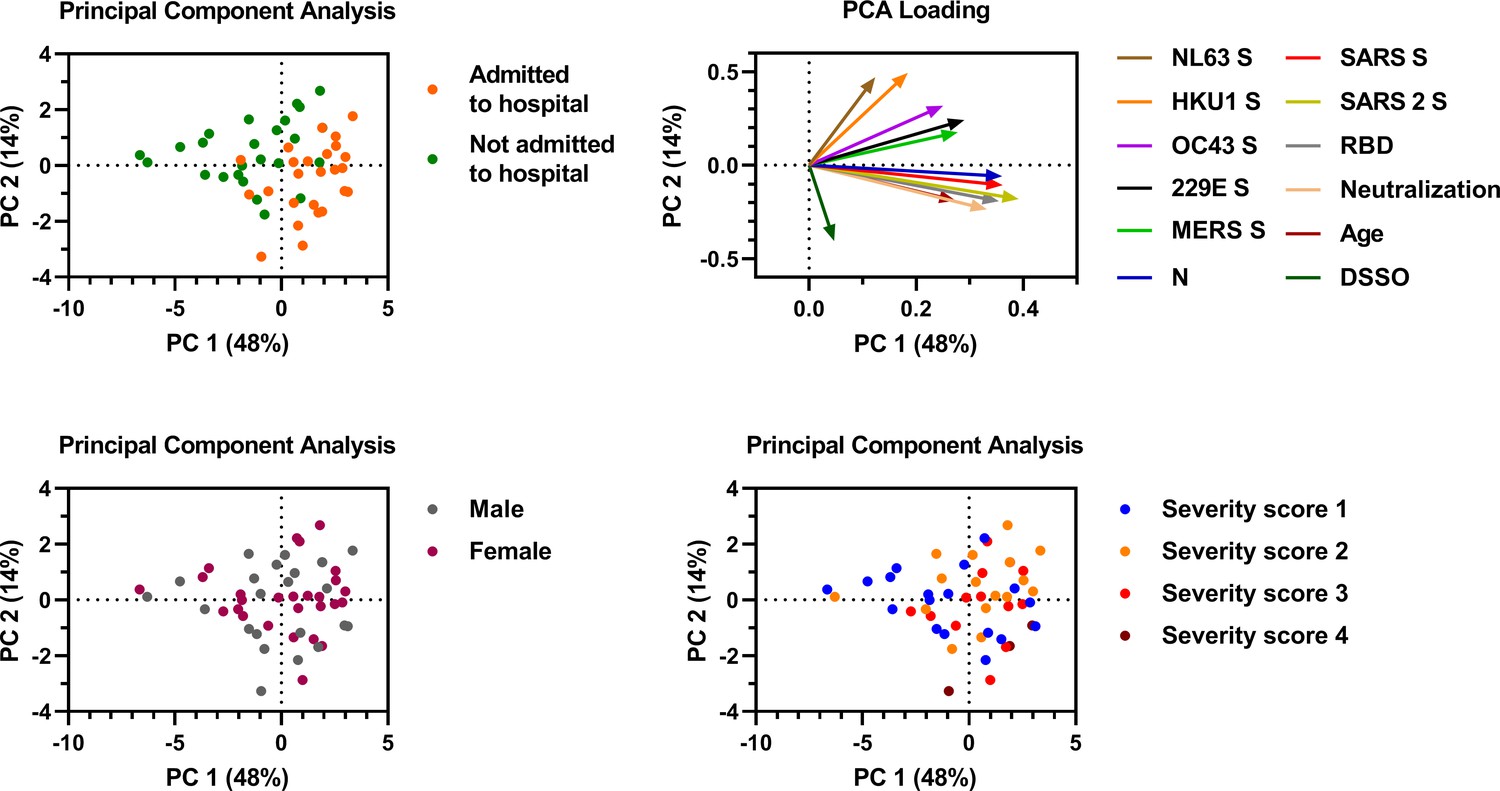
Principal component analysis including SARS-CoV-2 binding antibodies, neutralization, clinical characteristics, and cross-reactivity.
The principal component analysis was performed using the following variables: IgG binding to all hCoV S proteins including SARS-CoV-2, IgG binding to SARS-CoV-2 RBD and nucleocapsid protein (N), SARS-CoV-2 neutralization, patient age and days since symptom onset (DSSO). Color indicates the difference between patients that needed hospitalization (orange) or stayed in home quarantine (green) (top left), between males (gray) and females (purple) (bottom left), and between patients with different WHO severity scores (bottom right, description of scoring is found in Supplementary file 1). The loading of each variable for principal component (PCs) 1 and 2 is shown (top right).
Figure 2—figure supplement 5
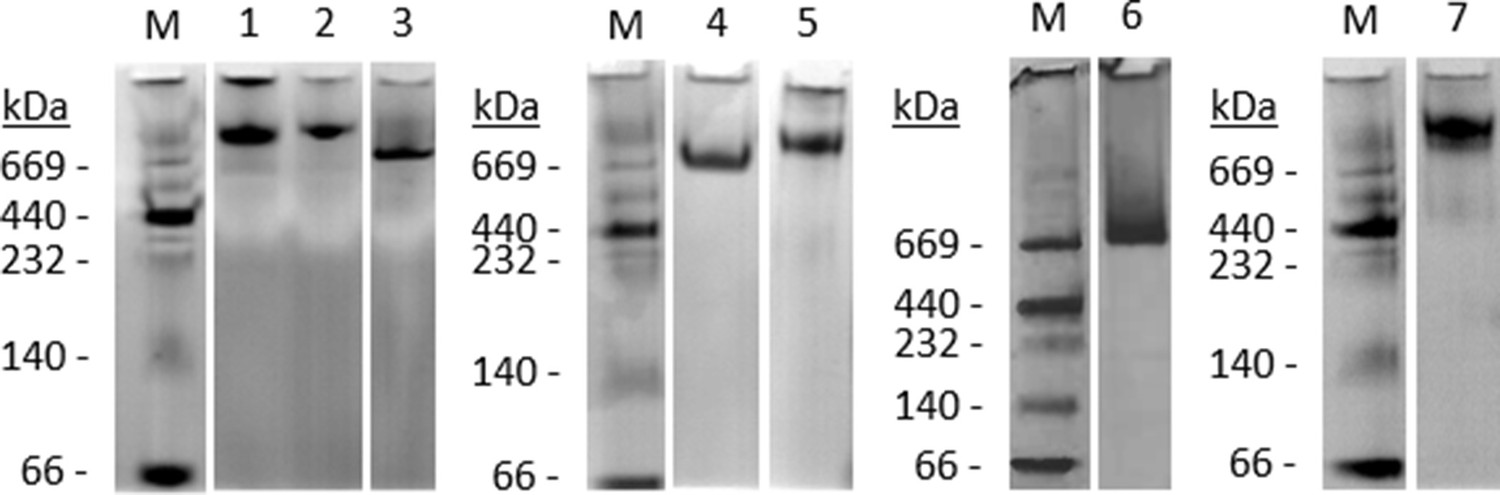
Native PAGE analysis of hCoV proteins.
Photographs of colloidal blue stainings of 4–12% NuPAGE Bis-Tris gels showing protein integrity and composition of the trimeric human coronavirus spike proteins. Marker sizes are indicated in kilo Dalton. Lane contents: (M) Marker HMW-Native Protein Mixture; (1) SARS-CoV spike; (2) MERS-CoV spike; (3) hCoV-229E spike; (4) hCoV-OC43 spike; (5) SARS-CoV-2 spike; (6) hCoV-HKU1 spike; and (7) hCoV-NL63 spike.
-
Figure 2—figure supplement 5—source data 1
Raw, unedited, and uncropped pictures of colloidal blue stainings of 4–12% NuPAGE Bis-Tris gels, and uncropped pictures with the sizes of the marker in kilo Dalton and the relevant bands indicated.
The numbers match with the numbers in Figure 2—figure supplement 5: (M) Marker HMW-Native Protein Mixture; (1) SARS-CoV spike; (2) MERS-CoV spike; (3) hCoV-229E spike; (4) hCoV-OC43 spike; (5) SARS-CoV-2 spike; (6) hCoV-HKU1 spike; and (7) hCoV-NL63 spike.
- https://cdn.elifesciences.org/articles/70330/elife-70330-fig2-figsupp5-data1-v2.zip
Figure 2—figure supplement 6
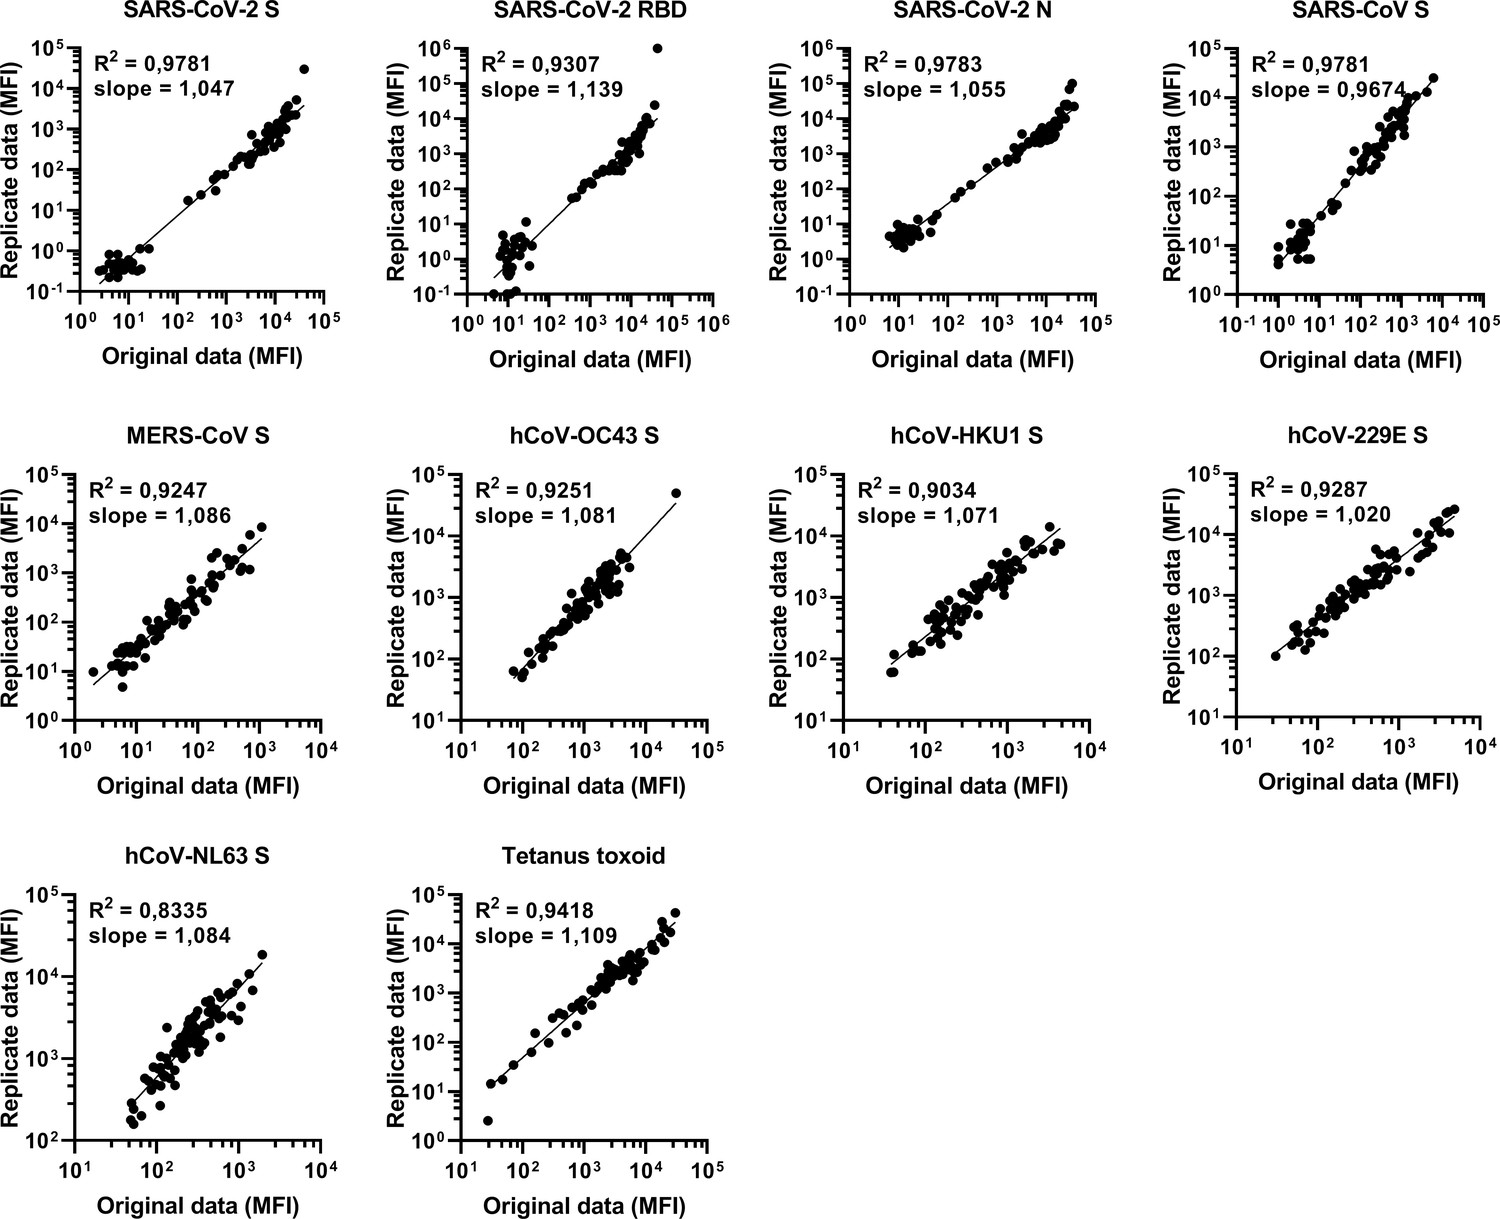
Reproducibility of the Luminex assay.
The reproducibility of the custom Luminex assay is shown by plotting data from two independent assays performed on different days with the same samples. The data on the Y axis are found in Figure 3, and the data on the X axis are also found in Figures 1 and 2. The quality of the replicates is presented by the R2 and slope of a simple linear regression performed on the log10 transformed median fluorescent intensity (MFI) data. S, spike protein; N, nucleocapsid; RBD, receptor binding domain.
Figure 3 with 2 supplements
Depletion of S1 and S2 subdomain-specific cross-reactivity in convalescent COVID-19 sera.
Percent decrease of IgG binding to all other hCoV S proteins in convalescent COVID-19 sera (n = 50) after depletion with soluble recombinant monomeric SARS-CoV-2 S1 or S2 subdomains. Bars represent the mean decrease of binding IgG as a percentage of the total binding IgG observed in undepleted sera, and error bars represent the standard deviation. Dots represent the percent decrease of binding IgG observed in individual sera. Percent decrease of IgG binding to tetanus toxoid control protein in patient sera after SARS-CoV-2 S1 and S2 depletion is shown in Figure 3—figure supplement 1a. The percent decrease of IgG binding to hCoV S and tetanus toxoid protein in healthy donor sera after SARS-CoV-2 S1 and S2 depletion is shown in Figure 3—figure supplement 1b and c. All absolute median fluorescent intensity (MFI) values are shown in Figure 3—figure supplement 1a and Figure 3—figure supplement 2a. S, spike protein.
-
Figure 3—source data 1
Source data of all panels of Figure 3.
- https://cdn.elifesciences.org/articles/70330/elife-70330-fig3-data1-v2.xlsx
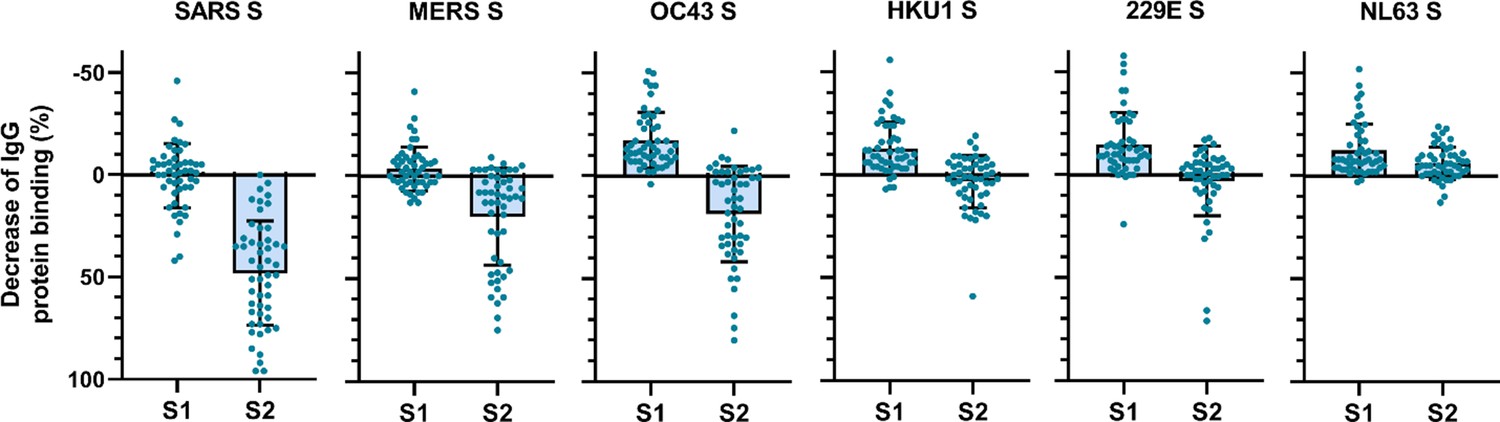
Figure 3—figure supplement 1
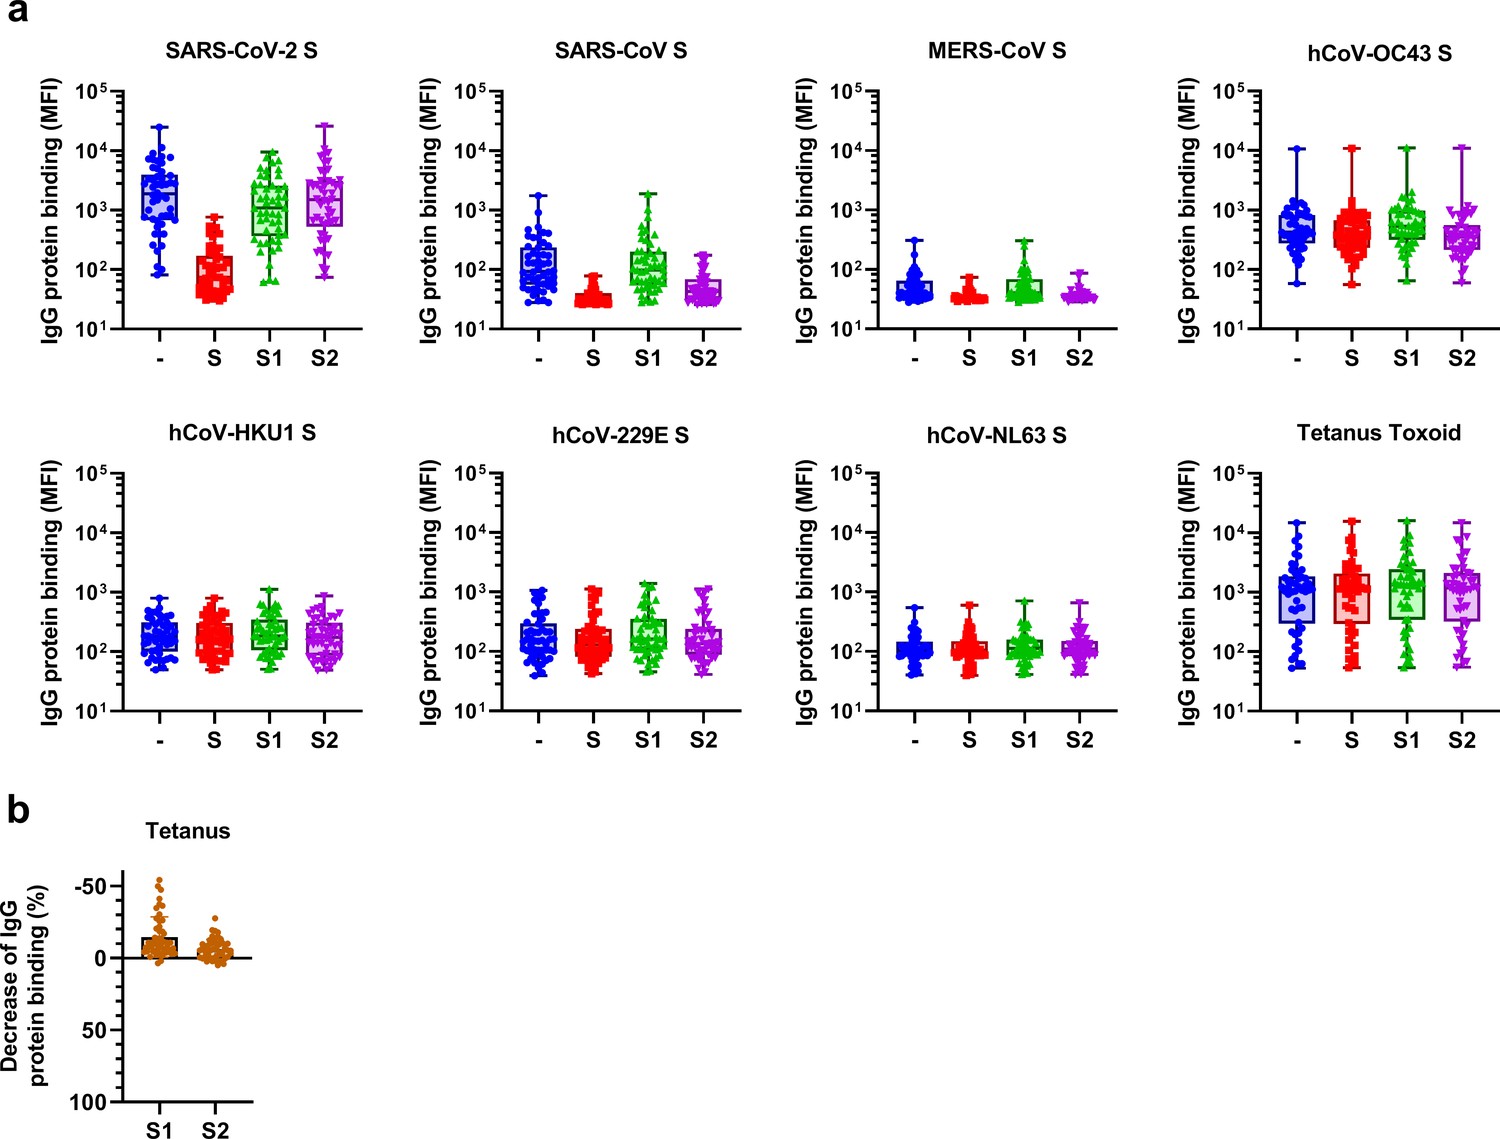
Raw data and control data from depletion assays on convalescent COVID-19 sera.
(a) Median fluorescent intensity (MFI) values of IgG binding to all hCoV S proteins and tetanus toxoid control protein, measured with a custom Luminex assay in sera of convalescent COVID-19 sera (n = 50) after depletion with soluble recombinant SARS-CoV-2 S protein, S1 subdomain, and S2 subdomain. Box plots range the minimum and maximum values. -, undepleted sera; S, trimeric S protein-depleted sera; S1, S1 subdomain-depleted sera; S2, S2 subdomain-depleted sera. (b) Percent decrease of IgG binding to tetanus toxoid control protein in sera of convalescent COVID-19 patients (n = 50) after depletion with soluble recombinant SARS-CoV-2 S1 or S2 subdomain. Bars represent the mean decrease of binding IgG as a percentage of the total binding IgG observed in undepleted sera of all COVID-19 patients, and error bars represent the standard deviation. Dots represent the percent decrease found in individual patient sera. S, spike protein.
Figure 3—figure supplement 2
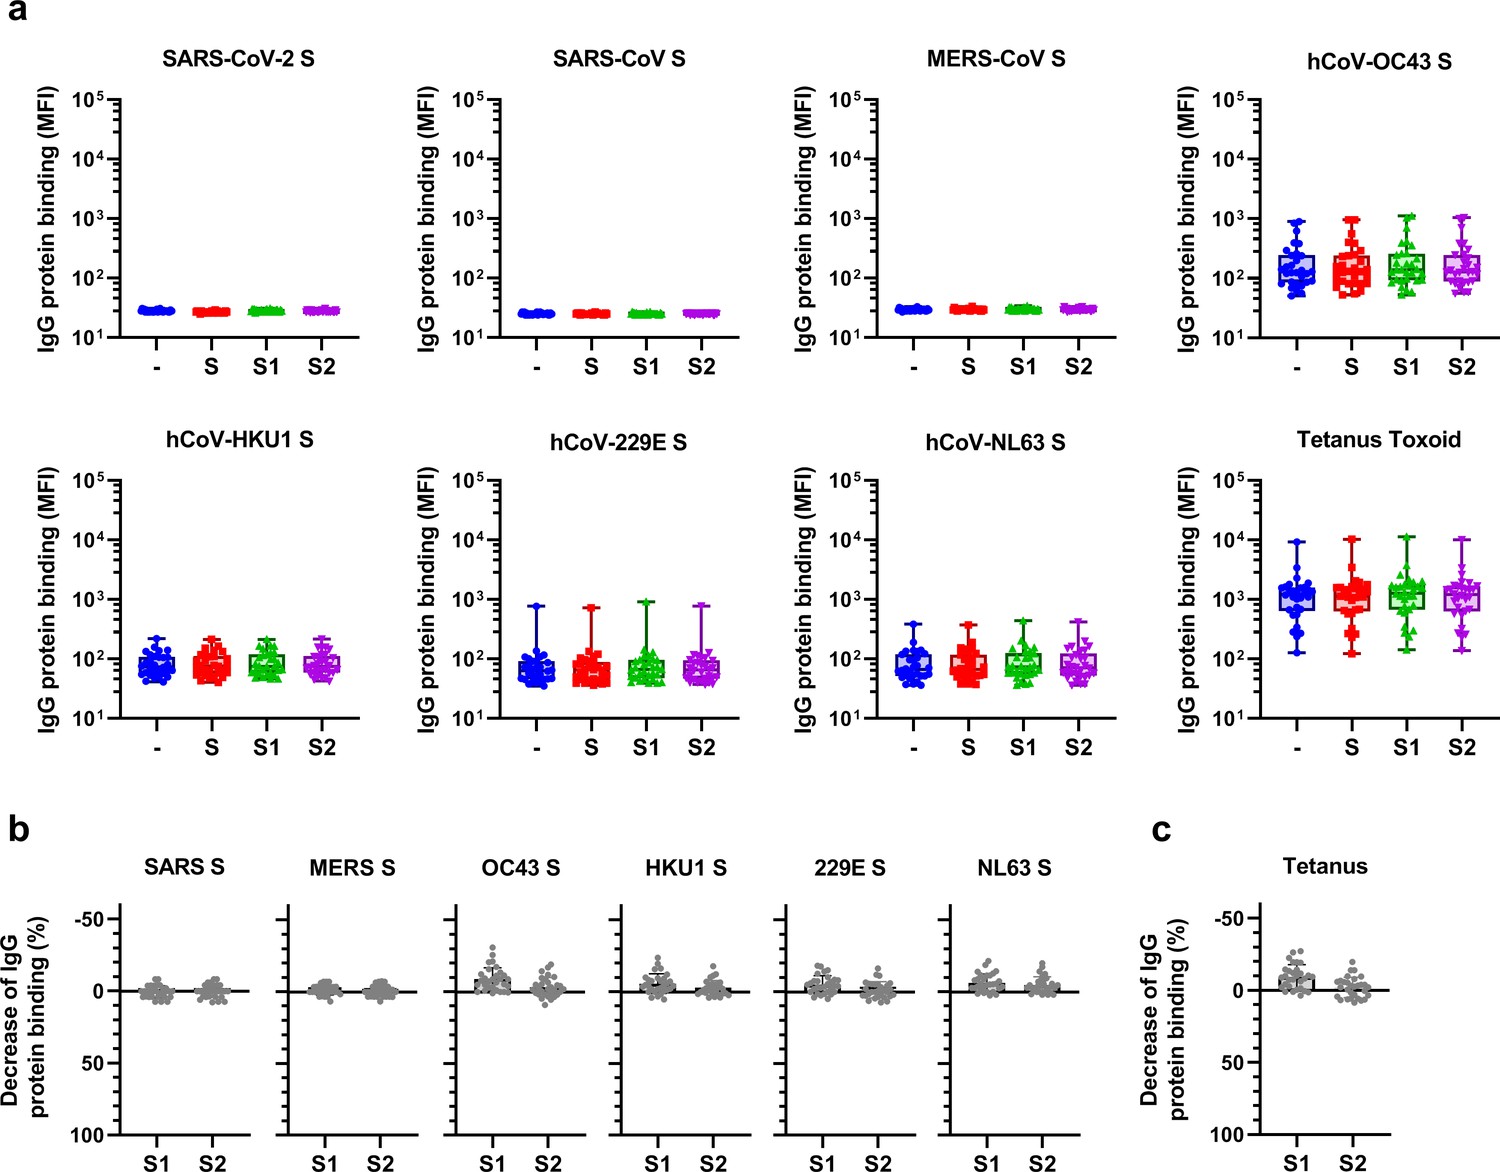
Raw data and control data from depletion assays on healthy donor sera.
(a) Median fluorescent intensity (MFI) values of IgG binding to all hCoV S proteins (top and middle rows) and control proteins (bottom row) measured with a custom Luminex assay in sera of pre-pandemic healthy donors (n = 30) after depletion with soluble recombinant SARS-CoV-2 S protein, S1 subdomain, and S2 subdomain. Box plots range the minimum and maximum values. -, undepleted sera; S, trimeric S protein-depleted sera; S1, S1 subdomain-depleted sera; S2, S2 subdomain-depleted sera. (b) Percent decrease of IgG binding to hCoV S proteins in sera of healthy donors (n = 30) after depletion with soluble recombinant SARS-CoV-2 S1 subdomain or S2 subdomain. (C) Percent decrease of IgG binding to tetanus toxoid control protein in sera of healthy donors (n = 30) after depletion with soluble recombinant SARS-CoV-2 S1 subdomain or S2 subdomain. Bars represent the mean decrease of binding antibodies as a percentage of the total binding IgG observed in undepleted sera of all healthy donors, and error bars represent the standard deviation. Dots represent the percent decrease of binding IgG found in individual sera. S, spike protein.
Figure 4 with 2 supplements
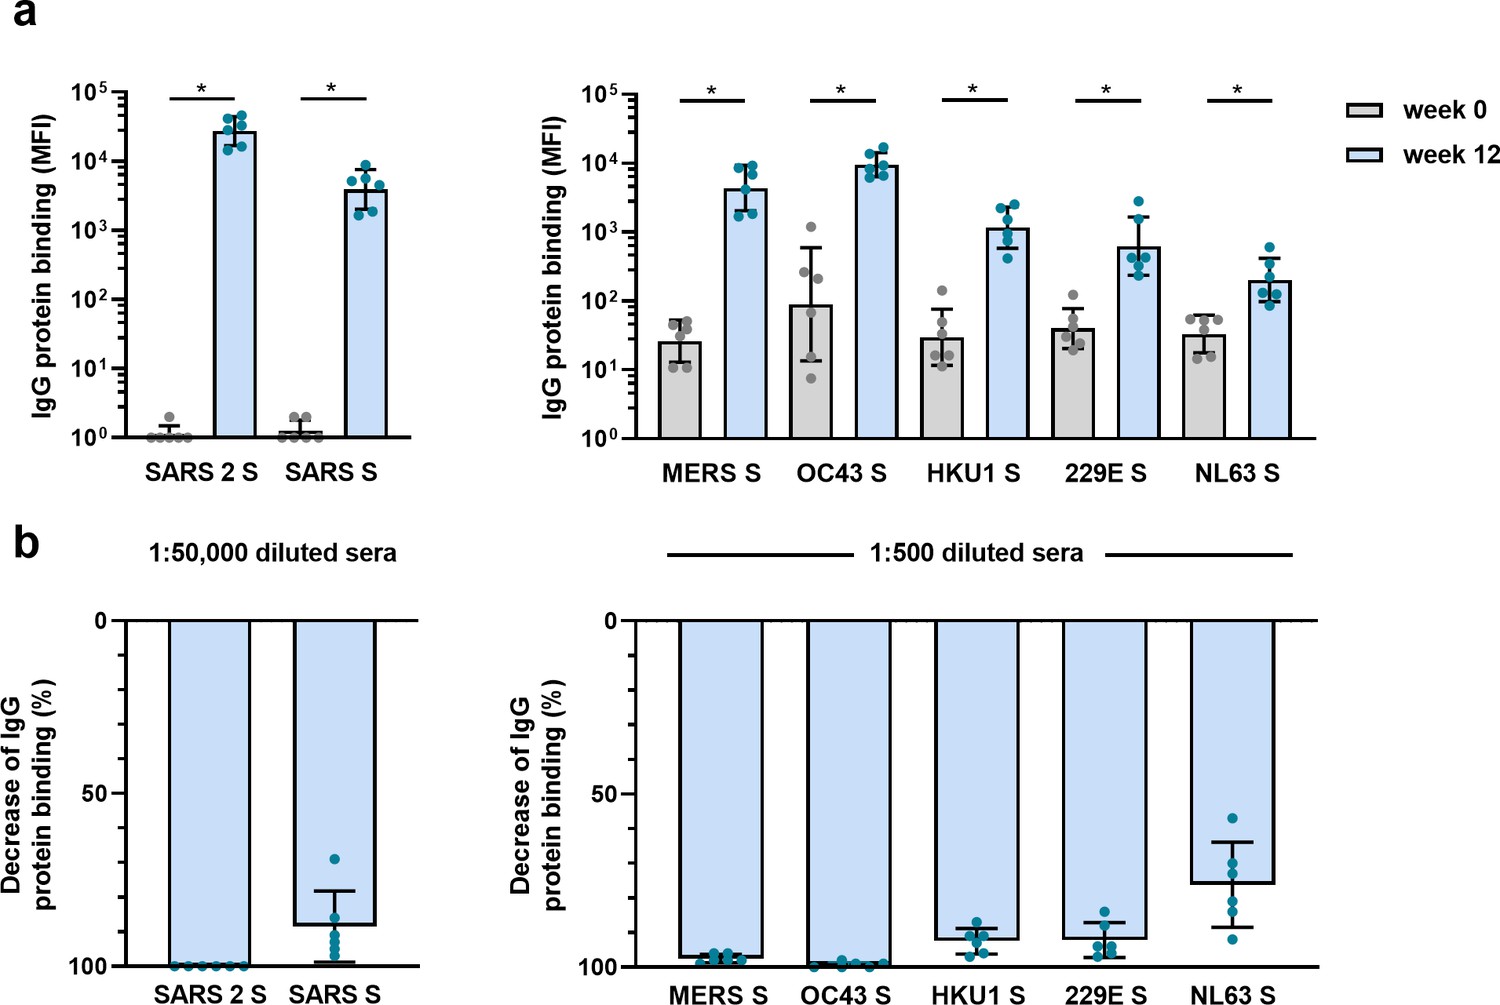
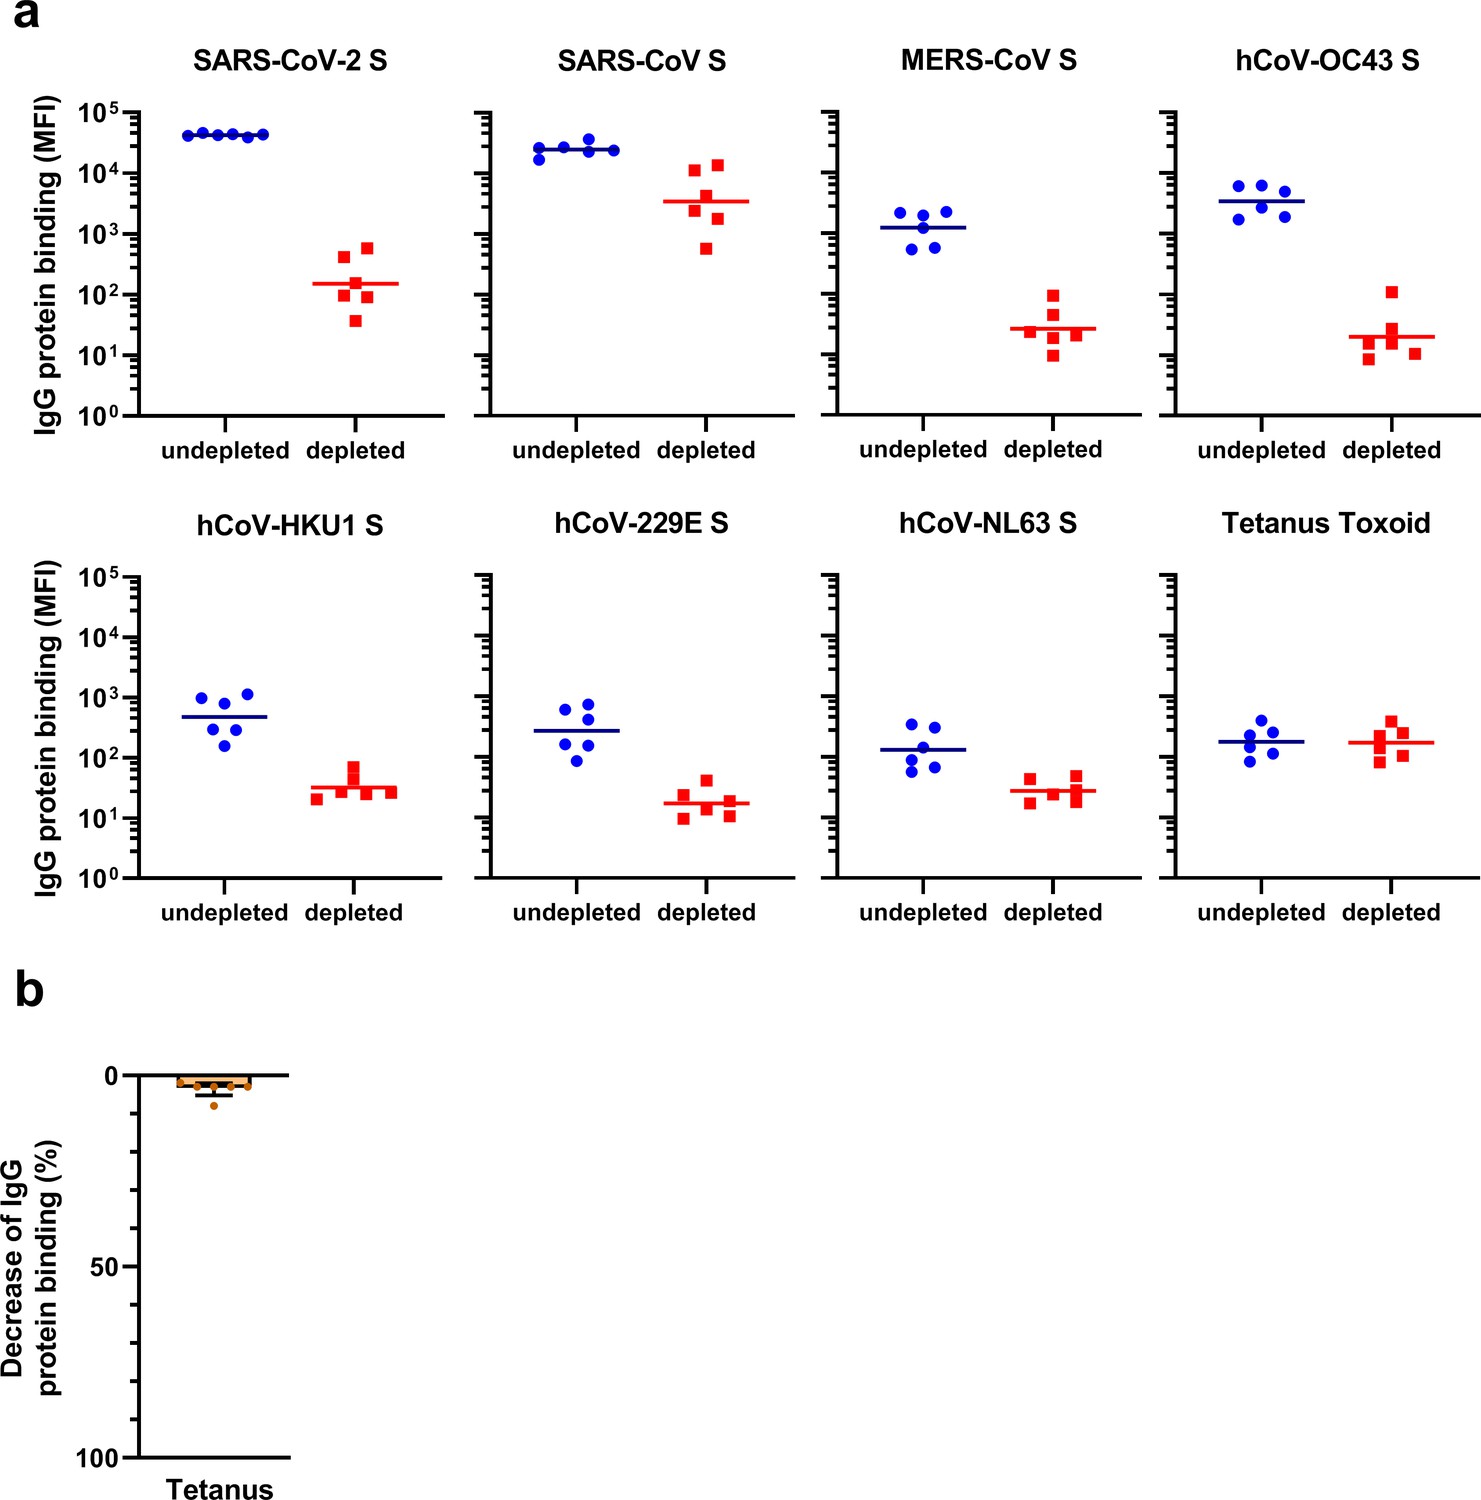
Cross-reactivity and depletion of cross-reactivity to hCoV S proteins in immunized macaques.
(a) SARS-CoV-2 S protein-specific IgG binding and cross-reactive IgG binding to SARS-CoV S protein at week 0 (pre-immunization baseline) and week 12 (after a total of three immunizations), measured with a custom Luminex assay in 1:50,000 diluted serum of six cynomolgus macaques immunized with a SARS-CoV-2 S nanoparticle vaccine (left) and cross-reactive IgG binding to all other hCoV S proteins, measured in 1:500 diluted serum in the same animals (right). Bars represent the geometric mean of the six animals, and error bars the geometric standard deviation; dots represent the individual animals, statistical comparisons used a Wilcoxon matched-pairs signed rank test. IgG binding to hCoV S and tetanus toxoid control protein at weeks 2–12 is shown in Figure 4—figure supplement 1a and b, and IgG binding to tetanus toxoid control protein at weeks 0 and 12 is shown in Figure 4—figure supplement 1c. *p<0.05. (b) Percent decrease of IgG binding to all hCoV S proteins after depletion with soluble recombinant SARS-CoV-2 S protein. Bars represent the mean decrease of binding IgG as a percentage of the total binding IgG observed in undepleted sera of the six cynomolgus macaques at week 12, and error bars represent the standard deviation. Dots represent the percent decrease of binding IgG observed in individual sera. The percent decrease of IgG binding to tetanus toxoid control protein is shown in Figure 4—figure supplement 2b, and all median fluorescent intensity (MFI) values are shown in Figure 4—figure supplement 2a. S, spike protein.
-
Figure 4—source data 1
Source data of all panels of Figure 4.
- https://cdn.elifesciences.org/articles/70330/elife-70330-fig4-data1-v2.xlsx
Figure 4—figure supplement 1
Antibodies binding to hCoV S and tetanus toxoid in immunized cynomolgus macaques over time.
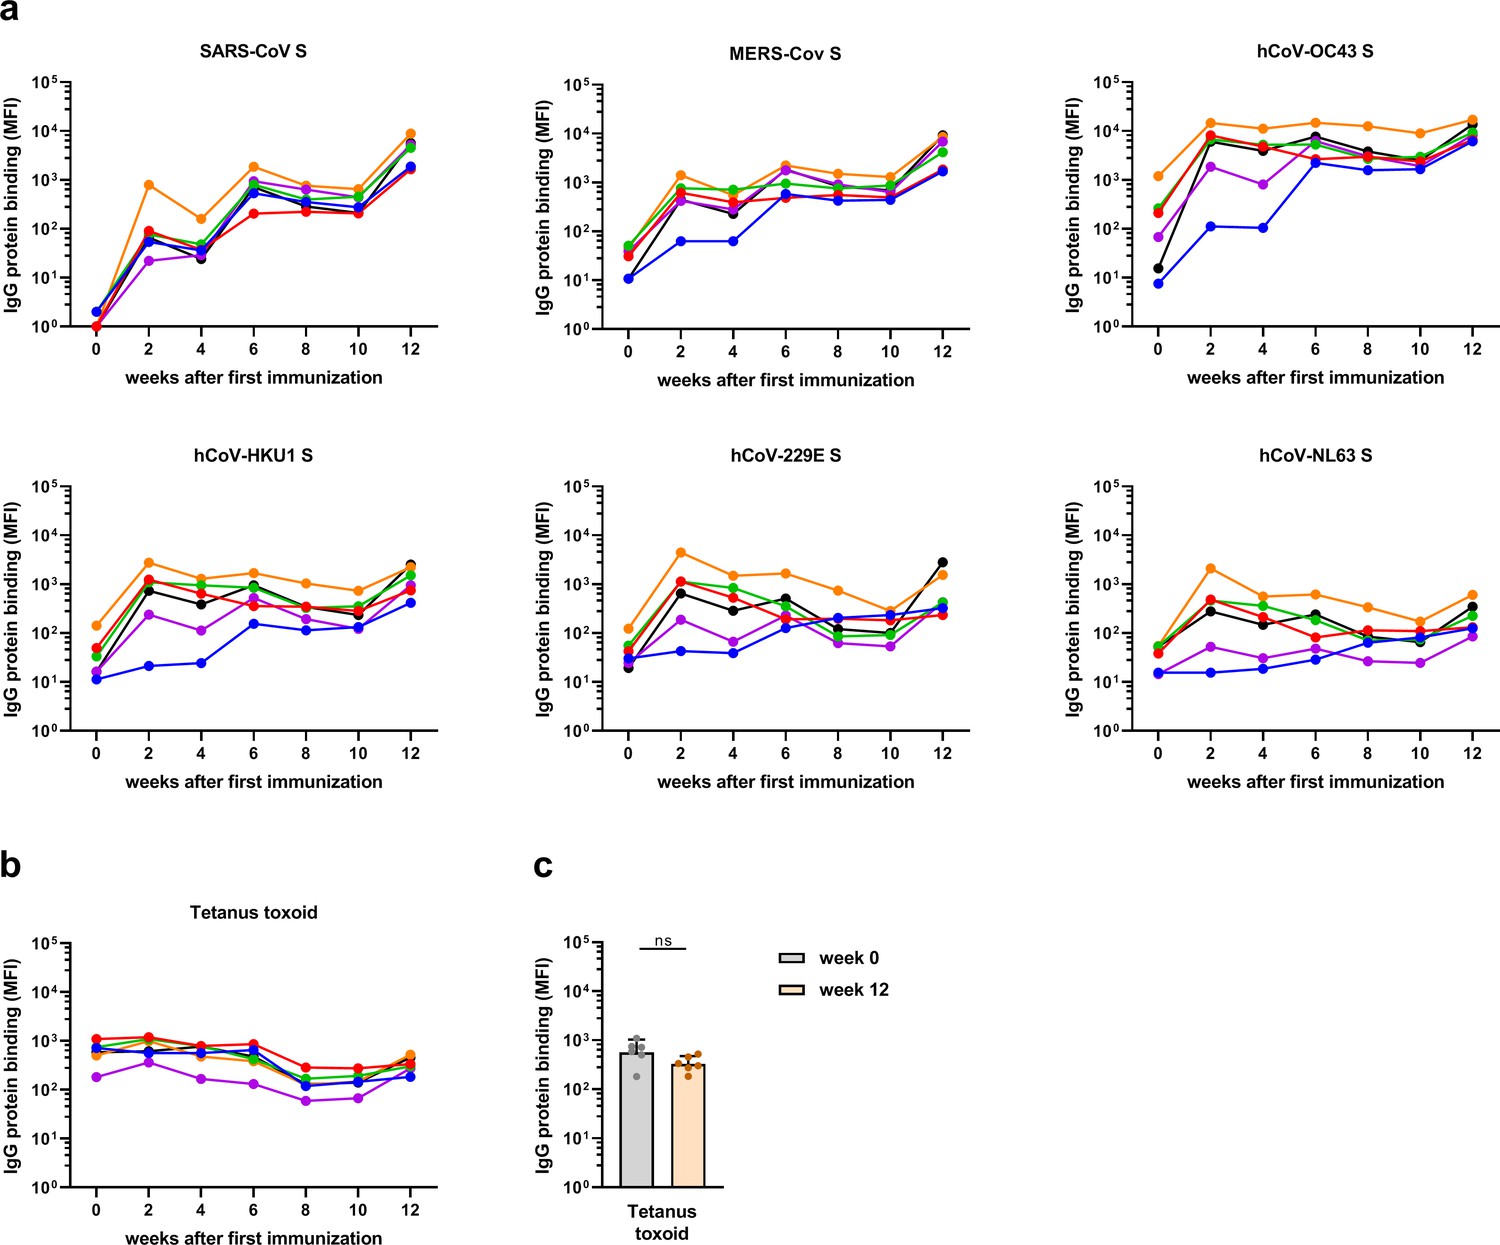
(a) IgG response over time in serum of six cynomolgus macaques immunized at weeks 0, 4, and 10 with a SARS-CoV-2 spike nanoparticle vaccine, measured at 1:50,000 serum dilution for SARS-CoV-2 and SARS-CoV S and at 1:500 serum dilution for MERS-CoV, hCoV-OC43, hCoV-HKU1, hCoV-229E, and hCoV-NL63-CoV S. (b) IgG binding to tetanus toxoid control protein, measured in 1:500 diluted serum. All median fluorescent intensity (MFI) values are background corrected by subtraction of beads and buffer only wells. (c) IgG binding to tetanus toxoid control protein at week 0 (pre-immunization baseline) and week 12 (after a total of three immunizations), presented in a bar chart for comparison with Figure 4a. ns, not significant; S, spike protein.
Figure 4—figure supplement 2
Reactivity and depletion of antibodies to hCoV S proteins and tetanus toxoid in immunized cynomolgus macaques.
(a) Median fluorescent intensity (MFI) values of IgG binding to all hCoV S proteins and tetanus toxoid control protein with and without depletion with soluble recombinant SARS-CoV-2 S protein, measured by Luminex assay in 1:50,000 diluted serum (for SARS-CoV-2 and SARS-CoV) or 1:500 diluted serum (for all other proteins) for six cynomolgus macaques immunized at weeks 0, 4, and 10 with a SARS-CoV-2 S protein nanoparticle vaccine. The line indicates the geometric mean. (b) Percent decrease of IgG binding to tetanus toxoid control protein in 1:500 diluted sera at week 12 after depletion with soluble recombinant SARS-CoV-2 S protein, presented in bar charts for comparison with Figure 4b. Bars represent the mean decrease of binding IgG as a percentage of the total binding IgG observed in undepleted sera of the six cynomolgus macaques. Dots represent the percent decrease of binding IgG in each individual animal. S, spike protein.
Figure 5 with 1 supplement

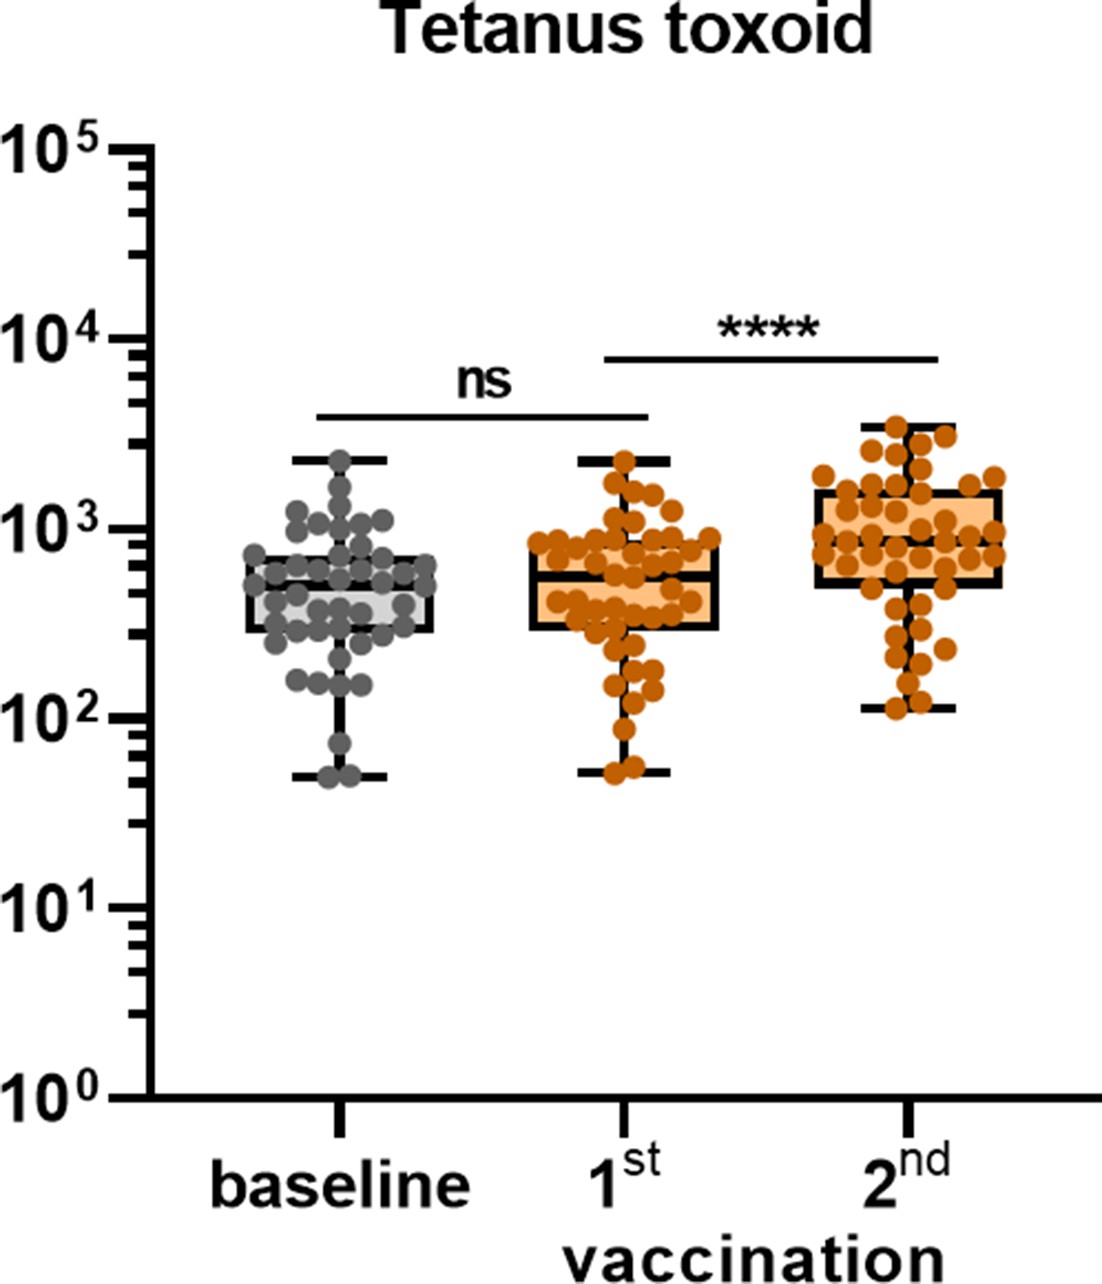
Cross-reactivity to hCoV S proteins following COVID-19 mRNA vaccination in human IgG binding to hCoVs S proteins measured with a custom Luminex assay in 1:100,000 diluted serum of 45 SARS-CoV-2-naïve individuals at baseline (gray dots), 3 weeks after their first vaccination (blue dots) and 4 weeks after their second vaccination (dark blue dots) with Pfizer-BioNTech mRNA vaccine.
IgG binding to tetanus toxoid control protein is shown in Figure 5—figure supplement 1. Friedman test with Dunn’s multiple comparisons test was used to compare medians of different time points and correct for multiple testing. Box plots range the minimum and maximum values. ns, not significant; ***p<0.001; ****p<0.0001.
-
Figure 5—source data 1
Source data of all panels of Figure 5.
- https://cdn.elifesciences.org/articles/70330/elife-70330-fig5-data1-v2.xlsx
Figure 5—figure supplement 1
Antibodies binding to tetanus toxoid protein following Pfizer-BioNTech mRNA vaccination in humans.
IgG binding to tetanus toxoid control protein measured with a custom Luminex assay in 1:100,000 diluted sera of vaccinated SARS-CoV-2-naïve individuals at baseline, at 3 weeks after their first vaccination and 4 weeks after their second vaccination. Friedman test with Dunn’s multiple comparisons was used to compare medians of different time points and correct for multiple testing. Box plots range the minimum and maximum values. ns, not significant; ****p<0.0001.
Tables
Key resources table
| Reagent type (species) or resource | Designation | Source or reference | Identifiers | Additional information |
|---|---|---|---|---|
| Gene (viral structural protein) | SARS-CoV-2 spike | GenBank | ID: MN908947.3 | N/A |
| Gene (viral structural protein) | SARS-CoV spike | GenBank | ID: ABD72984.1 | N/A |
| Gene (viral structural protein) | MERS-CoV spike | GenBank | ID: AHI48550.1 | N/A |
| Gene (viral structural protein) | hCoV-OC43 spike | GenBank | ID: AAT84362.1 | N/A |
| Gene (viral structural protein) | hCoV-HKU1 spike | GenBank | ID: Q0ZME7 | N/A |
| Gene (viral structural protein) | hCoV-229E spike | GenBank | ID: NP_073551.1 | N/A |
| Gene (viral structural protein) | hCoV-NL63 spike | GenBank | ID: AKT07952.1 | N/A |
| Cell line (human) | FreeStyle HEK293F cells | Thermo Fisher | Cat#: R79007; RRID:CVCL_D603 | N/A |
| Cell line (human) | HEK293T/ACE2 cells | Schmidt et al | Ref: 51 | N/A |
| Biological sample (human) | Human sera, post-infection | Brouwer et al., 2020 | Ref: 52 | N/A |
| Biological sample (human) | Human sera, post-vaccination | Appelman et al. | Ref: 53 | N/A |
| Biological sample (cynomolgus macaque) | Cynomolgus macaque sera | Brouwer et al., 2021 | Ref: 32 | N/A |
| Antibody | Goat-anti-human IgG-PE (goat polyclonal) | Southern Biotech | Cat#: 2040-09;RRID: AB_2795648 | ‘Used at 1.3 µg/mL’ |
| Peptide, recombinant protein | Prefusion-stabilized S protein ectodomain of SARS-CoV-2 | Brouwer et al., 2020 | Ref: 52 | N/A |
| Peptide, recombinant protein | Prefusion-stabilized S protein ectodomain of SARS-CoV | . | Ref: 52 | N/A |
| Peptide, recombinant protein | SARS-CoV-2 nucleocapsid | Sanquin Research | Ref: 54 | Provided by Gestur Vidarsson and Federica Linty of Sanquin Research, Amsterdam, the Netherlands |
| Peptide, recombinant protein | tetanus toxoid | Creative Biolabs | Cat#: Vcar-Lsx003 | N/A |
| Peptide, recombinant protein | SARS-CoV-2 S1 subdomain | ABclonal Biotechnology | Cat#: RP01262 | N/A |
| Peptide, recombinant protein | SARS-CoV2 S2 subdomain | ABclonal Biotechnology | Cat#: RP01267 | N/A |
| Chemical compound, drug | 1-Ethyl-3-(3-dimethylaminopropyl) carbodiimide | Thermo Fisher Scientific | Cat#: A35391 | N/A |
| Chemical compound, drug | Sulfo-N-hydroxysulfosuccinimide | Thermo Fisher Scientific | Cat#: A39269 | N/A |
| Chemical compound, drug | Polyethylenimine hydrochloride (PEI) MAX | Polysciences | Cat#: 24765-1 | N/A |
| Software, algorithm | GraphPad Prism 8.3.0 | GraphPad | N/A | N/A |
| Software, algorithm | MATLAB 9.6 (R2019a) | MATLAB | N/A | N/A |
| Other | Luminex Magplex beads | Luminex | Cat#: MC10043-01 | N/A |
| Other | MAGPIX | Luminex | Cat#: MAGPIX-XPON4.1-RUO | N/A |
| Other | NiNTA agarose beads | QIAGEN | Cat#: R90115 | N/A |
| Other | Superose6 increase 10/300 GL column | Cytiva | Cat#: 29091596 | N/A |
| Other | 4–12% NuPAGE Bis-Tris | Thermo Fisher | Cat#: NP0321BOX | N/A |
| Other | Novex colloidal blue staining kit | Invitrogen | Cat#: LC6025 | N/A |
| Other | HMW-Native Protein Mixture | GE Healthcare | Cat#: 17044501 | N/A |
| Other | Nano-Glo Luciferase Assay System | Promega | Cat#: N1130 | N/A |
| Other | GloMax | Turner BioSystems | Cat#: 9101-002 | N/A |
Additional files
-
Supplementary file 1
Sociodemographics, clinical characteristics, and severity scoring for COVID-19 patients.
- https://cdn.elifesciences.org/articles/70330/elife-70330-supp1-v2.docx
-
Supplementary file 2
Sequence identity matrices for the ectodomains of all hCoV S proteins.
Sequence identity matrices were composed of all coronavirus spike proteins in this study. All sequences comprise only the truncated ectodomain of each spike as was used to generate the recombinant proteins. S1, S2, and RBD were defined as noted in the corresponding GenBank sequences (see Materials and methods). Multiple sequence alignments were performed and sequence identities calculated using Clustal Omega 1.2.4.
- https://cdn.elifesciences.org/articles/70330/elife-70330-supp2-v2.docx
-
Supplementary file 3
Overview of statistical tests, exact p-values, and 95% confidence intervals.
- https://cdn.elifesciences.org/articles/70330/elife-70330-supp3-v2.xlsx
-
Transparent reporting form
- https://cdn.elifesciences.org/articles/70330/elife-70330-transrepform1-v2.pdf
-
Source data 1
Source data of all panels of all figure supplements.
- https://cdn.elifesciences.org/articles/70330/elife-70330-supp4-v2.xlsx
Download links
A two-part list of links to download the article, or parts of the article, in various formats.
Downloads (link to download the article as PDF)
Open citations (links to open the citations from this article in various online reference manager services)
Cite this article (links to download the citations from this article in formats compatible with various reference manager tools)
Cross-reactive antibodies after SARS-CoV-2 infection and vaccination
eLife 10:e70330.
https://doi.org/10.7554/eLife.70330


