GWAS and ExWAS of blood mitochondrial DNA copy number identifies 71 loci and highlights a potential causal role in dementia
- Department of Biochemistry and Biomedical Sciences, McMaster University, Canada
- Department of Pathology and Molecular Medicine, McMaster University, Canada
- Population Health Research Institute, David Braley Cardiac, Vascular and Stroke Research Institute, Hamilton Health Sciences, Canada
- Thrombosis and Atherosclerosis Research Institute, Canada
- Centre for Data Science and Digital Health, Hamilton Health Sciences, Canada
- Department of Health Research Methods, Evidence, and Impact, McMaster University, Canada
- Department of Medicine, McMaster University, Michael G. DeGroote School of Medicine, Canada
- National University of Ireland, Galway, Ireland
- Department of Medicine, University of Cape Town & Groote Schuur Hospital, South Africa
- Hatter Institute for Cardiovascular Diseases Research in Africa (HICRA) & Cape Heart Institute (CHI), Department of Medicine, University of Cape Town, South Africa
Figures
Figure 1 with 6 supplements
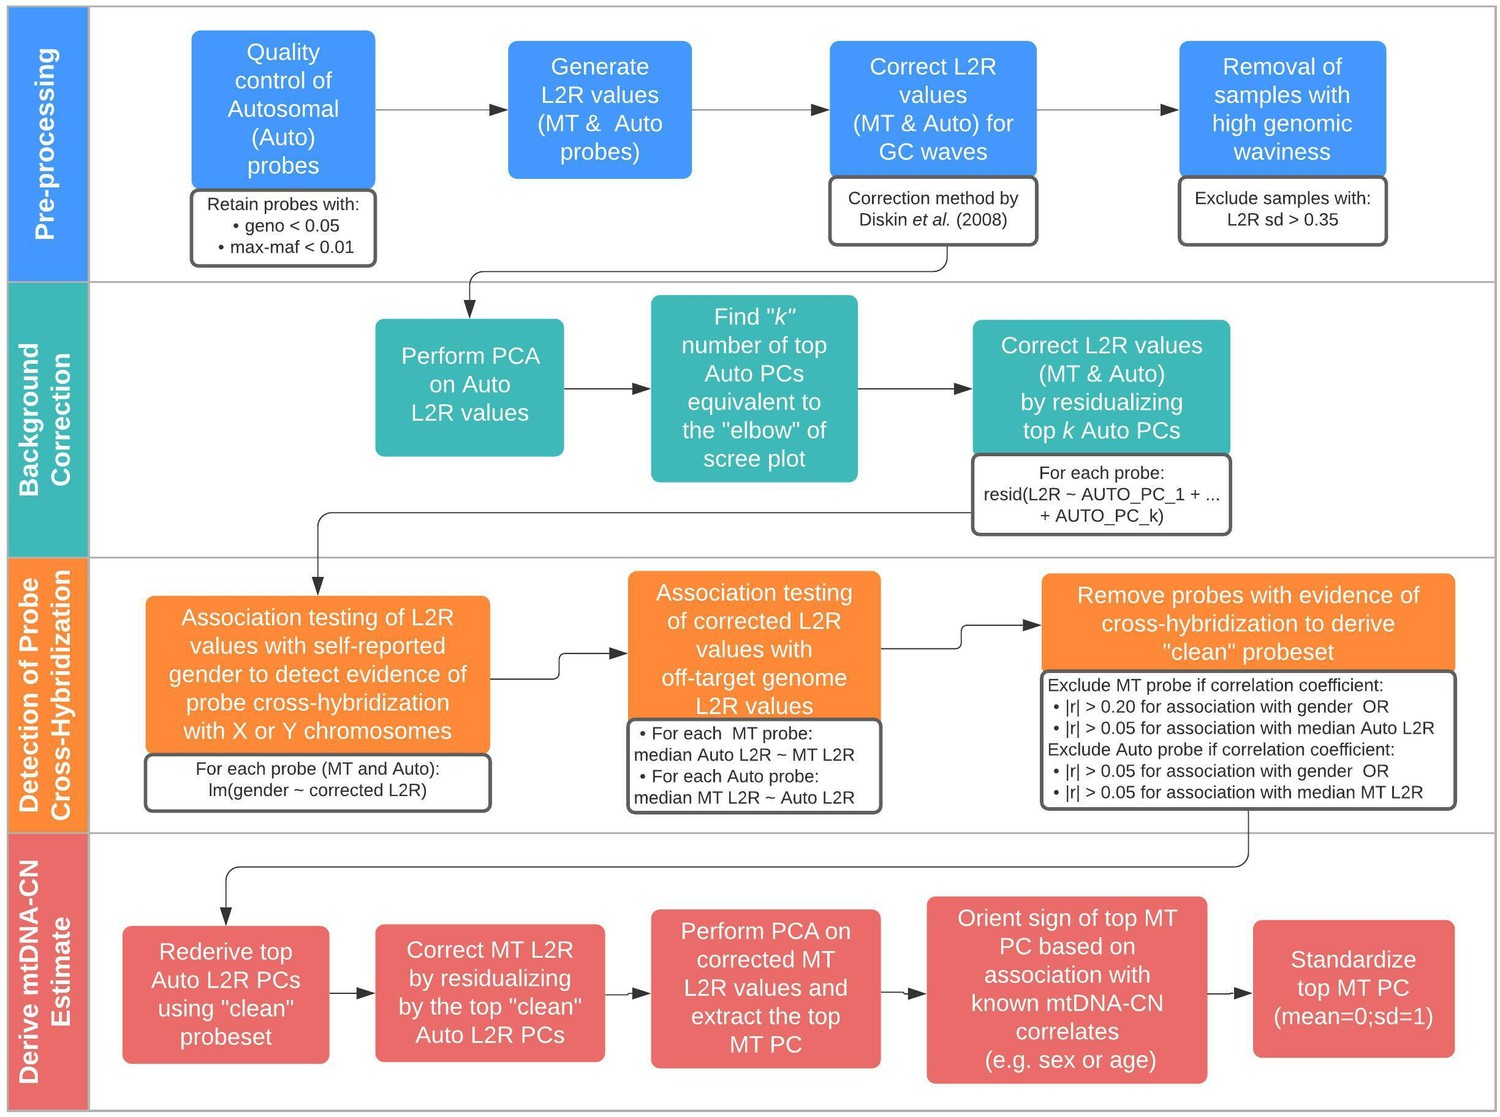
Schematic summary of the automatic mitochondrial copy (AutoMitoC) pipeline.
The AutoMitoC pipeline is comprised of four major steps: (i) preprocessing, (ii) background correction, (iii) detection of probe cross-hybridization, and (iv) final derivation of mitochondrial DNA copy number (mtDNA-CN) estimates. First, preprocessing is simplified by restricting analysis of autosomal variants to those that have low minor allele frequency ( <0.01) and low genotype missingness ( <0.05). For probes passing quality control, MT and autosomal log2ratio (L2R) values undergo an initial correction for guanine cytosine (GC) waves using the method by Diskin et al., 2008. Samples exhibiting high genomic waviness post GC-correction (L2R SD >0.35) are removed. Second, background correction consists of performing principal component analysis of the autosomal probe L2R values and finding the top k principal components (PCs) that correspond to the ‘elbow’ of the scree plot. In our case, ~70% variance in autosomal L2R values was explained by the top k PCs in both UKbiobank and INTERSTROKE datasets. GC-corrected MT and L2R values are then further adjusted for the top autosomal PCs (representing technical background noise) by taking the residuals of the association between the L2R values versus the k autosomal PCs. Third, we derive a ‘clean’ set of autosomal and MT probes without signs of off-target probe cross-hybridization by empirically testing the GC-corrected and background-corrected L2R values for association with either the sample medians of off-target genome L2R values or self-reported gender (to capture off-target hybridization to sex chromosomes). Fourth, using the ‘clean’ probeset, we repeat the autosomal background correction, extract the top MT PC as a crude measure of mtDNA-CN, change the sign of the MT PC according to association of the MT PC with known predictors of mtDNA-CN that are commonly reported (sex or age), and last, standardize the MT PC values as the final AutoMitoC estimate.
Figure 1—figure supplement 1

Intuition behind differentiation of genotypes and determination of mitochondrial DNA copy number (mtDNA-CN).
Contrast in the intensities of mitochondrial probes ‘X’ and ‘Y’ discriminate genotypes (left). Intracluster variation in signal intensities may reflect differences in mtDNA-CN (right). (Adapted from Lane, 2014).
Figure 1—figure supplement 2

Overview of the MitoPipeline (Source: http://genvisis.org/MitoPipeline/) (Lane, 2014).
Figure 1—figure supplement 3
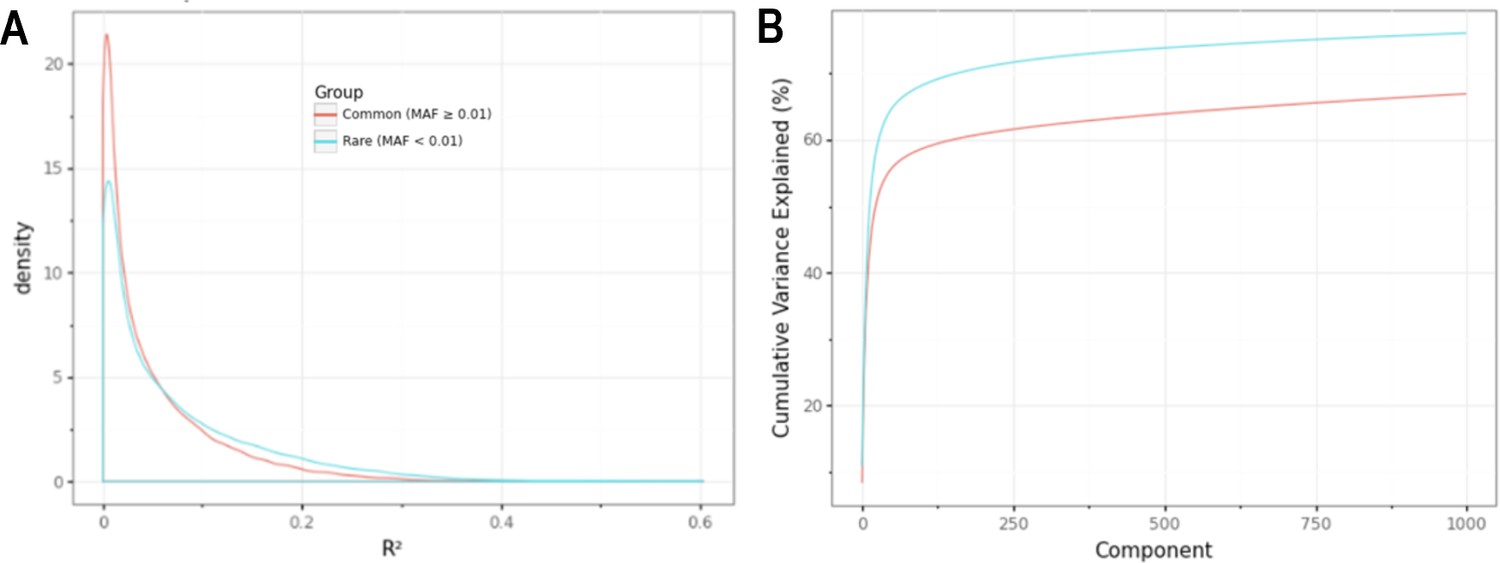
Minor allele frequency (MAF)-stratified analyses demonstrating utility of rare vs common autosomal variants for signal normalization.
(A) Density plot illustrating the correlation (R2) between autosomal probe log2ratio (L2R) values and median MT L2R stratified by common (MAF >0.01) and rare (MAF <0.01) variant status. (B) Cumulative variance explained by inclusion of top eigenvectors for sets of common (M = 86,677) and rare (M = 79,611) autosomal probe sets.
Figure 1—figure supplement 4

Distribution of log10 transformed coefficients of determination (r2) from the association between autosomal probe intensities and median mitochondrial (MT) signal with (blue) or without (red) correction for background noise (i.e. 120 autosomal principal components [PCs]).
The dashed vertical line represents the threshold corresponding to ‘moderate’ correlation (|r| > 0.05 or r2 >0.0025), which is used to remove outlying probes that are associated with MT signal. Without correction for top PCs, most autosomal probes exhibit some correlation with MT signal.
Figure 1—figure supplement 5

Validation of automatic mitochondrial copy in an ethnically diverse cohort with qPCR measurements.
Both qPCR and array-based mitochondrial DNA copy number estimates are presented as standardized units (mean = 0; SD = 1). The sample consisted of 2431 Europeans, 1704 Latin Americans, 542 Africans, 471 South East Asians, 186 South Asians, and 360 participants of other ancestry. Correlations between array and qPCR estimates were comparable for European (r = 0.60; p=2.7 × 10–238), Latin American (r = 0.70; p=3.9 × 10–251), African (R = 0.66; p=1.8 × 10–68), South East Asian (r = 0.59; p=6.2 × 10–46), South Asian (r = 0.53; p=4.2 × 10⁻¹⁵), and other (r = 0.72; p=5.4 × 10–59) ethnic groups. The blue line indicates the linear trendline and the surrounding shaded region indicates the 95% CI for the trendline.
Figure 1—figure supplement 6

Bland Altman plots illustrating the extent of agreement between array and qPCR measurements.
The black solid line indicates perfect agreement. The dashed blue line indicates the mean difference (or bias) between estimates. The horizontal red line corresponds to the 95% upper and lower limits of agreement (U/L LOA) for the observed data. The dashed black lines indicate the 95% U/L LOA that is expected under the null for two unrelated variables.
Figure 2
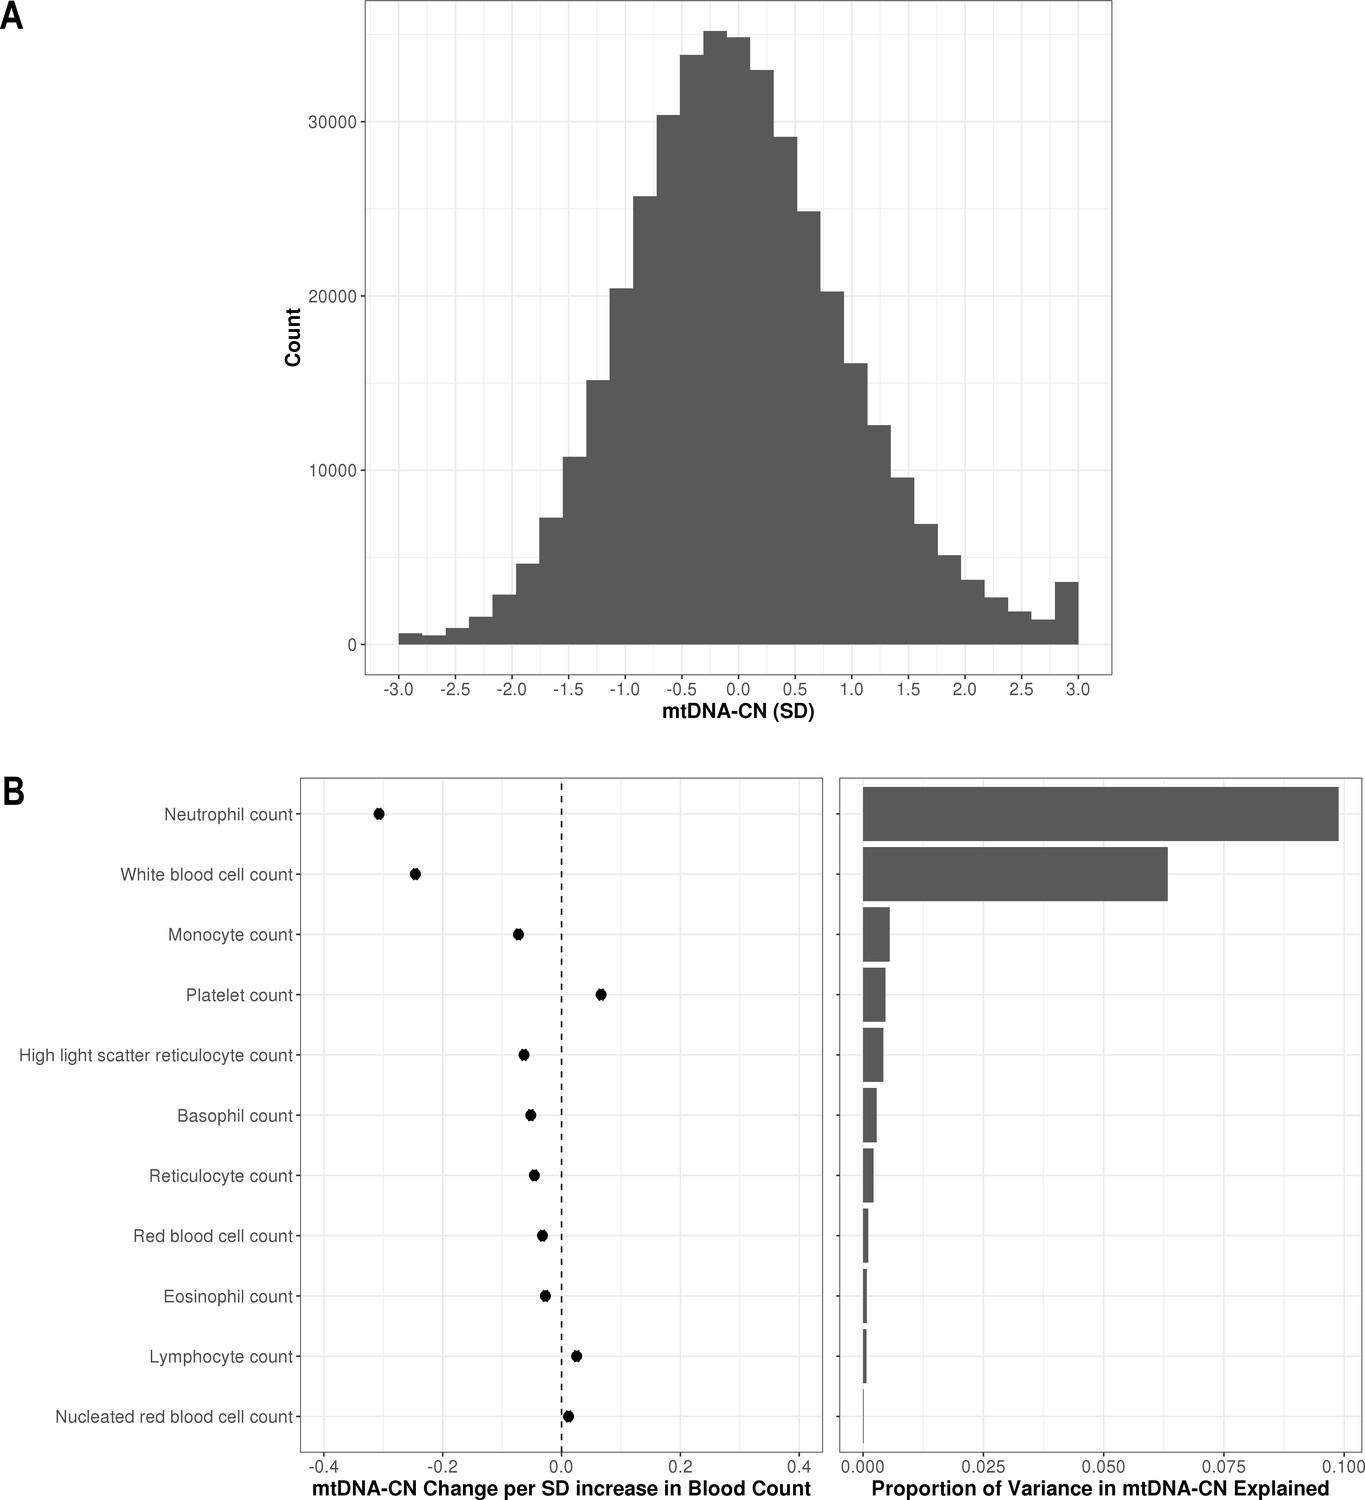
Distribution of automatic mitochondrial copy (AutoMitoC) estimates and the influence of blood cell counts.
(A) Histogram illustrating AutoMitoC mitochondrial DNA copy number (mtDNA-CN) estimates in 395,781 UKBiobank participants expressed per SD change in mtDNA-CN. Associations between blood cell counts with mtDNA-CN levels as conveyed by forest plots illustrating effect estimates (left) and a bar plot showing the proportion of variance in mtDNA-CN explained (right). Models were adjusted for age, age2, sex array type, 20 genetic principal components, and ethnicity. Both blood cell counts and mtDNA-CN levels were standardized (mean = 0; SD = 1).
-
Figure 2—source data 1
Table showing the association of blood cell counts and AutoMitoC mtDNA-CN estimates in the UKBiobank.
Effect estimates (betas, 95% CI, p-values) are expressed in terms of change in mtDNA-CN per 1 SD increase in blood counts. The variance explained (r2) by blood cell counts is also provided.
- https://cdn.elifesciences.org/articles/70382/elife-70382-fig2-data1-v2.xlsx
Figure 3 with 3 supplements
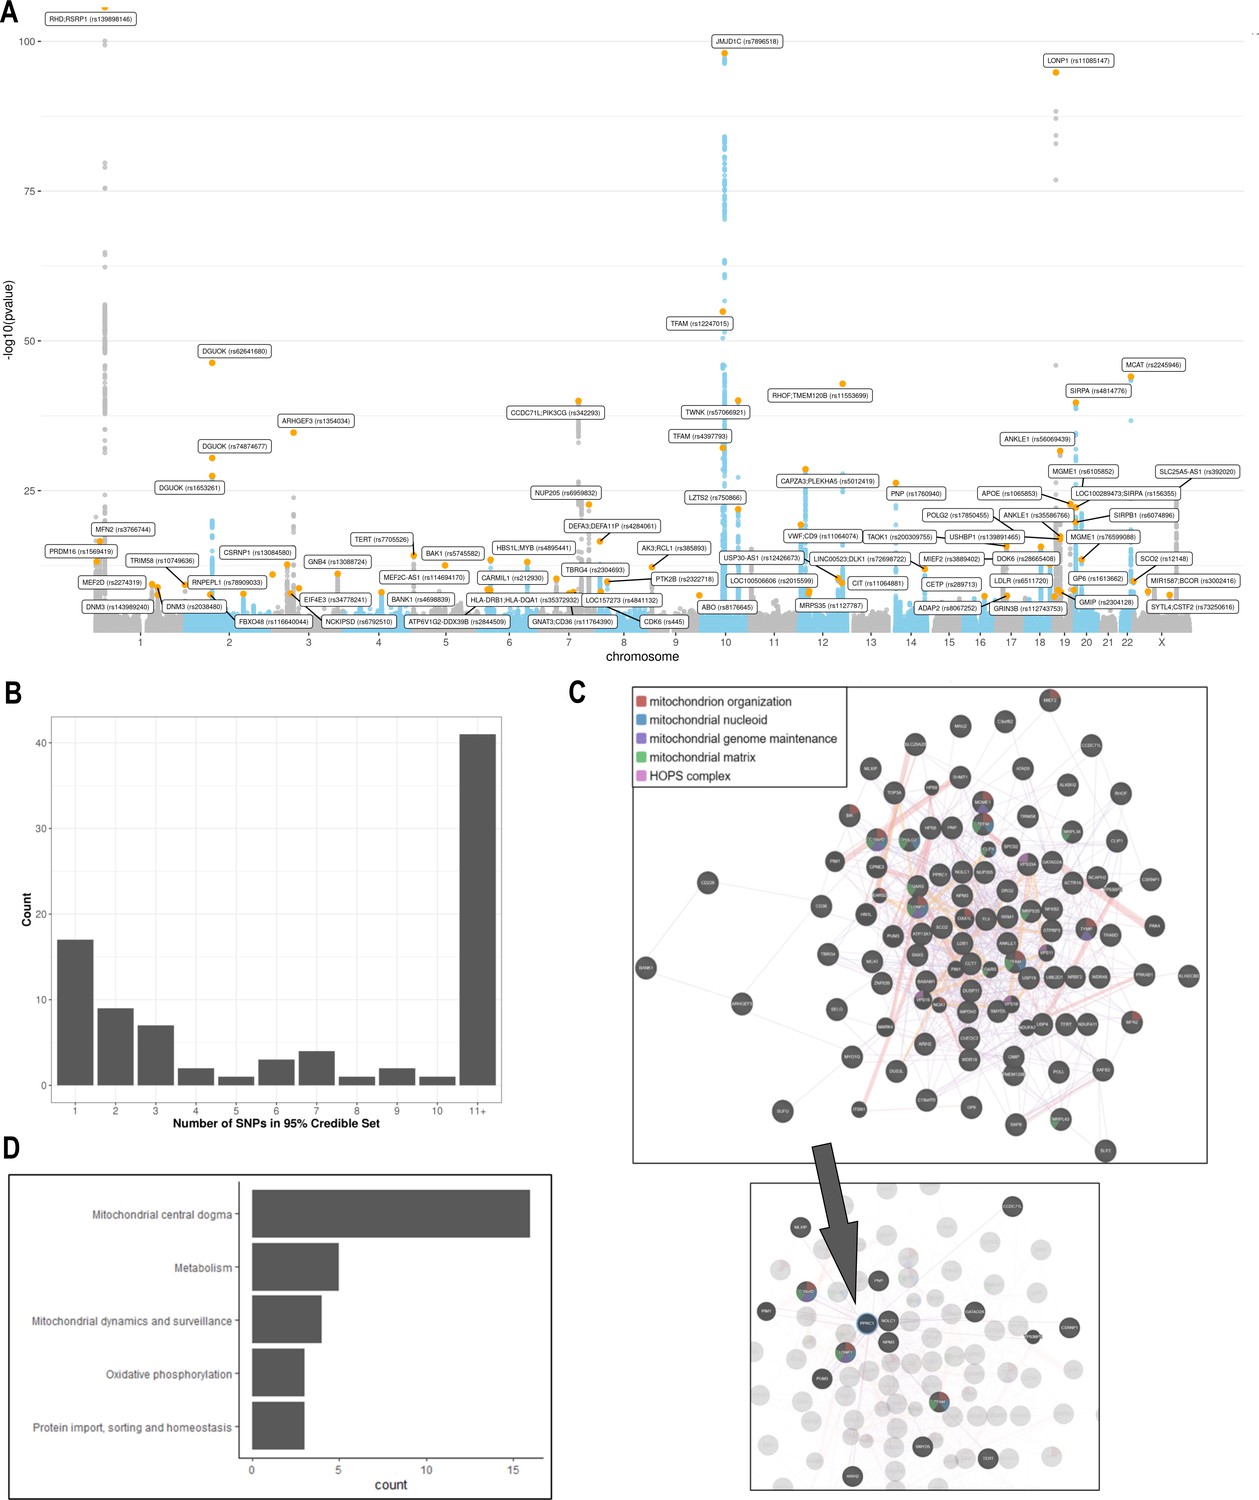
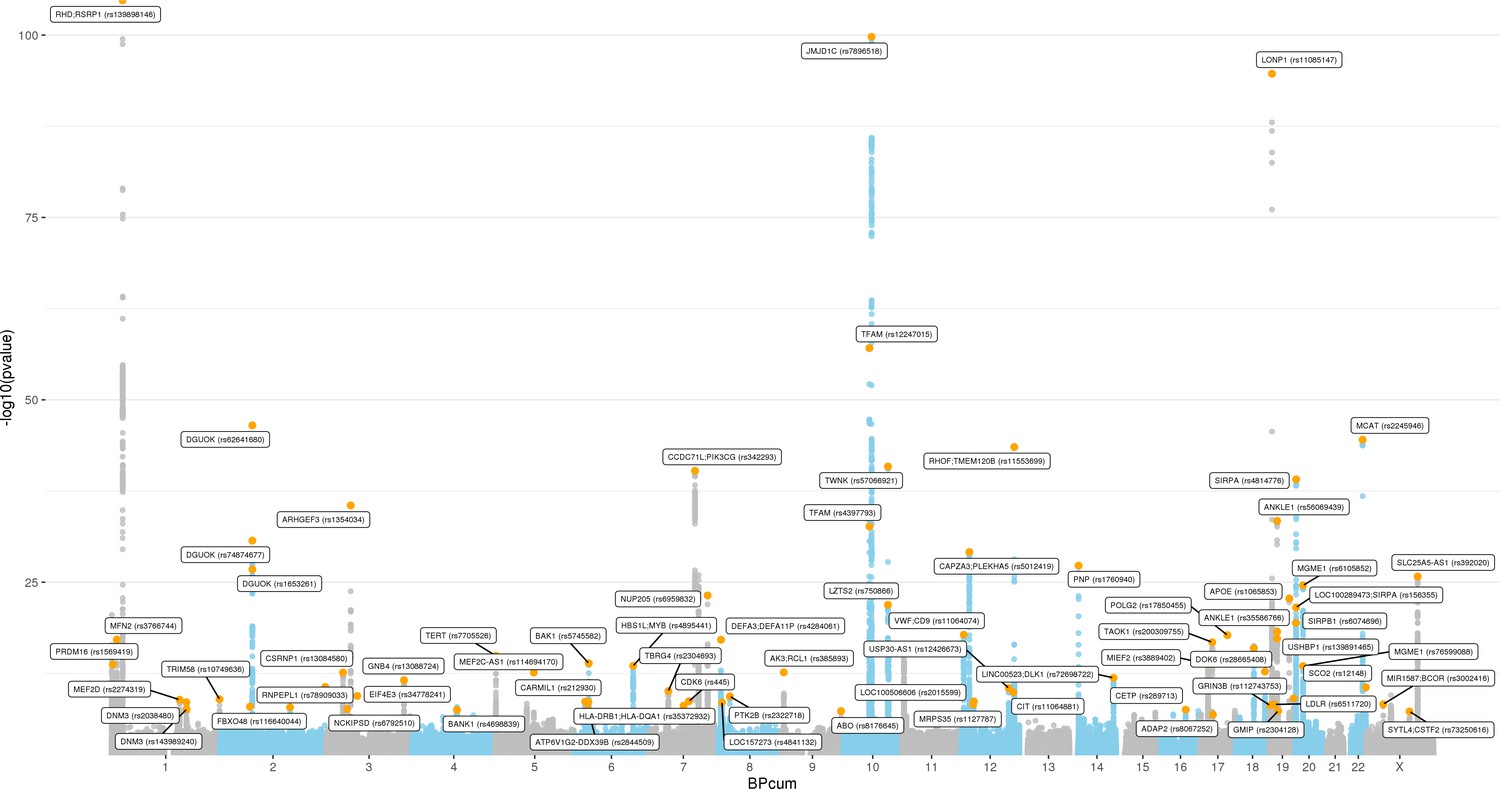
Analyses of common genetic loci associated with mitochondrial DNA copy number (mtDNA-CN).
(A) Manhattan plot illustrating common genetic variant associations with mtDNA-CN. (B) Size distribution of 95% credible sets defined for 80 independent genetic signals. (C) GENE-MANIA-mania protein network interaction exploration showing all DEPICT and gene-mania prioritized genes (top) with functions color coded and a zoom-in highlighting interactors of the key mitochondrial (MT) regulator gene, PPRC1 (bottom). (D) ‘MitoPathway’ counts corresponding to 27 prioritized MitoCarta3 genes encoding proteins with known MT localization.
-
Figure 3—source data 1
Locus zoom plots for 72 loci and 82 conditionally independent genetic signals.
Variants with the highest fine-mapping posterior probability are labeled by their genomic coordinates (GRCh37). Pairwise correlation between the lead variant and proximal variants were color-coded based on the 1000 Genomes Europeans reference panel.
- https://cdn.elifesciences.org/articles/70382/elife-70382-fig3-data1-v2.zip
Figure 3—figure supplement 1

Minor allele frequency (MAF) and ethnicity-stratified genome-wide association study quantile-quantile plots.
Variants are stratified per MAF quartile.
Figure 3—figure supplement 2
Manhattan plot for transethnic genome-wide association study meta-analysis (N = 395,781).
Figure 3—figure supplement 3

Correlation between conditionally independent mitochondrial DNA copy number loci effect estimates derived from European genome-wide association study (GWAS) meta-analyses (x-axes) vs effect estimates from non-European GWAS (y-axes).
Comparisons for African (A) and South Asian (B) GWAS analyses are presented. Of the total 80 conditionally independent signals identified using the European GWAS meta-analysis, 73 and 75 variants were available for comparison in African and South Asian GWAS, respectively.
Figure 4 with 1 supplement
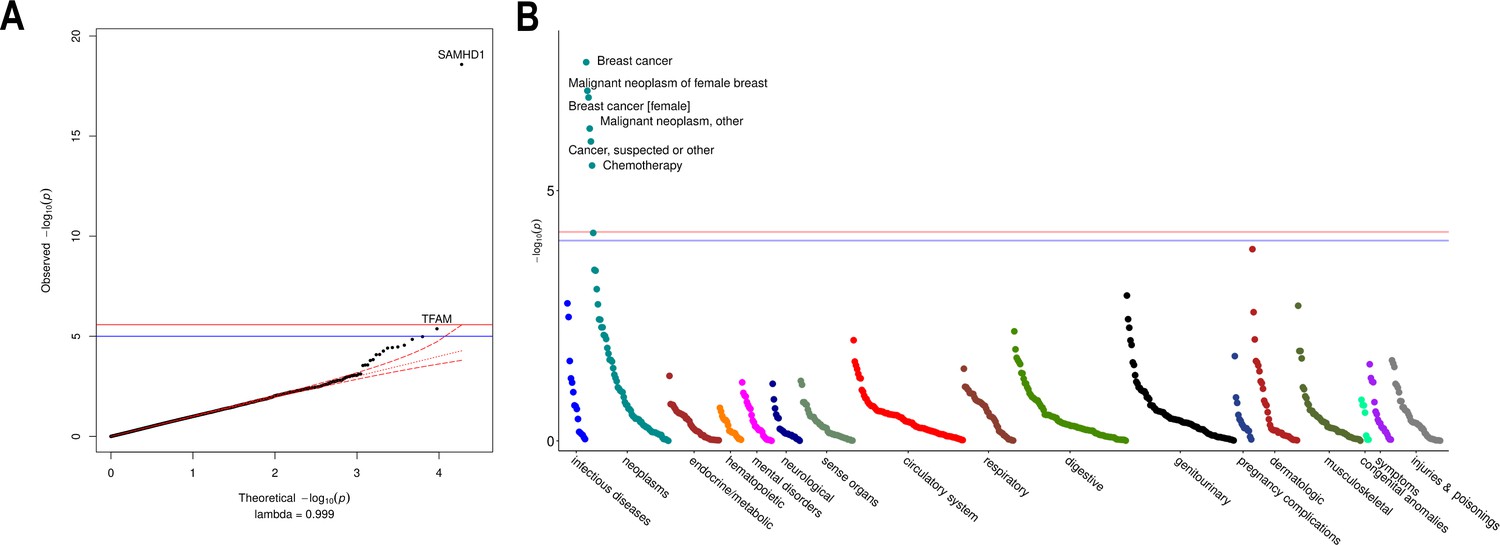
Rare variant gene burden association testing with mitochondrial DNA copy number and disease risk.
(A) QQ plot illustrating expected vs observed -log10 p-values for exome-wide burden of rare (MAF <0.001) and nonsynymous mutations. (B) Manhattan plot showing phenome-wide significant associations between SAMHD1 carrier status and cancer-related phenotypes.
-
Figure 4—source data 1
Summary statistics for exome-wide association testing of rare protein-altering variants with mtDNA-CN.
- https://cdn.elifesciences.org/articles/70382/elife-70382-fig4-data1-v2.xlsx
-
Figure 4—source data 2
Summary statistics for phenome-wide association testing of SAMHD1 carrier status.
- https://cdn.elifesciences.org/articles/70382/elife-70382-fig4-data2-v2.xlsx
Figure 4—figure supplement 1

Effect of rare mutation carrier status for SAMHD1 and TFAM genes on mitochondrial DNA copy number (mtDNA-CN) levels.
Violin plots showing the distribution of mtDNA-CN for carriers and noncarriers of (A) SAMHD1 and (B) TFAM rare nonsynonymous and deleterious (MCAP >0.025) variants.
Figure 5
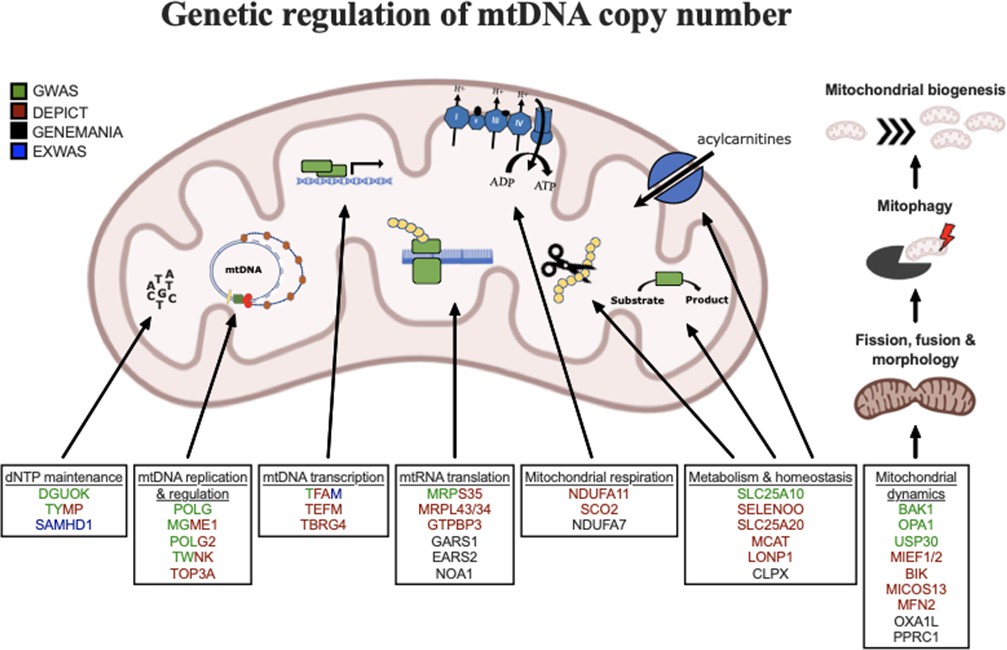
Graphical summary of mitochondrial genes and pathways implicated by genetic analyses.
Color coding indicates through which set(s) of analyses genes were identified. The image was generated using BioRender (https://biorender.com/).
Figure 6

Association of genetically lower mitochondrial DNA copy number with mitochondrial (MT) disease phenotypes.
Coefficient plots for Mendelian randomization analyses of MT disease traits. In the absence of heterogeneity (Egger intercept p>0.05; MR-PRESSO global heterogeneity p>0.05), the inverse variance weighted result was reported. In the presence of balanced pleiotropy (MR-PRESSO global heterogeneity p<0.05), the weighted median result was reported. No set of analyses had evidence for directional pleiotropy (Egger intercept p<0.05).
-
Figure 6—source data 1
Mendelian randomization analyses of mtDNA-CN versus mitochondrial disease phenotypes.
- https://cdn.elifesciences.org/articles/70382/elife-70382-fig6-data1-v2.xlsx
Additional files
-
Supplementary file 1
Characteristics of autosomal probes exhibiting strong cross-genome correlation.
Table 1. Characteristics of top 10 autosomal probes whose background-corrected L2R values remain correlated with median MT L2R. Table 2. Characteristics of top 10 autosomal probes whose background-corrected L2R values remain associated with gender.
- https://cdn.elifesciences.org/articles/70382/elife-70382-supp1-v2.xlsx
-
Supplementary file 2
Supplementary results for primary and secondary GWAS-based analyses.
- https://cdn.elifesciences.org/articles/70382/elife-70382-supp2-v2.xlsx
-
Transparent reporting form
- https://cdn.elifesciences.org/articles/70382/elife-70382-transrepform1-v2.docx
Download links
A two-part list of links to download the article, or parts of the article, in various formats.
Downloads (link to download the article as PDF)
Open citations (links to open the citations from this article in various online reference manager services)
Cite this article (links to download the citations from this article in formats compatible with various reference manager tools)
GWAS and ExWAS of blood mitochondrial DNA copy number identifies 71 loci and highlights a potential causal role in dementia
eLife 11:e70382.
https://doi.org/10.7554/eLife.70382


