Pathway-specific effects of ADSL deficiency on neurodevelopment
- National Cancer Institute, Center for Cancer Research, Radiation Oncology Branch, United States
- Institute for Research in Biomedicine, The Barcelona Institute of Science and Technology, Spain
- Department of Experimental and Clinical Pharmacology and Pharmacogenomics, University of Tübingen, Germany
- Institute of Biochemistry and Molecular Biology, Ulm University, Germany
- Department of Cell Biology, Instituto de Biología Molecular de Barcelona, Spain
- Department of Paediatrics and Inherited Metabolic Disorders, First Faculty of Medicine, Charles University and General University Hospital in Prague, Czech Republic
- Universitat Rovira i Virgili, Department of Electronic Engineering, IISPV, Spain
- CIBER de Diabetes y Enfermedades Metabólicas Asociadas (CIBERDEM), Instituto de Salud Carlos III, Spain
- ICREA, Spain
- Institute of Complex Systems (UBICS), Universitat de Barcelona, Spain
- Section of General Linguistics, Universitat de Barcelona, Spain
Figures
Figure 1 with 2 supplements
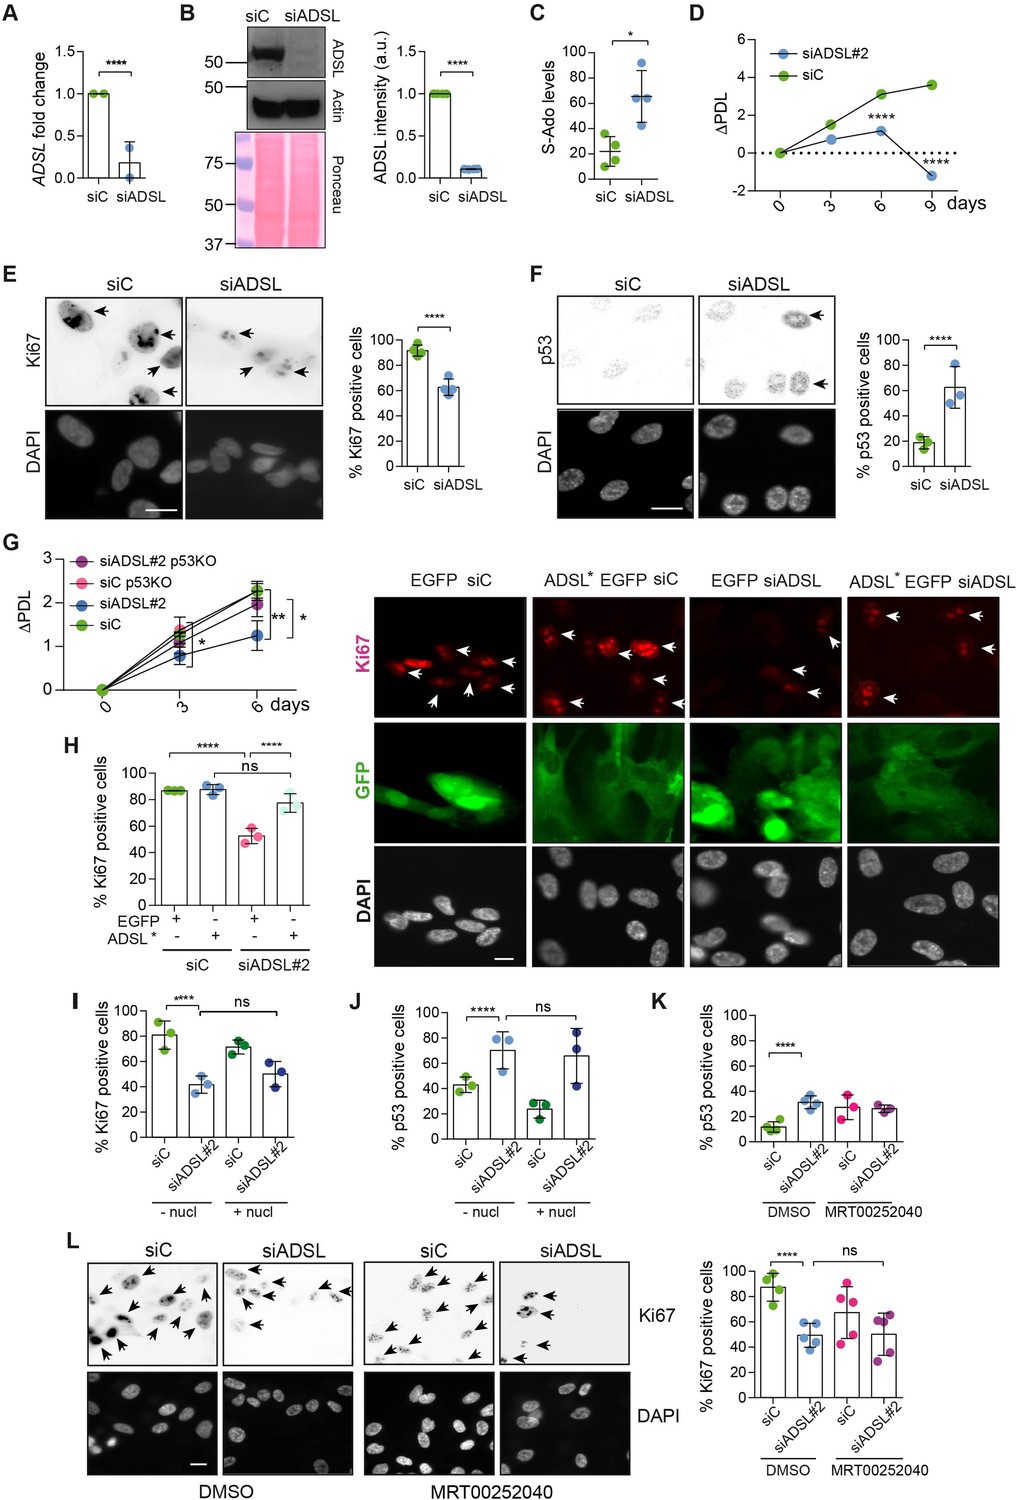
Adenylosuccinate lyase (ADSL) depletion causes p53-dependent proliferation defects.
(A) Reduced mRNA levels of ADSL confirmed by qRT-PCR experiments. hTERT-RPE-1 were silenced with smart pool RNAi for 96 hr before harvesting. Two independent experiments in triplicate are shown in the panel (n = 2, two-tailed t-test, ****p<0.0001) (B) Western blot of RPE-1 cell extracts treated as in (A). One experiment is shown as representative of four independent experiments. Actin was used as a loading control. Quantifications of ADSL intensity in four different experiments were performed by ImageJ software and normalized to actin first and then to the relative controls (n = 4, two-tailed t-test, ****p<0.0001). Ponceau is shown as an additional loading and transfer control. (C) S-Ado levels in RPE-1 cells silenced with a single control or ADSL siRNA (n = 4, two-tailed t-test, *p<0.05). (D) Cell proliferation rates of RPE-1 cells quantified every 3 days after treatment with a single control or ADSL siRNA in medium with serum (n = 3, two-tailed t-test ****p<0.0001). ΔPDL represent the difference in population doubling levels quantified through the formula described in Materials and methods. (E) Ki67-positive cells (indicated by arrows) upon 96 hr of silencing with control or ADSL smart pool siRNAs. Scale bar 10 μm (n = 4, scored 767 cells for siC, 694 cells for siADSL conditions, ****p<0.0001). (F) The percentage of p53-positive cells (indicated by arrows) following treatment with control or ADSL smart pool siRNAs was quantified in three independent experiments (n = 3, scored 835 cells for siC and 1126 cells for siADSL, *p<0.05). (G) Cell proliferation rates in RPE-1 wt and p53 knockout KO cells as in (D) were counted for 6 days (n = 3, two-tailed t-test, **p<0.01, *p<0.05). (H) RPE-1 cells stably expressing EGFP or ADSL*-EGFP were transfected with a single control or ADSL siRNAs for 96 hr and immunostained with anti-Ki67 antibody. Scale bar = 20 μm. Quantification of Ki67-positive cells (n = 3, scored 278 cells for EGFP siC, 264 for EGFP siADSL, 266 for ADSL* siC, 232 cells for ADSL* siADSL conditions, ns not significant, ****p<0.0001). (I) Quantification of RPE-1 transfected with a single control or ADSL siRNA for 96 hr in the presence or absence of 60 μM nucleosides. Cells were fixed and immunostained with anti-Ki67 antibody (n = 3, at least 100 cells per conditions were counted in each experiment, ns not significant, ****p<0.0001). (J) Quantification of RPE-1 in the same conditions of (I) and immunostained with anti-p53 antibody (n = 3, at least 100 cells were counted for each condition per experiment, ns not significant, ****p<0.0001). (K) Quantification of p53-positive cells in ADSL-depleted cells in the presence or absence of the phosphoribosylaminoimidazole carboxylase (PAICS) inhibitor MRT00252040 (n = 3, scored 223 cells for siC, 248 cells for siADSL, 336 cells for siC+ MRT00252040, 365 cells for siADSL + MRT00252040, ns not significant, ****p<0.001, *p<0.05). (L) Quantification of Ki67-positive cells in ADSL-depleted cells in the presence or absence of MRT00252040 (n = 5, more than 60 cells were counted in each condition for each experiment, ns not significant, ***p<0.001). Positive cells are indicated with arrows in siADSL panels. All graphs depict means ± SD with individual values shown in circles.
-
Figure 1—source data 1
Related to Figure 1A and C–L.
GraphPad Prism file.
- https://cdn.elifesciences.org/articles/70518/elife-70518-fig1-data1-v3.zip
-
Figure 1—source data 2
Related to Figure 1B.
jpg file.
- https://cdn.elifesciences.org/articles/70518/elife-70518-fig1-data2-v3.zip
Figure 1—figure supplement 1
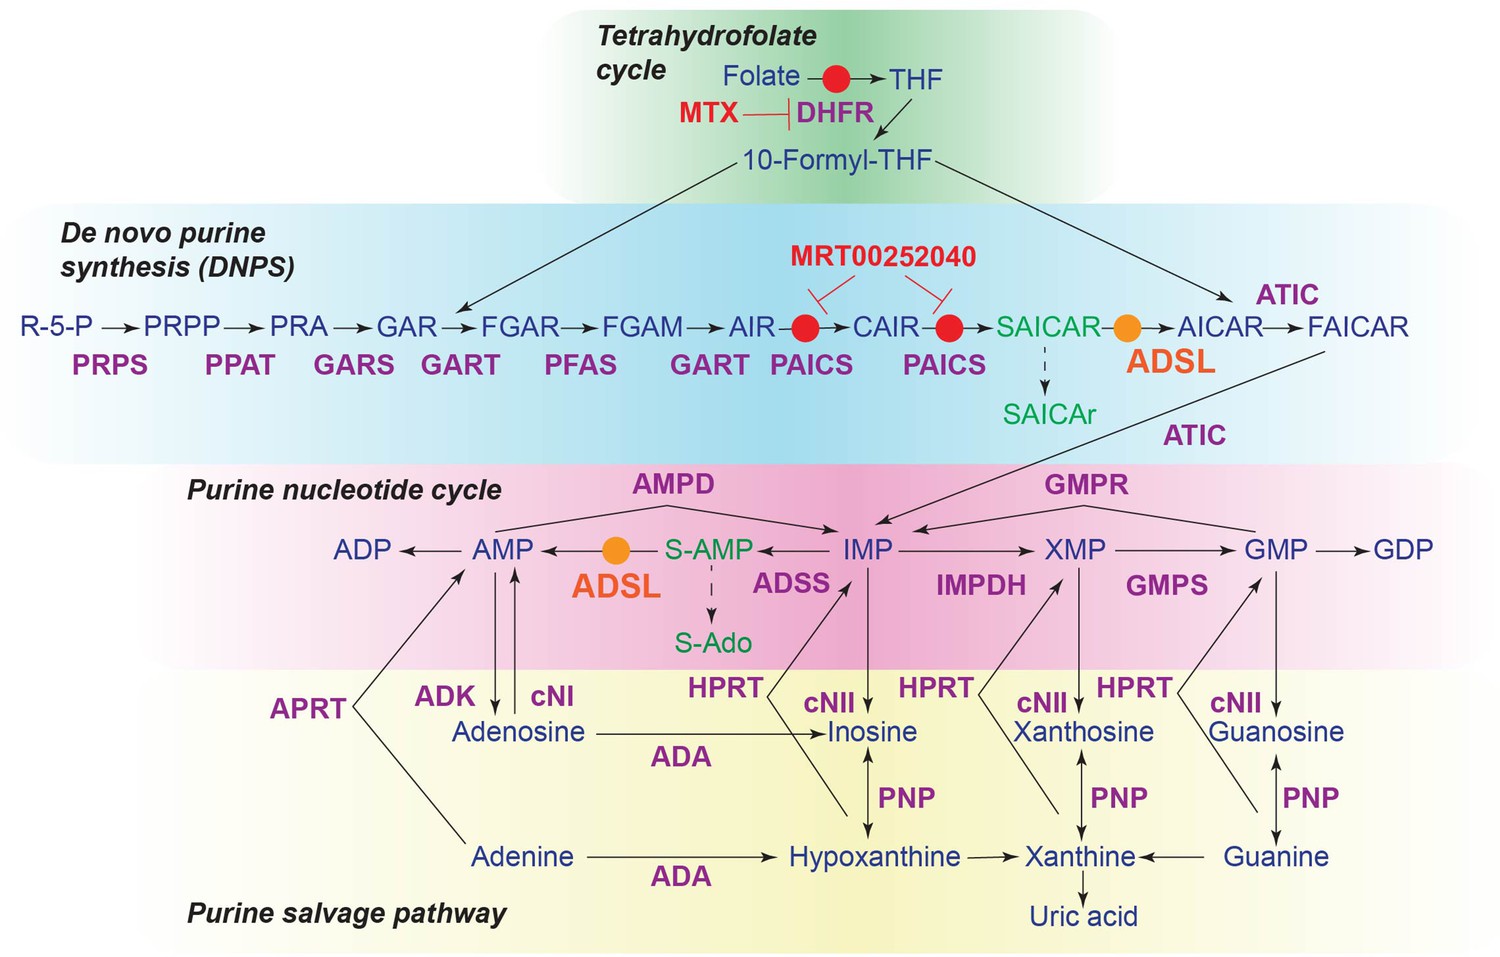
The role of adenylosuccinate lyase (ADSL) in de novo purine synthesis (DNPS) and the purine nucleotide cycle.
Schematic of the DNPS pathway, purine nucleotide cycle, purine salvage pathway, and tetrahydrofolate cycle. Enzymes are indicated in purple and metabolites in blue. ADSL is shown in orange and the small-molecule inhibitors used in red. Circles in the corresponding colors indicate the reactions affected by ADSL or inhibitors, respectively. Metabolites that accumulate following ADSL depletion are shown in green.
Figure 1—figure supplement 2
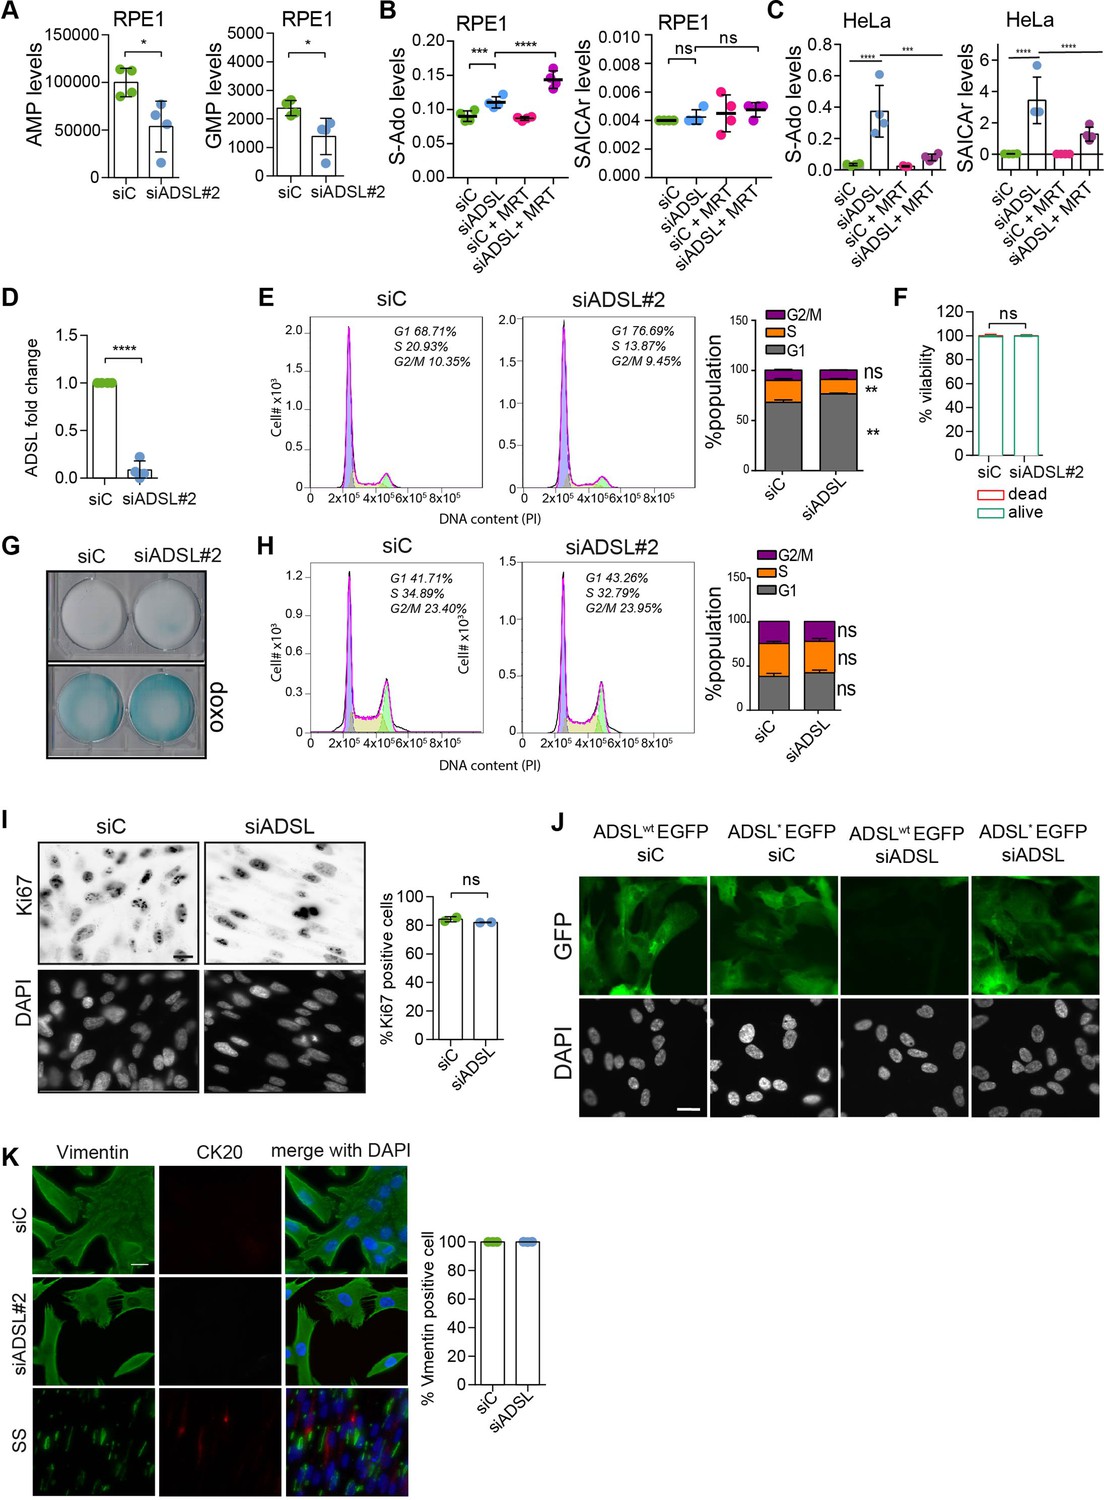
Adenylosuccinate lyase (ADSL) depletion does not cause senescence or promote differentiation.
(A) Analysis of AMP and GMP levels following ADSL depletion in RPE-1 cells (see also Figure 1C). (B) Analysis of S-Ado and SAICAr levels following ADSL depletion in RPE-1 cells treated or not with 4 μM MRT00252040 (phosphoribosylaminoimidazole carboxylase [PAICS] inhibitor). Box–Cox transformation was applied using lambda = 0 for SAICAr and lambda = −0.5 for S-Ado values. (C) Analysis of S-Ado and SAICAr levels following ADSL depletion in HeLa cells treated or not with 4 μM MRT00252040 (PAICS inhibitor). Box–Cox transformation was applied using lambda = 0 for SAICAr and lambda = −0.5 for S-Ado values. (D) qRT-PCR confirmed ADSL depletion with a single siRNA against ADSL (siRNA#2; n = 4 in triplicate, two-tailed t-test, ****p<0.0001). (E) Flow cytometry analysis of cell cycle using propidium iodide staining in RPE-1 cells treated with control (Ci) siRNA or siRNA against ADSL. Representative data is shown (left) and data from n = 3 independent cultures is graphed (right). Student’s t-test was applied (n = 3 scored more than 10,000 cells for each condition in each experiment, *p<0.05). (F) Quantification of cell viability by Trypan Blue in RPE-1 cells transfected with single control or ADSL siRNAs (n = 5, scored 807 cells for siC, 682 cells for siADSL, ns not significant). (G) β-Galactosidase assay in RPE-1 cells upon ADSL depletion treated as in panel (F). Doxorubicin (doxo) was used as a positive control to induce senescence. (H) Flow cytometry analysis of cell cycle using propidium iodide staining in RPE-1 p53 KO cells treated with control (Ci) siRNA or siRNA against ADSL. Representative data is shown (left) and data from n = 3 independent cultures is graphed (right). Student’s t-test was applied (n = 3 scored more than 10,000 cells for each condition in each experiment, ns not significant). (I) Ki67 staining in RPE-1 p53 KO upon silencing with a single control or ADSL siRNA (siRNA#2; n = 2, at least 200 cells for each condition per experiment were counted, ns not significant). Scale bar = 20 μm. All graphs depict means ± SD with individual values shown in circles. (J) Control of ADSL depletion and siRNA-resistant mutant expression 96 hr post-ADSL depletion. Scale bar = 20 μm. (K) Cells were transfected with a single control or ADSL siRNA (siADSL#2) for 96 hr, fixed, and stained against vimentin and cytokeratin-20 (CK20). Serum starvation (SS) for 144 hr was used as positive control for differentiation and CK20 staining. Quantification of the percentage of cells positive for vimentin is shown. No CK20-positive cells were observed in ADSL-depleted cells. Scale bar = 20 μm.
-
Figure 1—figure supplement 2—source data 1
Related to Figure 1—figure supplement 2.
GraphPad Prism file.
- https://cdn.elifesciences.org/articles/70518/elife-70518-fig1-figsupp2-data1-v3.zip
Figure 2
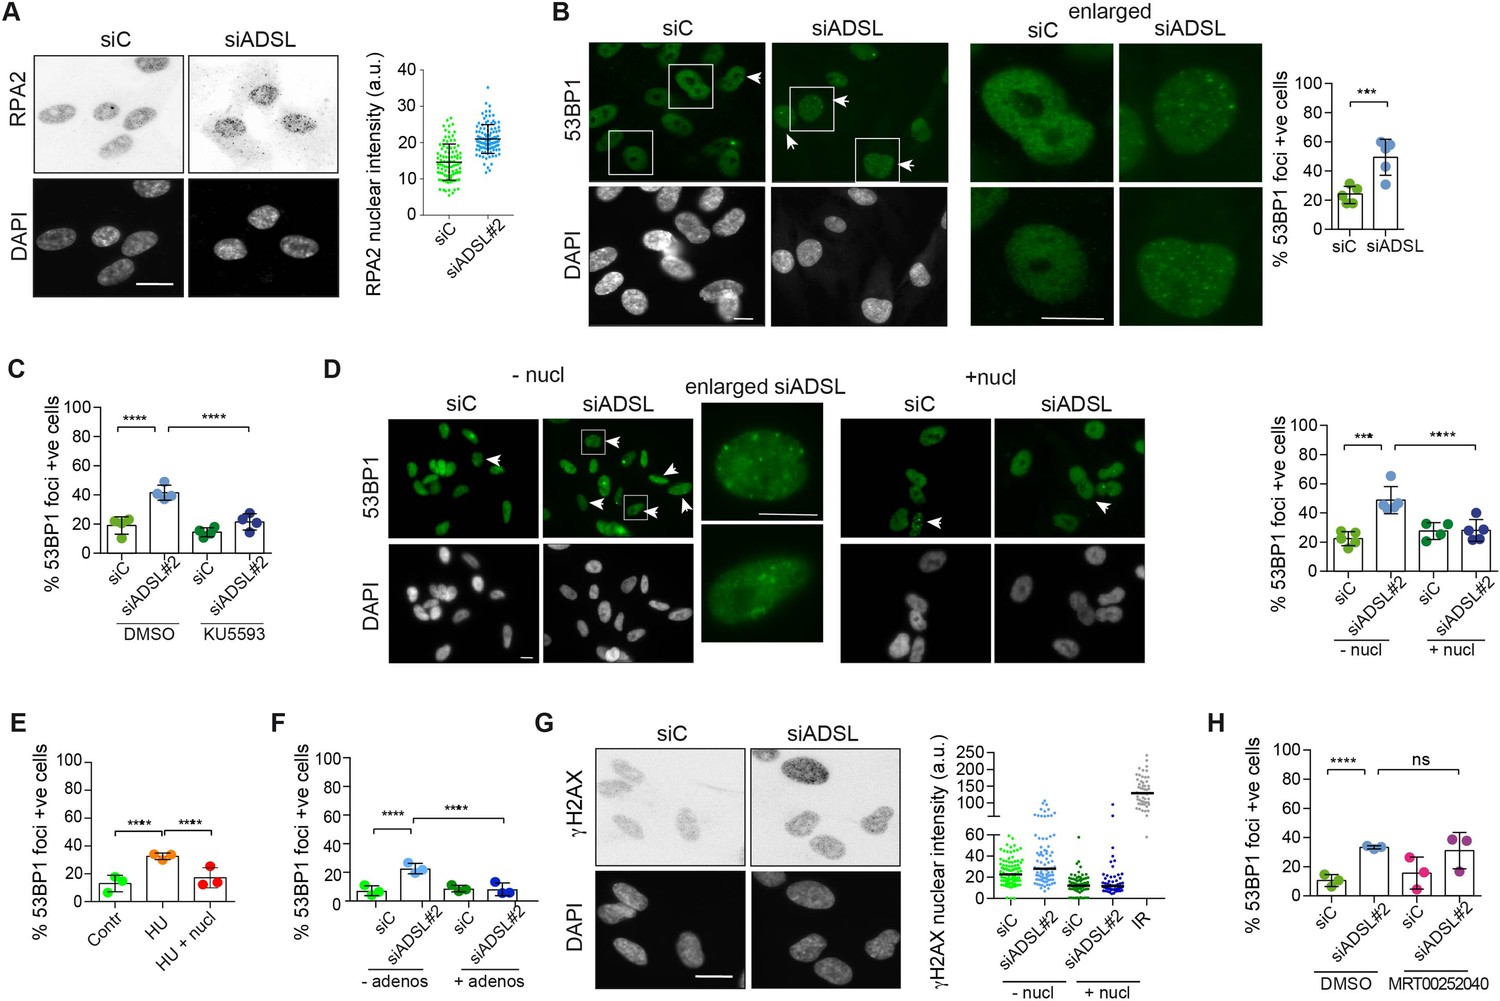
Adenylosuccinate lyase (ADSL) depletion caused elevated DNA damage signaling.
(A) RPE-1 were silenced for 96 hr with a smart pool of ADSL siRNAs, chromatin extracted, and immunostained with an anti-RPA2 antibody. Nuclear intensity of cells was measured- Quantification of one representative experiment of four that showed similar results is shown; SD and average are indicated in black. After normalization to the average of the control (siC), two-tailed t-test was used for statistical analysis of n = 4 independent experiments: *p<0.05 was observed for siADSL to siC. (B) RPE-1 were silenced for 96 hr with a smart pool of ADSL siRNAs, fixed, and immunostained with anti-53BP1 antibody. Scale bar = 10 μm. Quantification of positive cells that have more than five foci per cell (n = 5 scored 1134 cells for siC, 1144 cells for siADSL, ***p<0.001). (C) RPE-1 were silenced with a single control or ADSL siRNA with or without 5 mM ATM inhibitor (KU5593) (n = 4, scored 359 cells for siC, 322 cells for siADSL, 307 cells for siC + KU5593, 279 cells for siADSL + KU5593, ****p<0.0001). (D) Cells were silenced for 96 hr, treated or not with 60 μM (1×) nucleosides, and stained for 53BP1. Scale bar = 10 μm (n = 5, scored 717 cells for siC, 608 cells for siADSL, 576 cells for siC + nucl, 512 cells for siADSL + nucl, ****p<0.0001). (E) RPE-1 cells were treated with 2 mM hydroxyurea (HU) for 6 hr and treated or not with 1× nucleosides and stained for 53BP1. Cells with more than five foci per nucleus were counted as positive. Three independent experiments were performed (n = 3, at least 100 cells per experiment per condition were counted, ****p<0.0001). (F) Cells were silenced for 96 hr, treated or not with 80 μg/ml adenosine, and stained for 53BP1 (n = 3, scored 544 cells for siC, 428 cells for siADSL, 485 cells for siC+ adenosine, 411 cells for siADSL + adenosine, ****p<0.0001). (G) RPE-1 treated as in (A) were fixed and stained for γH2AX (H2AX phosphorylated on Ser-139). Scale bar = 10 μm. 5 Gy X-ray irradiation (IR) was used as positive control. Quantification of one representative experiment of two that showed similar results is shown; median is indicated in black. After normalization to the average of the control (siC), one-tailed t-test was used for statistical analysis of n = 3 independent experiments: *p<0.05 was observed for siADSL (to siC), and for siADSL relative to siADSL + nucl. There is no statistical difference between siC and siC + nucl. (H) RPE-1 were silenced in the presence or absence of 4 μM MRT00252040, fixed and stained for 53BP1 (n = 4, scored 367 cells for siC, 313 cells for siADSL, 294 cells for siC + MRT00252040, 241 cells for siADSL + MRT00252040, ns not significant, ****p<0.0001). All bar graphs show means ± SD with individual values in circles.
-
Figure 2—source data 1
Related to Figure 2.
GraphPad Prism file.
- https://cdn.elifesciences.org/articles/70518/elife-70518-fig2-data1-v3.zip
Figure 3 with 1 supplement

Adenylosuccinate lyase (ADSL) depletion causes neurodevelopmental delay in the chicken neural tube.
(A) mRNA levels of ADSL and GAPDH were measured by qRT-PCR in chicken embryonic fibroblasts (CEFs) transfected for 24 hr with shCONTROL or shADSL to confirm knockdown efficiency (n = 3, two-tailed t-test, **p<0.01). (B) Transverse sections of HH12 chicken neural tubes 48 hr post electroporation (hpe) with shCONTROL or shADSL plasmids and stained with antibodies against SOX2 (green) and ELAVL3/4 (magenta). Transfection was detected by GFP (blue). Scale bar = 50 μm. Average ratio of neural stem cells (NSCs, SOX2+) 48 hpe with shCONTROL or shADSL obtained by comparing the mean number of SOX2+ cells on the electroporated and non-electroporated side (n = 7 embryos, two-tailed t-test, **p<0.01). Average ratio of cells differentiated into neurons (ELAVL3/4) at 48 hpe with shCONTROL or shADSL obtained by comparing the mean number of ELAVL3/4-positive cells on the electroporated and the non-electroporated side (n = 7 embryos, two-tailed t-test, ***p<0.001). (C) Percentage of electroporated cells identified as NSCs (SOX2) or neurons (ELAVL3/4) 48 hpe with shCONTROL or shADSL (n = 11 embryos, two-tailed t-test, ****p<0.0001). (D) The cell cycle profiles of NSCs (GFP+/ELAVL3/4-) obtained by fluorescence-associated cell sorting (FACS) 48 hpe with shCONTROL or shADSL into HH12 chicken neural tubes. The mean of two independent experiments is shown in the left panel. 6–8 embryos per condition were used for each experiment. Two-tailed t-test was used for statistical analysis of n = 2 independent experiments, ns not significant, *p<0.05. Cell cycle profiles of a representative experiment are shown in the right panels. (E) Transverse sections of HH12 chicken neural tubes 48 hpe with shCONTROL or shADSL plasmids, and stained with EdU (green) and an antibody against pH3S10 (magenta). Transfection was detected by GFP (blue). Scale bar = 50 μm. Areas indicated in yellow are amplified in the right panels showing separated channels in black. Green circles in pH3S10 amplification show punctate pH3S10-positive cells. Percentage of transfected cells identified as EdU-positive 48 hpe with shCONTROL or shADSL (n = 12 embryos [shCONTROL] and 14 embryos [shADSL], two-tailed t-test, ****p<0.0001). Percentage of pH3S10 among the GFP+ cell population 48 hpe with shCONTROL or shADSL (n = 14 embryos, two-tailed t-test, ns not significant, **p<0.01, ****p<0.0001). Average ratio of EdU and pH3S10-positive cells 48 hpe of shCONTROL or shADSL plasmids, obtained by comparing the mean number of EdU cells on the electroporated and the non-electroporated side (EdU: n = 11 embryos [shCONTROL], 15 embryos [shADSL], two-tailed t-test, ***p<0.001; pH3S10: n = 18 embryos [shCONTROL], 15 embryos [shADSL], two-tailed t-test, ns not significant). (F) Percentage of punctate pH3S10 (G2 phase) and mitotic pH3S10 (M phase) among the GFP+ cell population 48 hpe of shCONTROL or shADSL plasmids (n = 14 embryos, two-tailed t-test, ns not significant, ****p<0.0001). Bar graphs show means ± SD.
-
Figure 3—source data 1
Related to Figure 3.
GraphPad Prism file.
- https://cdn.elifesciences.org/articles/70518/elife-70518-fig3-data1-v3.zip
Figure 3—figure supplement 1
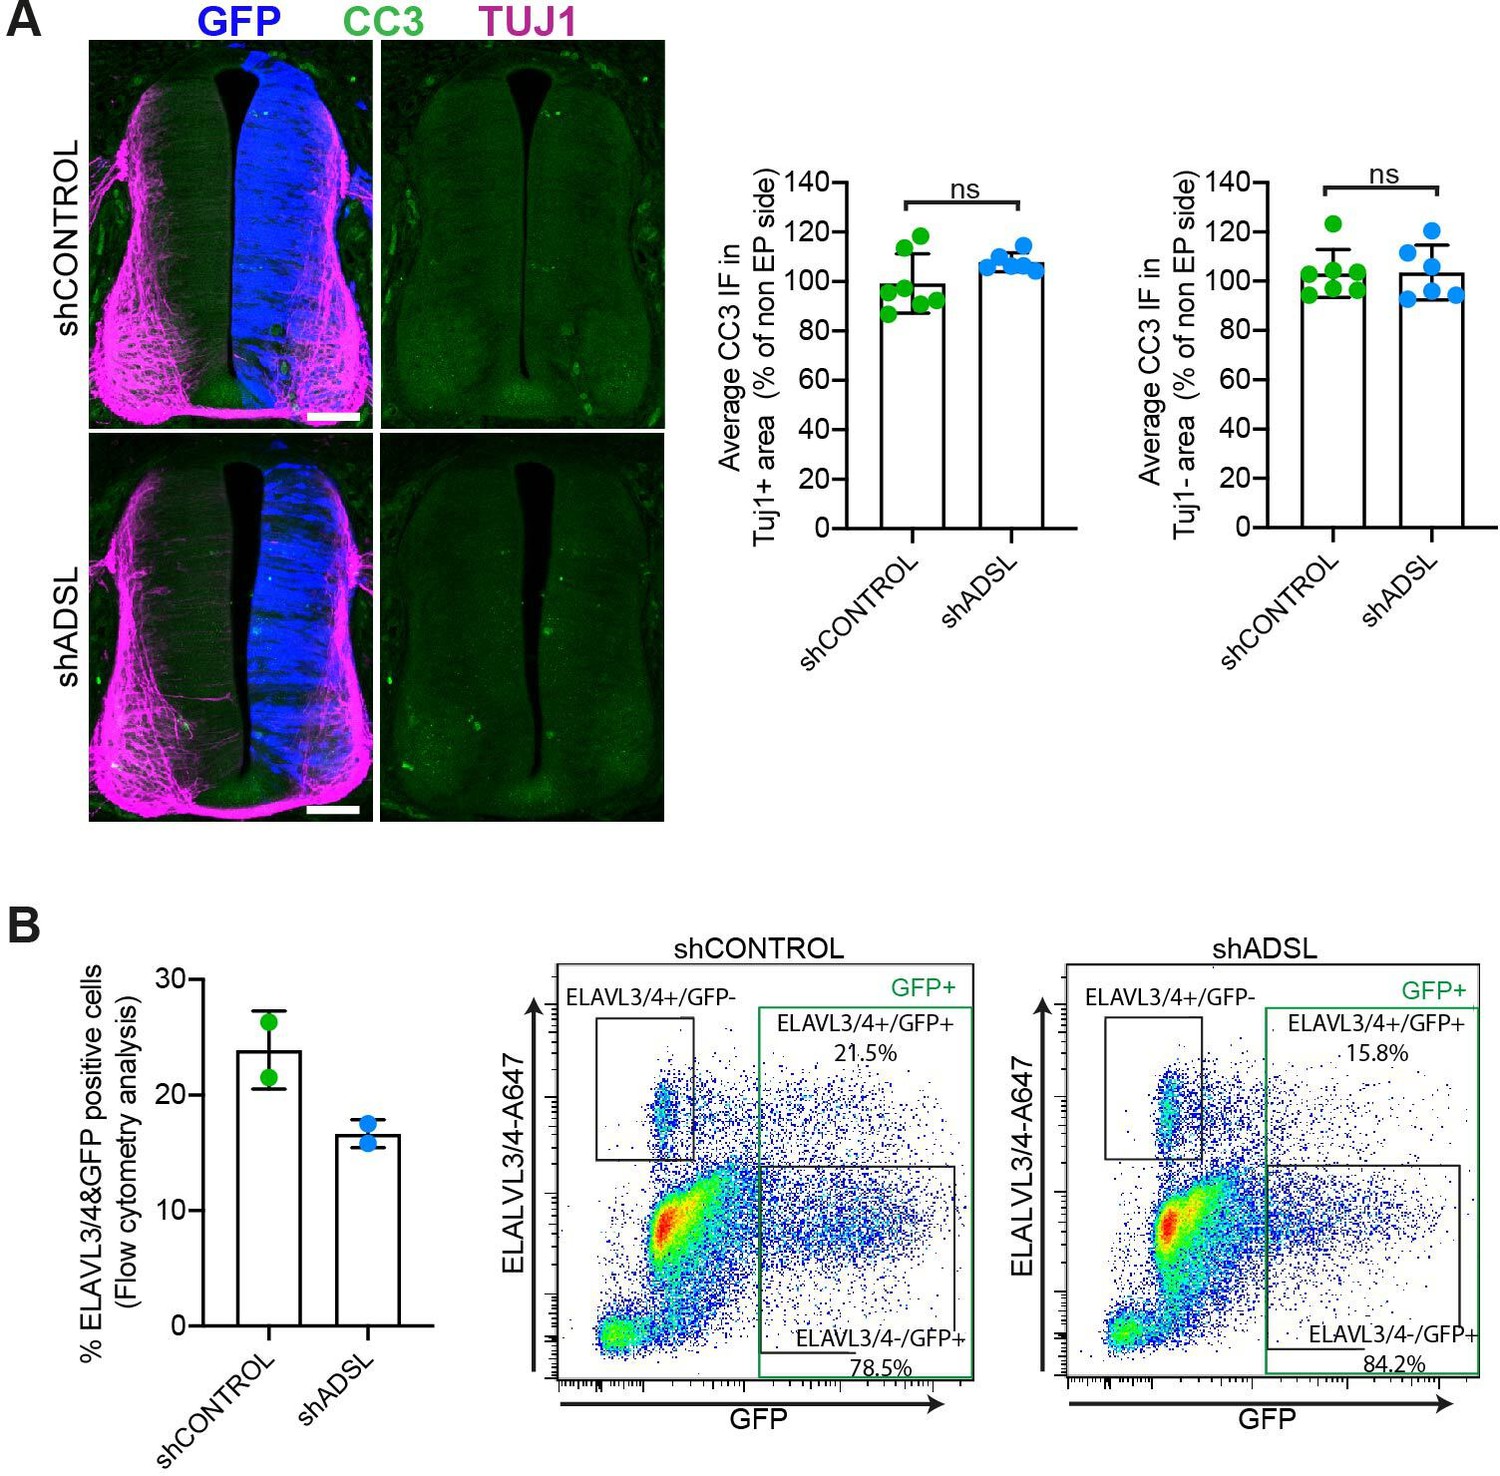
Lack of cell death or increased differentiation in developing adenylosuccinate lyase (ADSL)-depleted chicken neural tubes.
(A) Representative transverse neural tube sections and quantification of mean cleaved caspase-3 (CC3; green) immunofluorescence intensity obtained by comparing mean CC3 intensity on TUJ1- or TUJ1+ area (magenta) on the electroporated side (GFP area, blue) with the respective area on the non-electroplated side after 48 hr post electroporation (hpe) with shCONTROL or shADSL (n = 7 embryos [shCONTROL] and 6 embryos [shADSL], two-tailed t-test, ns not significant). Scale bar = 50 μm. (B) Rate of differentiation was analyzed by fluorescence-associated cell sorting (FACS) after 48 hpe into HH12 neural tubes with shCONTROL or shADSL. 6–8 embryos per condition were used for each experiment. The mean of two independent experiments is shown in the left panel. Dot plots in right panels represent ELAVL3/4 intensity versus GFP intensity of a representative experiment.
Figure 4 with 1 supplement
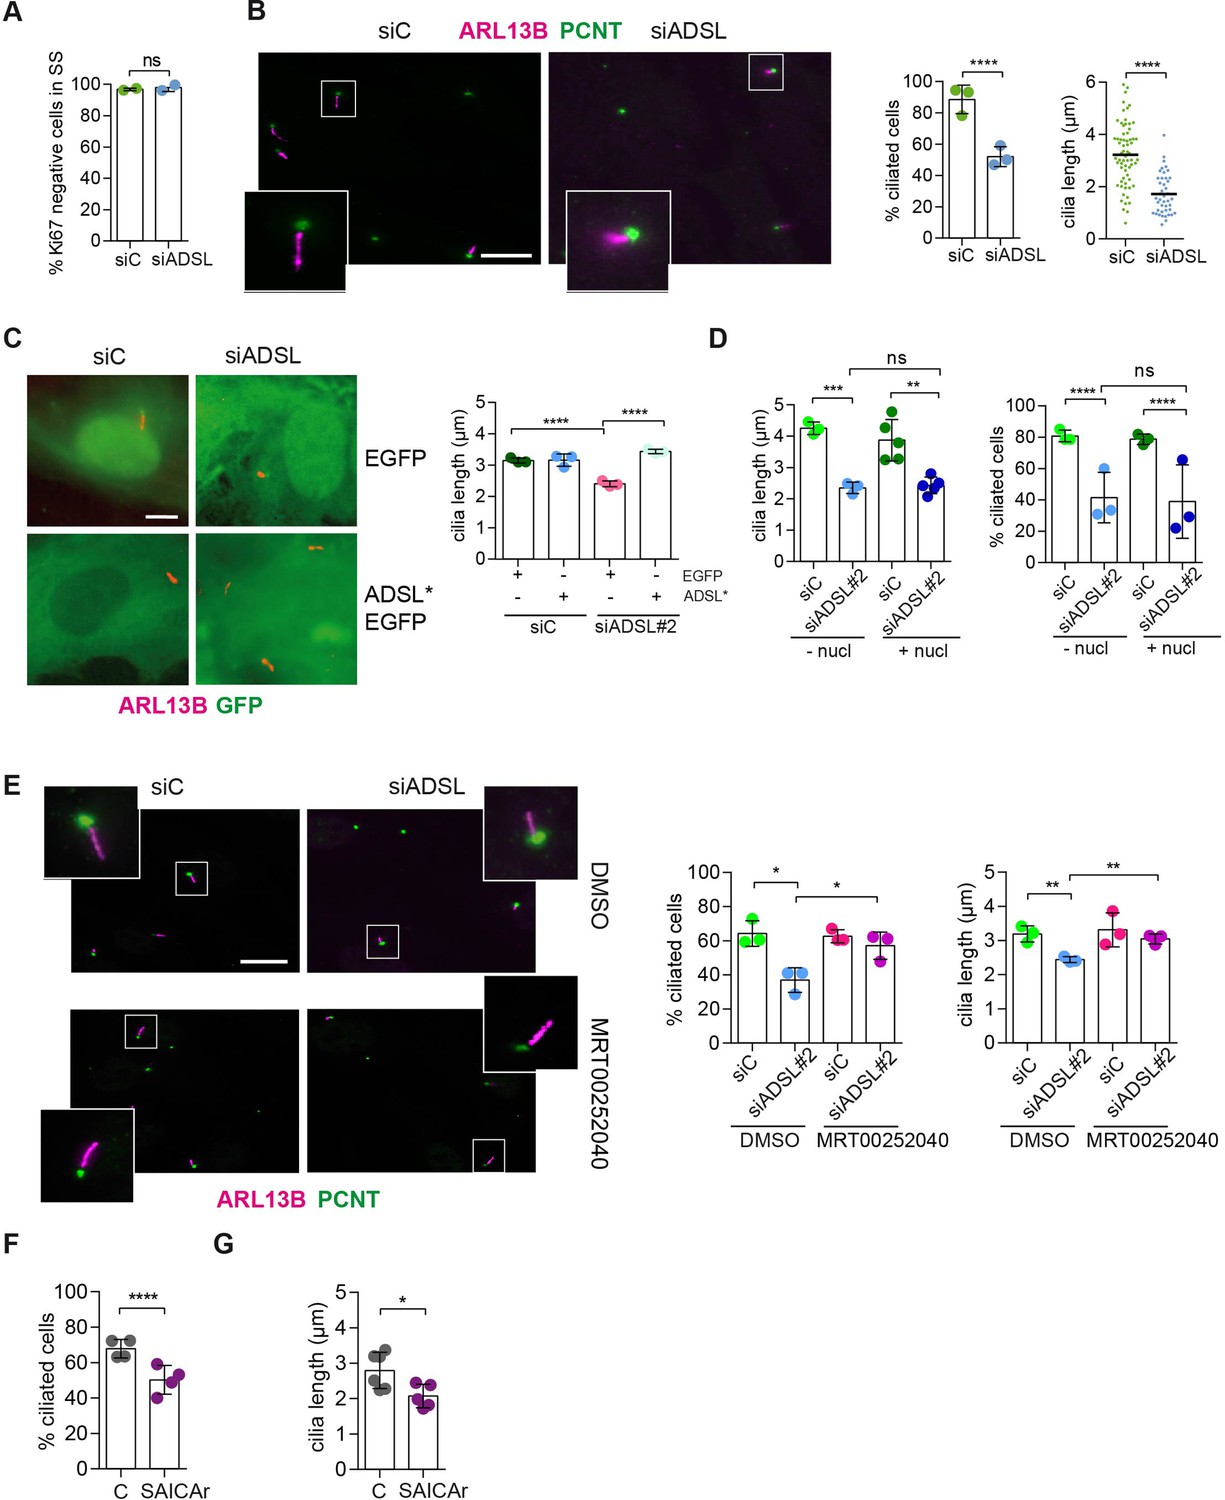
SAICAr-dependent ciliogenesis defects following adenylosuccinate lyase (ADSL) depletion.
(A) RPE-1 were transfected with control or ADSL smart pool siRNAs. After 96 hr, cells were serum starved for 48 hr to induce ciliogenesis followed by staining against Ki67 and negative cells quantified (n = 2, two-tailed t-test, ns not significant). (B) Ciliated cells silenced as in (A) were stained for ARL13B (magenta) and pericentrin (PCNT) (green). Scale bar = 10 μm. Magenta squares show enlargements of the areas. Graphs show quantification of ciliated cells and cilia length (line indicates median) (n = 3, scored 108 cells for siC, 82 cells for siADSL, ****p<0.0001). (C) RPE1 cells stably expressing EGFP or ADSL*-EGFP were silenced for 96 hr with control or a single ADSL siRNA, serum starved for 48 hr, fixed, and stained for ARL13B (red). Scale bar = 5 μm. Graphs summarize three experiments (one-way ANOVA, ns not significant, ***p<0.001, **p<0.01, *p<0.05). (D) RPE-1 cells silenced with a single ADSL siRNA (siADSL#2) for 96 hr in the absence or presence of 1× nucleosides. Cilia frequency and cilia length were quantified; mean ± SD of n = 3 siC (scored 557 cells) and siADSL (scored 499 cells), n = 5 for siC (588 cells) and siADSL (scored 297 cells) with nucleosides, ns not significant, ***p<0.001. (E) RPE-1 cells were ADSL-depleted, treated or not with MRT00252040 and serum starved, and then immunostained for ARL13B (magenta) and PCNT (green). Cilia frequency and cilia length were quantified (n = 3, scored 261 cells for siC, 166 cells for siADSL, 287 cells for siC + MRT0025204, 170 cells for siADSL + MRT00252040, **p<0.01, ****p<0.0001). Scale bar = 10 μm. (F) Quantification of the cilia frequency in control and SAICAR-treated cells (n = 4, scored 589 cells for control, 456 cells for SAICAR-treated, ****p<0.0001). (G) Cilia length measurement of cells treated as in (F) (n = 5, two-tailed t-test, *p<0.05).
-
Figure 4—source data 1
Related to Figure 4 and Figure 4—figure supplement 1.
GraphPad Prism file.
- https://cdn.elifesciences.org/articles/70518/elife-70518-fig4-data1-v3.zip
Figure 4—figure supplement 1
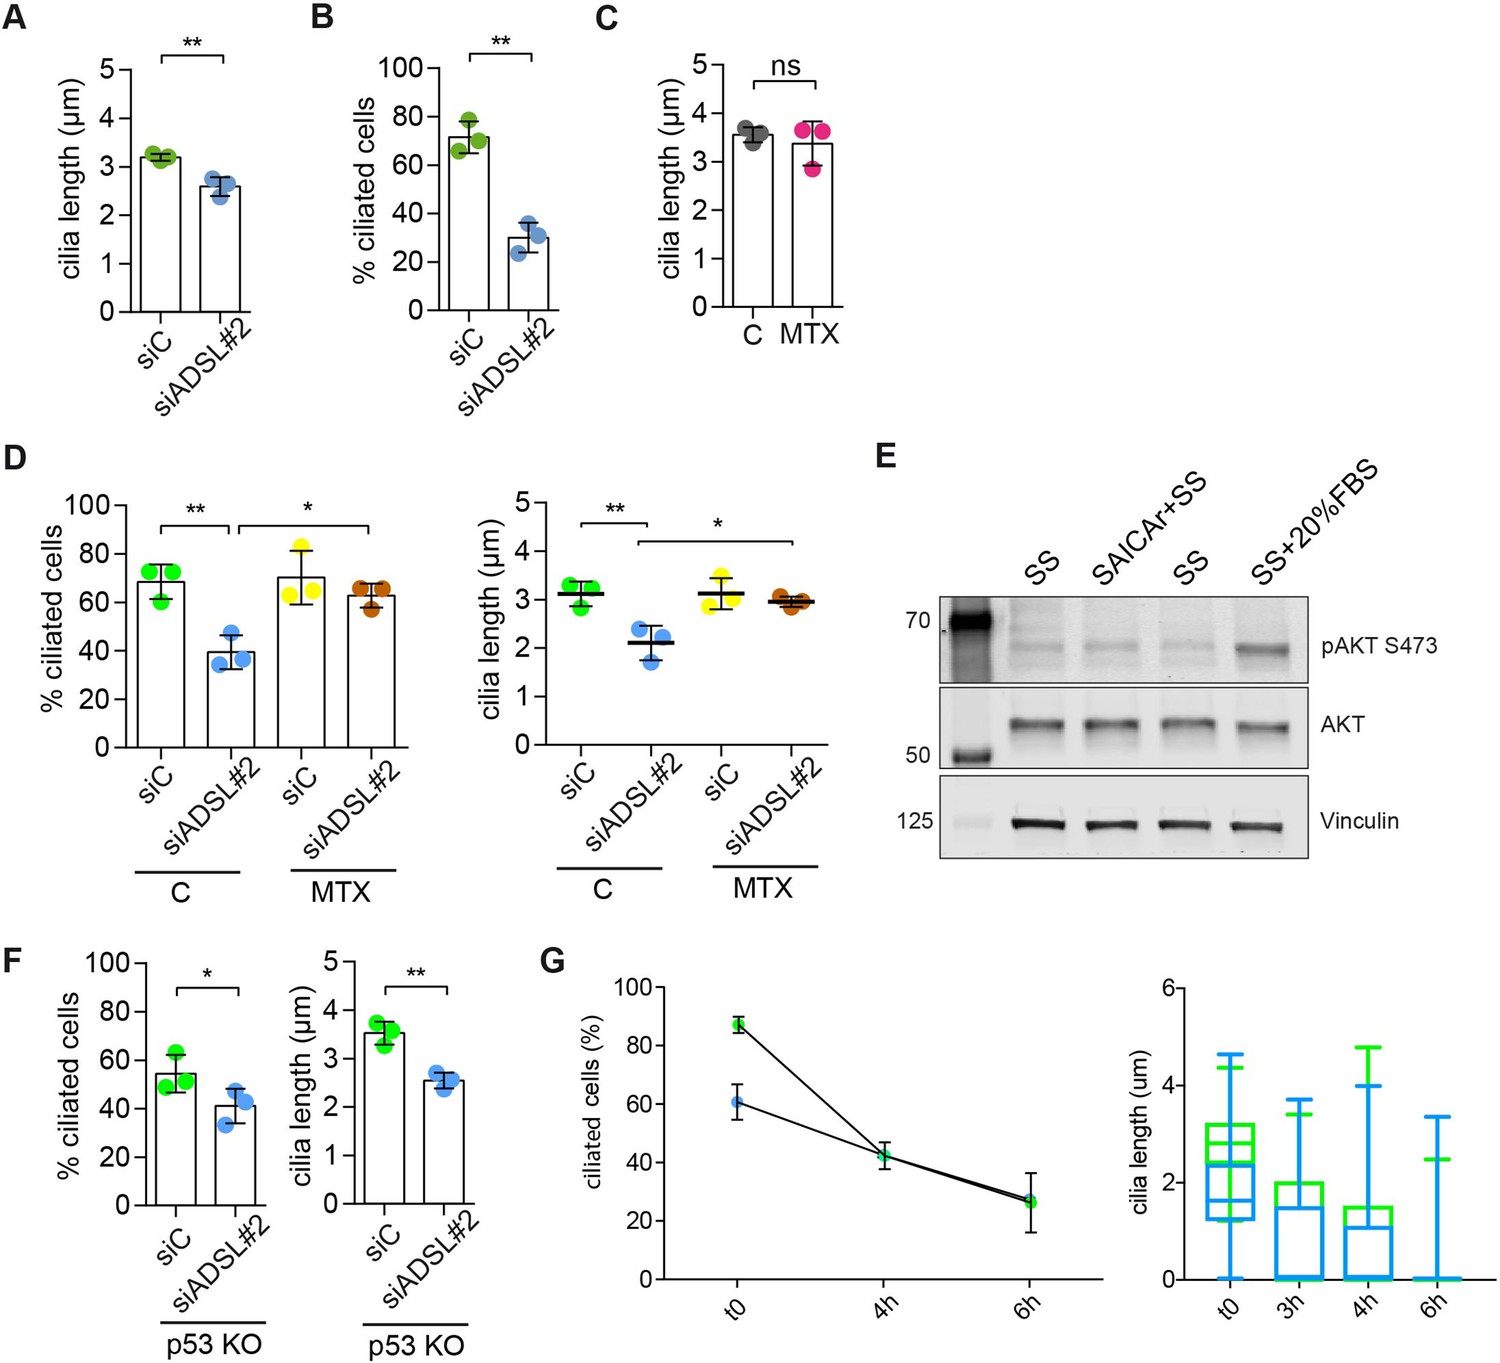
Adenylosuccinate lyase (ADSL) depletion impairs ciliogenesis that can be rescued by methotrexate (MTX) treatment.
(A) Quantification of cilia length in RPE-1 cells transfected with a single control or ADSL siRNA (n = 3, two-tailed t-test, **p<0.01). (B) Quantification of cilia frequency in RPE-1 silenced as in (A) and serum starved for 72 hr (n = 3, two-tailed t-test **p<0.01). (C) Quantification of cilia length in RPE-1 cells treated for 24 hr with 5 μM MTX (DHFR inhibitor) (n = 3, two-tailed t-test, ns not significant). (D) Quantification of cilia frequency and cilia length in RPE-1 cells transfected with single control or ADSL siRNAs treated or not with 5 μM MTX for 24 hr before serum starvation (n = 3, scored 324 cells for siC, 294 cells for siADSL, 253 cells for siC + MTX, 271 cells for siADSL + MTX, **p<0.01, *p<0.05). (E) Western blotting for total AKT or active AKT (pS473) following 24 hr SS, SS with SAICAr (48 hr pre-treatment, 24 hr SS), or 24 hr SS followed by 20% serum for 30 min. (F) Quantification of the number of ciliated cells and cilia length in RPE-1 p53KO cells upon ADSL depletion (n = 3, scored 338 cells for siC, 321 cells for siADSL, **p<0.01, *p<0.05). (G) Quantification of the number of ciliated cells and cilia length in RPE-1 cells upon ADSL depletion for 96 hr, serum starved for 48 hr (t = 0), and serum add back at different timepoints (t = 3, t = 6 hr) (n = 2, scored 95 cells for siC, 89 cells for siADSL).
-
Figure 4—figure supplement 1—source data 1
- https://cdn.elifesciences.org/articles/70518/elife-70518-fig4-figsupp1-data1-v3.zip
Figure 5 with 1 supplement
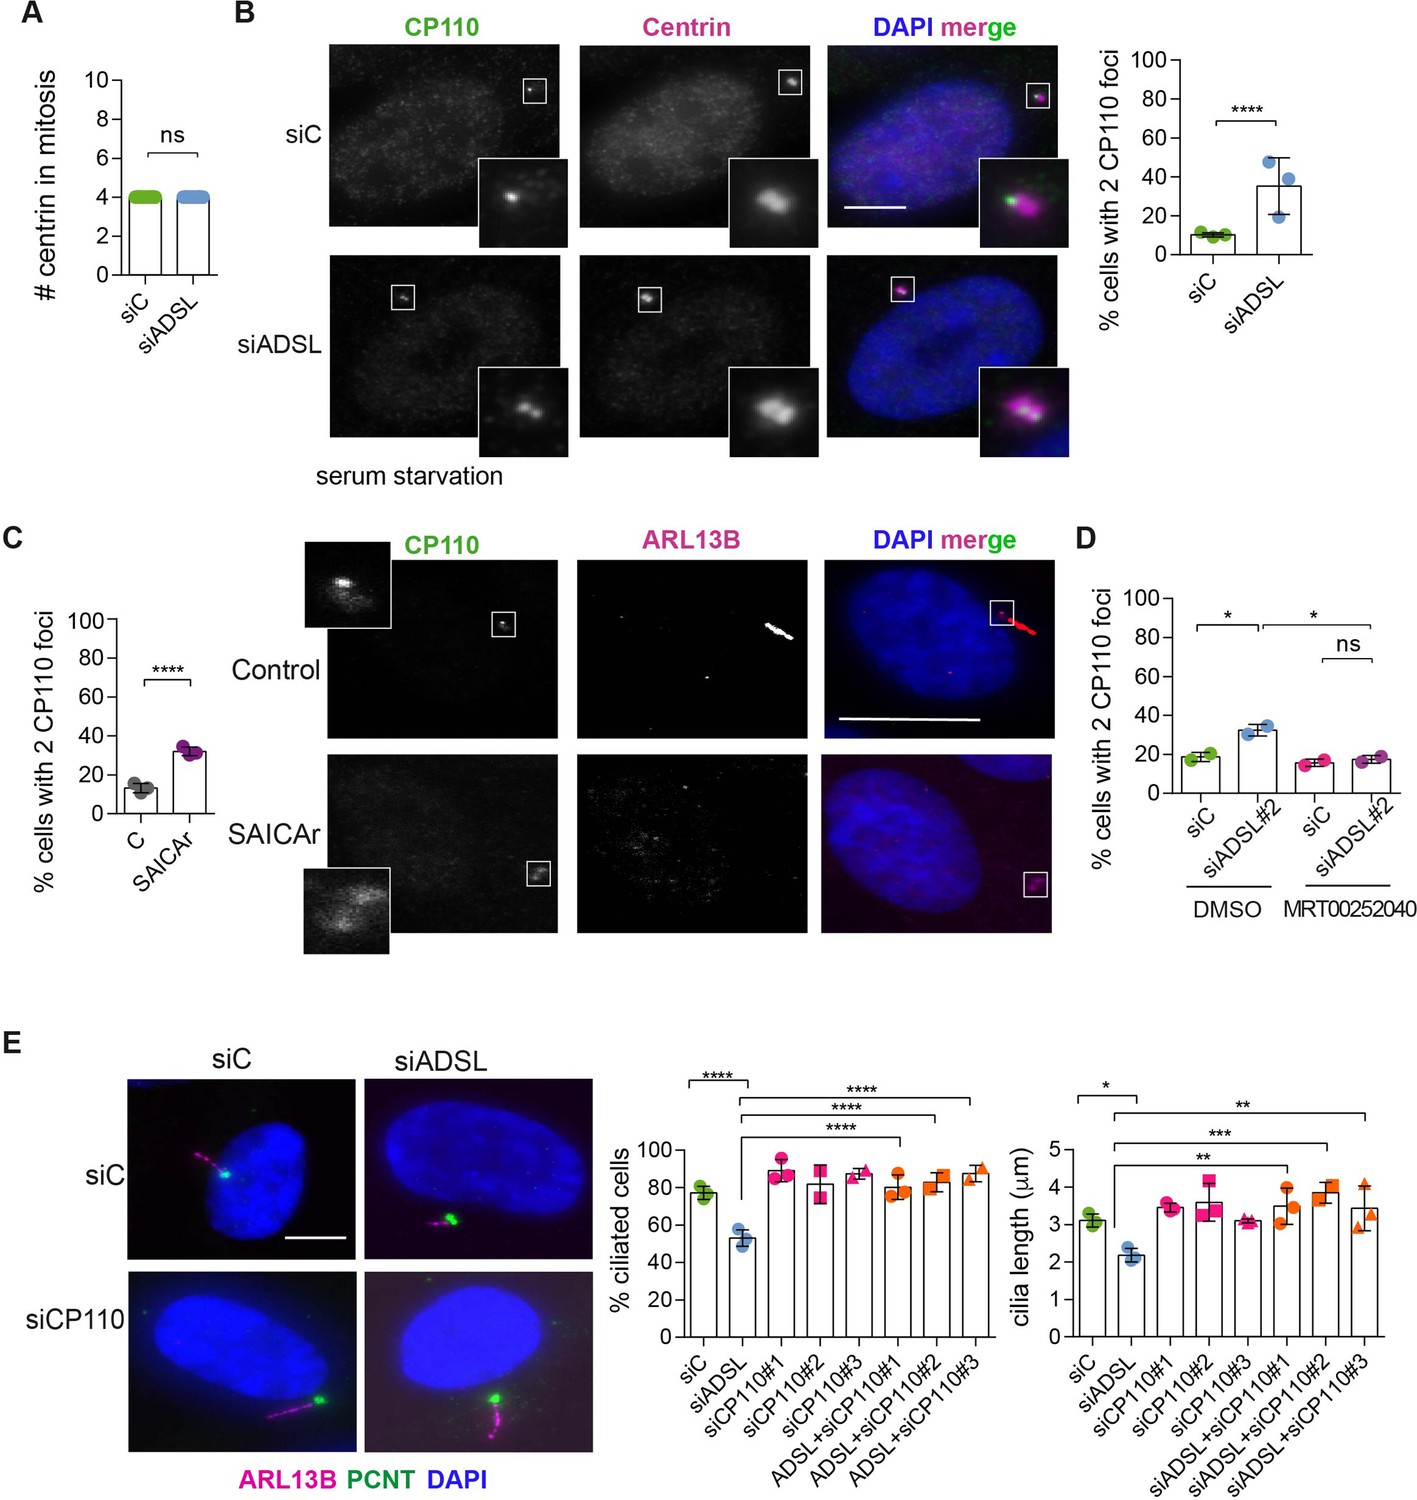
Adenylosuccinate lyase (ADSL) depletion and SAICAr impair CP110 removal.
(A) Quantification of the number of centrin foci present in mitotic RPE-1 cells transfected with control or ADSL smart pool siRNAs for 96 hr (n = 2, two-tailed t-test, ns not significant). (B) ADSL-silenced cells and controls were stained for centrin (magenta) and CP110 (green). Nuclei are shown by DAPI (blue). Graph depicts the number of ciliated cells with two CP110 foci per centrosome (n = 3, scored 342 cells for siC, 221 cells for siADSL, *p<0.05). (C) Cells mock or treated with SAICAr were processed and analyzed as described in panel (B) (n = 3, scored 288 cells for control and 253 cells for SAICAr, ***p<0.001). (D) RPE-1 cells depleted with ADSL or control siRNAs were treated with vehicle or MRT00252040 and stained as in (B, C). Graph depicts the percentage of cells presenting two CP110 foci per centrosome (n = 2; scored 177 cells for siC + DMSO, 180 cells for siADSL + DMSO, 75 cells for siC + MRT00252040, 78 cells for siADSL + MRT00252040, *p<0.05). (E) RPE-1 cells depleted with ADSL and/or CP110 (silenced for 24 hr with three different siRNAs) were serum starved for 48 hr, fixed, and stained for ARL13B (magenta) and pericentrin (PCNT) (green). Graphs show the number of ciliated cells (n = 3 for siC, siADSL, siCP110#1, siADSL + siCP110#1; n = 2 for siCP110#2, siCP110#3, siADSL + siCP110#2 and siADSL + siCP110#3, scored 461 cells for siC, 301 cells for siADSL, 277 cells for siCP110#1, 289 cells for siADSL + siCP110#1, 119 cells for siCP110#2, 90 cells for siADSL + siCP110#2, 141 cells for siCP110#3, 98 cells for siADSL + siCP110#3, ****p<0.0001, ***p<0.001) and cilia length (n = 3, one-way ANOVA ***p<0.001, **p<0.01, *p<0.05). All graphs show means ± SD with individual values shown in circles.
-
Figure 5—source data 1
Related to Figure 5.
GraphPad Prism file.
- https://cdn.elifesciences.org/articles/70518/elife-70518-fig5-data1-v3.zip
Figure 5—figure supplement 1
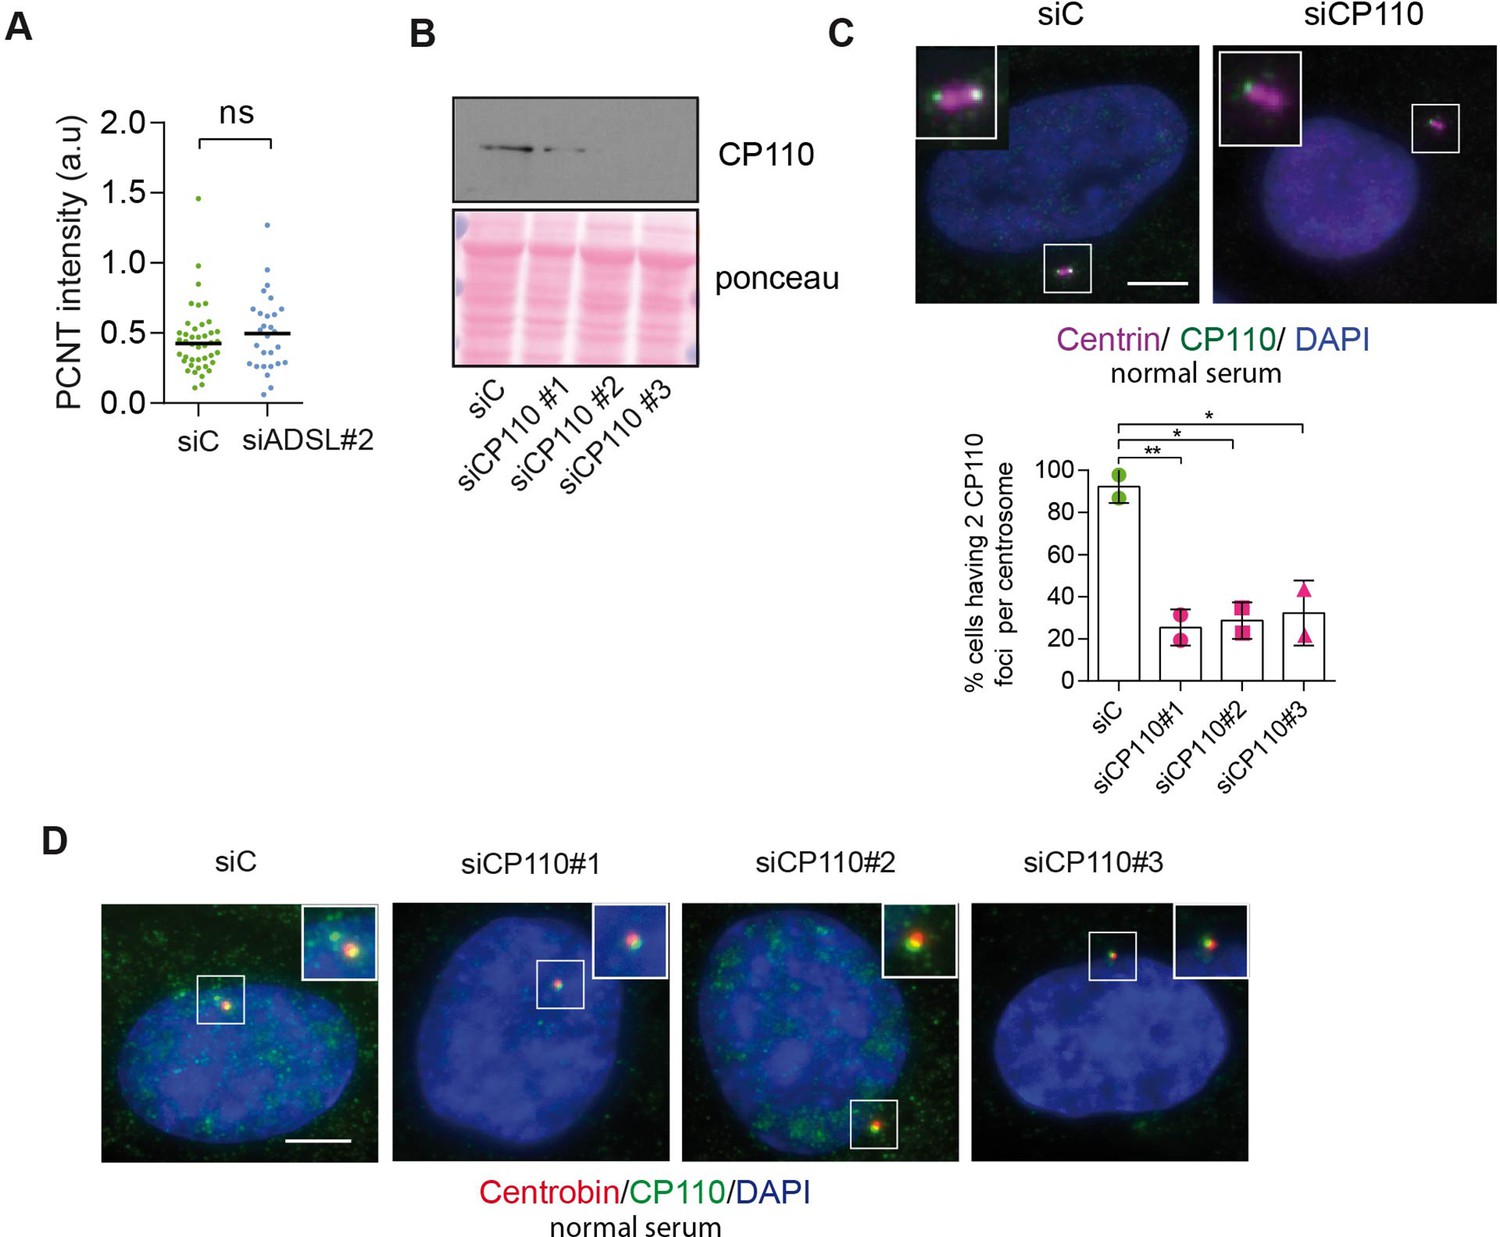
Analysis of pericentrin (PCNT) accumulation and CP110 depletion.
(A) Quantification of PCNT intensity upon adenylosuccinate lyase (ADSL) depletion with a single siRNA#2 (n = 2, two-tailed t-test applied, ns not significant; median is shown). (B) Western blot to confirm CP110 depletion after 24 hr of silencing with three different siRNAs. (C) CP110 presence in both centrioles (stained by anti-centrin antibody, in magenta) upon 24 hr of CP110 depletion in normal serum (10%) conditions. Quantification of centrioles presenting two foci per centrosome in control and CP110-depleted cells with three different siRNAs (n = 2, scored 82 cells for siC, 85 cells for siCP110#1, 77 cells for siCP110#2, 79 cells for siCP110#3, **p<0.01, *p<0.05). Scale bar = 5 μm. (D) CP110 foci (in green) colocalizing with centrobin (marker of daughter centriole, in red) upon CP110 depletion for 24 hr in normal serum (10%). Three different siRNAs were used. Scale bar = 5 μm.
-
Figure 5—figure supplement 1—source data 1
Related to Figure 5—figure supplement 1A and C.
GraphPad Prism file.
- https://cdn.elifesciences.org/articles/70518/elife-70518-fig5-figsupp1-data1-v3.zip
Figure 6 with 2 supplements
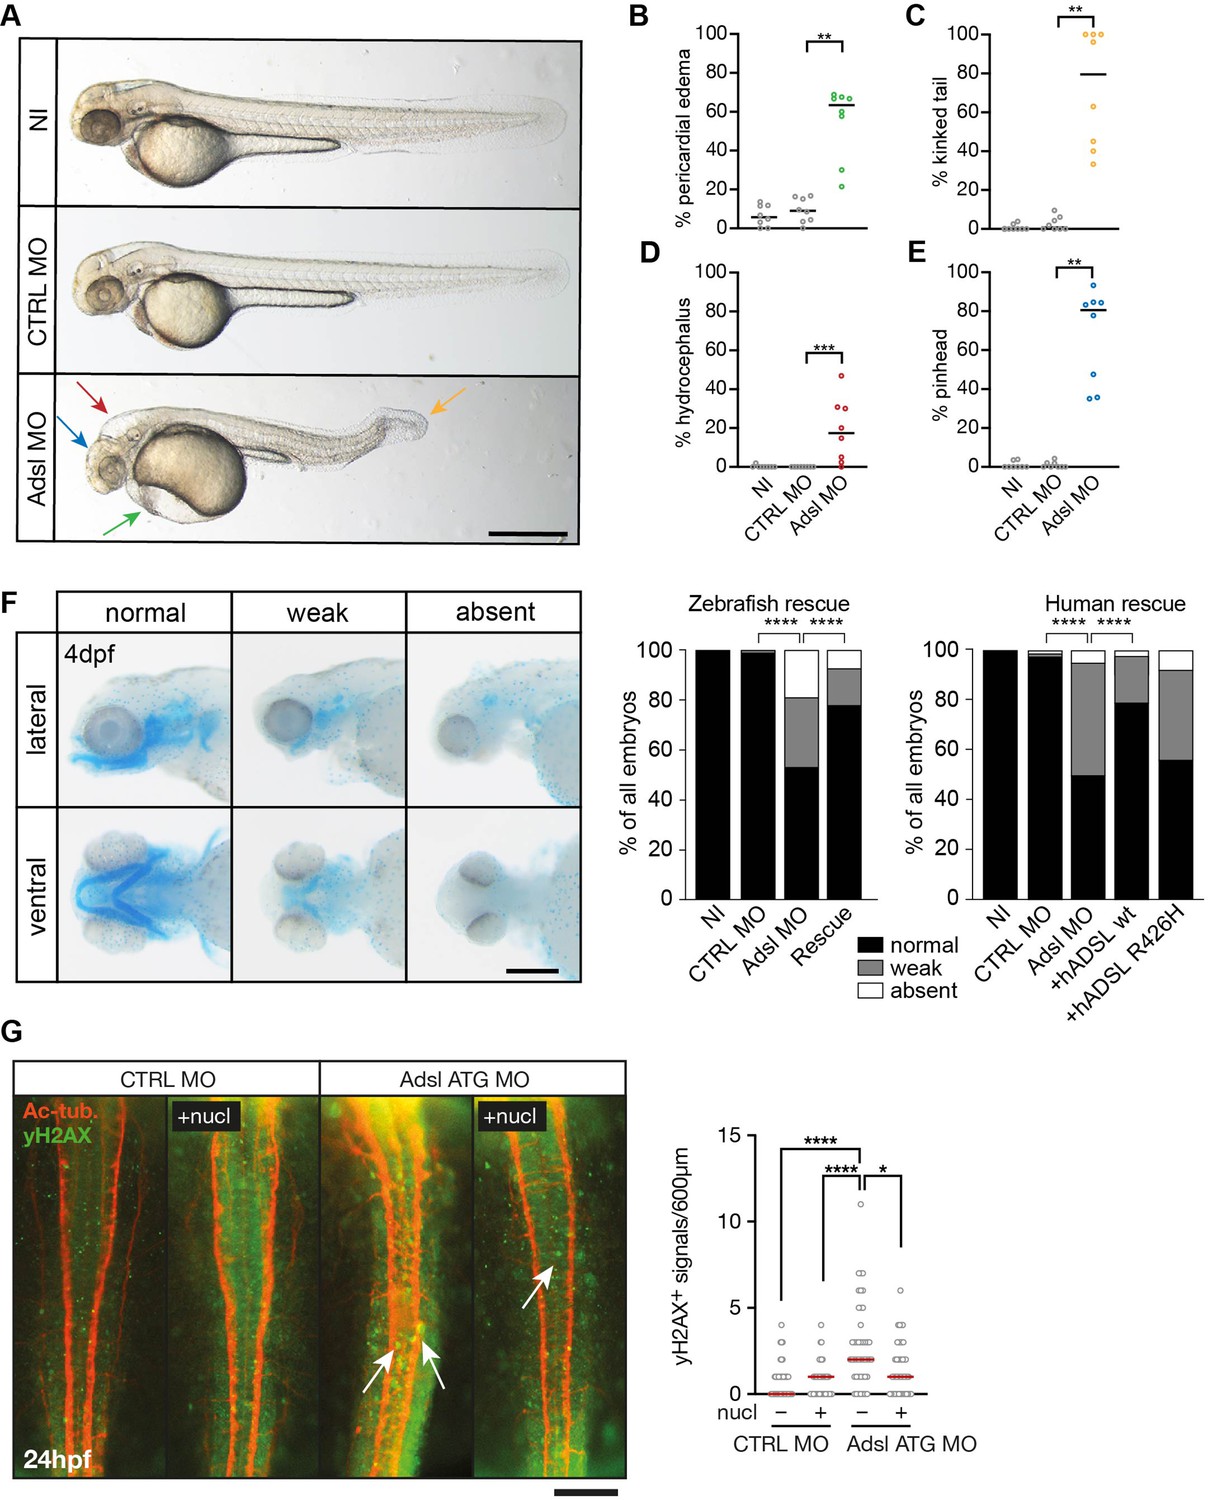
Depletion of Adsl in zebrafish causes developmental phenotypes and DNA damage signaling.
(A) Live images of 48 hr post fertilization (hpf) zebrafish embryos showing pericardial edema (green arrow), kinked tail (yellow arrow), hydrocephalus (red arrow), and pinhead (blue arrow). NI (uninjected controls), CTRL MO (embryos injected with a standard control MO), Adsl ATG MO (injected with a translation blocking MO against Adsl). Scale bar = 500 μm. (B–E) Quantification of the percentage of embryos developing the indicated phenotypes. For (B–E), each circle indicates one experiment. Data from eight experiments with 311 embryos (NI), 275 (CTRL MO), and 227 (Adsl ATG MO) is shown. Kruskal–Wallis test with Dunn’s multiple comparison. Dashes show median. **p=0.0042 (pericardial edema), **p=0.0032 (kinked tail), **p=0.0011 (pinhead), ***p=0.0005 (hydrocephalus). (F) Adsl-depleted zebrafish display skull formation defects. Cartilage staining of zebrafish embryos (4 days post fertilization [dpf]) with Alcian Blue. Embryos were classified according to the severity of their phenotype in normal staining, weak staining, or absent cartilage. Lateral and ventral view. Cartilage formation could be rescued by co-injection of capped mRNA encoding zebrafish Adsl. 6–8 experiments with a total of 178 embryos (NI), 133 (CTRL MO), 169 (Adsl ATG MO), and 123 (Rescue). Injection of mRNA encoding human wt ADSL, but not the R426H ADSLD variant, restores cartilage formation in embryos. Four experiments with a total of 116 embryos (NI), 81 (CTRL MO), 80 (Adsl ATG MO), 91 (+ hADSL wt), and 89 (+ hADSL R426H). Two-tailed Fisher’s exact test; ****p<0.0001. Scale bar = 200 μm. (G) Immunofluorescence staining of the neural tube (dorsal view) of control and Adsl-depleted embryos 24 hpf for γH2AX (green) and acetylated-tubulin (Ac-tub: red). Treatment with 60 mM nucleosides was carried out in indicated samples. Experiments with 45 embryos per treatment are shown, dashes indicate median. Data were analyzed by using Kruskal–Wallis test with Dunn’s correction. *p<0.05, ****p<0.0001. Scale bar = 300 μm. Unless indicated, comparisons are not significant.
-
Figure 6—source data 1
Related to Figure 6A–E.
GraphPad Prism file.
- https://cdn.elifesciences.org/articles/70518/elife-70518-fig6-data1-v3.zip
-
Figure 6—source data 2
Related to Figure 6F.
GraphPad Prism file.
- https://cdn.elifesciences.org/articles/70518/elife-70518-fig6-data2-v3.zip
-
Figure 6—source data 3
Related to Figure 6F.
GraphPad Prism file.
- https://cdn.elifesciences.org/articles/70518/elife-70518-fig6-data3-v3.zip
-
Figure 6—source data 4
Related to Figure 6G.
GraphPad Prism file.
- https://cdn.elifesciences.org/articles/70518/elife-70518-fig6-data4-v3.zip
Figure 6—figure supplement 1
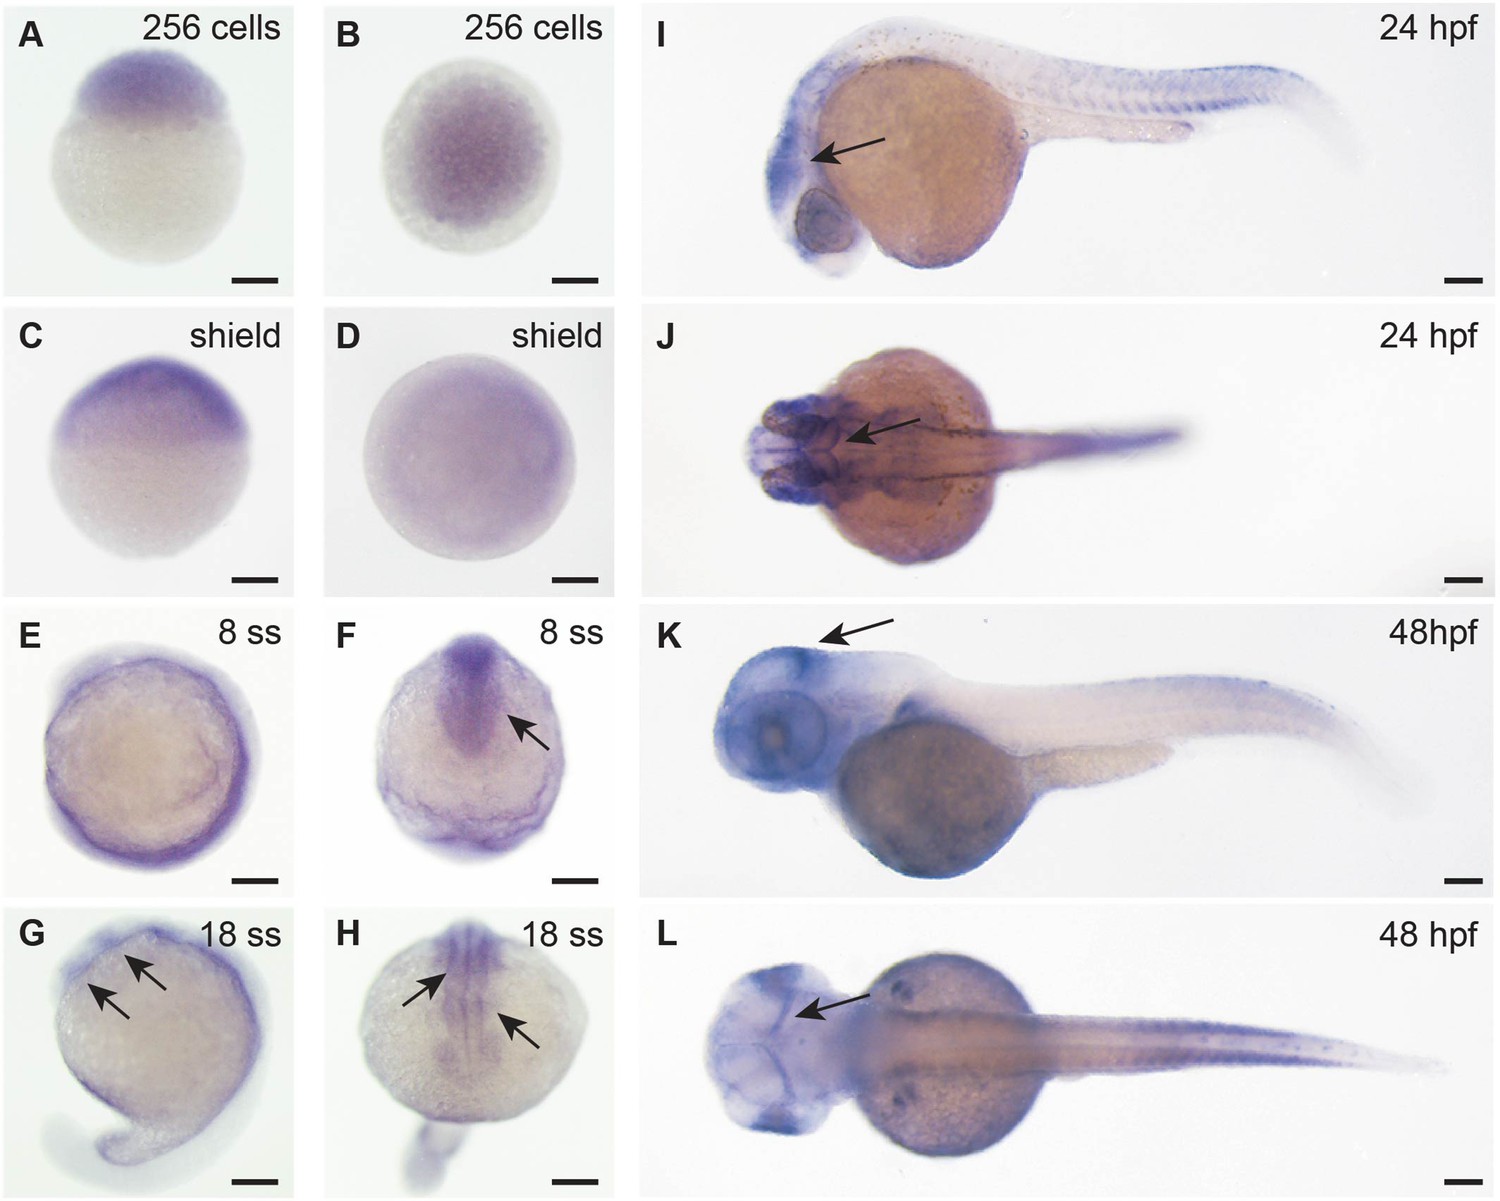
Adsl expression in zebrafish development.
Whole-mount in situ hybridization for detection of adsl expression during zebrafish development. All scale bars = 100 µm. (A–D) adsl is ubiquitously expressed. (E, F) adsl is expressed in the anterior part of the embryo including the optic primordium (arrow in F). (G, H) At 18-somite stage (ss), adsl is expressed in the developing midbrain and hindbrain (arrows). (I, J) adsl is expressed in several areas of the brain including the mesencephalon (arrows). (K, L) adsl is expressed in several areas of the brain including the midbrain hindbrain boundary (arrows). (D, F, H, J, L) Dorsal views.
Figure 6—figure supplement 2
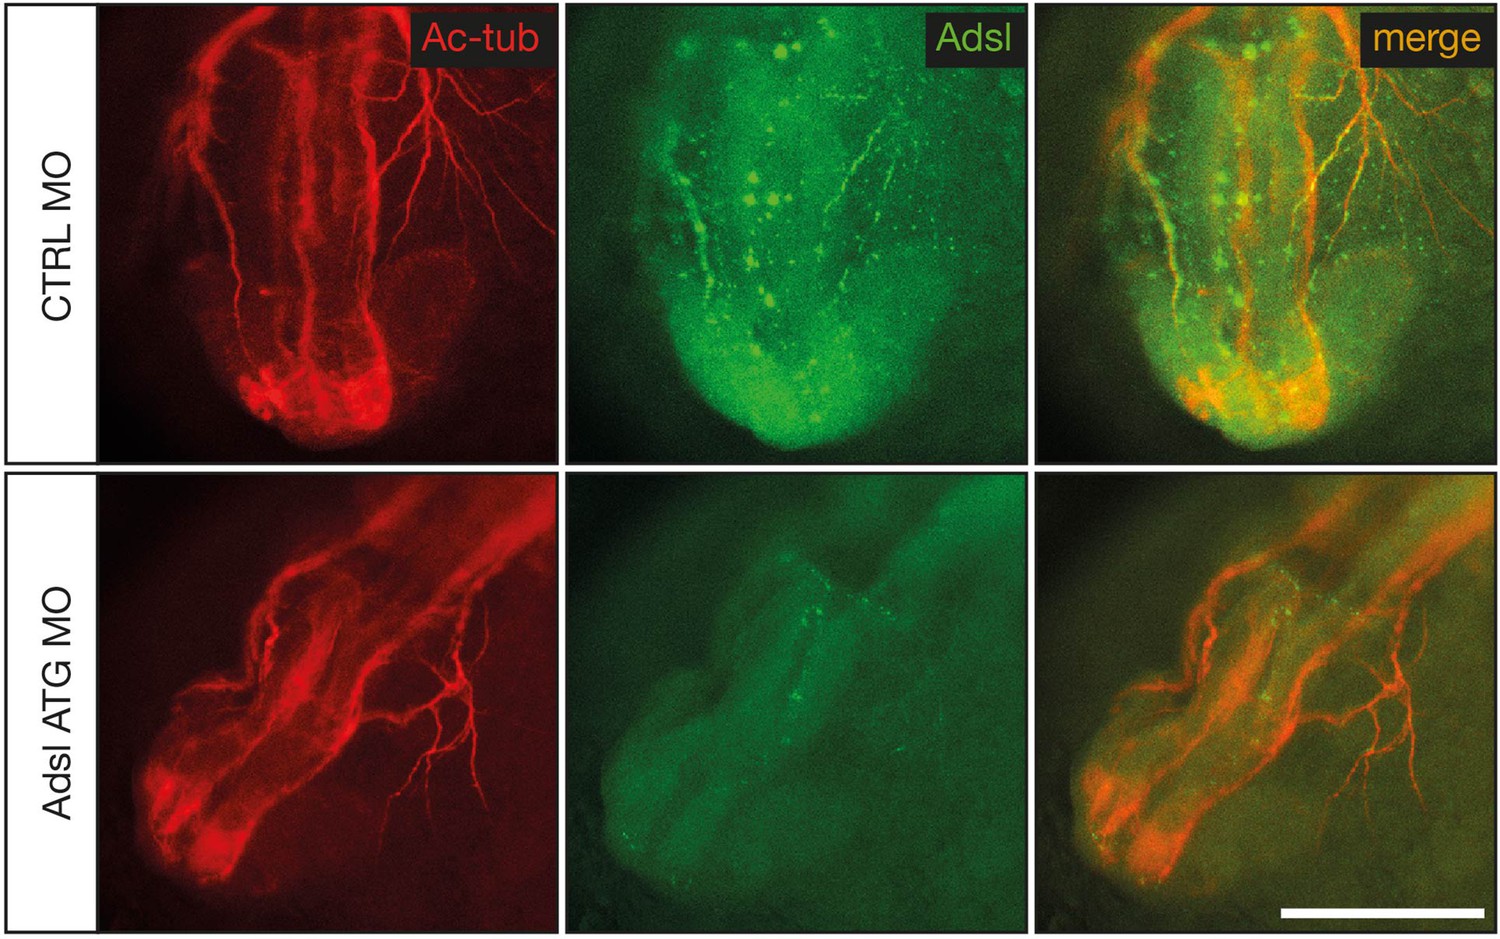
Test of knockdown efficiency.
Whole-mount antibody staining for acetylated tubulin (red) to visualize neurons and Adsl (green) in 24 hr post fertilization (hpf) zebrafish embryos. Injection of ATG morpholino resulted in a very weak expression of Adsl along axons. Images show anterior views of zebrafish heads. Scale bar = 200 µm.
Figure 7
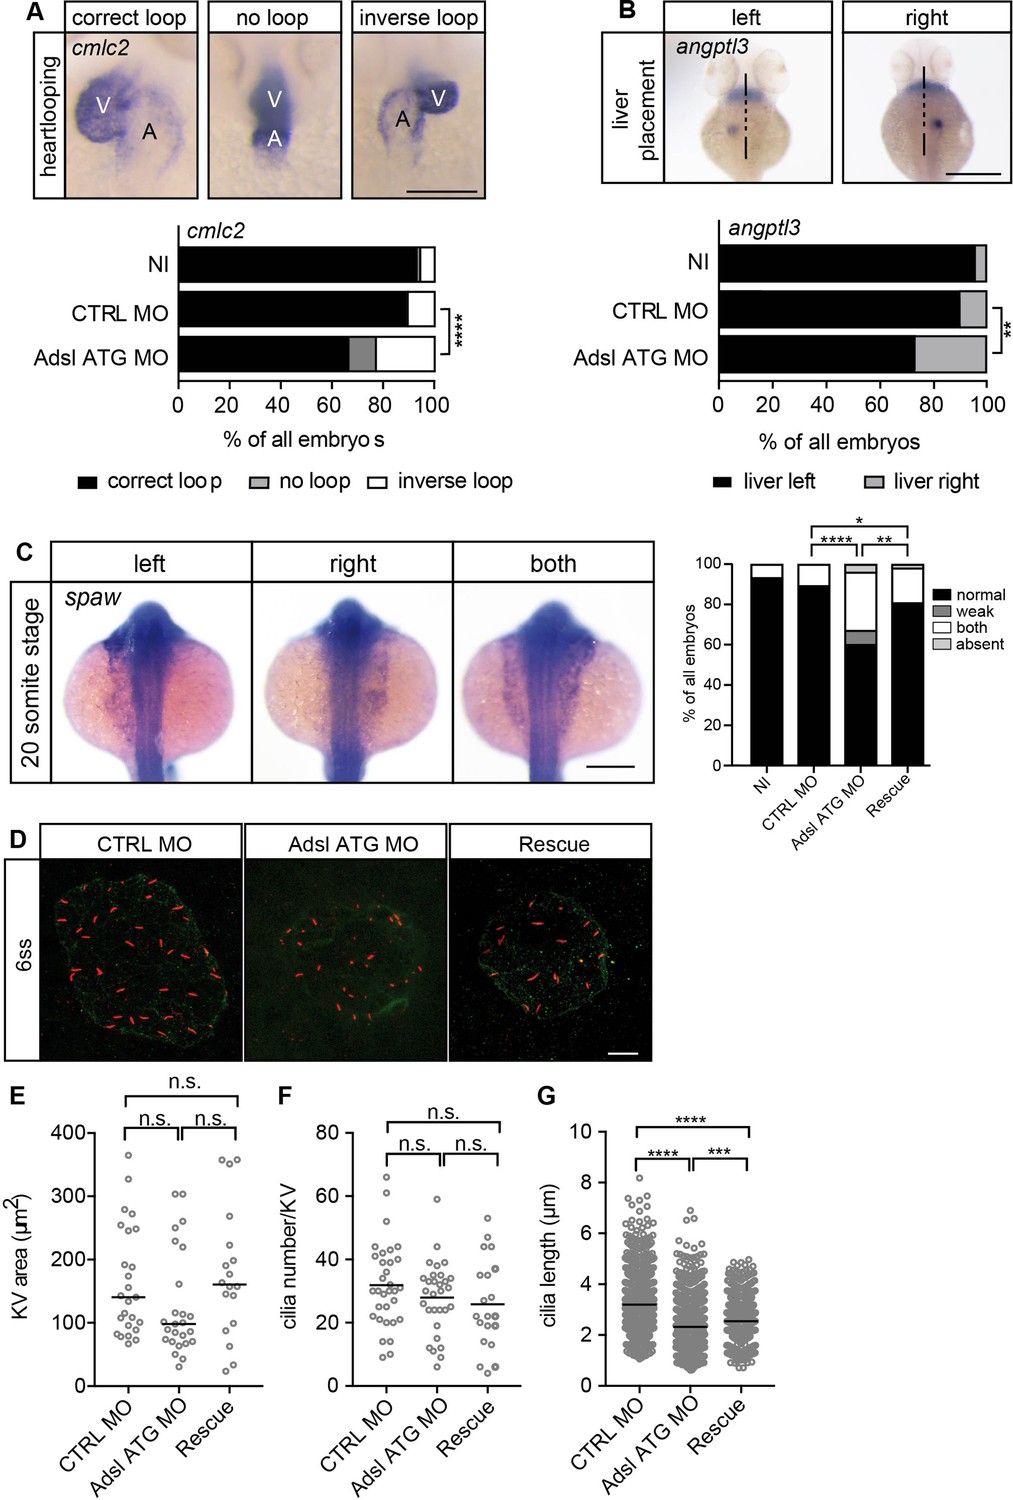
Impaired left-right (LR) asymmetry and cilium formation in the organ of laterality.
(A) At 48 hr post fertilization (hpf), the ventricle (V) of the two-chambered zebrafish heart is placed left and above the atrium (A). Adsl-depleted embryos more frequently develop inversely looped hearts or developed unlooped hearts (no loop) (as scored by whole-mount in situ hybridization for cardiac myosin light chain 2 [cmlc2]). N = 6 experiments with a total of 266 embryos (NI), 176 embryos (CTRL MO), and 188 embryos (Adsl ATG MO). Scale bar = 100 μm. (B) Whole-mount in situ hybridization for angiopoietin-like 3 (angptl3) to assess liver placement in 48 hpf embryos. Dorsal view. Scale bar = 200 μm. 185 NI, 121 CTRL MO, and 99 Adsl ATG MO embryos. (A, B) Two-tailed Fisher’s exact test; **p<0.0015, ****p<0.0001. (C) Whole-mount in situ hybridization for the left lateral plate mesoderm marker southpaw (spaw) at 20 somite stage (ss). Spaw is normally expressed in the left lateral plate mesoderm. When LR asymmetry is disturbed, spaw can be detected on the right side or on both sides. Aberrant expression of spaw in Adsl morphants. Co-injection of RNA encoding zebrafish Adsl restores proper spaw expression. Two-tailed Fisher’s exact test; *p=0.0451, **p=0.0016, ****p<0.0001. Results from five experiments with 121 embryos (NI), 142 (CTRL MO), 128 (Adsl ATG MO), and 105 (Rescue) are shown. Scale bar = 200 μm. (D) Confocal z-stacks of the Kupffer’s vesicle (KV) of six ss embryos. Cilia are stained red (acetylated tubulin), while apical cell borders were stained for PKCζ (green). Scale bar = 10 μm. (E) No significant changes in the size of the KV upon Adsl depletion. n = 25 (CTRL MO), 25 (Adsl ATG MO), and 18 embryos (rescue with zebrafish adsl RNA). Each circle is one embryo, line indicates median. Kruskal–Wallis test with Dunn’s correction. p-values: CTRL MO vs. Adsl ATG MO: 0.2582; CTRL MO vs. Rescue: >0.9999; Adsl ATG MO vs. Rescue: 0.1684. (F) No significant changes in the number of cilia per KV. n = 32 (CTRL MO), 30 (Adsl ATG MO), and 20 embryos (rescue with zebrafish adsl RNA). Each circle is one embryo, lines show means. One-way ANOVA with Sidak’s multiple comparison test. p=0.5538 (CTRL MO vs. Adsl ATG MO), 0.2844 (CTRL MO vs. Rescue), and 0.9225 (Adsl ATG MO vs. Rescue). (G) Shorter cilia in Adsl morphants can be partially elongated by co-injection of RNA encoding zebrafish Adsl. n = 960 cilia (CTRL MO), 798 (Adsl ATG MO), and 540 (Rescue). Kruskal–Wallis test with Dunn’s correction, lines indicate medians; ***p=0.0008.
-
Figure 7—source data 1
Related to Figure 7A and B.
GraphPad Prism file.
- https://cdn.elifesciences.org/articles/70518/elife-70518-fig7-data1-v3.zip
-
Figure 7—source data 2
Related to Figure 7C.
GraphPad Prism file.
- https://cdn.elifesciences.org/articles/70518/elife-70518-fig7-data2-v3.zip
-
Figure 7—source data 3
Related to Figure 7E.
GraphPad Prism file.
- https://cdn.elifesciences.org/articles/70518/elife-70518-fig7-data3-v3.zip
-
Figure 7—source data 4
Related to Figure 7F.
GraphPad Prism file.
- https://cdn.elifesciences.org/articles/70518/elife-70518-fig7-data4-v3.zip
-
Figure 7—source data 5
Related to Figure 7G.
GraphPad Prism file.
- https://cdn.elifesciences.org/articles/70518/elife-70518-fig7-data5-v3.zip
Figure 8 with 1 supplement
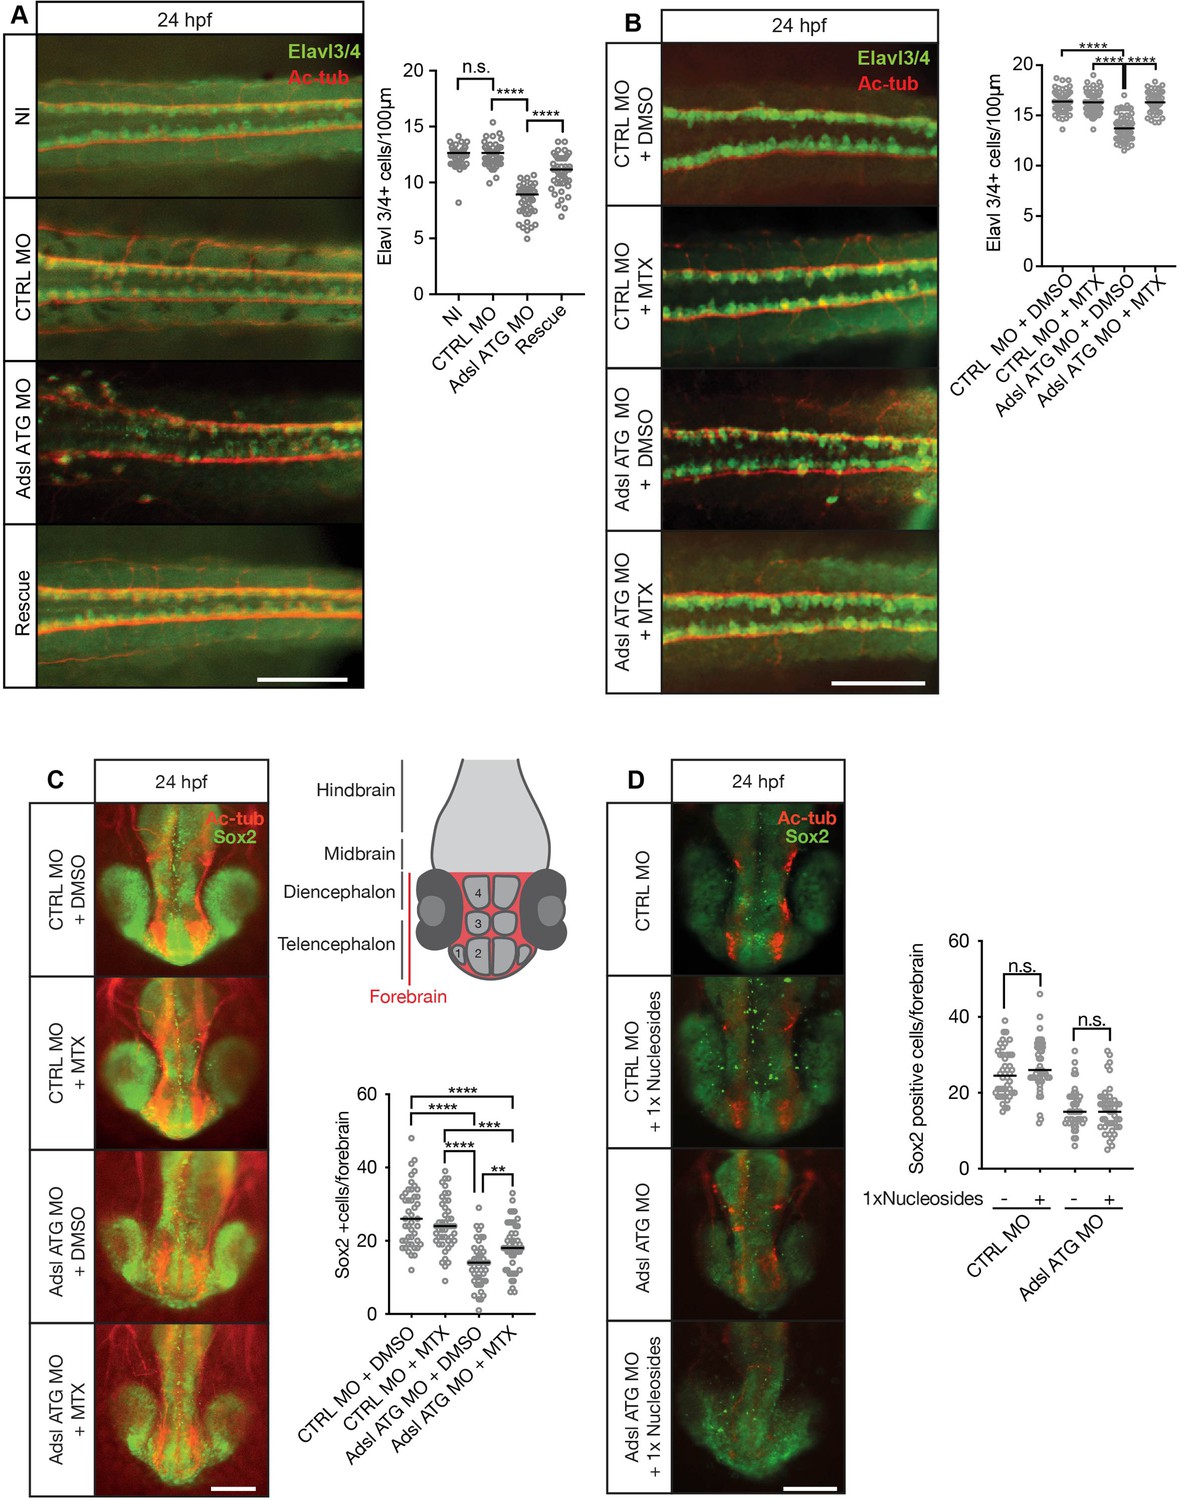
Adsl depletion reduces neuronal lineage cell numbers that can be rescued by methotrexate (MTX) treatment.
(A) Immunofluorescence whole-mount microscopy of neural tubes of 24 hr post fertilization (hpf) zebrafish embryos (dorsal view) stained for acetylated tubulin (axons, red) and Elavl3/4 (green). Fewer Elavl3/4-positive cells in Adsl-depleted embryos that can be rescued by co-injection with RNA encoding zebrafish Adsl (Rescue). Graph shows Elavl3/4 counts of individual embryos, line indicates median. Three experiments with 45 embryos (NI), 45 (CTRL MO), 45 (Adsl ATG MO), and 45 (Rescue). Kruskal–Wallis test with Dunn’s correction. ns, not significant. p>0.9999, ****p<0.0001. Scale bar = 100 μm. (B) MTX treatment rescues Elavl3/4-positive cell numbers. Staining of the neural tube (dorsal view) of 24 hpf zebrafish embryos for acetylated tubulin (red) and or Elavl3/4 (green). Adsl morphants show fewer Elavl3/4-positive cells, which could be rescued by treatment with 100 µM MTX. Five experiments with 69 (CTRL MO), 75 (CTRL MO + MTX), 63 (Adsl ATG MO), and 58 (Adsl ATG MO + MTX) embryos. One-way ANOVA with Sidak’s multiple comparison. ns p>0.9999, ****p<0.0001. Scale bar = 100 μm. (C) Forebrains of 24 hpf zebrafish embryos (left panels) stained for acetylated tubulin (red) and Sox2-positive neural progenitors (green), anterior view. Scale bar = 200 μm. Schematic of the developing brain of zebrafish embryos adapted from Vaz et al., 2019, top-right panel. The forebrain (red) is composed of the telencephalon with the olfactory bulb (1), the pallium (2), the optic recess region (3), and the diencephalon with the hypothalamus (4). Quantification of phenotypes (bottom-right panel). Adsl morphants show fewer neural progenitor cells in the forebrain, a defect that can partially be rescued with 100 µM MTX from tailbud stage on. Data were analyzed using one-way ANOVA with Sidak’s multiple comparison. Dashes show medians. Experiments with 45 embryos (CTRL MO + DMSO), 45 embryos (CTRL MO + MTX), 45 embryos (Adsl ATG MO + DMSO), and 47 embryos (Adsl ATG MO + MTX). If not shown in the graph, all other comparisons are not significant. (D) Forebrains of 24 hr post fertilization (hpf) zebrafish embryos (left panels) stained for acetylated tubulin (red) and Sox2-positive neural progenitors (green), anterior view. Scale bar = 100 μm. Quantification of phenotypes (right panel). Adsl morphants show similar neural progenitor cells in the forebrain regardless of supplementation with 1× nucleosides. Data were analyzed using one-way ANOVA with Sidak’s multiple comparison, n.s. = p>0.9999. Dashes show medians. Experiments with 45 embryos (CTRL MO + DMSO), 45 embryos (CTRL MO + MTX), 45 embryos (Adsl ATG MO + DMSO), and 47 embryos (Adsl ATG MO + MTX).
-
Figure 8—source data 1
Related to Figure 8A.
GraphPad Prism file.
- https://cdn.elifesciences.org/articles/70518/elife-70518-fig8-data1-v3.zip
-
Figure 8—source data 2
Related to Figure 8B.
GraphPad Prism file.
- https://cdn.elifesciences.org/articles/70518/elife-70518-fig8-data2-v3.zip
-
Figure 8—source data 3
Related to Figure 8C.
GraphPad Prism file.
- https://cdn.elifesciences.org/articles/70518/elife-70518-fig8-data3-v3.zip
-
Figure 8—source data 4
Related to Figure 8D.
GraphPad Prism file.
- https://cdn.elifesciences.org/articles/70518/elife-70518-fig8-data4-v3.zip
Figure 8—figure supplement 1
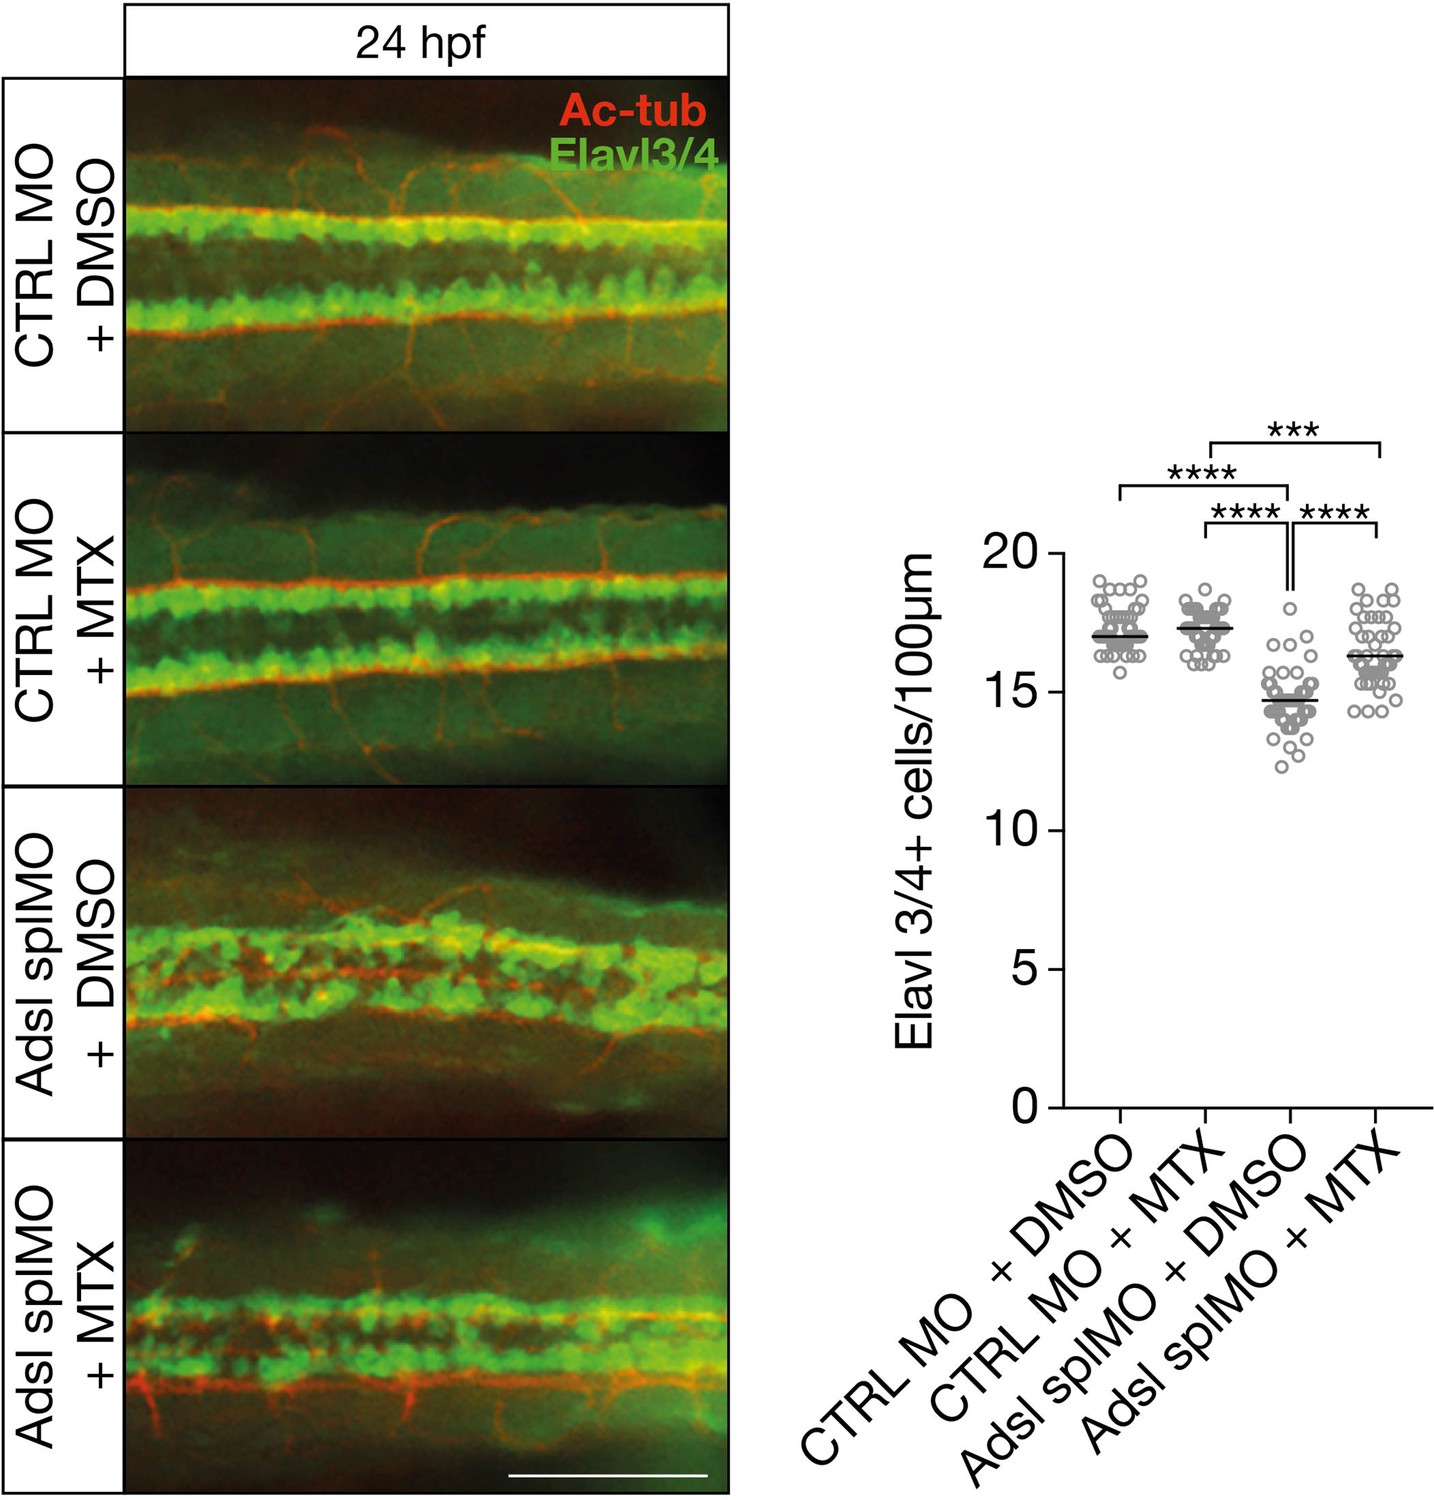
Dorsal view of part of the neural tube of 24 hr post fertilization (hpf) zebrafish embryos (left panels).
Acetylated tubulin (Ac-tub) is shown in red. Neural cells are stained for Elavl3+4 (green). Adsl morphants (splMO) show fewer neuronal cells, which can be partially rescued by treatment with 100 µM methotrexate (MTX) from tailbud stage on. Data were analyzed by using one-way ANOVA with Sidak’s multiple comparison. Dashes show median. Experiments with 45 embryos (CTRL MO + DMSO), 45 embryos (CTRL MO + MTX), 45 embryos (Adsl splMO + DMSO), and 45 embryos (Adsl splMO + MTX). If not shown in graph, all other comparisons are not significant. Scale bar = 100 µm. Source data is provided in Figure 8—figure supplement 1—source data 1.
-
Figure 8—figure supplement 1—source data 1
Related to Figure 8—figure supplement 1.
GraphPad Prism file.
- https://cdn.elifesciences.org/articles/70518/elife-70518-fig8-figsupp1-data1-v3.zip
Tables
Key resources table
| Reagent type (species) or resource | Designation | Source or reference | Identifiers | Additional information |
|---|---|---|---|---|
| Gene (Homo sapiens) | ADSL isoform1 | NCBI Gene | CCDS14001.1 | |
| Gene (Gallus gallus) | Adsl | GenBank | M37901.1 | |
| Gene (Danio rerio) | adsl | GenBank | NM_199899.2 | |
| Gene (D. rerio) | angptl3 | GenBank | AF379604 | |
| Gene (D. rerio) | spaw | GenBank | NM_180967 | |
| Gene (D. rerio) | cmlc2 | GenBank | PMID:10491254 | |
| Strain, strain background (Gallus gallus, eggs) | White leghorn fertilized eggs | Granja Gilbert S.A. | ||
| Strain, strain background (D. rerio, male and female) | AB | ZFIN | ZFIN ID: ZDB-GENO-960809-7 | |
| Strain, strain background (D. rerio, male and female) | EK | ZFIN | ZFIN ID: ZDB-GENO-990520-2 | |
| Cell line (human) | hTERT-RPE-1 | ATCC | Cat# CRL-4000;RRID:CVCL_4388 | Authenticated by STR testing, routinely tested for mycoplasma and found negative |
| Cell line (human) | HeLa | ATCC | Cat# CCL-2;RRID:CVCL_0030 | Authenticated by STR testing, routinely tested for mycoplasma and found negative |
| Cell line (human) | hTERT-RPE-1 p53KO | Kind gift from Bryan Tsou, Sloan-Kettering Institute | PMID:27371829 | P53 genotype confirmed by western blotting, routinely tested for mycoplasma and found negative. |
| Cell line (human) | AD-293 | Agilent | Cat# 240085;RRID:CVCL_9804 | Authenticated by STR testing, routinely tested for mycoplasma and found negative. |
| Transfected construct (human) | pLenti-CMV-GFP-BLAST (659-1) | Addgene | Cat# 17445;RRID:Addgene_17445 | pLenti CMV GFP Blast (659-1) was a gift from Eric Campeau and Paul Kaufman (Addgene plasmid # 17445; http://n2t.net/addgene:17445; RRID:Addgene_17445) |
| Transfected construct (human) | pMDLg/pRRE | Addgene | Cat# 12251;RRID:Addgene_12251 | pMDLg/pRRE was a gift from Didier Trono (Addgene plasmid # 12251; http://n2t.net/addgene:12251; RRID:Addgene_12251) |
| Transfected construct (human) | pCMV-VSV-G | Addgene | Cat# 8454;RRID:Addgene_8454 | pCMV-VSV-G was a gift from Bob Weinberg (Addgene plasmid # 8454; http://n2t.net/addgene:8454; RRID:Addgene_8454) |
| Transfected construct (human) | pRSV-REV | Addgene | Cat# 12253;RRID:Addgene_12253 | pRSV-Rev was a gift from Didier Trono (Addgene plasmid # 12253; http://n2t.net/addgene:12253; RRID:Addgene_12253) |
| Antibody | Anti-acetylated α-tubulin (6-11B-1) (mouse monoclonal) | Santa Cruz Biotechnology, Inc | Cat# sc-23950;RRID:AB_628409 | IF (1:1000 human cells) |
| Antibody | Anti-Elav3/4 (rabbit polyclonal) | GeneTex | Cat# GTX128365;RRID:AB_2885764 | IF (1:1000 human cells) |
| Antibody | Anti-SOX2 (rabbit polyclonal) | Abcam | Cat# ab97959;RRID:AB_2341193 | IF (1:1000 human cells) |
| Antibody | Anti-γH2AX (rabbit polyclonal) | GeneTex | Cat# GTX127342;RRID:AB_2833105 | IF (1:400 human cells) |
| Antibody | Anti-AKT (pan) (rabbit polyclonal) | Cell Signaling | Cat# 2920;RRID:AB_1147620 | Western (1:2000 human cells) |
| Antibody | Anti-AKT p-S473 (rabbit polyclonal) | Cell Signaling | Cat# 4060;RRID:AB_2315049 | Western (1:2000 human cells) |
| Antibody | Anti-vinculin (rabbit polyclonal) | Cell Signaling | Cat# 13901; RRID:AB_2728768 | Western (1:2000 human cells) |
| Antibody | Anti-ADSL (rabbit polyclonal) | MilliporeSigma | Cat# HPA000525;RRID:AB_1078106 | IF (1:200 fish, 1:100 human cells) |
| Antibody | Anti-PKCζ(C-20) (rabbit polyclonal) | Santa Cruz Biotechnology, Inc | Cat# sc-216;RRID:AB_2300359 | IF (1:500 fish) |
| Antibody | Alexa Fluor 568 donkey anti-mouse IgG (donkey polyclonal) | Molecular Probes | Cat# A10037;RRID:AB_2534013 | IF (1:1000 fish) |
| Antibody | Alexa Fluor 488 donkey anti-rabbit IgG (donkey polyclonal) | Molecular Probes | Cat# A32790;RRID:AB_2762833 | IF (1:1000 fish) |
| Antibody | Alexa Fluor 594 goat anti-mouse IgG cross-adsorbed (goat polyclonal) | Invitrogen/Thermo Fisher Scientific | Cat# A32742;RRID:AB_2762825 | IF (1:400 human cells) |
| Antibody | Alexa Fluor 488 goat anti-rabbit IgG cross-adsorbed (goat polyclonal) | Invitrogen/Thermo Fisher Scientific | Cat# A11034;RRID:AB_2576217 | IF (1:400 human cells) |
| Antibody | Anti-digoxigenin-AP Fab fragments (sheep polyclonal) | Roche | Cat# 11093274910;RRID:AB_514497 | ISH (1:5000 fish) |
| Antibody | Anti-actin (AC-40) | MilliporeSigma | Cat# A4700;RRID:AB_476730 | Western (1:1500 human cells) |
| Antibody | Anti-Ki67 (mouse monoclonal) | Novocastra | Cat# NCL-Ki-67p;RRID:AB_442102 | IF (1:500 human cells) |
| Antibody | Anti-p53 (1C12) | Cell Signaling | Cat# 2524;RRID:AB_331743 | IF (1:100 human cells) |
| Antibody | Anti-vimentin (rabbit polyclonal) | Abcam | Cat# ab45939;RRID:AB_2257290 | IF (1:100 human cells) |
| Antibody | Anti-CK20 (Ks20.8) (mouse monoclonal) | Dako/Agilent | Cat# GA77761-2 | IF (1:200 human cells) |
| Antibody | Anti-53BP1 (rabbit polyclonal) | Novus Biologicals | Cat# NB100-304;RRID:AB_10003037 | IF (1:400 human cells) |
| Antibody | Anti-γH2AX-pS139 (rabbit polyclonal) | Santa Cruz Biotechnology, Inc | Cat# sc-517336;RRID:AB_2133718 | IF (1:100 human cells) |
| Antibody | Anti-RPA32 | MilliporeSigma | Cat# NA19L;RRID:AB_565123 | IF (1:100 human cells) |
| Antibody | Anti-SOX2 (rabbit polyclonal) | Invitrogen/Thermo Fisher Scientific | Cat# 48-1400;RRID:AB_2533841 | IF (1:500 chicken) |
| Antibody | Anti-ELAVL3/4 (HuC/HuD) 16A11 | Molecular Probes/Thermo Fisher Scientific | Cat# A21271;RRID:AB_221448 | IF (1:500 chicken) |
| Antibody | Anti-pH3S10 (rabbit polyclonal) | MilliporeSigma | Cat# 06-570;RRID:AB_310177 | IF (1:500 chicken) |
| Antibody | Anti-cleaved caspase-3 (CC3) | MilliporeSigma | Cat# AB3623;RRID:AB_91556 | IF (1:500 chicken) |
| Antibody | Anti-TUJ1 | Covance | Cat# MMS-435P;RRID:AB_2313773 | IF (1:1000 chicken) |
| Antibody | PAX6 (mouse monoclonal) | DSHB | Cat# AB_528427;RRID:AB_528427 | IF (1:250 chicken) |
| Antibody | Anti-ARL13B (C5) (mouse monoclonal) | Santa Cruz Biotechnology | Cat# sc-515784;RRID:AB_2890034 | IF (1:100) |
| Antibody | Anti-pericentrin (PCNT) (rabbit polyclonal) | Novus Biologicals | Cat# NBP1-87772;RRID:AB_11018354 | IF (1:400) |
| Antibody | Anti-CP110 (rabbit polyclonal) | Kind gift from Andrew Holland | Unpublished reagent | IF (1:1000) |
| Antibody | Anti-centrin (20H5) (mouse monoclonal) | MilliporeSigma | Cat# 04-1624;RRID:AB_AB_10563501 | IF (1:1000) |
| Antibody | Anti-centrobin (mouse monoclonal) | Kind gift from Ciaran Morrison | PMID:29440264 | IF (1:500) |
| Recombinant DNA reagent | pLenti-CMV-ADSL*-EGFP siRNA resistant | This paper | ||
| Recombinant DNA reagent | pCR2.1-TOPO | Invitrogen/Thermo FisherScientific | Cat# 450640;RRID:Addgene_26778 | |
| Recombinant DNA reagent | pCRII-zfAdsl | This paper | Template for generation of antisense in situ probe (zebrafish) | |
| Recombinant DNA reagent | pCS2+ Flag-zfAdsl | This paper | Template for generation of capped mRNA (zebrafish) | |
| Recombinant DNA reagent | pCS2+ Flag-zfAdsl MO mut | This paper | Template for generation of capped mRNA (insensitive to ATG MO) (zebrafish) | |
| Recombinant DNA reagent | pCS2+ hAdsl | This paper | Template for generation of capped mRNA (zebrafish) | |
| Recombinant DNA reagent | pCS2+ hAdslR426H | This paper | Template for generation of capped mRNA (zebrafish) | |
| Recombinant DNA reagent | pSHIN | Kind gift of Dr. Kojima | PMID:24741441 | |
| Sequence-based reagent | ADSL Smartpool siRNA | Dharmacon | Cat# M-010986-01-0005 | |
| Sequence-based reagent | ADSL siRNA#2 | MilliporeSigma | Custom | CAAGAUUUGCACCGACAUA |
| Sequence-based reagent | CP110 siRNA#1 | MilliporeSigma | Custom | GCAAAACCAGAAUACGAGAUU |
| Sequence-based reagent | CP110 siRNA#2 | MilliporeSigma | Custom | CAAGCGGACUCACUCCAUATT |
| Sequence-based reagent | CP110 siRNA#3 | MilliporeSigma | Custom | TAGACTTATGCAGACAGATAA |
| Sequence-based reagent | EGFP siRNA | MilliporeSigma | Custom | GGCUACGUCCAGGAGCGCCGCACC |
| Sequence-based reagent | GL2 siRNA (siC, targets luciferase) | MilliporeSigma | Custom, published in PMID:11373684 | CGUACGCGGAAUACUUCGA |
| Sequence-based reagent | ADSL-BsiWI-F | MilliporeSigma | Custom | 5′AAAACGTACGATGGCGGCTGGAGGCGATCAT3′ |
| Sequence-based reagent | ADSL-EcoR1-R | MilliporeSigma | Custom | 5′TTTTGAATTCCAGACATAATTCTGCTTTCA3′ |
| Sequence-based reagent | shCONTROL | MilliporeSigma | Custom, for control in chicken embryo | 5′-CCGGTCTCGACGGTCGAGT-3′ |
| Sequence-based reagent | shADSL | MilliporeSigma | Custom, for ADSL depletion in chicken embryo | 5′-GAGCTGGACAGATTAGTGA-3′ |
| Sequence-based reagent | Adsl ATG MO | GeneTools | Custom, for Adsl depletion in fish | 5′-TCCCTCCATGCCTGCAGCGGTTAAA |
| Sequence-based reagent | Adsl splMO | GeneTools | Custom, for Adsl depletion in fish | 5′-CCAACTGTGGGAGAGAGCGACTGTA |
| Sequence-based reagent | Std. CTRL MO | GeneTools | Custom, for control in fish | 5′-CCTCTTACCTCAGTTACAATTTATA |
| Commercial assay or kit | Click-iT EdU imaging kit | Invitrogen/Thermo Fisher Scientific | Cat# C10340 | |
| Commercial assay or kit | TOPO TA cloning | Invitrogen/Thermo Fisher Scientific | Cat# 450640 | |
| Commercial assay or kit | AmpliCapTM SP6 High Yield Message Maker Kit | Cellscript | Cat# C-AC0706 | |
| Commercial assay or kit | QuikChange Lightning mutagenesis kit | Thermo Fisher Scientific | Cat# 210518 | |
| Commercial assay or kit | DC protein assay | Bio-Rad | Cat# 500-0111 | |
| Commercial assay or kit | Immobilion ECL Ultra | MilliporeSigma | Cat# WBULS0100 | |
| Chemical compound, drug | Formaldehyde, 37% | MilliporeSigma | Cat# 47608-500ML-F | Used at 4% for cell fixation |
| Commercial assay or kit | Senescence β-Galactosidase Staining Kit | Cell Signaling | Cat# 9860 | |
| Commercial assay or kit | High Capacity RNA-to-cDNA Kit | Applied Biosystems | Cat# 4387406 | |
| Commercial assay or kit | TaqMan Universal PCR Master Mix | Thermo Fisher Scientific | Cat# 4324018 | |
| Commercial assay or kit | Quick ligation kit | NEB | Cat# 4324018 | |
| Chemical compound, drug | Lipofectamine RNAiMAX | Thermo Fisher Scientific | Cat# 13778150 | |
| Chemical compound, drug | Opti-MEM | Gibco | Cat# 31985070 | |
| Chemical compound, drug | DMEM-F12 | Gibco | Cat# 21331046 | |
| Chemical compound, drug | Tri-reagent | MilliporeSigma | Cat# T2494 | |
| Chemical compound, drug | KOD Hot start DNA polymerase | MilliporeSigma | Cat# 71086-3 | |
| Chemical compound, drug | Polyethylenimine (PEI), linear (MW 25,000) | Polyscience Euro | Cat# 23966-2 | |
| Chemical compound, drug | Bovine serum albumin | MilliporeSigma | Cat# F7524 | 10% in culture media |
| Chemical compound, drug | Trypan Blue | Gibco/Thermo FisherScientific | Cat# 15250061 | 0.4% solution |
| Chemical compound, drug | Triton X-100 (TX-100) | MilliporeSigma | Cat# T8787 | |
| Chemical compound, drug | Phosphatase inhibitor cocktail 2 | MilliporeSigma | Cat# P5726-5ML | 1× in lysis buffer |
| Chemical compound, drug | Phosphatase inhibitor cocktail 3 | MilliporeSigma | Cat# P0044-5ML | 1× in lysis buffer |
| Chemical compound, drug | cOmplete, EDTA free Protease inhibitors | Roche/MilliporeSigma | Cat# 4693132001 | 1× in lysis buffer |
| Chemical compound, drug | Alcian Blue Solution | Sigma | Cat# B8438 | |
| Chemical compound, drug | MTX (methotrexate) | Cayman Chemical | Cat# 13960 | 100 µM in DMSO |
| Chemical compound, drug | EmbryoMax Nucleosides 100× | Merck | Cat# ES-008-D | 1× in media or saline |
| Chemical compound, drug | TWEEN 20 | Sigma | Cat# P2287 | |
| Chemical compound, drug | MRT00252040 | Kindly provided by Simon Osborne, LifeArc, London, UK | PAICS inhibitorStock solution 2 mM in DMSO, used at final concentration of 2 µM in DMSO | |
| Chemical compound, drug | Methotrexate (MTX) | MilliporeSigma | Cat# M8407-100MG | DHFR inhibitorStock solution of 100 µM and used at final concentration of 4 µM in DMSO |
| Chemical compound, drug | KU-55933 | Selleckchem | Cat# 118500-2MG | ATM inhibitorUsed at final concentration of 5 µM in DMSO in cell culture media |
| Chemical compound, drug | Penicillin–streptomycin (10K U/ml) | Thermo Fisher Scientific | Cat# 15140122 | Used 1% in cell culture media |
| Chemical compound, drug | SAICAr | CarboSynth | Cat# NS16860 | Stock solution 20 mg/ml in water and used as final concentration at 1 mg/ml in cell culture media |
| Chemical compound, drug | Doxorubicin | MilliporeSigma | Cat# D1515 | Used at 1 µg/ml in cell culture media |
| Chemical compound, drug | AscI | NEB | Cat# R0558S | |
| Chemical compound, drug | NotI-HF | NEB | Cat# R3189S | |
| Chemical compound, drug | Carbenicillin | MilliporeSigma | Cat# C9231-1G | |
| Chemical compound, drug | Blasticidin | Invitrogen/Thermo FisherScientific | Cat# A1113902 | |
| Chemical compound, drug | Paraformaldehyde (PFA) | PanReac AppliChem | Cat# 14145.1211 | Used at 2% in cells |
| Software, algorithm | GraphPad Prism 7–9 | GraphPad Prism | RRID:SCR_002798 | Version: 7.0e, 8.4.3, 9.3.0 |
| Software, algorithm | Adobe Photoshop | Adobe Photoshop | RRID:SCR_014199 | Version: 22.4.2 |
| Software, algorithm | Adobe Illustrator | Adobe Illustrator | RRID:SCR_010279 | Version: 24.3, 25.2.3 |
| Software, algorithm | Fiji | Fiji | RRID:SCR_002285 | Version: 2.0.0-rc-69/1.52p |
| Software, algorithm | LAS AF | Leica | RRID:SCR_013673 | Version: 3.7.3.23245 |
Additional files
Download links
A two-part list of links to download the article, or parts of the article, in various formats.
Downloads (link to download the article as PDF)
Open citations (links to open the citations from this article in various online reference manager services)
Cite this article (links to download the citations from this article in formats compatible with various reference manager tools)
Pathway-specific effects of ADSL deficiency on neurodevelopment
eLife 11:e70518.
https://doi.org/10.7554/eLife.70518


