3′HS1 CTCF binding site in human β-globin locus regulates fetal hemoglobin expression
- Center for Epigenetics, Van Andel Research Institute, United States
- Department of Computational Medicine and Bioinformatics, University of Michigan, United States
- Cell and Development Biology, University of Michigan, United States
- Department of Research and Development, Central Blood Institute, Japanese Red Cross Society, Japan
- Cell Engineering Division, RIKEN BioResource Research Center, Japan
- Faculty of Medicine, University of Tsukuba, Japan
Figures
Figure 1 with 3 supplements
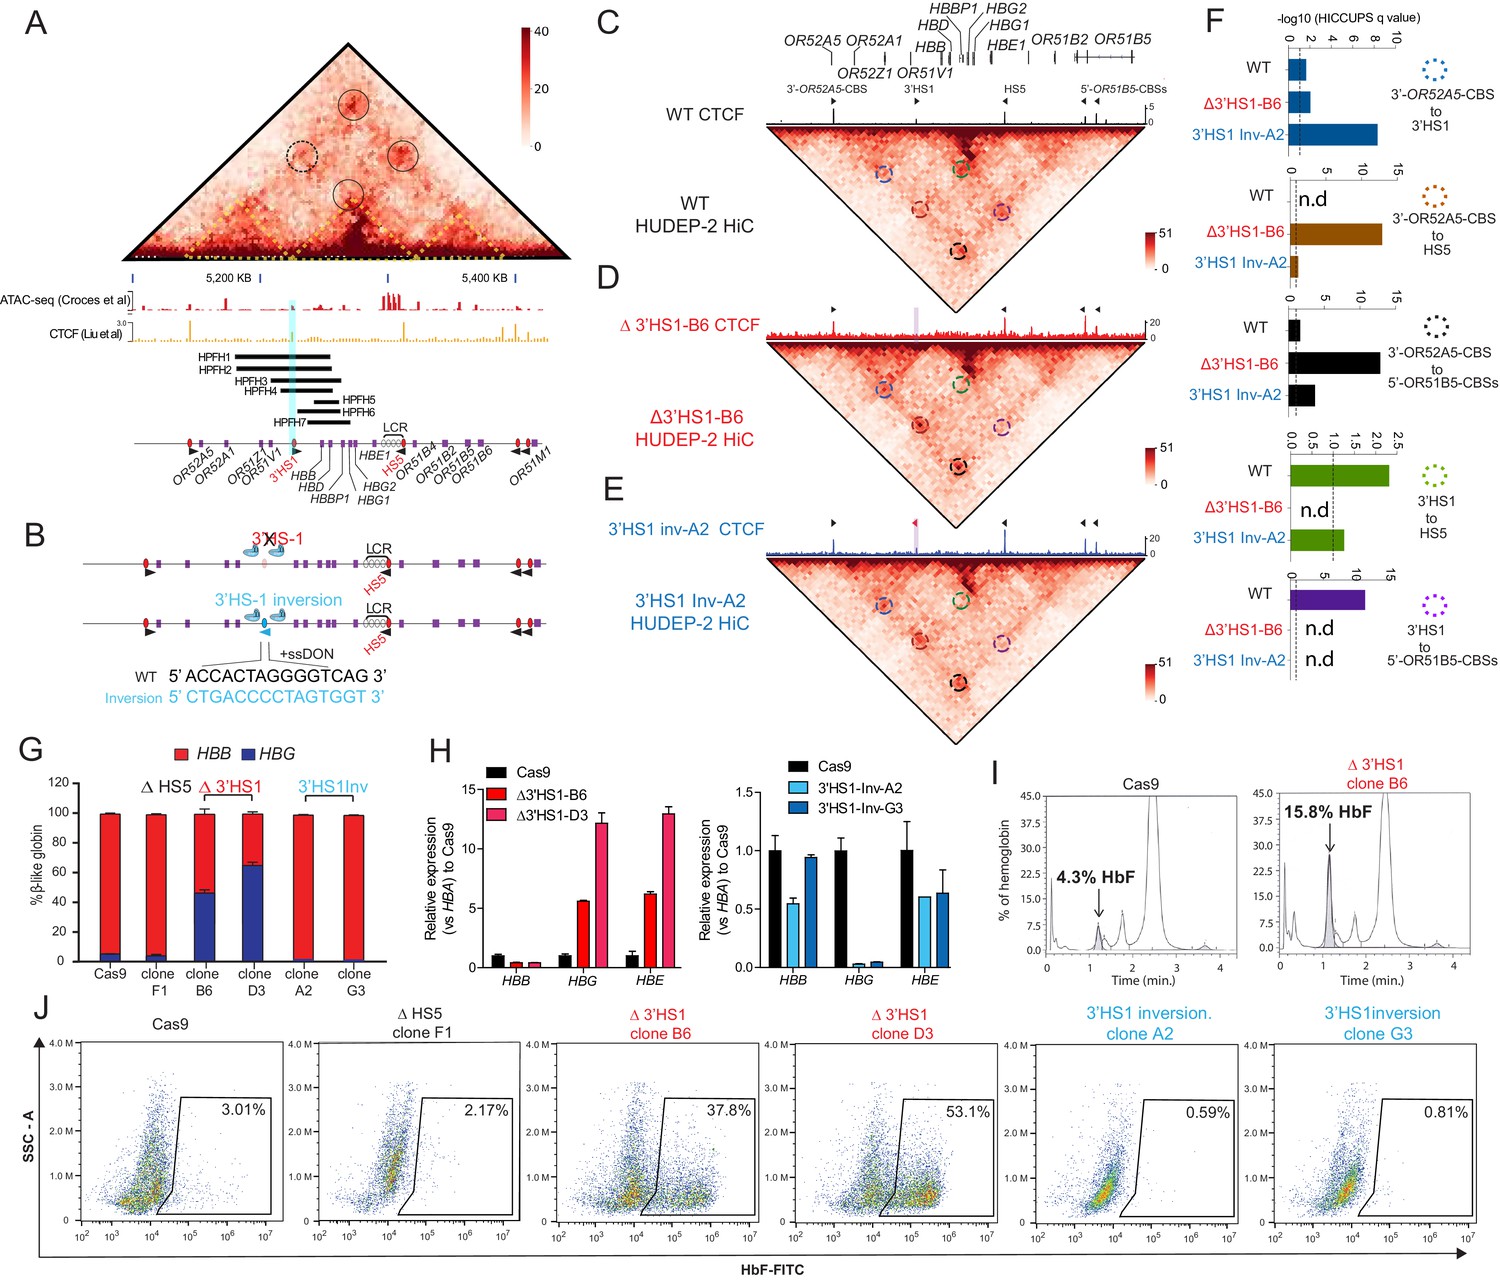
3′HS1 modulates the hemoglobin gene expression in β-globin gene cluster.
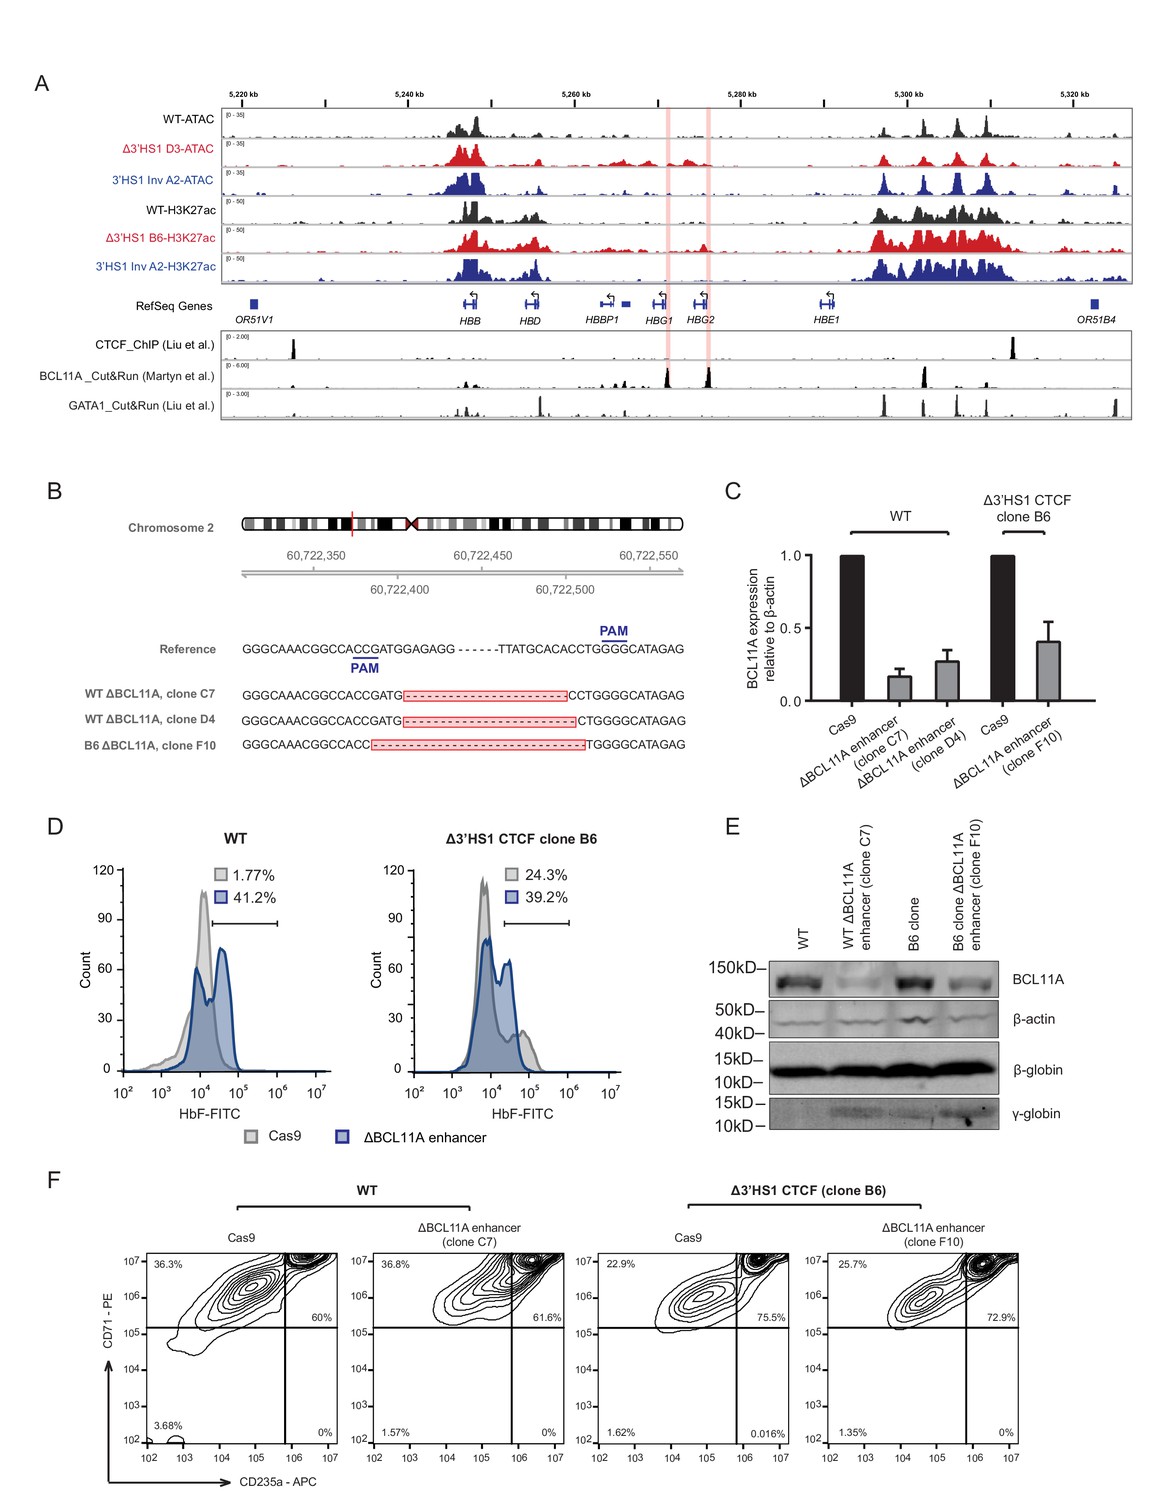
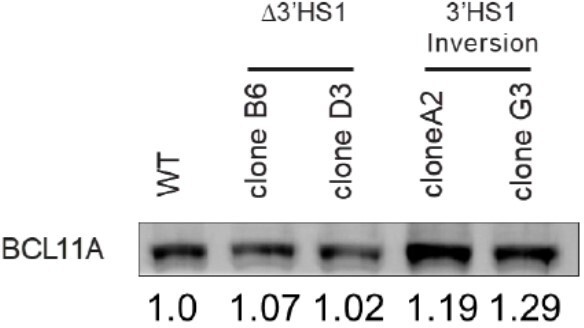
(A) Genome-wide Hi-C interaction map and regulatory landscape around β-globin gene cluster in human HUDEP2 cells. ATAC-seq and CTCF track of HUDEP2 cells (Liu et al., 2018) is shown in the lower panel. Black cycle indicates the position of loops previously identified (Huang et al., 2017). Yellow dotted line indicates the three sub-TAD domains identified previously (Huang et al., 2017). HPFH1-7 deletion is illustrated and 3′HS1 is marked in blue shade. (B). The scheme of CTCF binding motif orientation engineering in HUDEP-2 cells. (C–E) In situ Hi-C contact map around β-globin gene cluster in HUDEP-2 cells of wild type (C), 3′HS1 deletion (D), and 3′HS1 inversion (E). CTCF CUT&RUN tracks of WT (Liu et al., 2018), 3′HS1 deletion and 3′HS1 inversion HUDEP-2 cells are shown on the top of corresponding Hi-C plots. All loops that called in the HUDEP2 cells of three genotypes are marked with circles of different colors. (F) The HiCCUPS quantification of loops interaction strength by q value in β-globin locus. Dotted line annotates q = 0.1. n.d.: not detected by HiCCUPS (q value > 0.1). (G) The composition of β-like globin HUDEP-2 cells with 3′HS1 deletion. qPCR measurement of β-like globin HUDEP-2 in two clones (B6 and D3) of Δ3′HS1 HUDEP-2 cells is shown. Mean ± SD is displayed, n = 3. (H) Left panel: relative expression of HBE, HBG (probe measures both HBG1 and HBG2), and HBB in the 3′HS1 deleted HUDEP-2 clone B6. Mean ± SD is displayed, n = 3. Right panel: relative expression of HBE, HBG (probe measures both HBG1 and HBG2), and HBB in the 3′HS1 inverted HUDEP-2 clone A2. Mean ± SD is displayed, n = 3. (I) The right panel shows the High-performance liquid chromatography (HPLC) for globin composition in Cas9-treated HUDEP-2 control and 3′HS1 deletion clone B6. (J) Flow cytometry plot of HbF in HUDEP-2 cell clones with 3′HS1 deletion (B6 and D3), 3′HS1 inversion (A2 and G3), and ΔHS5 clone.
Figure 1—figure supplement 1
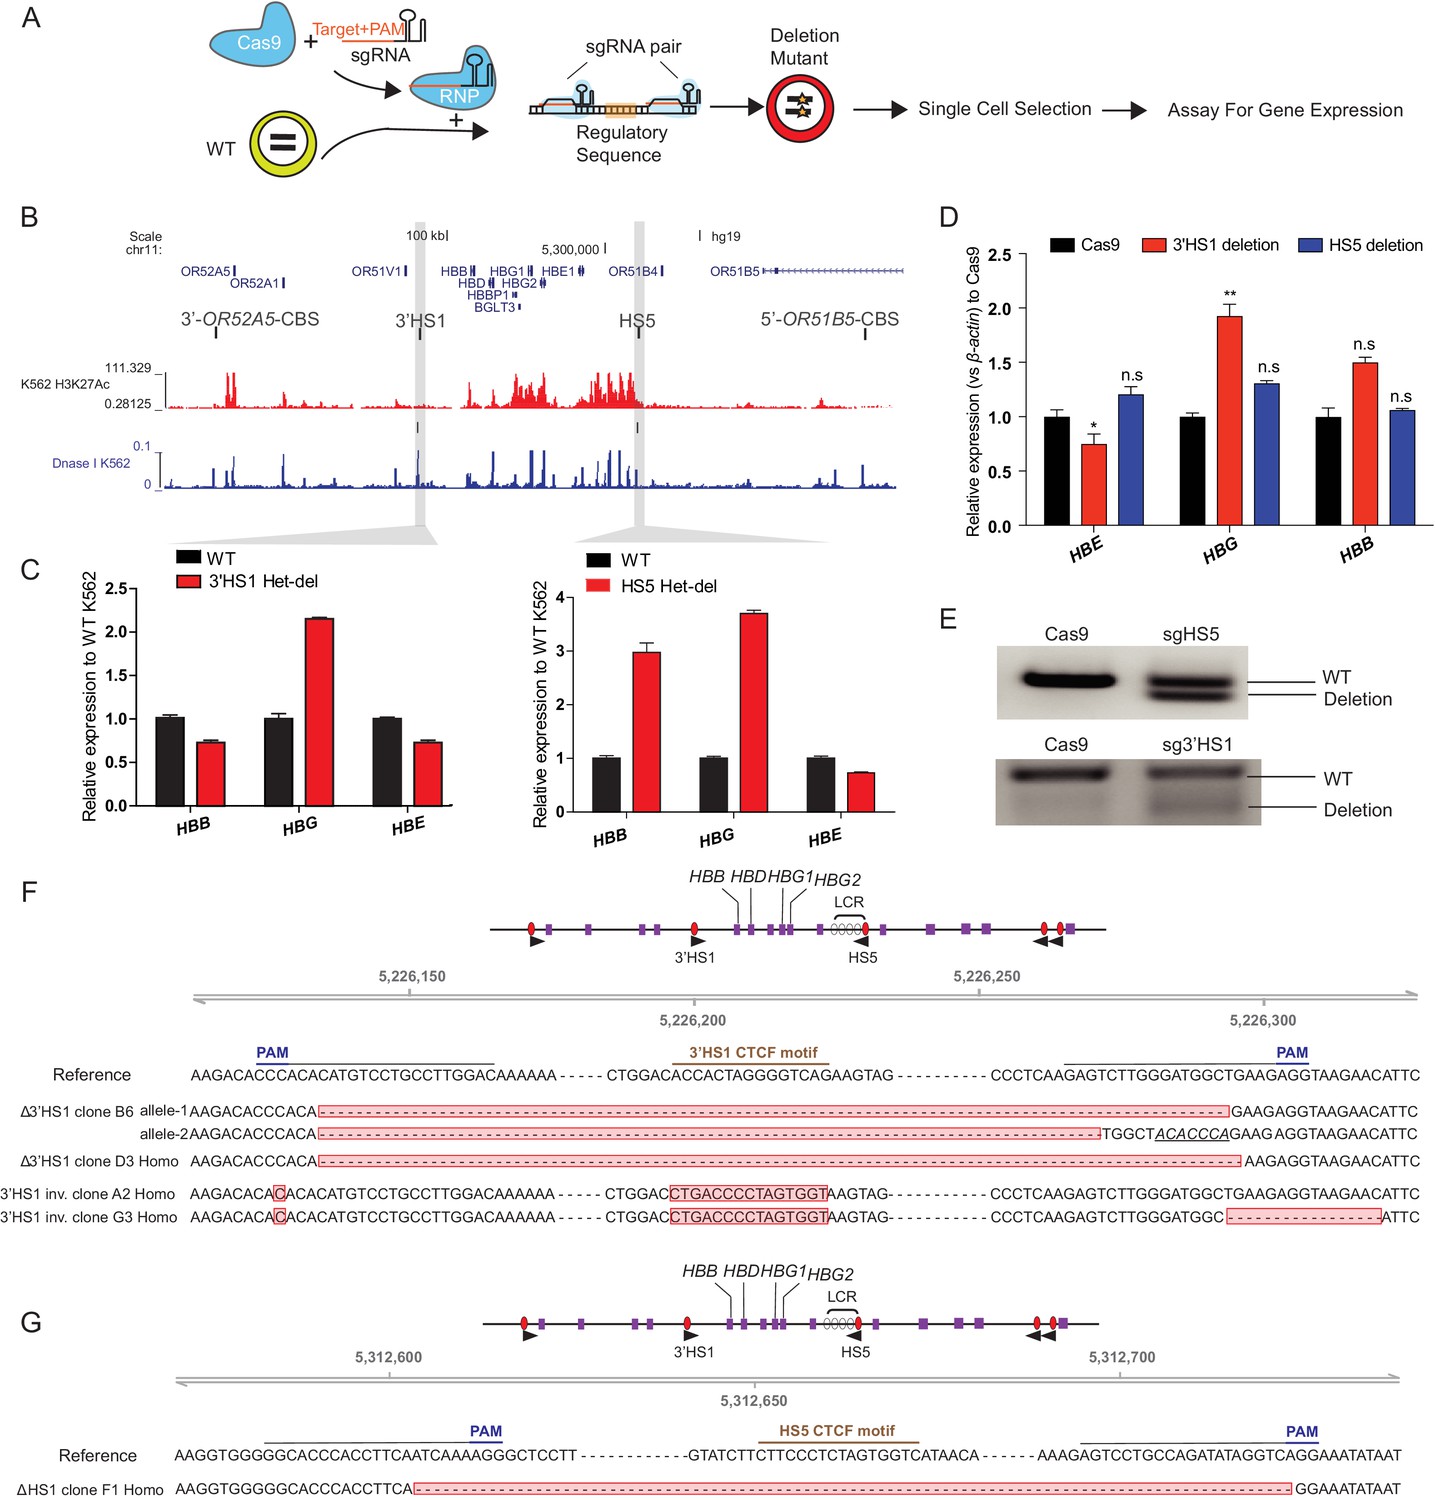
CTCF binding site around β-globin gene cluster regulated β-globin gene expression.
(A) The experimental scheme of CTCF binding site deletion by CRISPR/Cas9. (B) CTCF binding site and chromatin landscape (H3K27ac and Dnase hypersensitivity footprint is shown) around β-globin genes. (C) The β-globin genes expression in the K562 clones with CBS deletion. (D) The β-globin genes expression in the bulk HUDEP-2 cells with HS5 and 3′HS1 deletions. N = 3. mean ± SD is displayed. n.s., not significant. *p<0.05, **p<0.01. Two-tailed t-test is performed. (E) Deletion fraction of 3′HS1 and HS5 in the bulk HUDEP-2 population tested in (D). (F, G) The Sanger sequencing validation result of Δ3′HS-1 clones and 3′HS-1 inversion clones as well as HS5 deletion clone (G). Homo indicates the deletion locus is homozygous. Insertion site is marked in italics with underlined text.
-
Figure 1—figure supplement 1—source data 1
The gel picture of paired guide deletion for HS5 and 3′HS1.
- https://cdn.elifesciences.org/articles/70557/elife-70557-fig1-figsupp1-data1-v2.zip
Figure 1—figure supplement 2
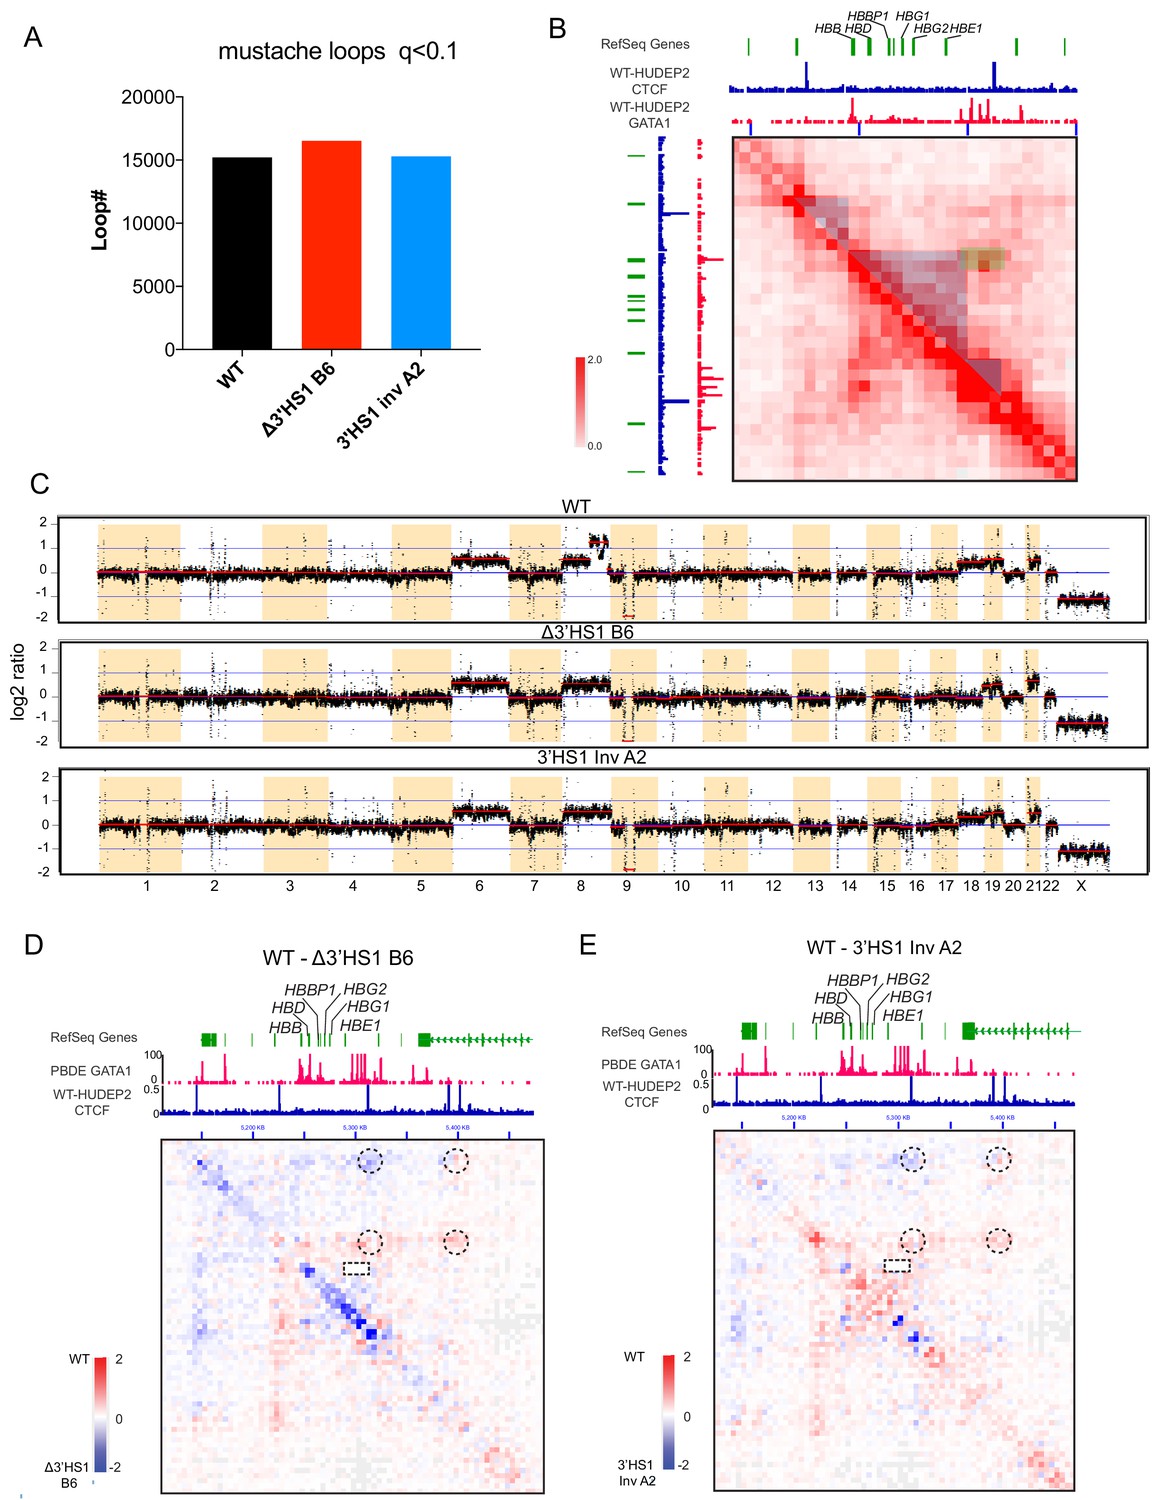
3D genomics change in Δ3′HS-1 clones and 3′HS-1 inversion HUDEP-2 cell clones.
(A) The loop number called by mustache with parameter of q < 0.1 (Roayaei Ardakany et al., 2020). (B) The 3D genomics interaction landscape in β-globin gene cluster. Blue-shaded region indicates the sub-TAD domain between HS5 and 3′HS-1 CBS. Green-shaded region covers the interactions between LCR (HS1-4) and HBB interactions. (C) The copy number variance (CNV) profile of three cell clones inferred from Hi-C data by HINT (Wang et al.). (D, E) The Juicebox view of WT- Δ3′HS-1 clone B6 (D) and WT- 3′HS-1 inversion clone A2 (E) contact map. The CBS-associated chromosomal loops are circled out. LCR-HBB interaction is highlighted by rectangular box.
Figure 1—figure supplement 3
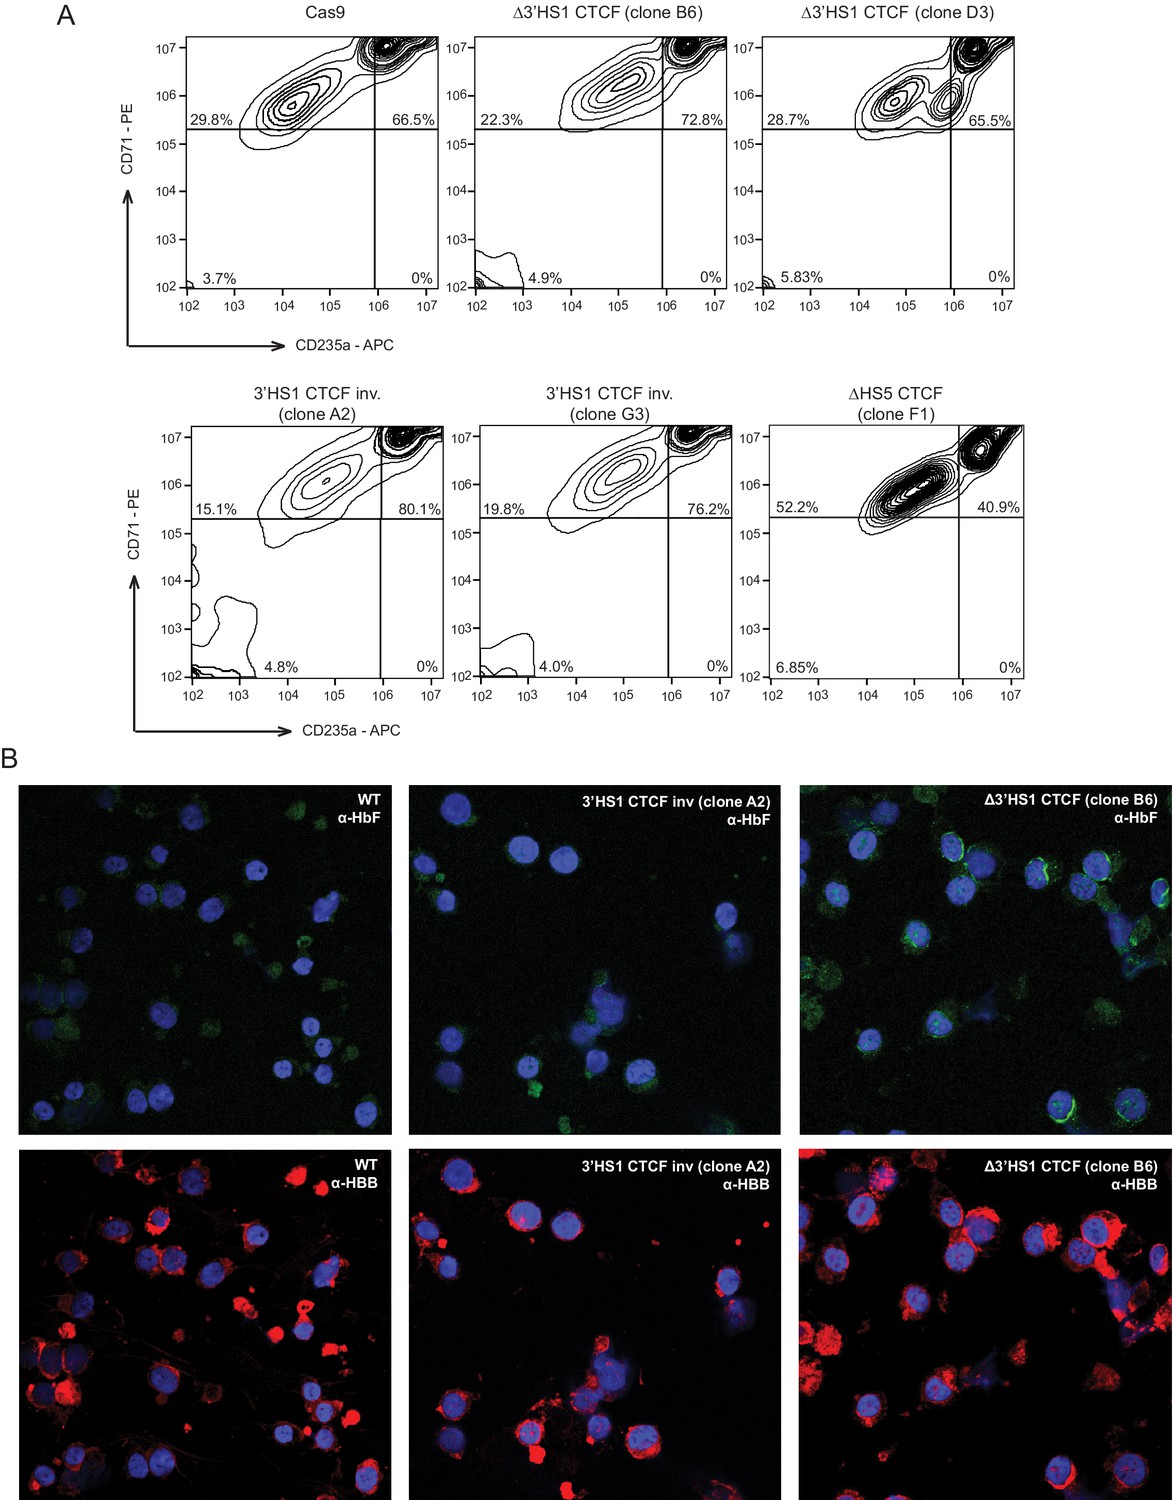
(A) The differentiation stage of HUDEP-2 cell clones used in Figure 1. (B) Immunofluorescence staining of HbF (top panel) and HBB (bottom panel) from clones used in Figure 1.
Figure 2 with 2 supplements
The induction of HbF in Δ3′HS1 cells is BCL11A independent.
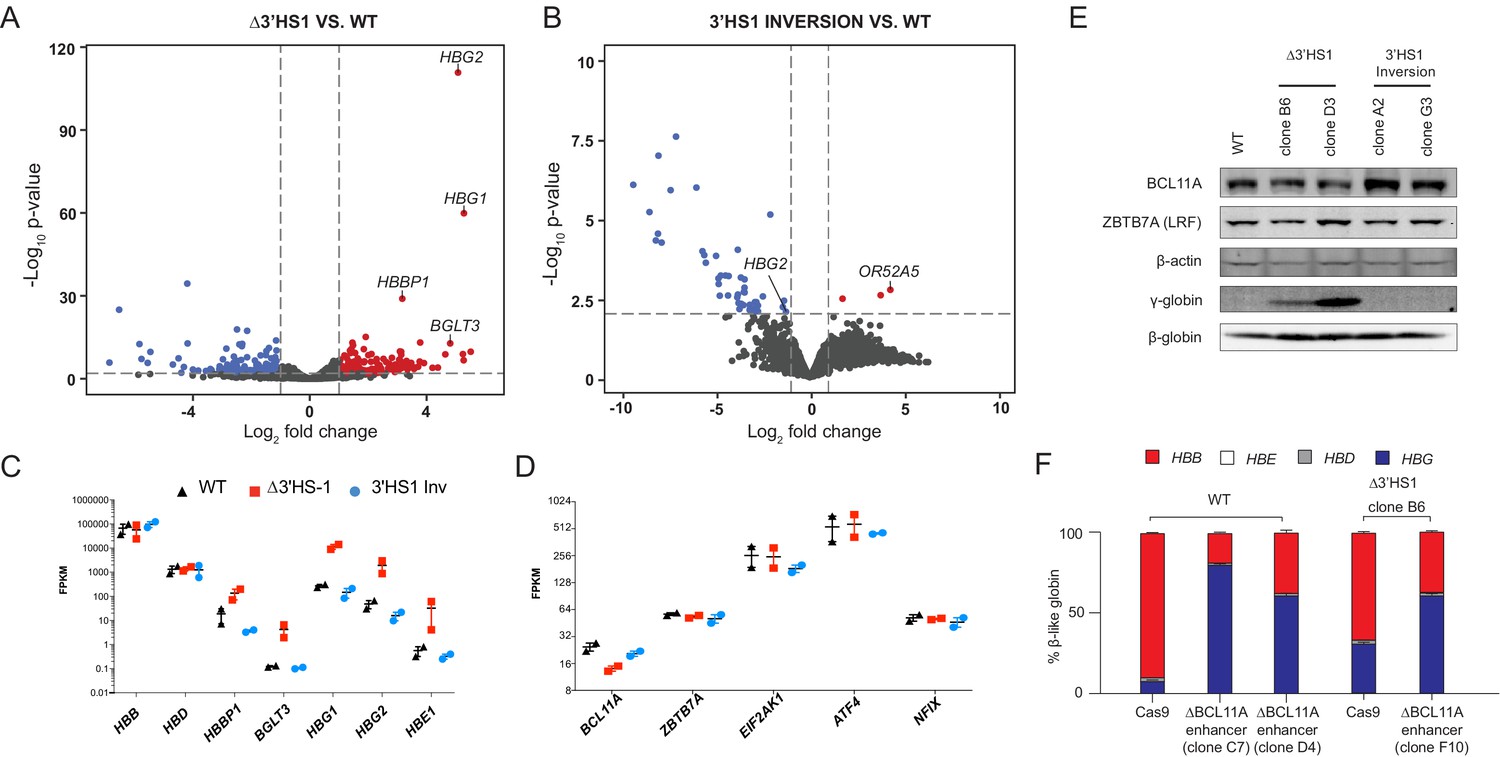
(A) Volcano plot of differentially expressed genes in two Δ3′HS1 clones (B6 and D3) vs. two wild-type HUDEP-2 biological duplicates. Differentially expressed globin and olfactory receptor genes are labeled. (B) The volcano plot of differentially expressed genes in two 3′HS1 inversion clones (A2 and G3) vs. two wild-type HUDEP-2 biological duplicates. Differentially expressed globin and olfactory receptor genes are labeled. (C) Expression level of β-globin genes in Δ3′HS1 clones, 3′HS1 inversion clones, and wild-type HUDEP-2 cells. (D) Expression level of known fetal hemoglobin repressor genes in Δ3′HS1 clones, 3′HS1 inversion clones, and wild-type HUDEP-2 cells. (E) Western blot shows the level of BCL11A and ZBTB7A (LRF) in Δ3′HS1 clones, 3′HS1 inversion clones, Δ3′HS-5 clones, and wild-type HUDEP-2 cells. Refer to Figure 2—source data 1 for original blot picture. (F) The composition of β-like hemoglobin genes in the WT HDUEP-2 cells with BCL11A + 58 enhancer deleted with CRISPR/Cas9 and Δ3′HS1 HDUEP-2 cells with BCL11A + 58 enhancer deleted with CRISPR/Cas9.
-
Figure 2—source data 1
The immunoblot data of BCL11A, ZBTB7A, β-actin, β-globin, and γ-globin of clones displayed in Figure 2.
- https://cdn.elifesciences.org/articles/70557/elife-70557-fig2-data1-v2.zip
Figure 2—figure supplement 1
BCL11A loss further promotes fetal hemoglobin induction in Δ3′HS-1 background.
(A) Integrated Genome Viewer (IGV) track view of ATAC-seq and H3K27ac ChIP-seq at β-globin gene locus of Δ3′HS1 HDUEP-2 cell clones, 3′HS1 inversion HDUEP-2 cells, and wild-type HUDEP-2 cells. GATA1, CTCF, and BCL11A CUT&RUN data is shown below the track. Regions highlighted in orange are paralogous HBG1/2 promoter. (B) Sanger sequencing of BCL11A +58 enhancer-disrupted clones. (C) qPCR quantification of BCL11A gene expression in +58 enhancer-deleted clones. (D) Flow cytometry measurement of HbF in WT and B6 clone after the deletion of BCL11A + 58 enhancer by CRISPR/Cas9. (E) Western blot quantification of BCL11A protein in BCL11A + 58 enhancer-deleted clones in WT and Δ3′HS-1 background. (F) The differentiation stage of BCL11A + 58 enhancer-disrupted HUDEP-2 cell clones profiled by flow cytometry of CD71 and CD235a.
-
Figure 2—figure supplement 1—source data 1
The immunoblot data of BCL11A, ZBTB7A, β-actin, β-globin, and γ-globin of clones displayed in Figure 2—figure supplement 1.
- https://cdn.elifesciences.org/articles/70557/elife-70557-fig2-figsupp1-data1-v2.zip
Figure 2—figure supplement 2
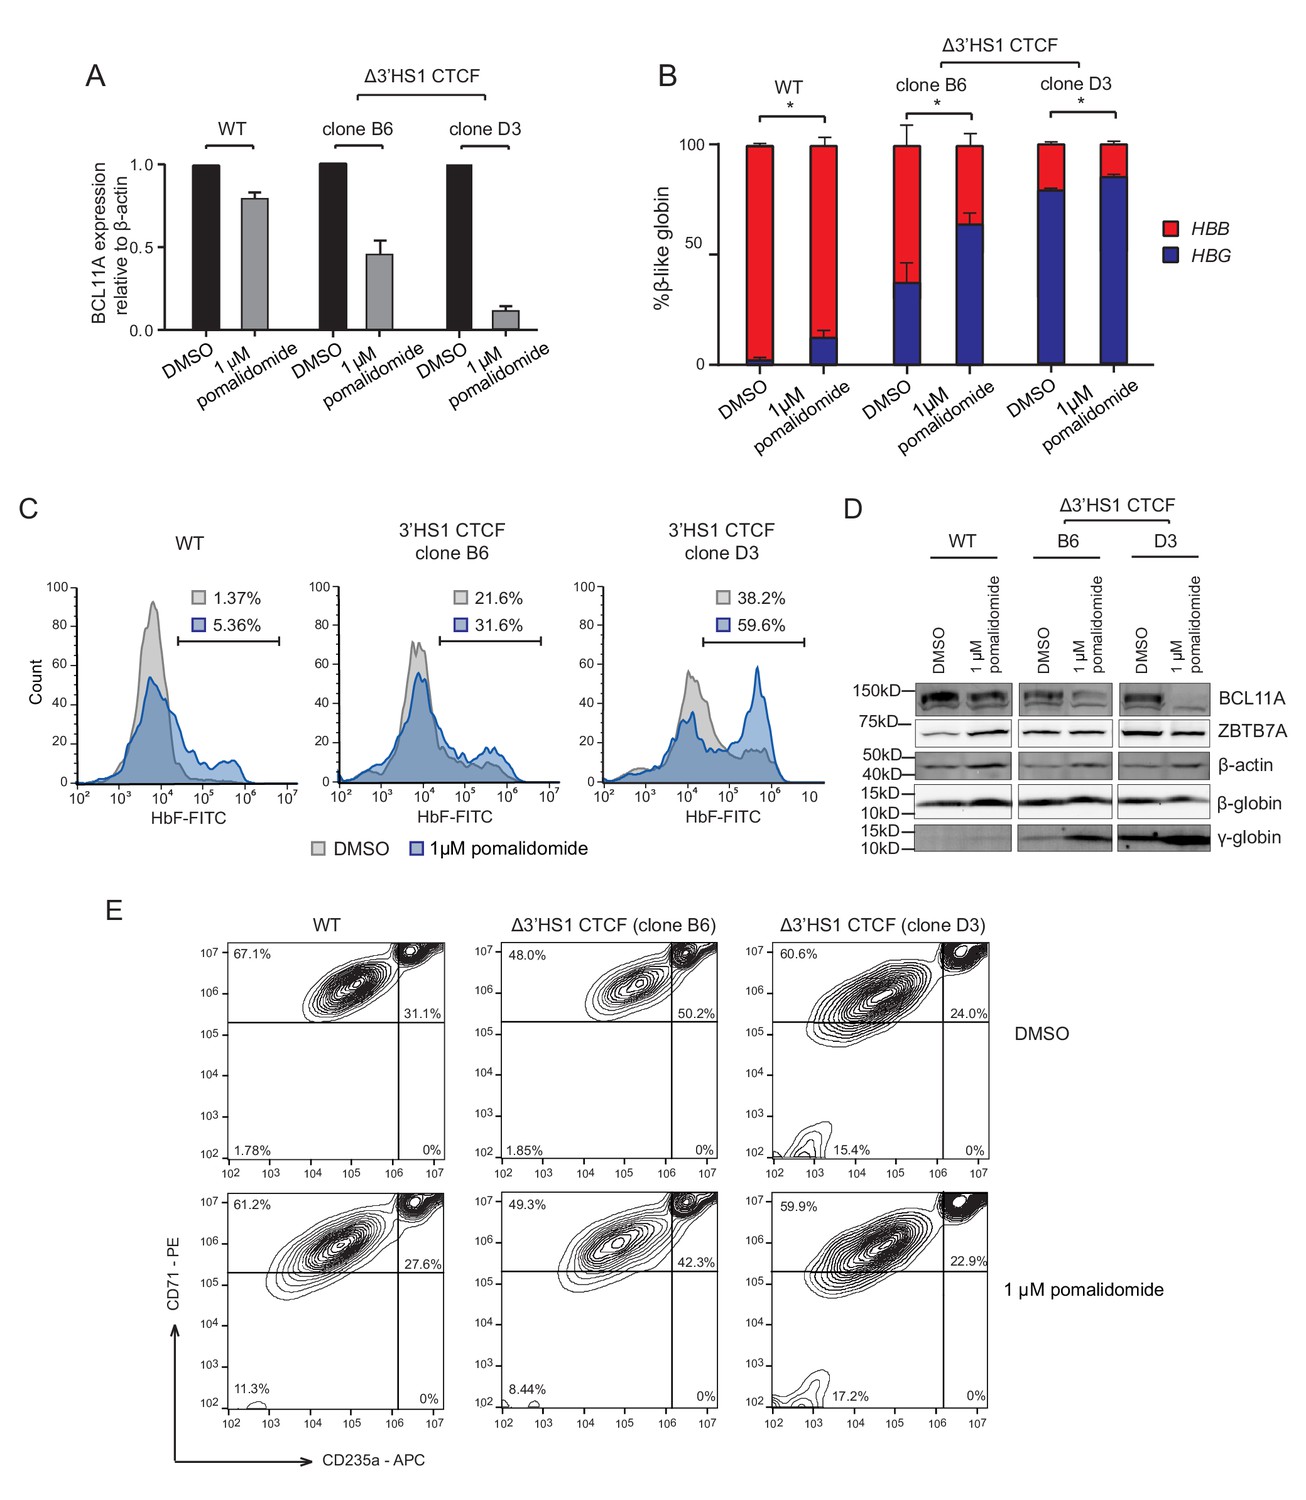
Pomalidomide enhances fetal hemoglobin production induced by 3′HS-1 deletion.
(A) qRT-PCR quantification of BCL11A in the pomalidomide-treated WT and 3′-HS-1-deleted HUDEP2 cell clones. (B) Composition of β-like globin by qRT-PCR in clones treated with DMSO and 1 μM pomalidomide described in panel (A). (C) The flow cytometry plot of HbF in clones treated with DMSO and 1 μM pomalidomide described in panel (A). (D) Western blot of BCL11A, ZBTB7A, β-globin, and γ-globin clones treated with DMSO and 1 μM pomalidomide described in panel (A). (E) The differentiation stage of HUDEP-2 cell clones used in panel (A) profiled by flow cytometry of CD71 and CD235a.
-
Figure 2—figure supplement 2—source data 1
The immunoblot data of BCL11A, ZBTB7A, β-actin, β-globin, and γ-globin of clones displayed in Figure 2—figure supplement 2.
- https://cdn.elifesciences.org/articles/70557/elife-70557-fig2-figsupp2-data1-v2.zip
Figure 3 with 1 supplement
The induction of HbF in Δ3′HS1 cells is modulated by HPFH enhancer.
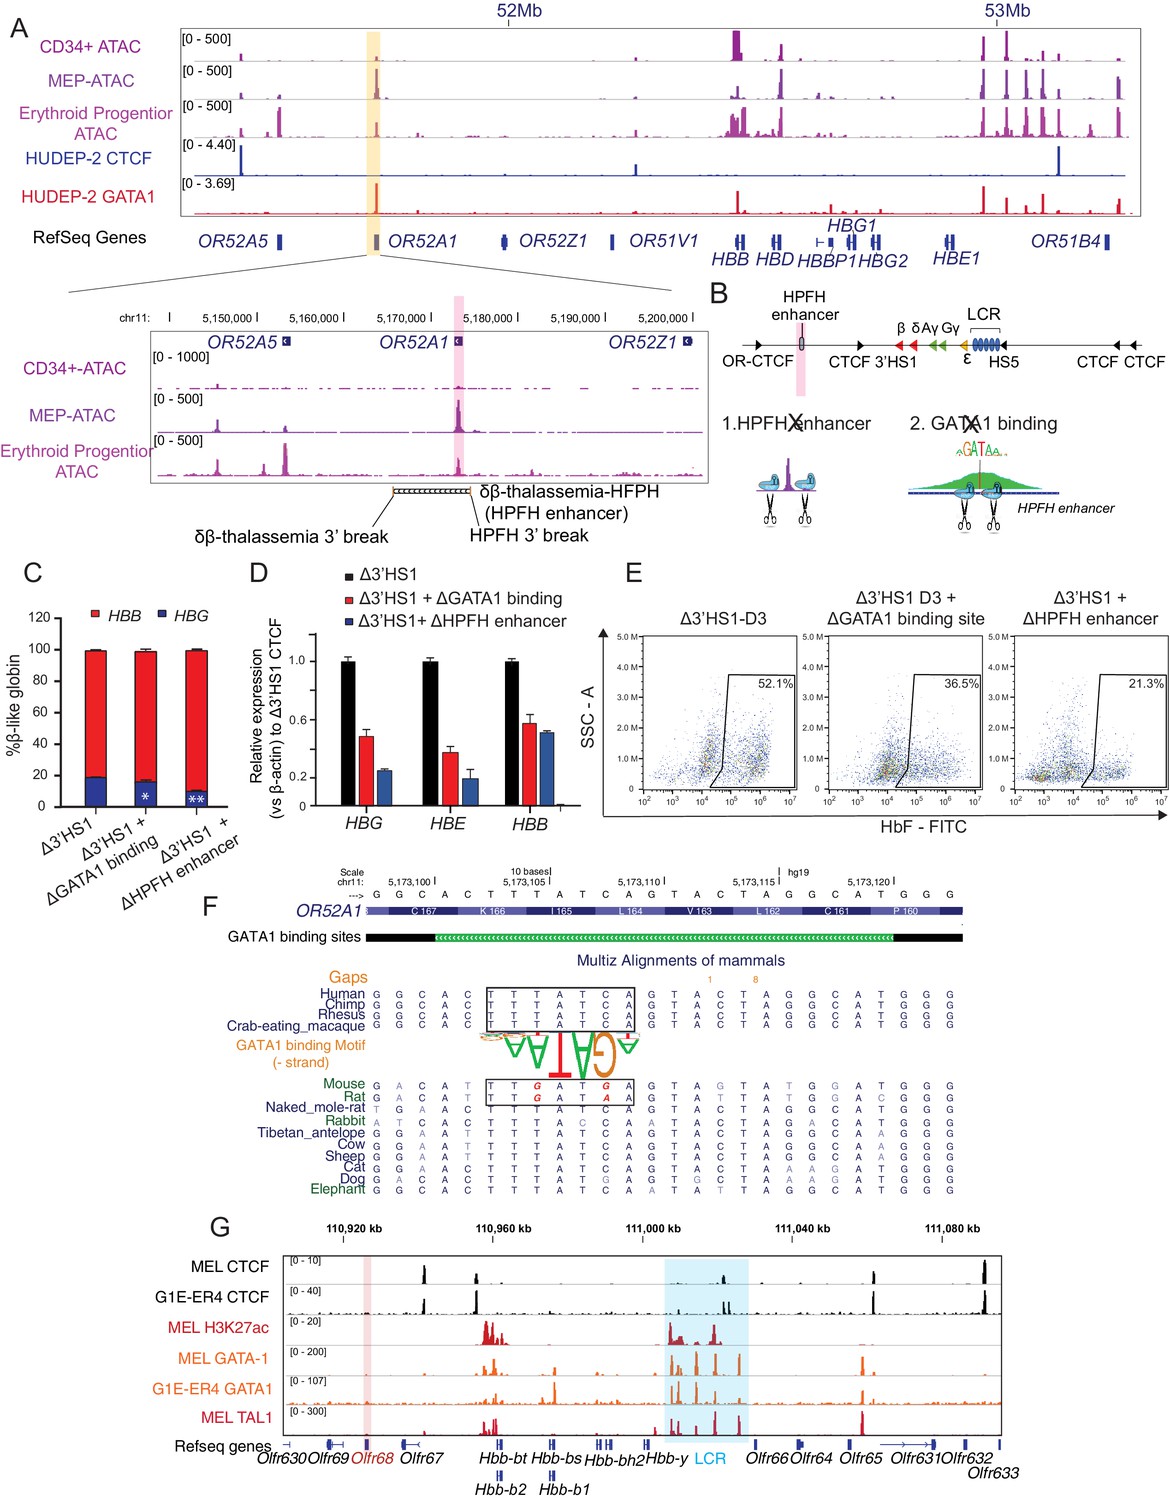
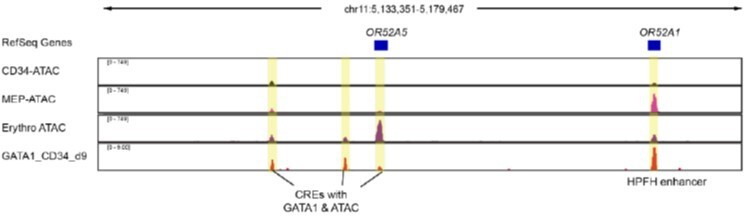
(A) Upper panel: IGV view of ATAC-seq in primary human blood cells followed by GATA1 and CTCF ChIP-seq in HUDEP-2 cells around the β-globin locus. Lower panel: ATAC-seq of CD34+ hematopoietic stem and progenitor cell (HSPC), megakaryocyte–erythroid progenitor (MEP), and erythroblast is shown in the zoomed view for the OR52A1 region. Red-shaded area indicates the locus of OR52A1. HPFH 3' beak and δβ-thalassemia 3' break is annotated (Feingold and Forget, 1989). (B) The experimental scheme of hereditary persistence of fetal hemoglobin (HPFH) deletion in the 3'HS1 deletion background. (C) The composition of β-like globin Δ3′HS1 (clone B6) HUDEP-2 cells with GATA1 binding site and HPFH region deletion. Mean ± SD is displayed, n = 3. (D) Relative expression of HBE, HBG (probe measures both HBG1 and HBG2), and HBB in the Δ3’HS1 (clone B6) HUDEP-2 cells with GATA1 binding site and HPFH enhancer region deletion. Mean ± SD is displayed, n = 3. (E) The representative HbF flow plot of Δ3’HS1 (clone B6) HUDEP-2 cells with GATA1 binding site and HPFH enhancer region deletion. (F) Evolution conservation of OR52A1 GATA1 binding site in vertebrates. GATA1 binding motif is shown in the middle. The site in mouse and rat associated with human GATA1 binding is boxed out. (G) Chromatin landscape of mouse β-globin gene cluster in mouse erythroid cells MEL and G1-ER4. CTCF, GATA1, and TAL1 ChIP-seq is shown. Orange stripe highlights the mouse homolog of human OR52A1–Olfr68.
Figure 3—figure supplement 1
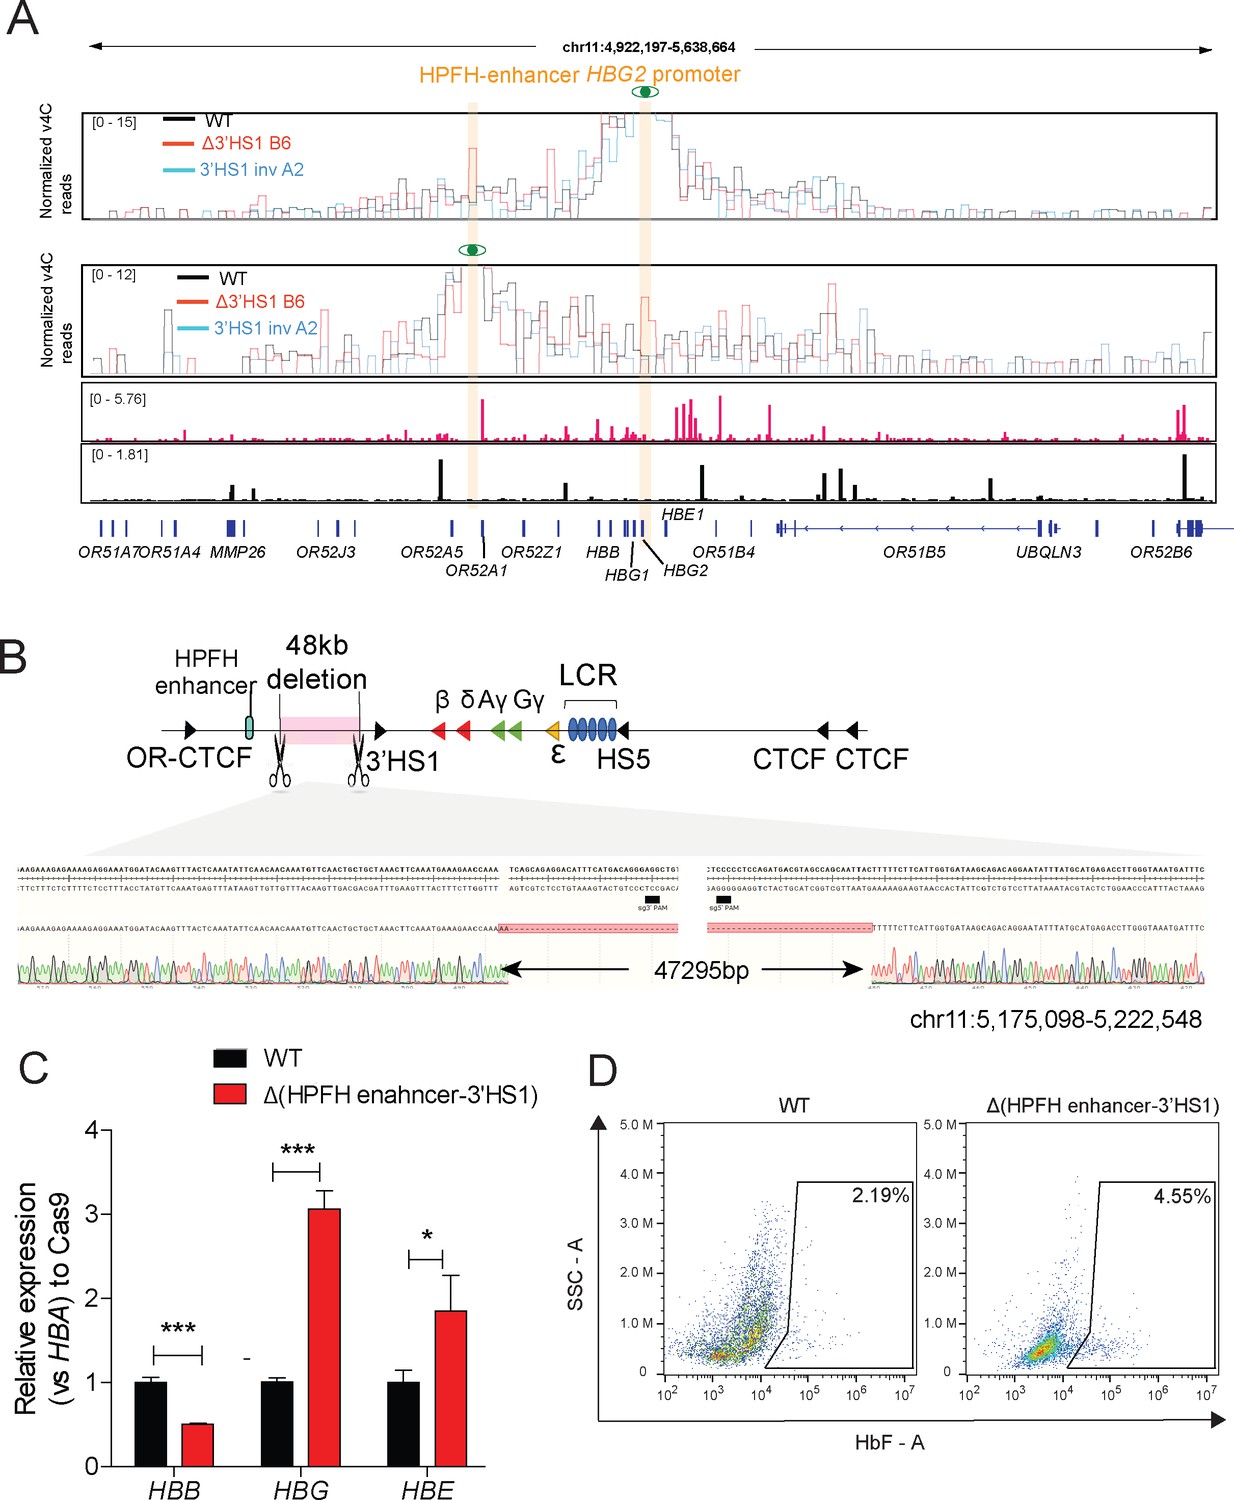
HPFH enhancer in edited HUDEP-2 cells.
(A) The v4C tracks generated by Juicebox from WT, Δ3′HS1 HUDEP2 clone B6, and 3′HS1 inversion clone A2. The HPFH enhancer region is highlighted in orange and viewpoint of 4C is highlighted in orange and eye symbol on HPFH enhancer and HBG2 promoter region, respectively. (B) The experimental scheme of deleting 48 kb region between HPFH enhancer and 3′HS1. The Sanger sequencing validation result of a Δ(HPFH-3’HS1) clone B5 is displayed in the lower panel. (C) HBG, HBE, and HBB expression in WT and Δ(HPFH-3’HS1) clone B5. Mean ± SD is shown. ***p<0.001, *p<0.05. t-test was performed to determine the p value. (D) The flow cytometry plot of HbF in WT and Δ(HPFH-3’HS1) clone B5.
Figure 4 with 1 supplement
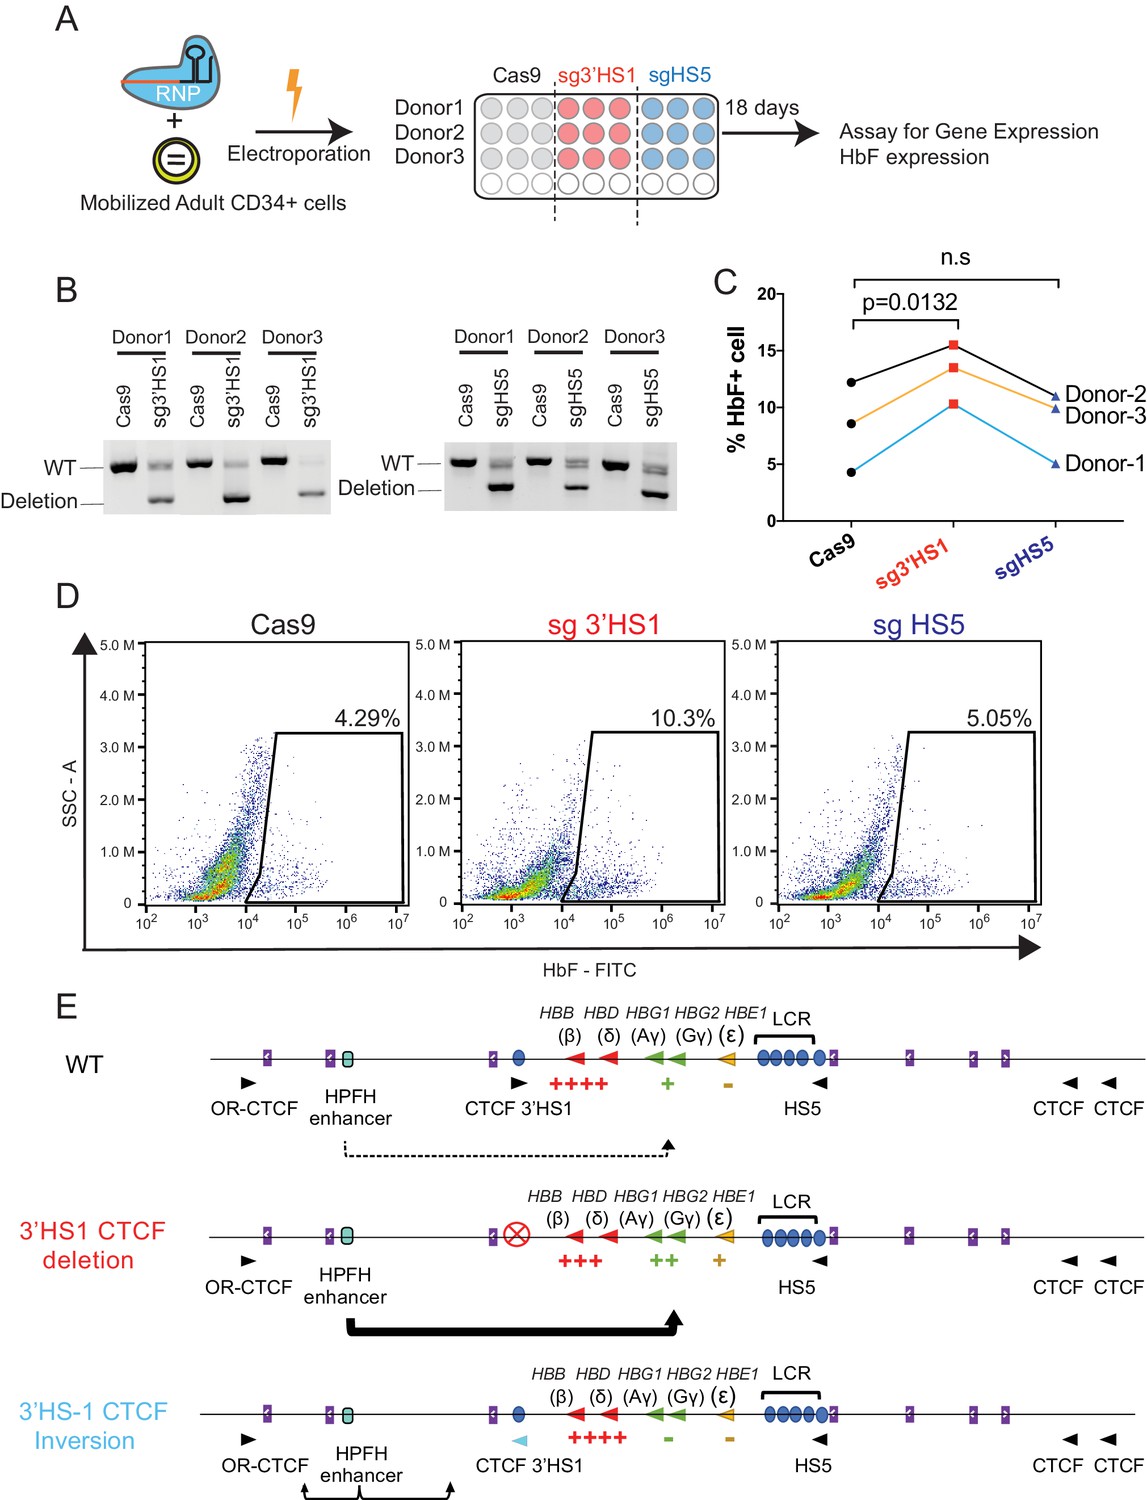
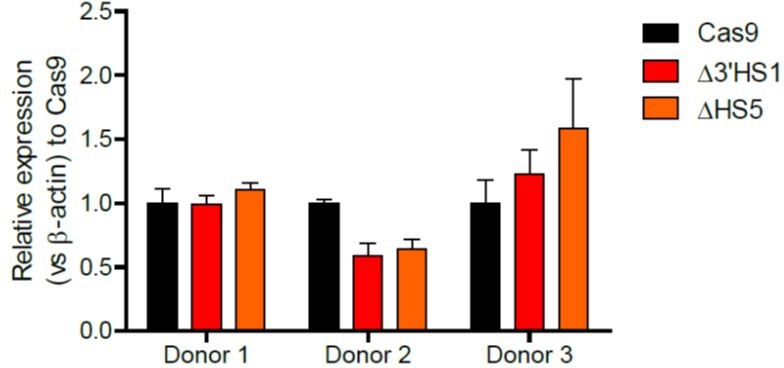
Deletion of 3′HS1 induces HbF in primary adult HSPC.
(A) The experimental scheme for primary HSPC editing. (B) The deletion of 3′HS1 and HS5 in three CD34+ peripheral blood mononuclear cell (PBMC) HSPCs from three individual adult donors. Refer to Figure 4—source data 1 for original gel picture. (C) The HbF+ cell percentage at day 21 in three HSPCs from three individual adult donors after 3′HS1 and HS5 deletion. p-Value is calculated by one-tailed paired t-test. n.s., not significant, p=0.3659 in HS5 deletion vs. Cas9 by one-tailed paired t-test. (D) The reprehensive flow plot for HbF+ cells at day 21 in 3′HS1-deleted and HS5-deleted PBMC HSPC. The data is from donor #1. (E) The model of fetal hemoglobin regulation through 3′HS1.
-
Figure 4—source data 1
The gel picture of paired guide deletion for HS5 and 3′HS1 in HSPC.
- https://cdn.elifesciences.org/articles/70557/elife-70557-fig4-data1-v2.zip
Figure 4—figure supplement 1
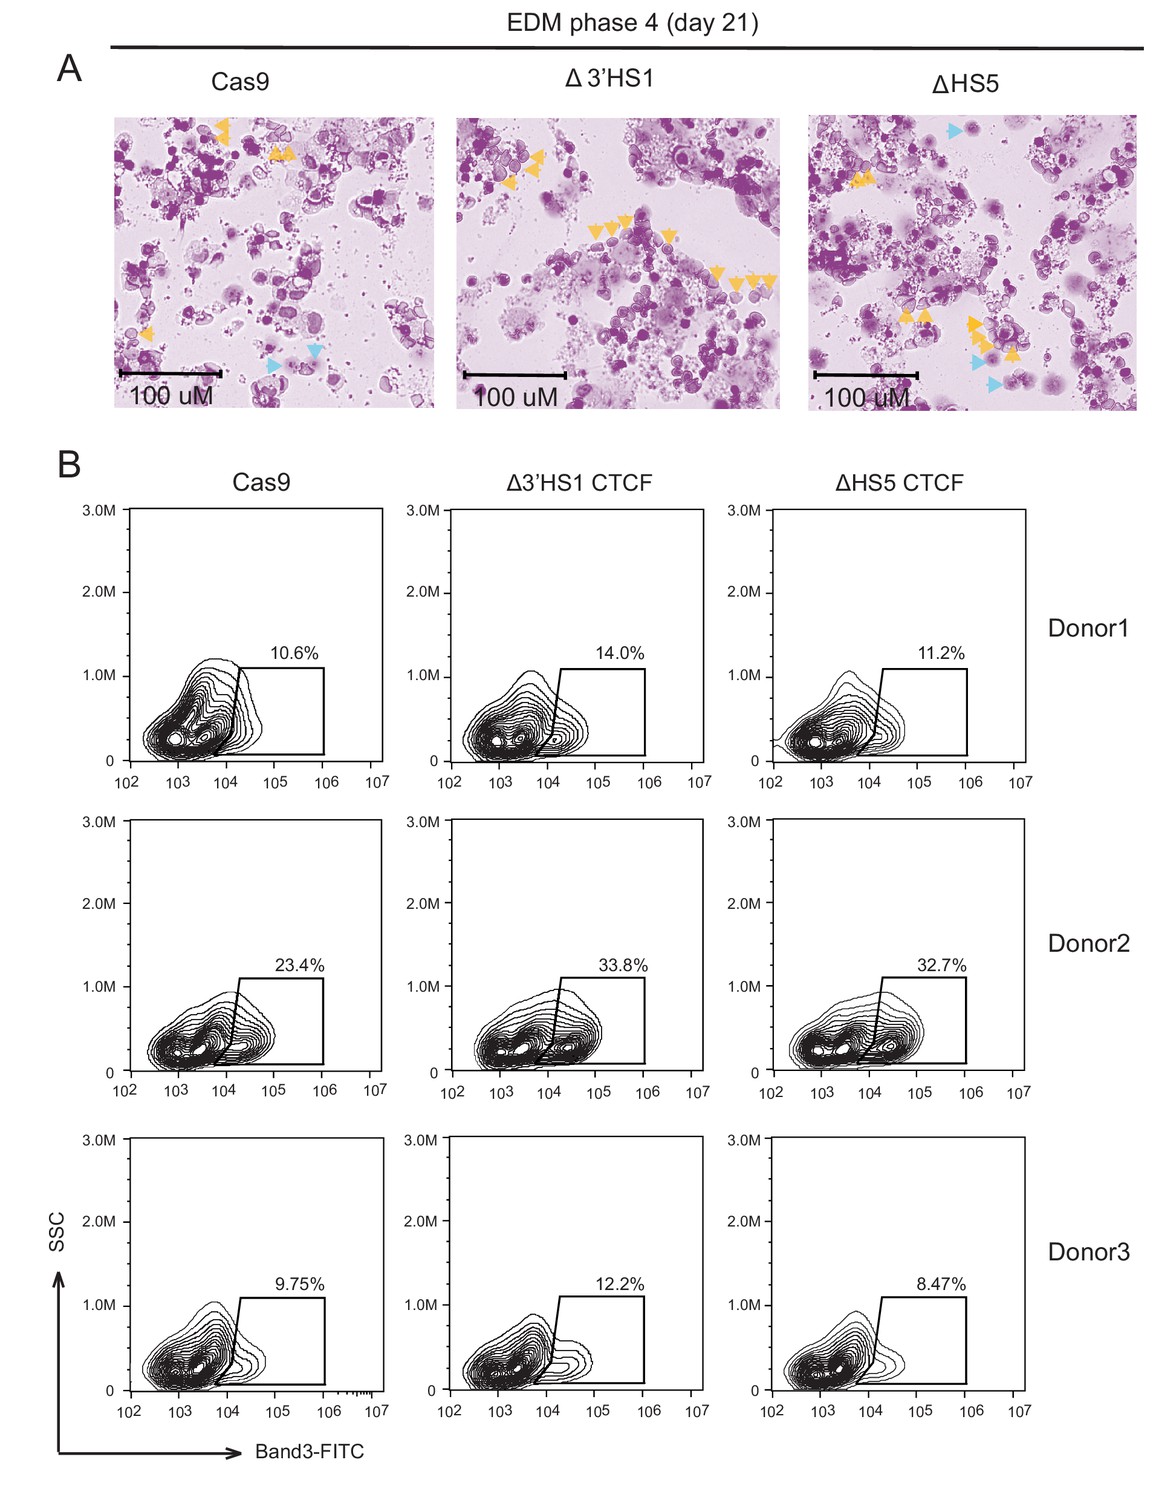
3’HS1 deletion in HSPC.
(A) Giemsa–Wright staining of differentiated erythroid cells from HSPC electroporated with Cas9, 3′HS-1 guide RNA pair, and HS5 deletion guide RNA pair at differentiation culture day 21. Orange arrow indicates the enucleated red blood cells, and blue arrows indicate the reticulocytes. (B) Differentiation stage of three HSPCs by flow cytometry of band 3 from different donors electroporated with Cas9, 3′HS-1 guide RNA pair, and HS5 deletion guide RNA pair at differentiation culture day 21.
Author response image 1
Author response image 2
Author response image 3
Author response image 4
Tables
Key resources table
| Reagent type (species) or resource | Designation | Source or reference | Identifier | Additional Information |
| Antibody | CTCF(rabbit polyclonal) | Abcam | AB70303 | WB(1:1000) |
| Antibody | BCL11A(rabbit polyclonal) | Abcam | AB191401 | WB(1:1000) |
| Antibody | β-Actin(rabbit polyclonal) | Proteintech | 20536-1-AP | WB(1:2000) |
| Antibody | β-Globin(mouse monoclonal) | Santa Cruz Biotechnology | SC-21757 | WB(1:2000) |
| Antibody | γ-Globin(mouse monoclonal) | Santa Cruz Biotechnology | SC-21756 | WB(1:500) |
| Antibody | ZBTB7A(mouse monoclonal) | R&D systems | MAB3496 | WB(1:1000) |
| Antibody | Human HbF-FITC(recombinant) | Miltenyl Biotec | 130-108-241 | FC(1:100) |
| Antibody | Human CD71-PE(mouse monoclonal) | BioLegend | 334105 | FC(1:100) |
| Antibody | Human CD235a-APC(mouse monoclonal) | BD Biosciences | 561775 | FC(1:100) |
| Antibody | Starbright B700-conjugated goat α-rabbit IgG(goat polyclonal) | Bio-Rad | 12004161 | WB(1:2000-1:5000) |
| Antibody | DyLight 800 goat α-mouse IgG(goat polyclonal) | Bio-Rad | STAR117D800GA | WB(1:2000-1:10,000) |
| Antibody | Acetyl-histone H3 (Lys27)(rabbit polyclonal) | Cell Signaling | 8173S | 2 µg per ChIP |
| Peptide, recombinant protein | SCF | Peprotech | 300-07 | |
| Peptide, recombinant protein | FLT3L | Peprotech | 300-19 | |
| Peptide, recombinant protein | TPO | Peprotech | 300-18 | |
| Peptide, recombinant protein | EPO | Amgen | EPOGEN | |
| Peptide, recombinant protein | IL-3 | Peprotech | 200-03 | |
| Other | SFEM II | STEMCELL Technologies | 09655 | |
| Chemical compound, drug | Dexamethasone | Sigma | D2915 | |
| Chemical compound, drug | Doxycycline | Sigma | D9891 | |
| Peptide, recombinant protein | Recombinant human insulin | Sigma | I2643 | |
| Peptide, recombinant protein | Holo-transferrin | Sigma | T4132 | |
| Chemical compound, drug | Heparin | Sigma | H3393 | |
| Other | Human AB serum | Sigma | H6914 | |
| Peptide, recombinant protein | Cas9 Protein | IDT | 1081058 | |
| Commercial assay or kit | Concanavalin A Beads | Bangs Laboratories, Inc | BP531 | |
| Peptide, recombinant protein | pA-MNase | Gift from Steven Henikoff | ||
| Commercial assay or kit | Dynabeads protein A | Thermo Fisher Scientific | 1002D | |
| Commercial assay or kit | Dynabeads MyOne Streptavidin T1 | Thermo Fisher Scientific | 65601 | |
| Chemical compound, drug | Protease Inhibitor Cocktail | GenDEPOT | 50-101-5486 | |
| Cell line (Homo sapiens) | HUDEP-2 cells | Riken Cell Bank | RCB4557 | |
| Cell line (Homo sapiens) | K562 cells | ATCC | CCL-243 | |
| Biological sample (primary cells Homo sapiens) | Human peripheral blood CD34+ HSPCs | STEMCELL Technologies | 70060.1 | CD34+ HSPC isolated from individual donor. Sex is mixed. |
| Commercial assay or kit | Rapid RNA library kit | Swift Biosciences | R2096 | |
| Commercial assay or kit | Nextera XT library preparation kit | Illumina | FC-131-1024 | |
| Commercial assay or kit | MinElute PCR purification kit | Qiagen | 28004 | |
| Commercial assay or kit | Accel-NGS 2S Plus DNA library kit | Swift Biosciences | 21096 | |
| Commercial assay or kit | 2S Combinatorial Dual Indexing Kit | Swift Biosciences | 28096 | |
| Commercial assay or kit | HiC Next Generation Sequencing Kit | Arima Genomics | ||
| Commercial assay or kit | KAPA library quantification kit | KAPA Biosystems | KK4844 | |
| Commercial assay or kit | RNA clean & concentrator | Zymo Research | R1013 | |
| Other | Raw and processed NGS sequencing data | This paper | GSE160425 | Raw and processed data could be obtained from the link : https://www.ncbi.nlm.nih.gov/geo/query/acc.cgi?acc=GSE160425 |
| Other | HUDEP-2 GATA1 CUT&RUN | GEO: GSE104676 | GSM2805376 | |
| Other | HUDEP-2 CTCF ChIP-seq | GEO: GSE104676 | GSM3671075 | |
| Other | HUDEP-2 BCL11A ChIP-seq | GEO: GSE103445 | GSM2771529 | |
| Other | Hematopoietic cells differentiation ATAC-seq | Corces et al., 2016 | GSE74912 | |
| Sequence-based reagent | sg3’HS1-3′ | Synthego | Synthesized guide RNA | GAGUCUUGGGAUGGCUGAAG |
| Sequence-based reagent | sg3’HS1-5′ | Synthego | Synthesized guide RNA | GUCCAAGGCAGGACAUGUGU |
| Sequence-based reagent | sgHS5-5′ | Synthego | Synthesized guide RNA | GGCACCCACCUUCAAUCAAA |
| Sequence-based reagent | sgHS5-3' | Synthego | Synthesized guide RNA | AGUCCUGCCAGAUAUAGGUC |
| Sequence-based reagent | sgOR52A1-GATA1-5′ | Synthego | Synthesized guide RNA | AUGUCUUAGUGGAUAACAGA |
| Sequence-based reagent | sgOR52A1-GATA1-3′ | Synthego | Synthesized guide RNA | CAUAUGCUCACAGUAGGAGU |
| Sequence-based reagent | sgHPFH-enhancer-5′ | Synthego | Synthesized guide RNA | GGGCAUGUAGACUGUGAUGU |
| Sequence-based reagent | sgHPFH-enhancer-3′: | Synthego | Synthesized guide RNA | CAUAUGCUCACAGUAGGAGU |
| Sequence-based reagent | sgBCL11A- + 58-5′: | Synthego | Synthesized guide RNA | GGACUGGCAGACCUCUCCAU |
| Sequence-based reagent | sgBCL11A- + 58-3’: | Synthego | Synthesized guide RNA | CUCUUACUUAUGCACACCUG |
| Sequence-based reagent | 3'HS1-deletion-genotyping forward | Eurofins Genomics | PCR primer | TCCCTGTGTGATTACTTGCTTAC |
| Sequence-based reagent | 3'HS1-deletion-genotyping reverse | Eurofins Genomics | PCR primer | AGGTCATAACCATTCAGGTAAACT |
| Sequence-based reagent | 3'HS1-inversion-genotyping forward | Eurofins Genomics | PCR primer | TCCCTGTGTGATTACTTGCTTAC |
| Sequence-based reagent | 3'HS1-inversion-genotyping reverse | Eurofins Genomics | PCR primer | GATGAACTACTTACCACTAGGGGTC |
| Sequence-based reagent | 3'HS1-WT-genotyping forward | Eurofins Genomics | PCR primer | TCCCTGTGTGATTACTTGCTTAC |
| Sequence-based reagent | 3'HS1-WT-genotyping reverse | Eurofins Genomics | PCR primer | CTTCTGACCCCTAGTGGTGTC |
| Sequence-based reagent | HPFH enhancer-deletion-genotyping forward | Eurofins Genomics | PCR primer | ACAATGGCCATATGCTCACA |
| Sequence-based reagent | HPFH enhancer-deletion-genotyping reverse | Eurofins Genomics | PCR primer | GTCCAGGTGATTTTGCTGGT |
| Sequence-based reagent | BCL11A_58 enhancer-deletion forward | Eurofins Genomics | PCR primer | GAACAGAGACCACTACTGGCAAT |
| Sequence-based reagent | BCL11A_58 enhancer-deletion forward | Eurofins Genomics | PCR primer | CTCAGAAAAATGACAGCACCA |
| Sequence-based reagent | HBB-qPCR forward | Eurofins Genomics | PCR primer | CTGAGGAGAAGTCTGCCGTTA |
| Sequence-based reagent | HBB-qPCR reverse | Eurofins Genomics | PCR primer | AGCATCAGGAGTGGACAGAT |
| Sequence-based reagent | HBD-qPCR forward | Eurofins Genomics | PCR primer | GAGGAGAAGACTGCTGTCAATG |
| Sequence-based reagent | HBD-qPCR reverse | Eurofins Genomics | PCR primer | AGGGTAGACCACCAGTAATCTG |
| Sequence-based reagent | HBE-qPCR forward | Eurofins Genomics | PCR primer | GCAAGAAGGTGCTGACTTC |
| Sequence-based reagent | HBE-qPCR reverse | Eurofins Genomics | PCR primer | ACCATCACGTTACCCAGGAG |
| Sequence-based reagent | HBG1/2-qPCR forward | Eurofins Genomics | PCR primer | TGGATGATCTCAAGGGCAC |
| Sequence-based reagent | HBG1/2-qPCR reverse | Eurofins Genomics | PCR primer | TCAGTGGTATCTGGAGGACA |
| Sequence-based reagent | ActB-qPCR forward | Eurofins Genomics | PCR primer | CCTGGCACCCAGCACAATGAAG |
| Sequence-based reagent | ActB-qPCR reverse | Eurofins Genomics | PCR primer | AAGTCATAGTCCGCCTAGAAGC |
| Sequence-based reagent | BCL11A-qPCR forward | Eurofins Genomics | PCR primer | AACCCCAGCACTTAAGCAAA |
| Sequence-based reagent | BCL11A-qPCR reverse | Eurofins Genomics | PCR primer | GGAGGTCATGATCCCCTTCT |
| Sequence-based reagent | 3'HS1 HDR template | Gene Universal | CRISPR/Cas9 knock-in HDR template | AGACATAGAGAAAGTATATT GTGTTTAAAAGACAGCTTC TTTATAATTCTATAGAACTAA AACATTCCTATTTGCCAAGG CAGTGGAGTTTTTGCTGTT CTTAGAACATAATTACTGAA AGACACGCACACATGTCCT GCCTTGGACAAAAAATTGT ATGTCCATCCTTTAAAGGT CATTCCTTTAATGGTCTTTT CTGGACCTGACCCCTAGTG GTAAGTAGTTCATCAAACTT TCTTCCCTCCCTACTTCAGT GATGCATAAGGCAGATCTG CTTTAGTGTAAGCGAGGTC AGGCCCTCAAGAGTCTTG GGATGGCTGAAGATGTAA GAACATTCTATAAGACTTG TCCAAAGAACTGACTGTT TAATGATTCTGAATATGCT AGTTCAGAGAGAATCTAT TTACCACAAACCTGAAG |
| Software, algorithm | HiC-Pro | Servant et al., 2015 | https://github.com/nservant/HiC-Pro | |
| Software, algorithm | Juicer | Durand et al., 2016b | https://github.com/theaidenlab/juicer/wiki | |
| Software, algorithm | Juicebox | Durand et al., 2016a; Durand et al., 2016b | http://aidenlab.org/juicebox/ | |
| Software, algorithm | HiNT | Wang et al., 2020 | https://github.com/parklab/HiNT | |
| Software, algorithm | STAR | Dobin et al., 2013 | https://github.com/alexdobin/STAR | |
| Software, algorithm | edgeR | Robinson et al., 2010 | https://bioconductor.org/packages/edgeR/ | |
| Software, algorithm | Bowtie2 | Langmead and Salzberg, 2012 | http://bowtie-bio.sourceforge.net/bowtie2/index.shtml | |
| Software, algorithm | BWA-MEM | Bauer et al., 2013 | http://bio-bwa.sourceforge.net/ | |
| Software, algorithm | SAMtools | Sankaran et al., 2009 | http://samtools.sourceforge.net/ | |
| Software, algorithm | Picard Tools | http://broadinstitute.github.io/picard/ | ||
| Software, algorithm | deepTools | Ramírez et al., 2014 | https://deeptools.readthedocs.io/en/develop/ | |
| Software, algorithm | Trim Galore | http://www.bioinformatics.babraham.ac.uk/projects/trim_galore/ | ||
| Software, algorithm | Trimmomatic | Bolger et al., 2014 | http://www.usadellab.org/cms/?page=trimmomatic |
Additional files
-
Transparent reporting form
- https://cdn.elifesciences.org/articles/70557/elife-70557-transrepform1-v2.docx
-
Source data 1
Blot and Gel images.
- https://cdn.elifesciences.org/articles/70557/elife-70557-supp1-v2.zip
-
Supplementary file 1
Differential expressed genes in 3'HS1 deletion and inversion clones.
Differential expressed genes ( |log2Fold change| >1 and p-value <0.01) in 3'HS1 deletion and inversion clones.
- https://cdn.elifesciences.org/articles/70557/elife-70557-supp2-v2.xlsx
Download links
A two-part list of links to download the article, or parts of the article, in various formats.
Downloads (link to download the article as PDF)
Open citations (links to open the citations from this article in various online reference manager services)
Cite this article (links to download the citations from this article in formats compatible with various reference manager tools)
3′HS1 CTCF binding site in human β-globin locus regulates fetal hemoglobin expression
eLife 10:e70557.
https://doi.org/10.7554/eLife.70557


