Extracellular electron transfer increases fermentation in lactic acid bacteria via a hybrid metabolism
- Department of BioSciences, Rice University, United States
- Biological Nanostructures Facility, The Molecular Foundry, Lawrence Berkeley National Laboratory, United States
- Department of Food Science & Technology, University of California‐Davis, United States
- Department of Electrical and Computer Engineering, University of California‐Davis, United States
- Department of Microbiology, University of Chicago, United States
Figures
Figure 1 with 3 supplements
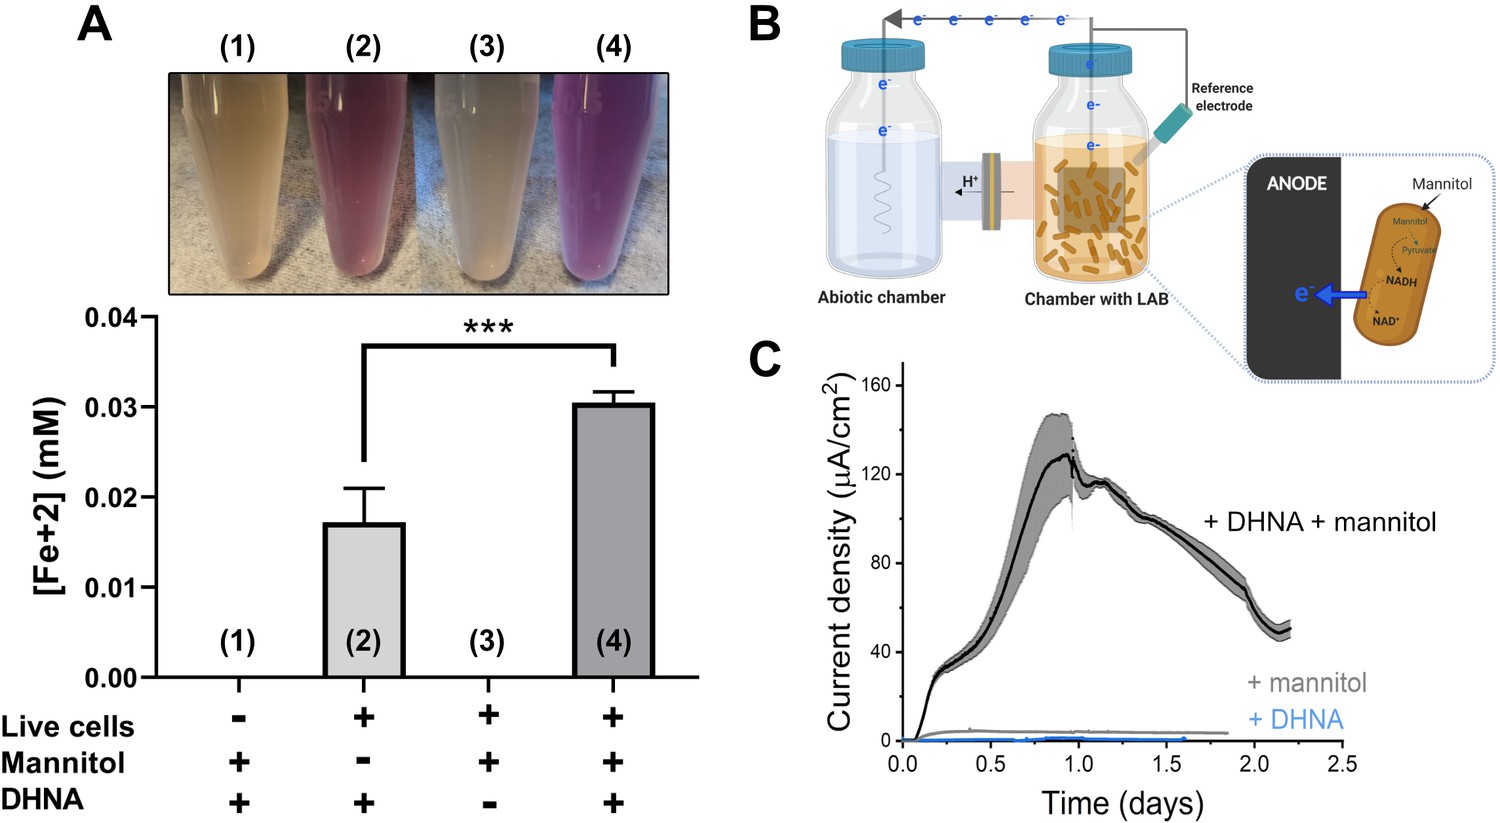
L. plantarum can reduce both Fe3+ and an anode through EET.
(A) Reduction of Fe3+ (ferrihydrite) to Fe2+ by L. plantarum NCIMB8826 after growth in mMRS. The assays were performed in PBS supplemented with 20 µg/mL DHNA and/or 55 mM mannitol. Fe2+ was detected colorimetrically using 2 mM ferrozine. For L. plantarum inactivation, cells were incubated at 85℃ in PBS for 30 min prior to the assay. Significant differences were determined by one-way ANOVA with Tukey’s post-hoc test (n = 3), *** p < 0.001. (B) Two-chambered electrochemical cell setup for measuring current generated by L. plantarum. (C) Current density production over time by L. plantarum in CDM supplemented with 20 µg/mL DHNA and/or 110 mM mannitol. The anode was polarized at +0.2VAg/AgCl. The avg ± stdev of three biological replicates is shown. See also Figure 1—figure supplement 1 and Figure 1—figure supplement 2 and related data in Figure 1—source data 1.
-
Figure 1—source data 1
Raw data of Figure 1A and B.
- https://cdn.elifesciences.org/articles/70684/elife-70684-fig1-data1-v2.xlsx
Figure 1—figure supplement 1
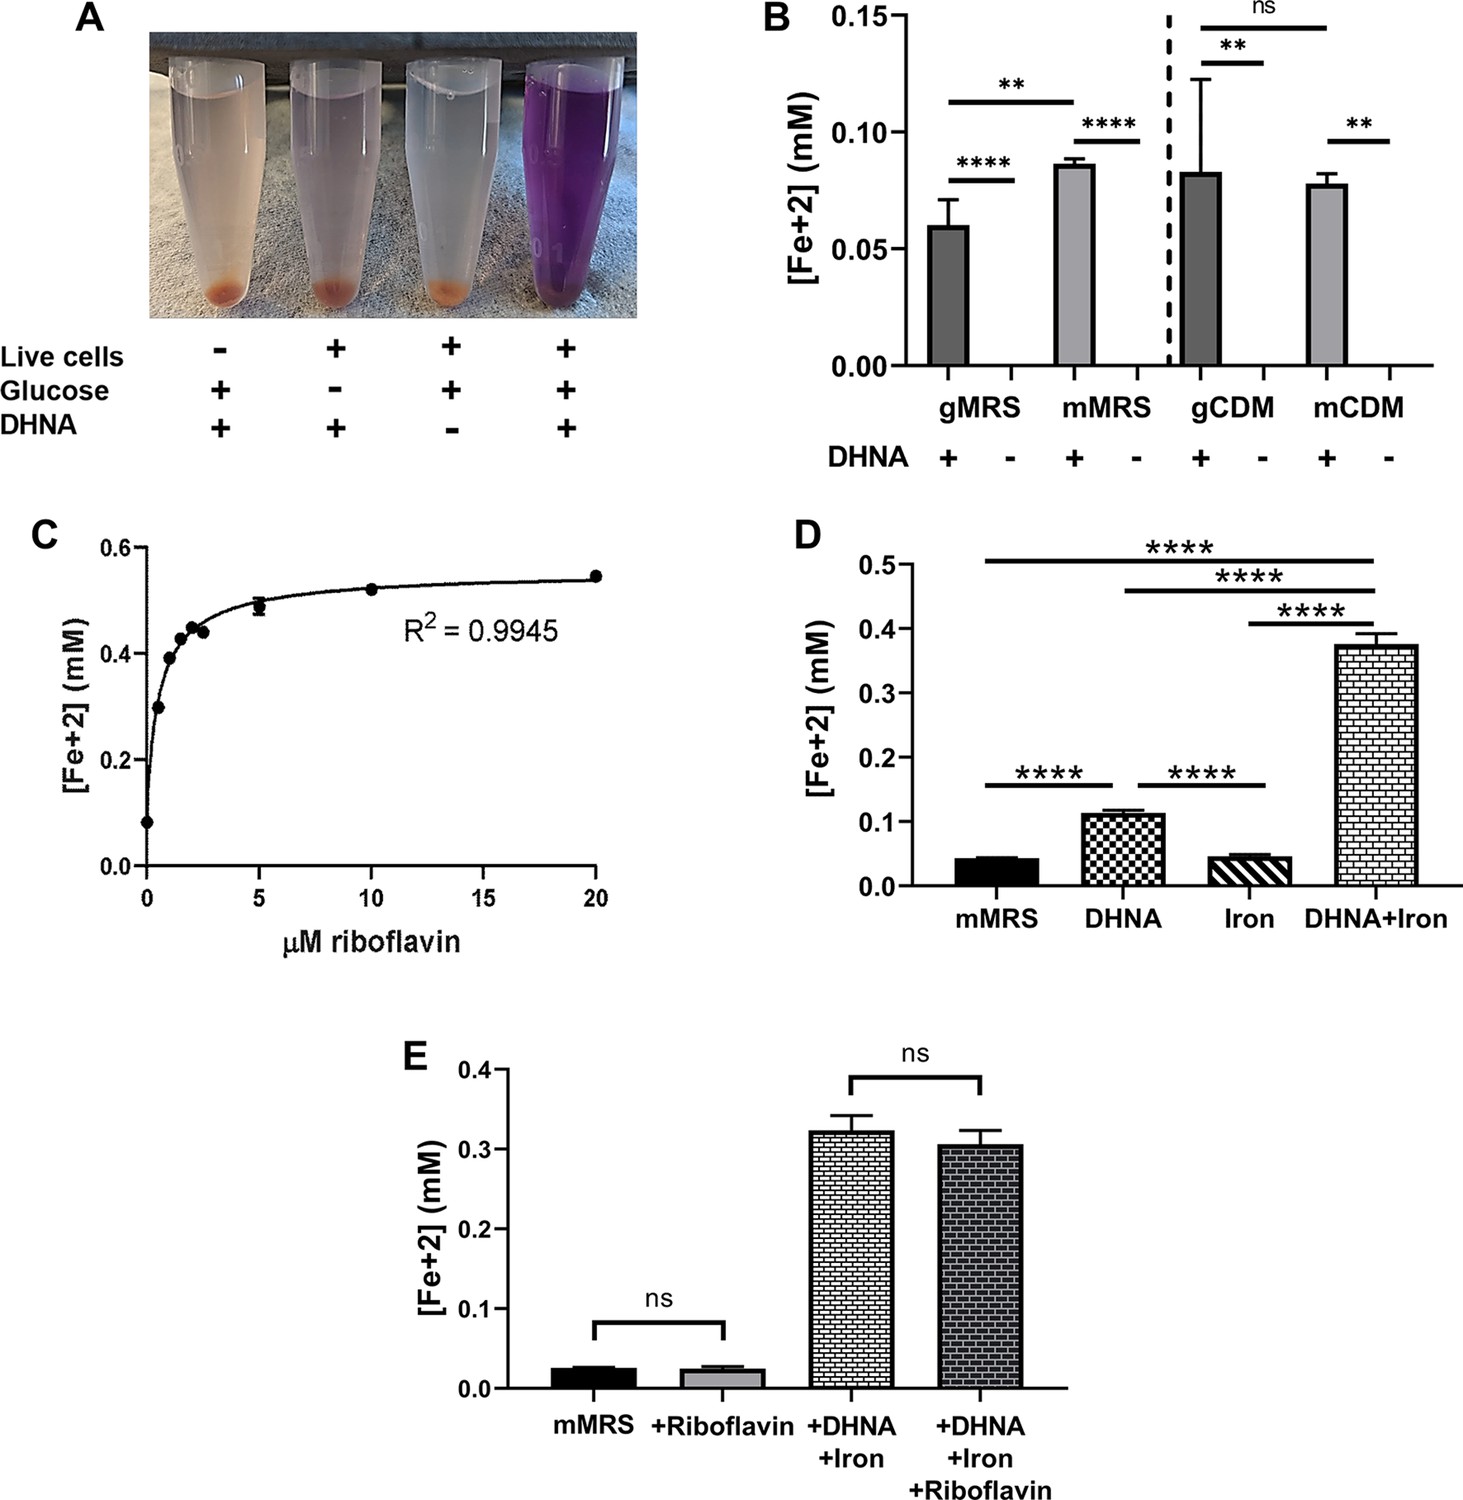
Iron reduction by L. plantarum is dependent upon DHNA, carbon source, and riboflavin.
(A) Reduction of Fe3+ (ferrihydrite) to Fe2+ by L. plantarum NCIMB8826 after growth in MRS with glucose (gMRS). The assays were performed in PBS supplemented with 20 µg/mL DHNA and/or 55 mM glucose. For L. plantarum inactivation, cells were incubated at 85℃ in PBS for 30 min prior to the assay. (B) Reduction of ferrihydrite by L. plantarum after growth in MRS with glucose (gMRS) or mannitol (mMRS) or CDM with glucose (gCDM) or mannitol (mCDM). The ferrihydrite reduction assays were performed in PBS supplemented with 20 µg/mL DHNA and the corresponding carbon source (55 mM glucose or mannitol). (C) Reduction of ferrihydrite by L. plantarum in the presence of 20 μg/mL DHNA, 55 mM mannitol, and increasing concentrations of riboflavin. (D and E) Reduction of ferrihydrite by L. plantarum after growth to mid-exponential phase in mMRS with or without the supplementation of 20 μg/mL DHNA, iron (1.25 mM ferric ammonium citrate), and/or 2.5 μM riboflavin. Significant differences in iron reduction were determined by one-way ANOVA with Tukey’s post-hoc test (n = 3), ** p < 0.01; **** p < 0.0001. The avg± stdev of three biological replicates is shown. See related data in Figure 1—figure supplement 1—source data 1.
-
Figure 1—figure supplement 1—source data 1
Raw data of Figure 1—figure supplement 1A-F.
- https://cdn.elifesciences.org/articles/70684/elife-70684-fig1-figsupp1-data1-v2.xlsx
Figure 1—figure supplement 2

Current production by L. plantarum is a biotic process dependent on DHNA, carbon source, and riboflavin.
(A) Abiotic current density response in bioelectrochemical reactors over time in mannitol-containing MRS (mMRS) upon DHNA (20 μg/mL) addition. Current density produced by L. plantarum in (B) mMRS with 20 μg/mL DHNA or (C) gMRS with 20 μg/mL DHNA. (D) Effect of riboflavin addition on current density production by L. plantarum in mannitol-containing CDM (mCDM) with 20 μg/mL DHNA. The avg± stdev of three biological replicates is shown. See related data in Figure 1—figure supplement 2—source data 1.
-
Figure 1—figure supplement 2—source data 1
Raw data of Figure 1—figure supplement 2A-D.
- https://cdn.elifesciences.org/articles/70684/elife-70684-fig1-figsupp2-data1-v2.xlsx
Figure 1—figure supplement 3
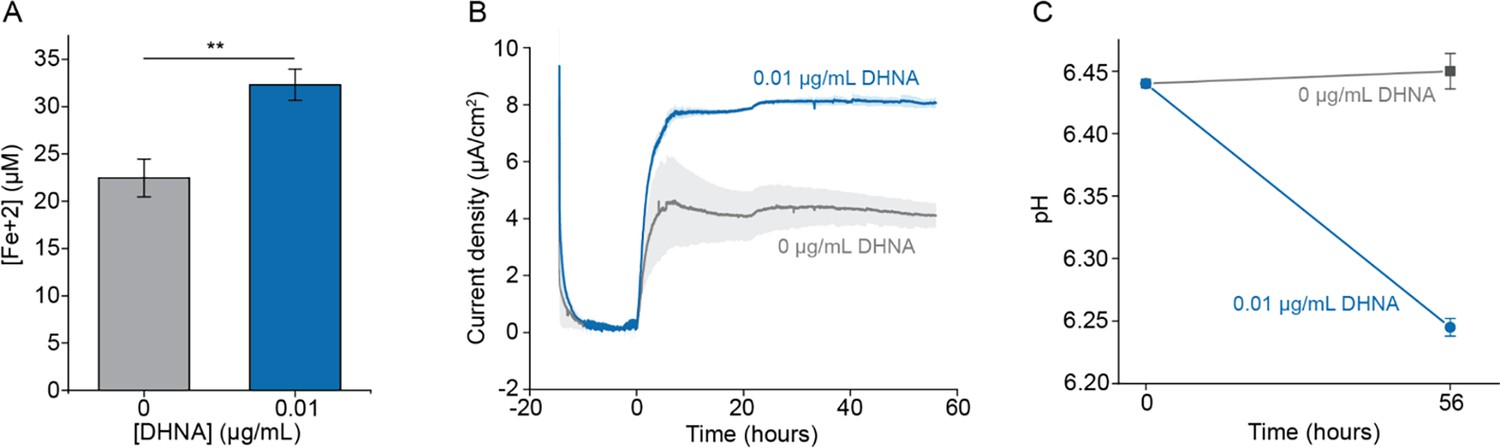
A sub-physiological concentration of DHNA stimulates EET in L. plantarum.
Reduction of Fe3+ (iron III oxide nanoparticle, primarily γ-Fe2O3) to Fe2+ (A) and current production (B) by L. plantarum when 0.01 μg/mL DHNA was supplied. (C) pH measurements at 0 and 56 hr for the experiment shown in (B). The avg± stdev is shown. Three replicates for (A) and two replicates for (B) and (C). Significant differences were determined by two-tailed t-test, **p ≤ 0.01. See related data in Figure 1—figure supplement 3—source data 1.
-
Figure 1—figure supplement 3—source data 1
Raw data of Figure 1—figure supplement 3A-C.
- https://cdn.elifesciences.org/articles/70684/elife-70684-fig1-figsupp3-data1-v2.xlsx
Figure 2 with 2 supplements
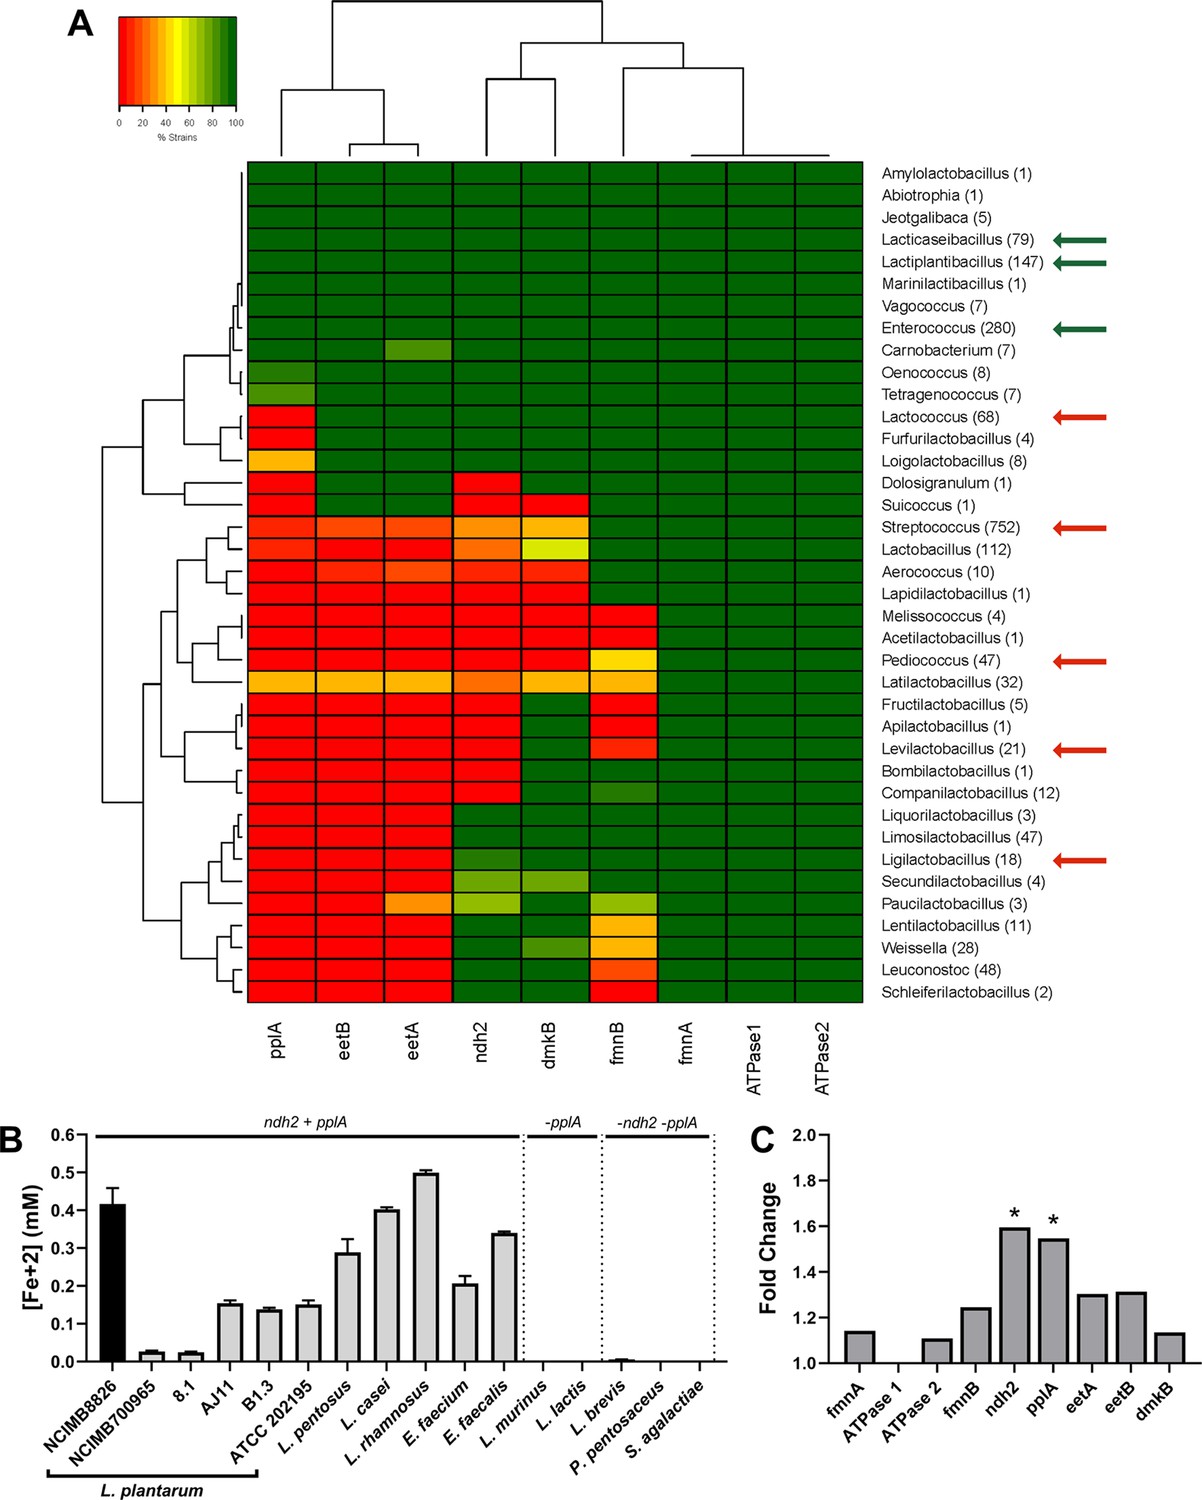
The FLEET genes ndh2 and pplA are associated with iron reduction by LAB.
(A) Heatmap showing the genera in the Lactobacillales order containing FLEET genes. Homology searches were conducted using tBLASTx for 1788 complete LAB genomes in NCBI (downloaded 02/25/2021) against the L. plantarum NCIMB8826 FLEET locus. A match was considered positive with a Bit-score >50 and an E-value of <10–3. Arrows designate genera tested for iron reduction activity; green = EET-active with Fe3+, red = EET-inactive with Fe3+. (B) Reduction of ferrihydrite in PBS with 20 μg/mL DHNA and 55 mM mannitol after growth in mMRS supplemented with 20 μg/mL DHNA and 1.25 mM ferric ammonium citrate. The avg ± stdev of three biological replicates per strain is shown. (C) Relative expression of NCIMB8826 FLEET locus genes in mMRS with 20 μg/mL DHNA and 1.25 mM ferric ammonium citrate compared to growth in mMRS. Significant differences in expression were determined by the Wald test (n = 3) with a Log2 (fold change) > 0.5 and an FDR-adjusted p-value of <0.05. See also Figure 2—figure supplement 1 and Figure 2—figure supplement 2 and related data in Figure 2—source data 1.
-
Figure 2—source data 1
EET locus homology matches at genus level via tBLASTx from complete Lactobacillales genome dataset for Figure 2A, raw data for Figure 2B and relative expression data of Figure 2C.
- https://cdn.elifesciences.org/articles/70684/elife-70684-fig2-data1-v2.xlsx
Figure 2—figure supplement 1

Conservation of FLEET locus genes among lactobacilli.
Heatmap showing the bacteria in the Lactobacillus-genus complex containing genes in the FLEET locus. Homology searches were conducted using tBLASTx for 1788 complete LAB genomes in NCBI (downloaded 02/25/2021) against the L. plantarum NCIMB8826 FLEET locus. A match was considered positive with a Bit-score >50 and an E-value of <10–3. See related data in Figure 2—figure supplement 1—source data 1.
-
Figure 2—figure supplement 1—source data 1
EET locus homology dataset of Figure 2—figure supplement 1.
- https://cdn.elifesciences.org/articles/70684/elife-70684-fig2-figsupp1-data1-v2.xlsx
Figure 2—figure supplement 2
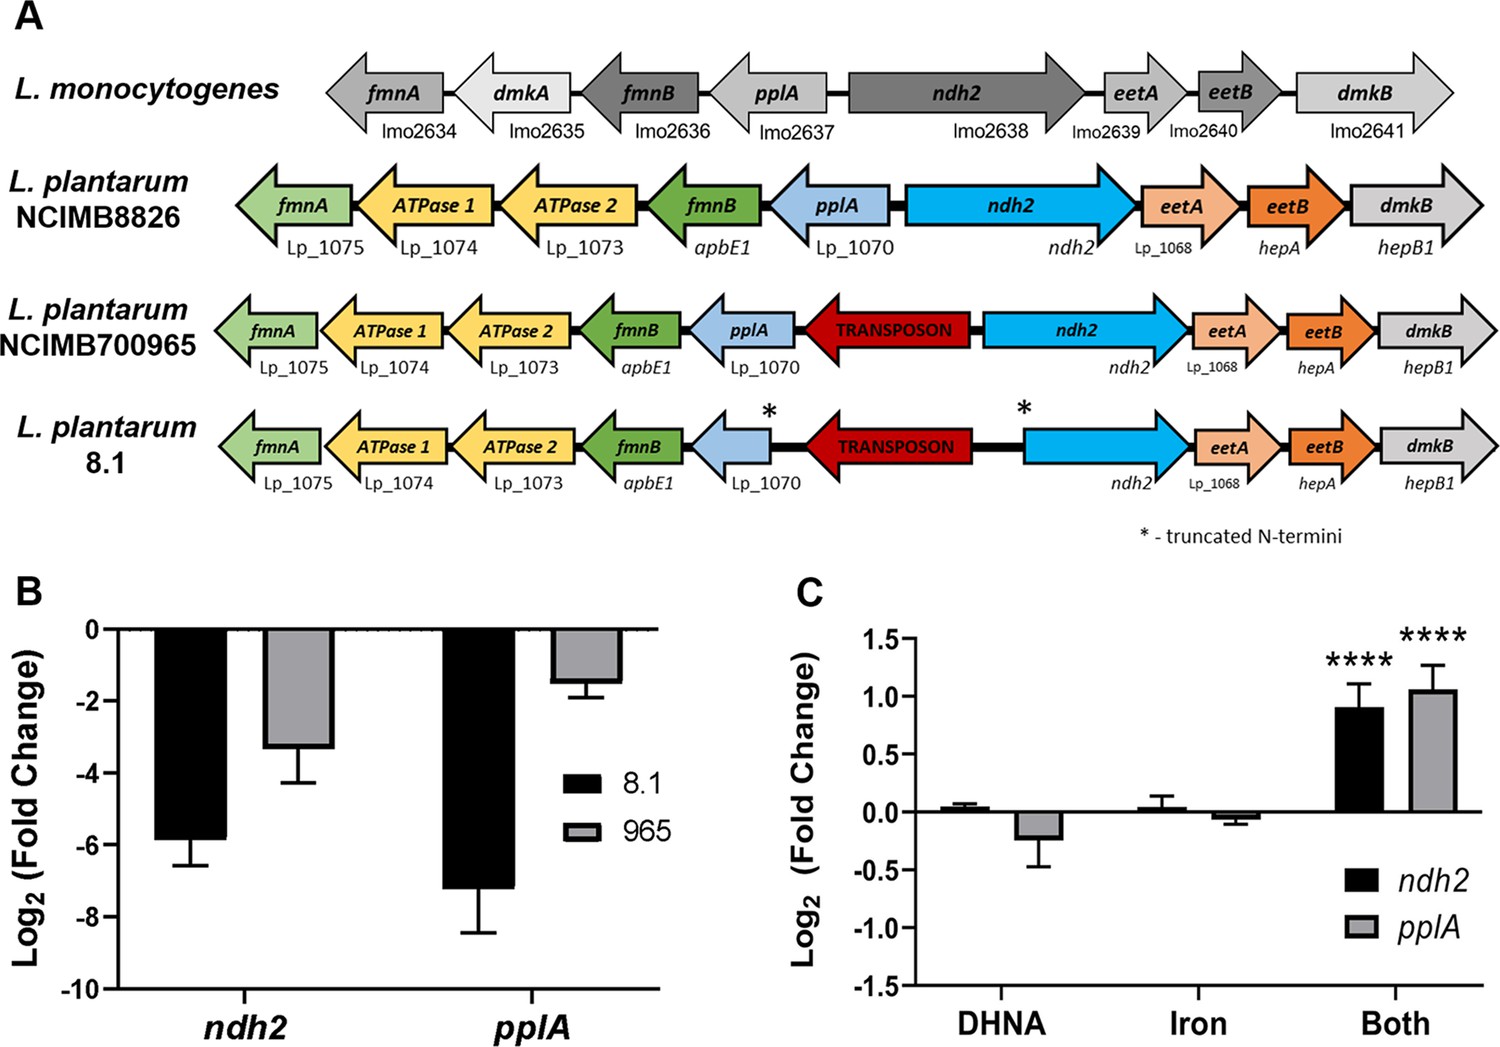
ndh2 and pplA are required for iron reduction through EET.
(A) Visualization of the FLEET locus in L. monocytogenes and three strains of L. plantarum. Genes are annotated based on predicted functions within the FLEET system. (B) Relative expression of ndh2 and pplA in L. plantarum strains 8.1 and NCIMB700965 (“965”) during growth in MRS compared to L. plantarum NCIMB8826. The avg± stdev of three biological replicates is shown. (C) Relative expression of ndh2 and pplA in L. plantarum during growth in mMRS containing 20 μg/mL DHNA, iron (1.25 ferric ammonium citrate), or both (DHNA and iron), compared to during growth in mMRS. Significant differences determined through Two-way ANOVA with Sidak’s post-hoc test (n = 3), **** p < 0.0001. See related data in Figure 2—figure supplement 2—source data 1.
-
Figure 2—figure supplement 2—source data 1
Relative expression dataset of Figure 2—figure supplement 2.
- https://cdn.elifesciences.org/articles/70684/elife-70684-fig2-figsupp2-data1-v2.xlsx
Figure 3 with 2 supplements
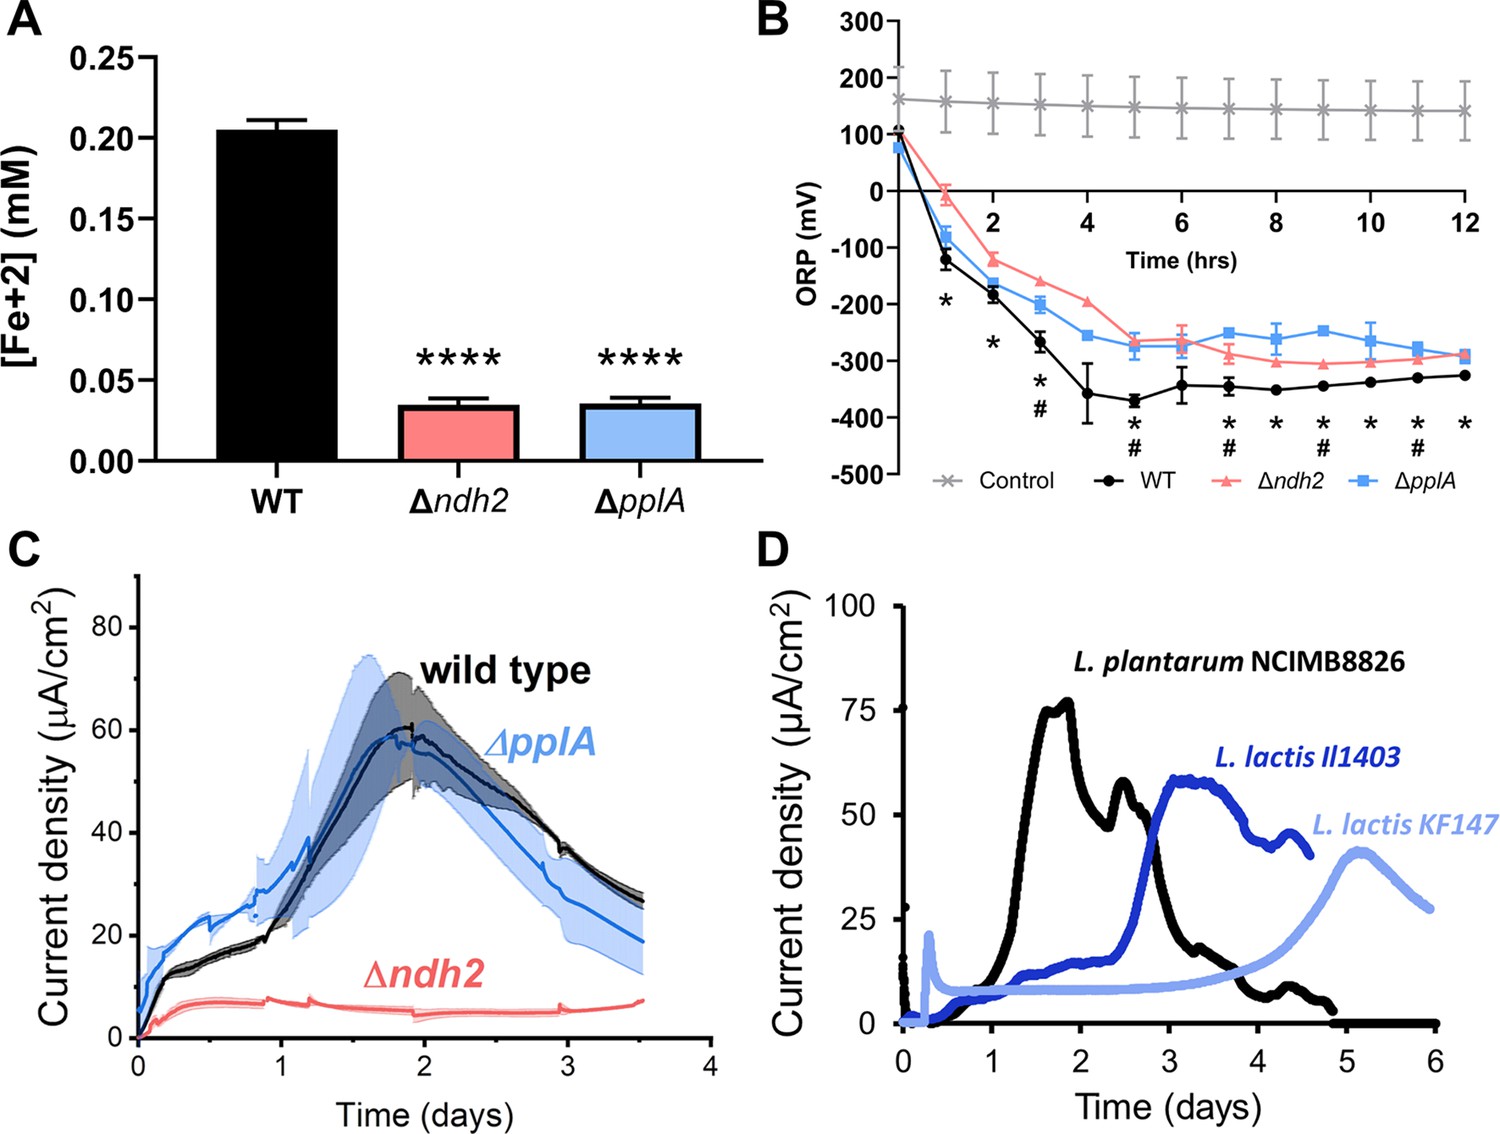
L. plantarum requires ndh2 and conditionally pplA for EET.
(A) Reduction of Fe3+ (ferrihydrite) to Fe2+ with wild-type L. plantarum or EET deletion mutants in the presence of 20 μg/mL DHNA and 55 mM mannitol after growth in mMRS supplemented with 20 μg/mL DHNA and 1.25 mM ferric ammonium citrate. Significant differences determined by one-way ANOVA with Dunnett’s post-hoc test, **** p < 0.0001. (B) Redox potential of mMRS supplemented with 20 μg/mL DHNA and 1.25 mM ferric ammonium citrate after inoculation with wild-type L. plantarum or EET deletion mutants. Significant ORP differences between the wild-type and mutant strains determined by two-way RM ANOVA with Tukey’s post-hoc test, * p < 0.05 (WT vs. Δndh2); # p < 0.05 (WT vs. ΔpplA). (C) Current density generated by wild-type L. plantarum and deletion mutants in mCDM supplemented with 20 μg/mL DHNA. The avg ± stdev is shown. (D) Current density generated by L. plantarum and two L. lactis strains lacking pplA in mCDM. For L. plantarum, the mCDM was supplemented with 20 μg/mL DHNA. The data correspond to the average of two (D) or three (A to C) biological replicates per strain. See also Figure 3—figure supplement 1 and Figure 3—figure supplement 2 and related data in Figure 3—source data 1.
-
Figure 3—source data 1
Raw data of Figure 3A–C.
- https://cdn.elifesciences.org/articles/70684/elife-70684-fig3-data1-v2.xlsx
Figure 3—figure supplement 1
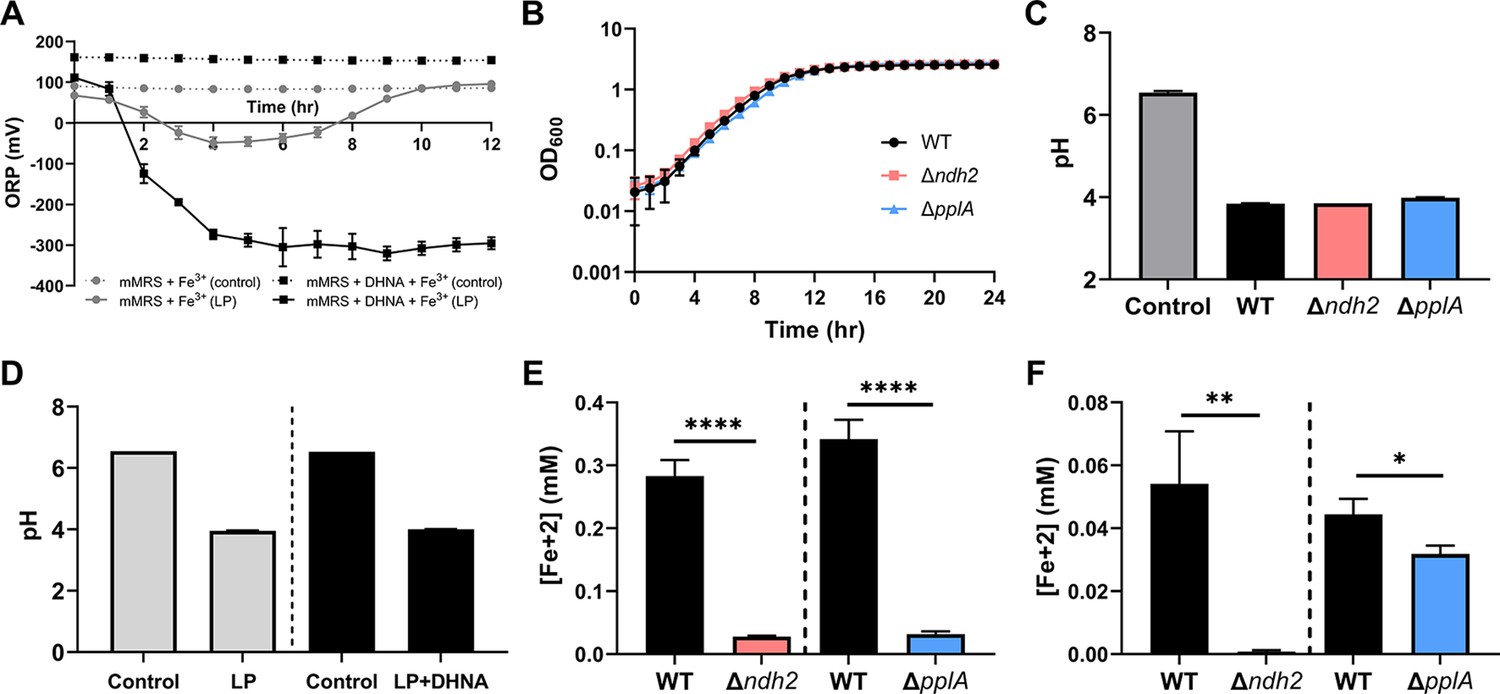
Impact of ndh2 and pplA deletion on growth, iron reduction, current density, and metabolites production.
(A) Redox potential of mMRS supplemented with 1.25 mM ferric ammonium citrate after inoculation with wild-type L. plantarum. Where indicated, 20 μg/mL DHNA was supplemented as well. (B) Growth of wild-type L. plantarum, Δndh2, or ΔpplA in mMRS supplemented with 20 μg/mL DHNA and 1.25 mM ferric ammonium citrate. (C) Final pH from Figure 3B. (D) Final pH from Figure 3—figure supplement 1A. (E and F) Reduction of ferrihydrite by L. plantarum or FLEET deletion mutants from Figure 3B in the ferrihydrite reduction assay at (E) ΔmVmax ( ~ 5 hr) or (F) stationary phase (12 hr). Significant differences determined through Two-tailed t-test (n = 3), * p < 0.05; ** p < 0.01; **** p < 0.0001. The avg ± stdev of three biological replicates is shown. See related data in Figure 3—figure supplement 1—source data 1.
-
Figure 3—figure supplement 1—source data 1
Raw data of Figure 3—figure supplement 1A-F.
- https://cdn.elifesciences.org/articles/70684/elife-70684-fig3-figsupp1-data1-v2.xlsx
Figure 3—figure supplement 2
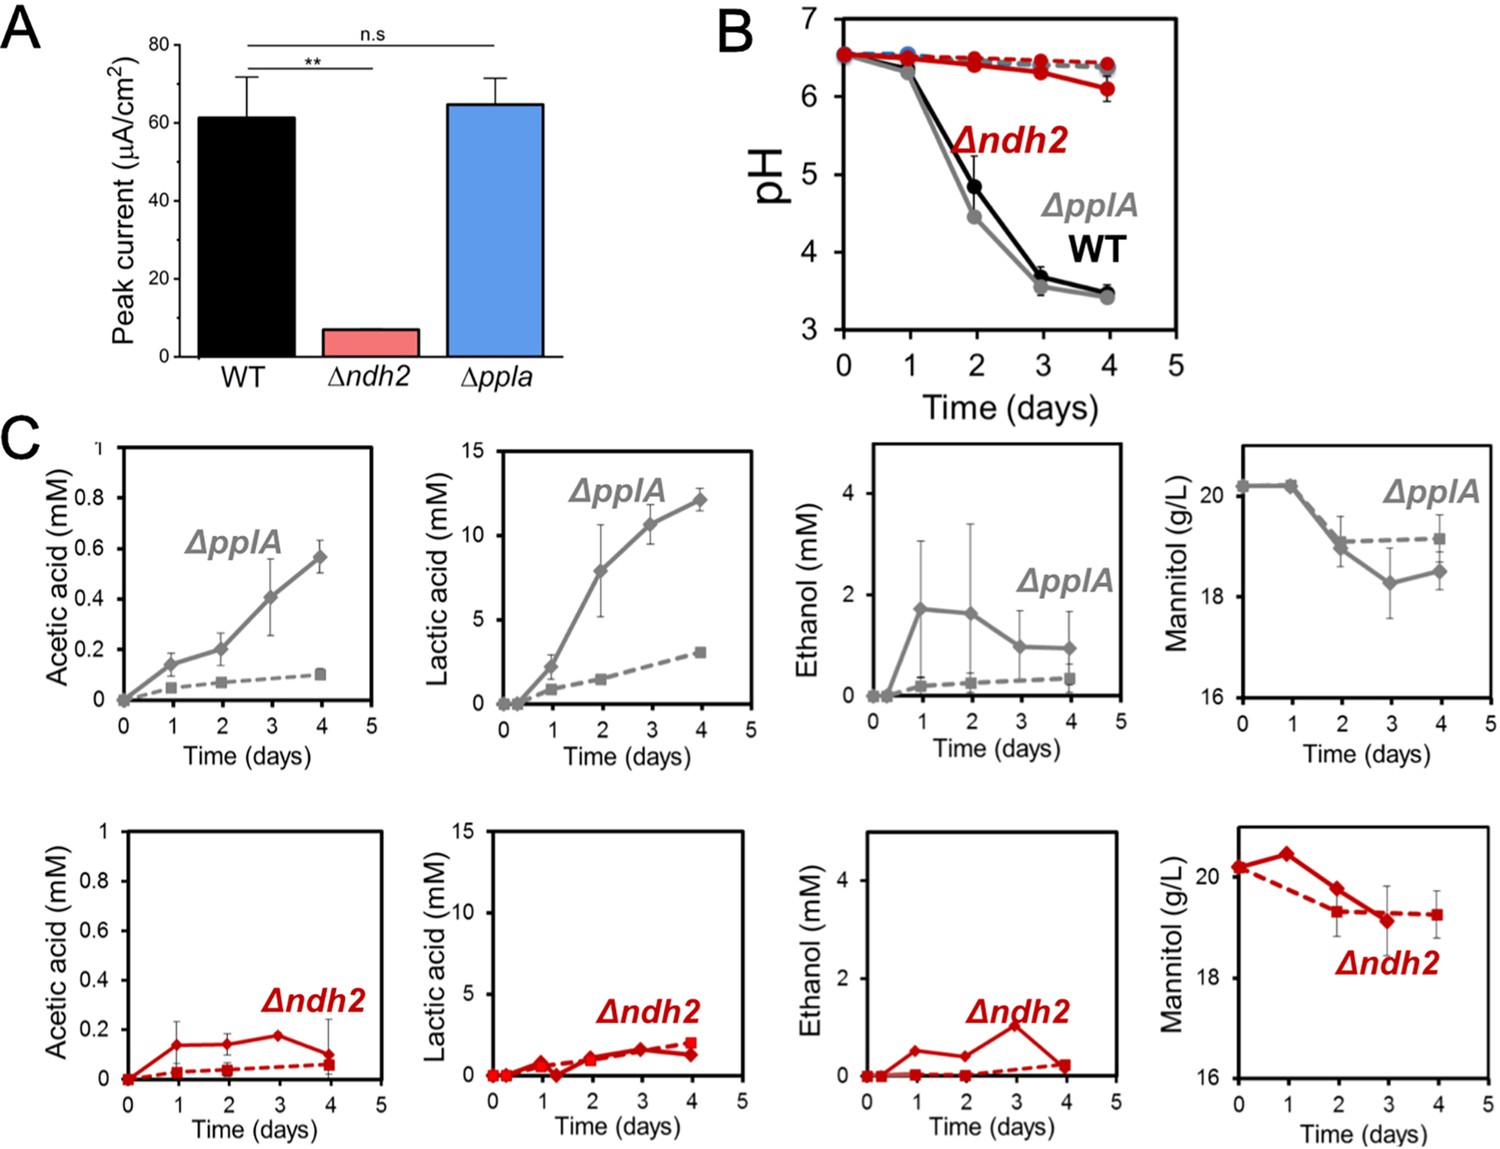
Impact of ndh2 and pplA deletion on maximum current density, pH and metabolites production.
(A) Peak current generated by wild-type L. plantarum or either the Δndh2 or ΔpplA mutant from Figure 3C. (B) pH measurements and (C) metabolites produced in the bioelectrochemical reactors inoculated with wild-type L. plantarum or either the Δndh2 or ΔpplA mutant from Figure 3C. Solid lines denote the presence of an anode polarized to +0.2 V (vs Ag/AgCl sat. KCl) while dashed lines denote open circuit conditions. See related data in Figure 3—figure supplement 2—source data 1.
-
Figure 3—figure supplement 2—source data 1
Raw data of Figure 3—figure supplement 2A-C.
- https://cdn.elifesciences.org/articles/70684/elife-70684-fig3-figsupp2-data1-v2.xlsx
Figure 4 with 3 supplements
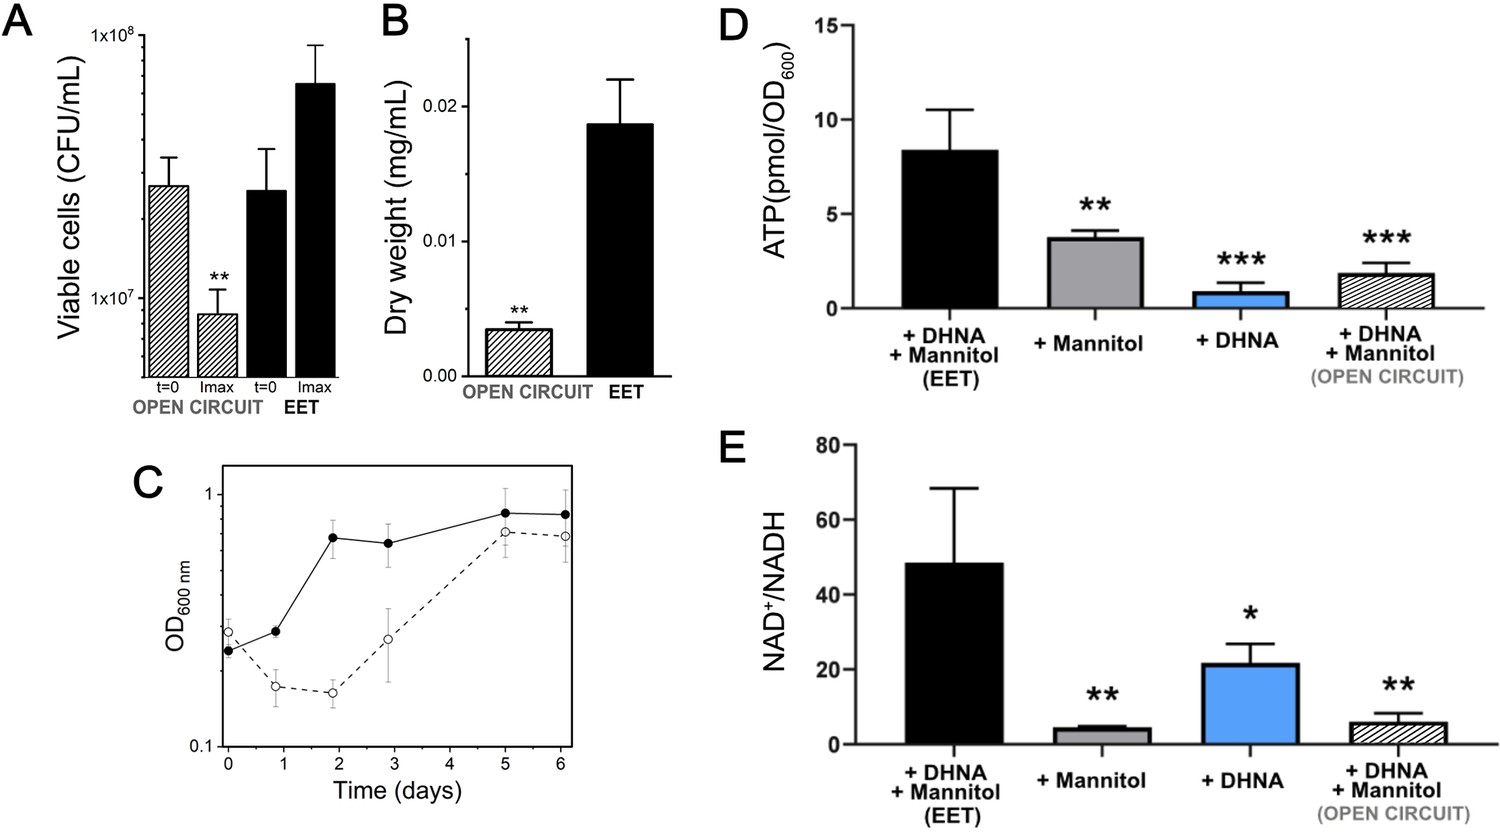
Growth, ATP, and redox balance of L. plantarum changes when an anode is provided as an extracellular electron acceptor.
These measurements and the current density plot shown in Figure 1C are from the same experiment. (A) Viable cells and (B) dry weight at the point of maximum current density under current circulating conditions (EET) and at open circuit conditions (OC) at the same time point. (C) Change in cell numbers measured by OD600 over time in the bioreactors under EET (continuous line) and OC conditions (dotted lines). (D) ATP production per OD600 unit and (E) NAD+/NADH ratios at the point of maximum current density. The bioreactors were shaken vigorously to dislodge cells before sampling. The avg ± stdev of three biological replicates is shown. Significant differences were determined by one-way ANOVA with (A and B) Dunn-Sidak post-hoc test (n = 3) and (D and E) Dunnett’s post-hoc test (n = 3), * p < 0.05; ** p < 0.01; *** p < 0.001; **** p < 0.0001. See also Figure 1 panel C and Figure 4—figure supplement 3 and related data in Figure 4—source data 1.
-
Figure 4—source data 1
Raw data of Figure 4A–D.
- https://cdn.elifesciences.org/articles/70684/elife-70684-fig4-data1-v2.xlsx
Figure 4—figure supplement 1
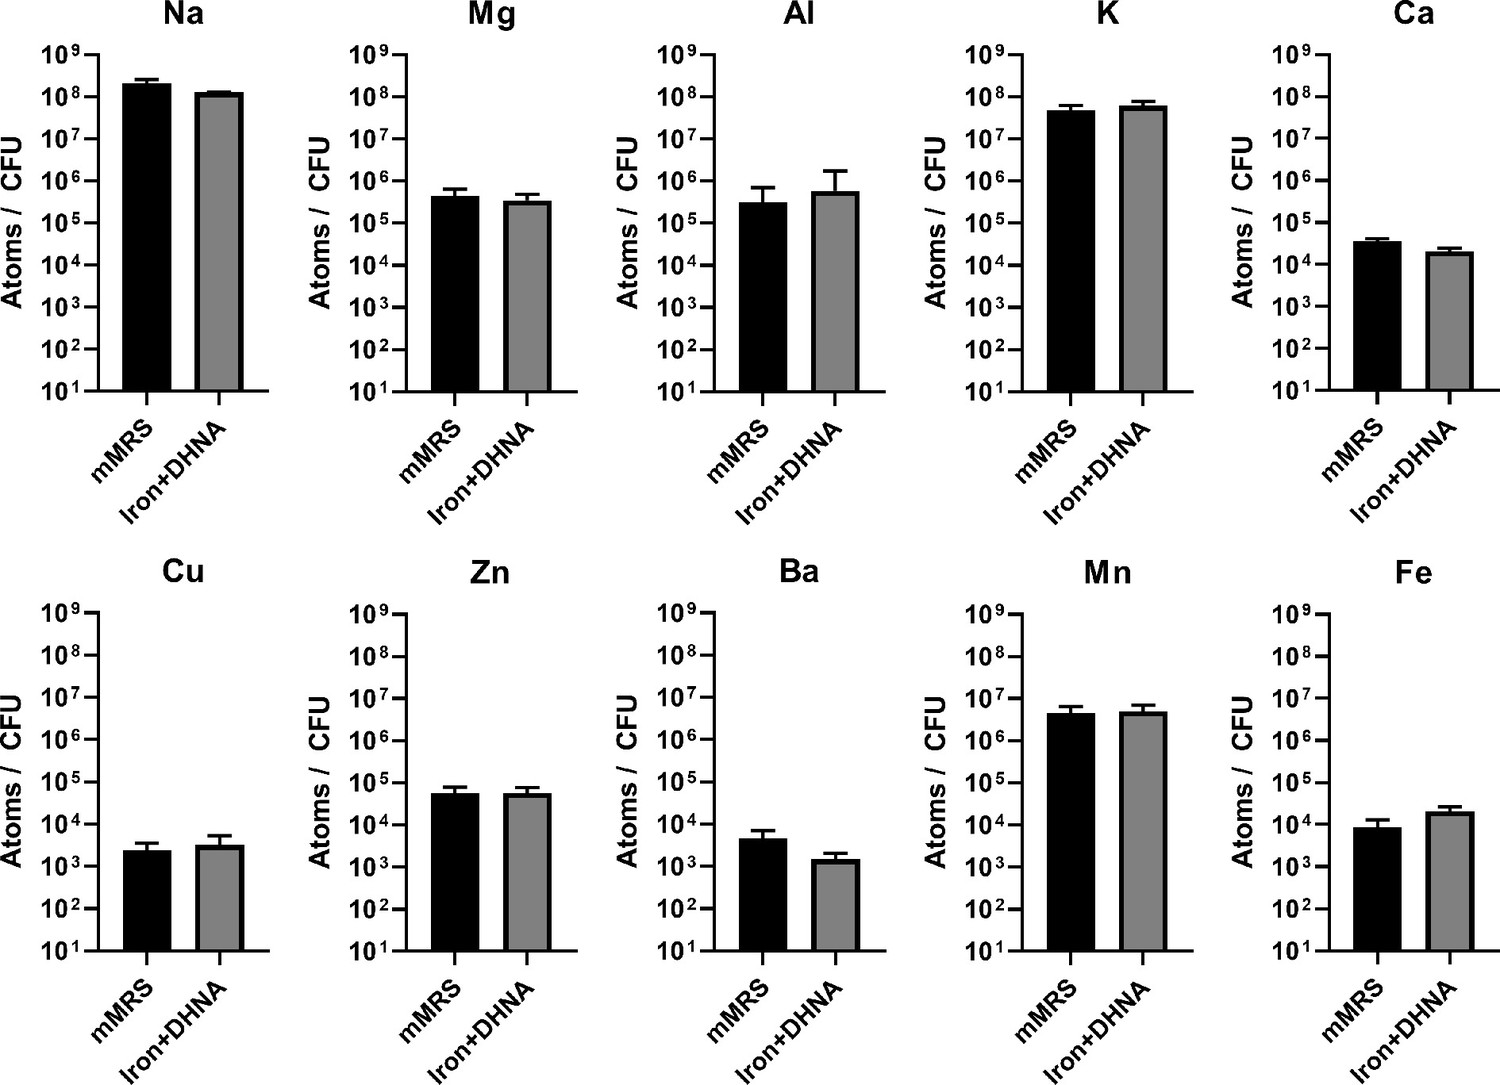
Intracellular metal concentrations in L. plantarum are not affected by EET-conducive growth conditions.
Inductively coupled plasma mass spectrometry (ICP-MS) quantification of intracellular metals in L. plantarum after growth for 18 hr in mMRS or mMRS supplemented with 20 μg/mL DHNA and iron (1.25 mM ferric ammonium citrate). The avg± stdev of three biological replicates is shown. See related data in Figure 4—figure supplement 1—source data 1.
-
Figure 4—figure supplement 1—source data 1
Raw data of Figure 4—figure supplement 1.
- https://cdn.elifesciences.org/articles/70684/elife-70684-fig4-figsupp1-data1-v2.xlsx
Figure 4—figure supplement 2
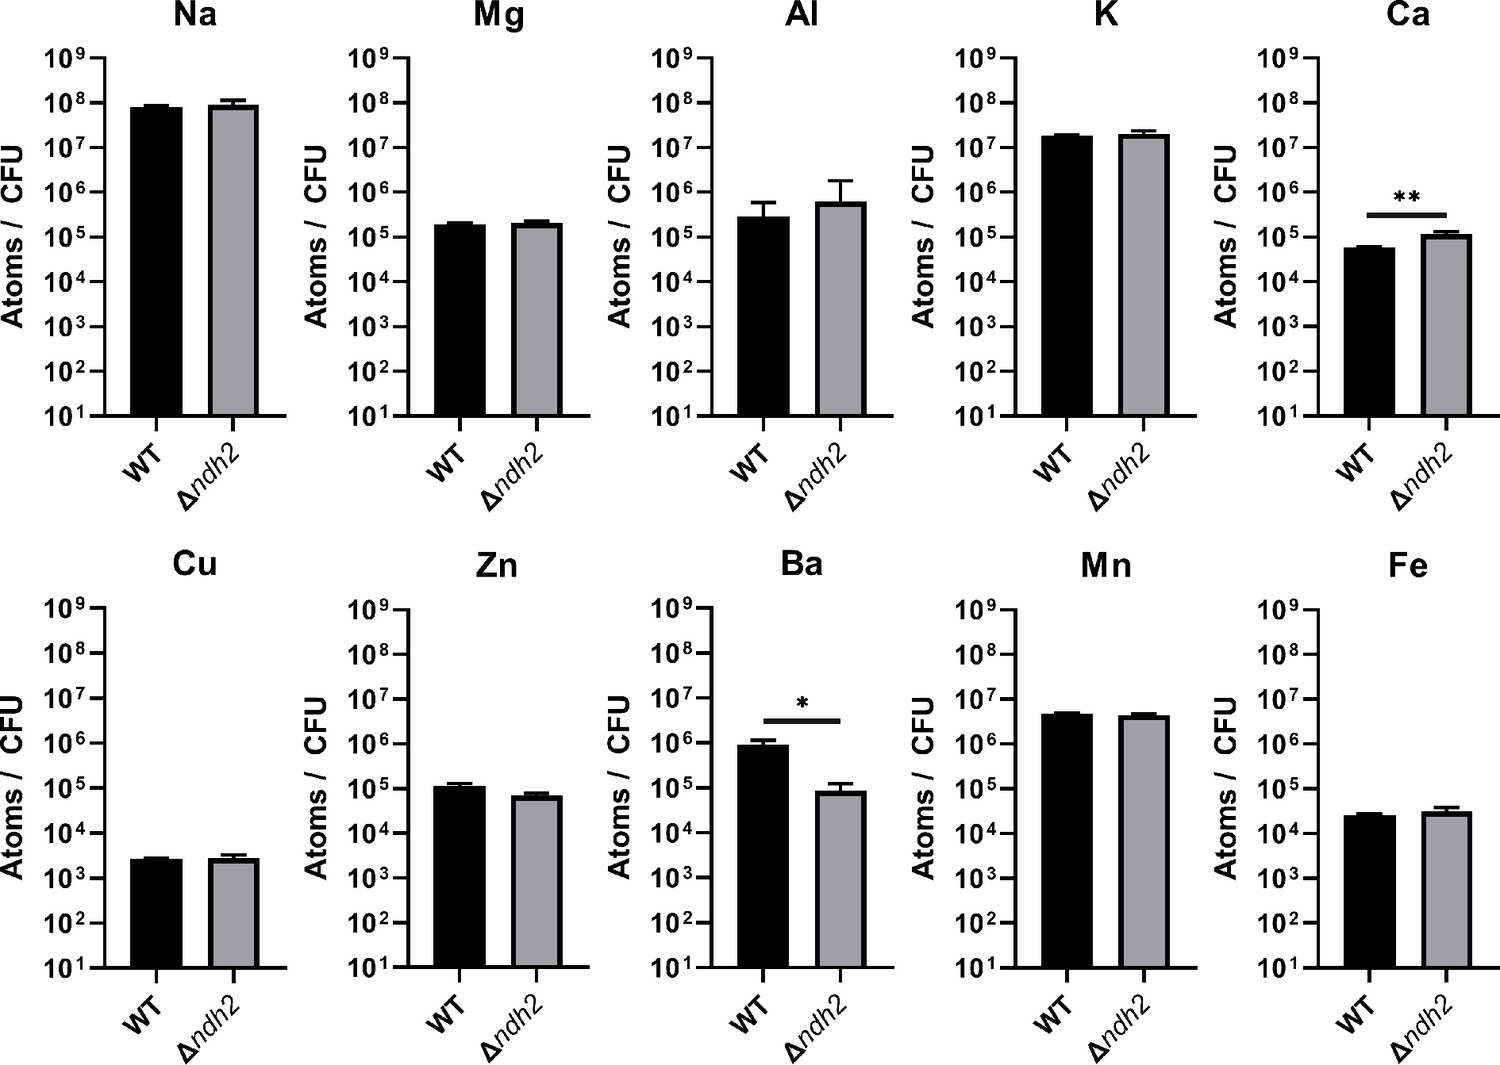
Redox-active metal concentrations in L. plantarum are not affected by the presence of ndh2.
Inductively coupled plasma mass spectrometry (ICP-MS) quantification of intracellular metals in wild-type L. plantarum and a L. plantarum ndh2 deletion mutant after growth for 18 hr in mMRS supplemented with 20 μg/mL DHNA and iron (1.25 mM ferric ammonium citrate). The avg ± stdev of three biological replicates is shown. Significant differences determined by one-way ANOVA with Dunnett’s post-hoc test, * p < 0.05; ** p < 0.01. See related data in Figure 4—figure supplement 2—source data 1.
-
Figure 4—figure supplement 2—source data 1
Raw data of Figure 4—figure supplement 1.
- https://cdn.elifesciences.org/articles/70684/elife-70684-fig4-figsupp2-data1-v2.xlsx
Figure 4—figure supplement 3
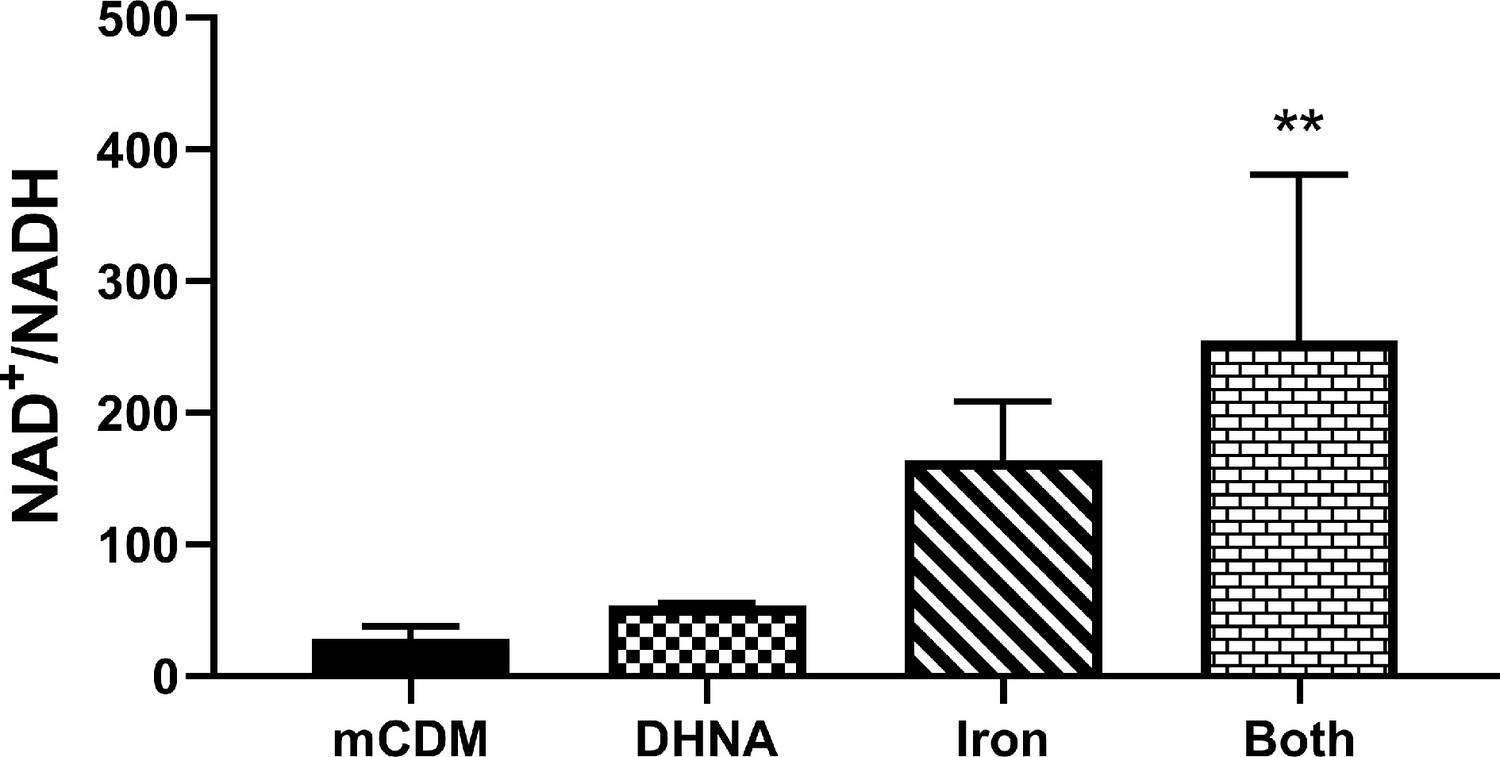
Use of Fe3+ as an electron acceptor allows L. plantarum to regenerate NAD+.
NAD+/NADH ratios of L. plantarum grown to mid-exponential phase in mCDM with/without the supplementation of 20 μg/mL DHNA, iron (1.25 mM ferric ammonium citrate), or both. The avg± stdev of three biological replicates is shown. Significant differences determined through one-way ANOVA with Dunnett’s post-hoc test (n = 3), ** p < 0.01. See related data in Figure 4—figure supplement 3—source data 1.
-
Figure 4—figure supplement 3—source data 1
Raw data of Figure 4—figure supplement 3.
- https://cdn.elifesciences.org/articles/70684/elife-70684-fig4-figsupp3-data1-v2.xlsx
Figure 5 with 2 supplements

Fermentation fluxes are increased when an anode is provided as an extracellular electron acceptor.
Results are from the same set of experiments as the current density plot shown in Figure 3C. (A) Metabolic yields of L. plantarum end-fermentation products under open circuit conditions (OC) and current circulating conditions (EET) in mCDM supplemented with 20 μg/mL DHNA. (B) pH measurements and (C) mannitol, (D) lactate, (E) acetate, and (F) ethanol concentrations over time under OC and EET conditions. (G) Schematic of proposed model for NADH regeneration during fermentation of mannitol in the presence of an anode as electron sink for L. plantarum. The avg ± stdev of three biological replicates is shown. Significant differences were determined by one-way ANOVA with Dunn-Sidak post-hoc (n = 3), ** p < 0.01. See also Figure 5—figure supplement 1 and Figure 5—figure supplement 2 and related data in Figure 5—source data 1.
-
Figure 5—source data 1
Raw data of Figure 5A–F.
- https://cdn.elifesciences.org/articles/70684/elife-70684-fig5-data1-v2.xlsx
Figure 5—figure supplement 1
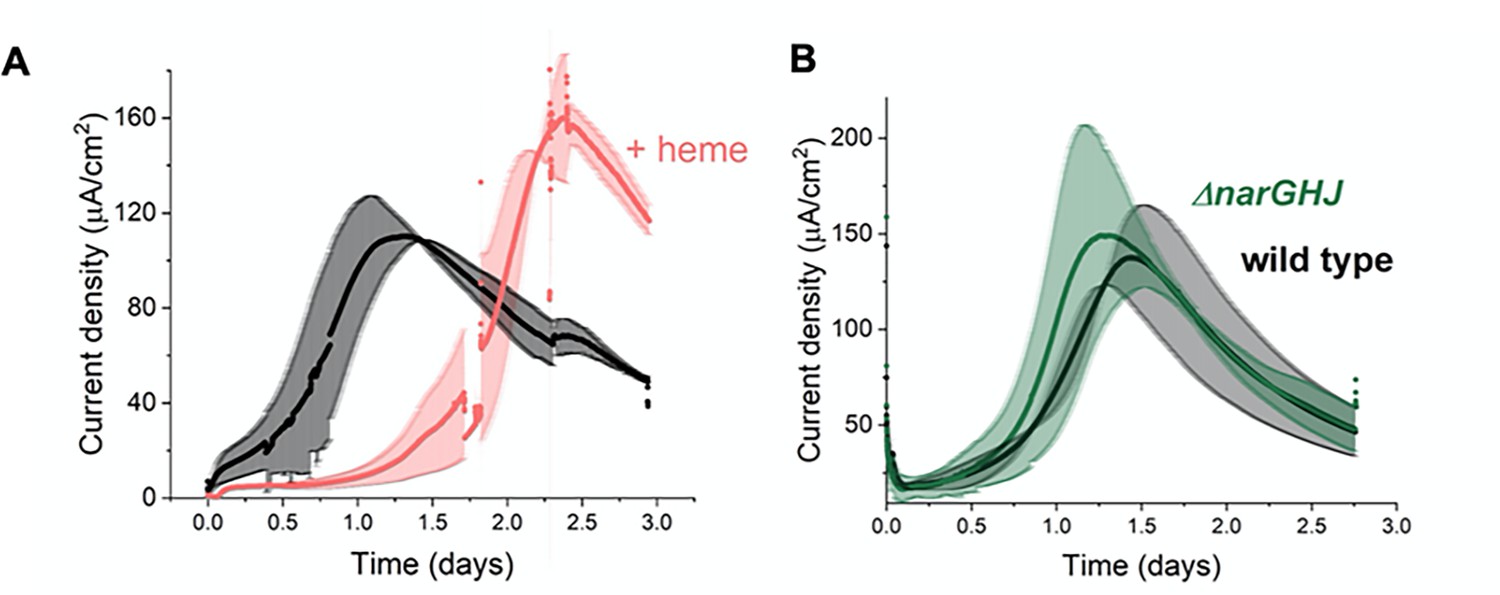
EET by L. plantarum is not dependent on aerobic or anaerobic respiration components.
(A) Effect on L. plantarum current production with heme addition to reconstitute the aerobic electron transport chain. (B) Effect on L. plantarum current production with the deletion of the nitrate reductase A. The anode was polarized to +0.2 V (vs Ag/AgCl sat. KCl). The avg± stdev of two biological replicates is shown. See related data in Figure 5—figure supplement 1—source data 1.
-
Figure 5—figure supplement 1—source data 1
Raw data of Figure 5—figure supplement 1A, B.
- https://cdn.elifesciences.org/articles/70684/elife-70684-fig5-figsupp1-data1-v2.xlsx
Figure 5—figure supplement 2
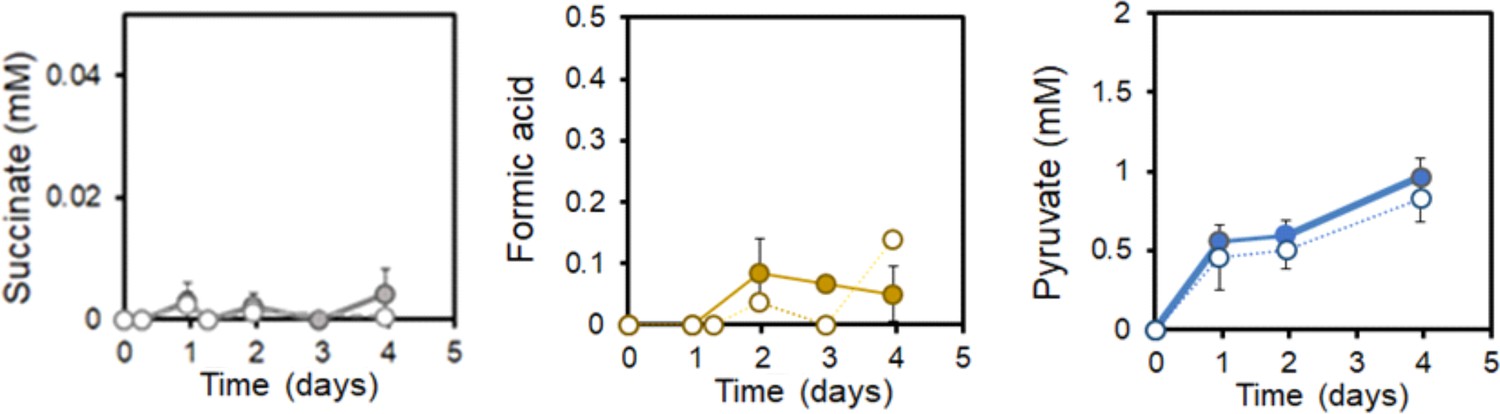
EET by L. plantarum does not involve TCA cycle metabolites.
Succinate, formate and pyruvate produced under EET (solid line) and open-circuit (dashed line) conditions from Figure 5. The avg± stdev of three biological replicates is shown. See related data in Figure 5—figure supplement 2—source data 1.
-
Figure 5—figure supplement 2—source data 1
Raw data of Figure 5—figure supplement 1.
- https://cdn.elifesciences.org/articles/70684/elife-70684-fig5-figsupp2-data1-v2.xlsx
Figure 6 with 1 supplement

EET in a kale juice increases the production of fermentation end products.
(A) Preparation of kale juice medium used for fermentation in bioelectrochemical reactors. (B) Current density production measured from kale juice medium over time in the presence of L. plantarum and 20 μg/mL DHNA, no DHNA, or under abiotic conditions with addition of 20 μg/mL DHNA. The anode polarization was maintained at 0.2 VAg/AgCl. (C) Normalized total quantities of the metabolites detected per cell (CFUmax used for calculations). (D) pH measurements over time under different conditions tested on a second set of kale juice fermentations performed under the same conditions. (E) Production rate per viable cell, r, of lactate, acetate, and succinate. The avg ± stdev of three biological replicates is shown. See also Figure 6—figure supplement 1 and related data in Figure 6—source data 1.
-
Figure 6—source data 1
Raw data of Figure 6B–E.
- https://cdn.elifesciences.org/articles/70684/elife-70684-fig6-data1-v2.xlsx
Figure 6—figure supplement 1
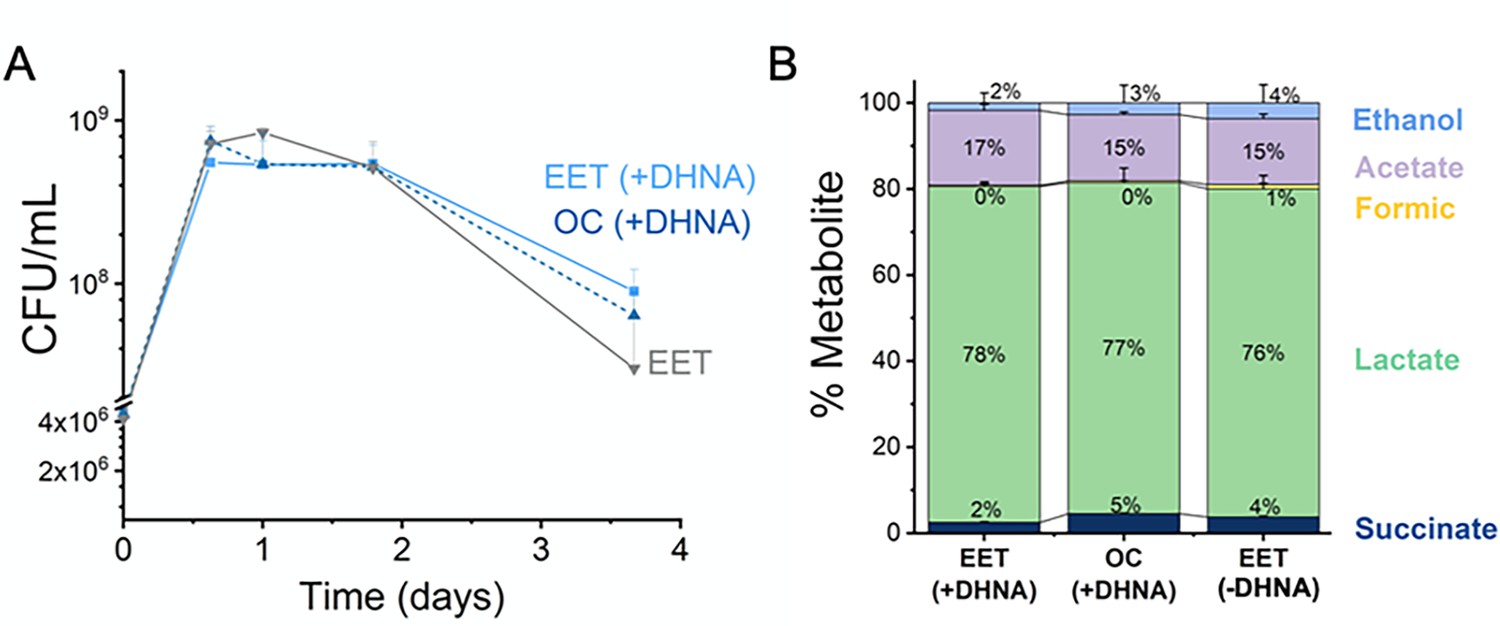
EET does not impact cell viability and distribution of metabolites in a kale fermentation.
(A) Viable cells of L. plantarum NCIMB8826-R during the fermentation of kale juice in the presence of a polarized anode with/without DHNA, and under open circuit conditions with DHNA. (B) Distribution of metabolites after 2 days of kale juice fermentation. The anode polarization was maintained at +0.2 V (vs Ag/AgCl sat. KCl). The avg± stdev of three biological replicates is shown. See related data in Figure 6—figure supplement 1—source data 1.
-
Figure 6—figure supplement 1—source data 1
Raw data of Figure 6—figure supplement 1A, B.
- https://cdn.elifesciences.org/articles/70684/elife-70684-fig6-figsupp1-data1-v2.xlsx
Tables
Table 1
Bioenergetic balances suggest energy conservation under EET conditions occurs via substrate-level phosphorylation.
The reactors contained 20 µg/mL of DHNA and mannitol as the electron donor. Balances were calculated with data obtained by day four from Figure 5. See also Supplementary file 1. SLP stands for substrate-level phosphorylation. Yfermentation refers to the total fermentation products obtained (see Supplementary file 1) per mol of sugar consumed. Ymannitol is the ATP produced from the total fermentation products per mol of sugar consumed, and YATP is the dry weight measured per mol of ATP produced from fermentation products.
| NADH consumed* | Calculated ATP†(from metabolites) | Biomass yield | Yfermentation | Ymannitol | YATP | |
|---|---|---|---|---|---|---|
| Units | mM | mM | g-dw/mol-mannitol | mmol product/mmol-mannitol | mol ATP/mol mannitol | g dw/mol ATP |
| EET | 6.44 ± 0.48 via anode16.69 ± 2.72 via SLP | 16.6 ± 1.5 | 4.85 ± 0.33 | 1.53 ± 0.13 | 1.59 ± 0.13 | 3.09 ± 0.36 |
| OC | 5.51 ± 0.97 via SLP | 5.7 ± 0.6 | 7.21 ± 1.41 | 0.87 ± 0.09 | 0.89 ± 0.09 | 8.06 ± 0.86 |
-
*
Calculated based on production of 3 mol of NADH produced per mol of mannitol, 1 mol of NAD+ per lactate, 2 mol of NAD+ per ethanol, 2 mol of NAD+ mol per succinate produced and 0.5 mmol of NAD+ per mol of electrons harvested on the anode.
-
†
Calculated based on production of 1 mol of ATP per lactate, 2 mol per acetate, 1 mol per ethanol, and 3 mol per succinate produced.
Key resources table
| Reagent type (species) or resource | Designation | Source or reference | Identifiers | Additional information |
|---|---|---|---|---|
| Strain, strain background (Lactiplantibacillus plantarum) | NCIMB8826 | Dandekar, 2019 | Strain information listed in Supplementary file 3 | |
| Strain, strain background (Lactiplantibacillus plantarum) | NCIMB8826-R | Yin et al., 2018 | Rifampicin-resistant mutant of NCIMB8826 | Strain information listed in Supplementary file 3 |
| Strain, strain background (Lactiplantibacillus plantarum) | MLES100 | This study | Deletion mutant of NCIMB8826 lacking ndh2 | Plasmid information listed in Supplementary file 3 |
| Strain, strain background (Lactiplantibacillus plantarum) | MLES101 | This study | Deletion mutant of NCIMB8826 lacking pplA | Plasmid information listed in Supplementary file 3 |
| Strain, strain background (Lactiplantibacillus plantarum) | MLEY100 | This study | Deletion mutant of NCIMB8826 lacking narGHIJ | Plasmid information listed in Supplementary file 3 |
| Strain, strain background (Lactiplantibacillus plantarum) | B1.3 | Yin et al., 2018 | Strain information listed in Supplementary file 3 | |
| Strain, strain background (Lactiplantibacillus plantarum) | AJJ11 | Yu et al., 2021 | Strain information listed in Supplementary file 3 | |
| Strain, strain background (Lactiplantibacillus plantarum) | 8.1 | Yu et al., 2021 | Strain information listed in Supplementary file 3 | |
| Strain, strain background (Lactiplantibacillus plantarum) | ATCC 202195 | Wright et al., 2020 | Strain information listed in Supplementary file 3 | |
| Strain, strain background (Lactiplantibacillus plantarum) | NCIMB700965 | Heeney and Marco, 2019 | Strain information listed in Supplementary file 3 | |
| Strain, strain background (Lactiplantibacillus pentosus) | BGM48 | Golomb et al., 2013 | Strain information listed in Supplementary file 3 | |
| Strain, strain background (Lactiplantibacillus casei) | BL23 | Mazé et al., 2010 | Strain information listed in Supplementary file 3 | |
| Strain, strain background (Levilactobacillus brevis) | ATCC 367 | Makarova et al., 2006 | Strain information listed in Supplementary file 3 | |
| Strain, strain background (Lactococcus lactis) | KF147 | Siezen et al., 2010b | Strain information listed in Supplementary file 3 | |
| Strain, strain background (Lactococcus lactis) | IL1403 | Bolotin et al., 2001 | Strain information listed in Supplementary file 3 | |
| Strain, strain background (Lactiplantibacillus Rhamnosus) | GG | Kankainen et al., 2009 | Strain information listed in Supplementary file 3 | |
| Strain, strain background (Lactiplantibacillus murinus) | ASF361 | Wannemuehler et al., 2014 | Strain information listed in Supplementary file 3 | |
| Strain, strain background (Enterococcus faecalis) | ATCC 29212 | Minogue et al., 2014 | Strain information listed in Supplementary file 3 | |
| Strain, strain background (Enterococcus faecalis) | ATCC 8459 | Kopit et al., 2014 | Strain information listed in Supplementary file 3 | |
| Strain, strain background (Pediococcus pentosaceus) | ATCC 25745 | Makarova et al., 2006 | Strain information listed in Supplementary file 3 | |
| Strain, strain background (Streptococcus agalactiae) | ATCC 27956 | McDonald and McDonald, 1976 | Strain information listed in Supplementary file 3 | |
| Strain, strain background(Escherichia coli) | DH5α | Taylor et al., 1993 | fhuA2 lac(del)U169 phoA glnV44 Φ80’ lacZ(del) M15 gyrA96 recA1 relA1 endA1 thi−one hsdR17, amplification of cloning vector |
Additional files
-
Supplementary file 1
Data used for calculating the bioenergetic balances.
- https://cdn.elifesciences.org/articles/70684/elife-70684-supp1-v2.docx
-
Supplementary file 2
Comparison of the energy metabolism discovered in this study with fermentation in LAB and anaerobic respiration in Geobacter spp.
- https://cdn.elifesciences.org/articles/70684/elife-70684-supp2-v2.docx
-
Supplementary file 3
Strains and plasmids used in this study.
- https://cdn.elifesciences.org/articles/70684/elife-70684-supp3-v2.docx
-
Supplementary file 4
Chemically defined medium.
- https://cdn.elifesciences.org/articles/70684/elife-70684-supp4-v2.docx
-
Supplementary file 5
Primers developed for this study.
- https://cdn.elifesciences.org/articles/70684/elife-70684-supp5-v2.docx
-
Supplementary file 6
Transcriptome read counts, alignment rate, and gene assignment rate.
- https://cdn.elifesciences.org/articles/70684/elife-70684-supp6-v2.docx
-
Transparent reporting form
- https://cdn.elifesciences.org/articles/70684/elife-70684-transrepform1-v2.docx
Download links
A two-part list of links to download the article, or parts of the article, in various formats.
Downloads (link to download the article as PDF)
Open citations (links to open the citations from this article in various online reference manager services)
Cite this article (links to download the citations from this article in formats compatible with various reference manager tools)
Extracellular electron transfer increases fermentation in lactic acid bacteria via a hybrid metabolism
eLife 11:e70684.
https://doi.org/10.7554/eLife.70684


