Systematic analysis of naturally occurring insertions and deletions that alter transcription factor spacing identifies tolerant and sensitive transcription factor pairs
- Department of Cellular and Molecular Medicine, School of Medicine, University of California San Diego, United States
- Department of Bioengineering, Jacobs School of Engineering, University of California San Diego, United States
- Department of Medicine, School of Medicine, University of California San Diego, United States
- Department of Medical Biochemistry, Experimental Vascular Biology, Amsterdam Infection and Immunity, Amsterdam Cardiovascular Sciences, Amsterdam UMC, University of Amsterdam, Netherlands
- Department of Medicine, McGill University, Canada
- Division of Biological Sciences, University of California San Diego, United States
- Department of Cellular and Molecular Medicine, College of Medicine, University of Arizona, United States
- Department of Biochemistry and Molecular Biology, Nippon Medical School, Japan
Figures
Figure 1 with 7 supplements
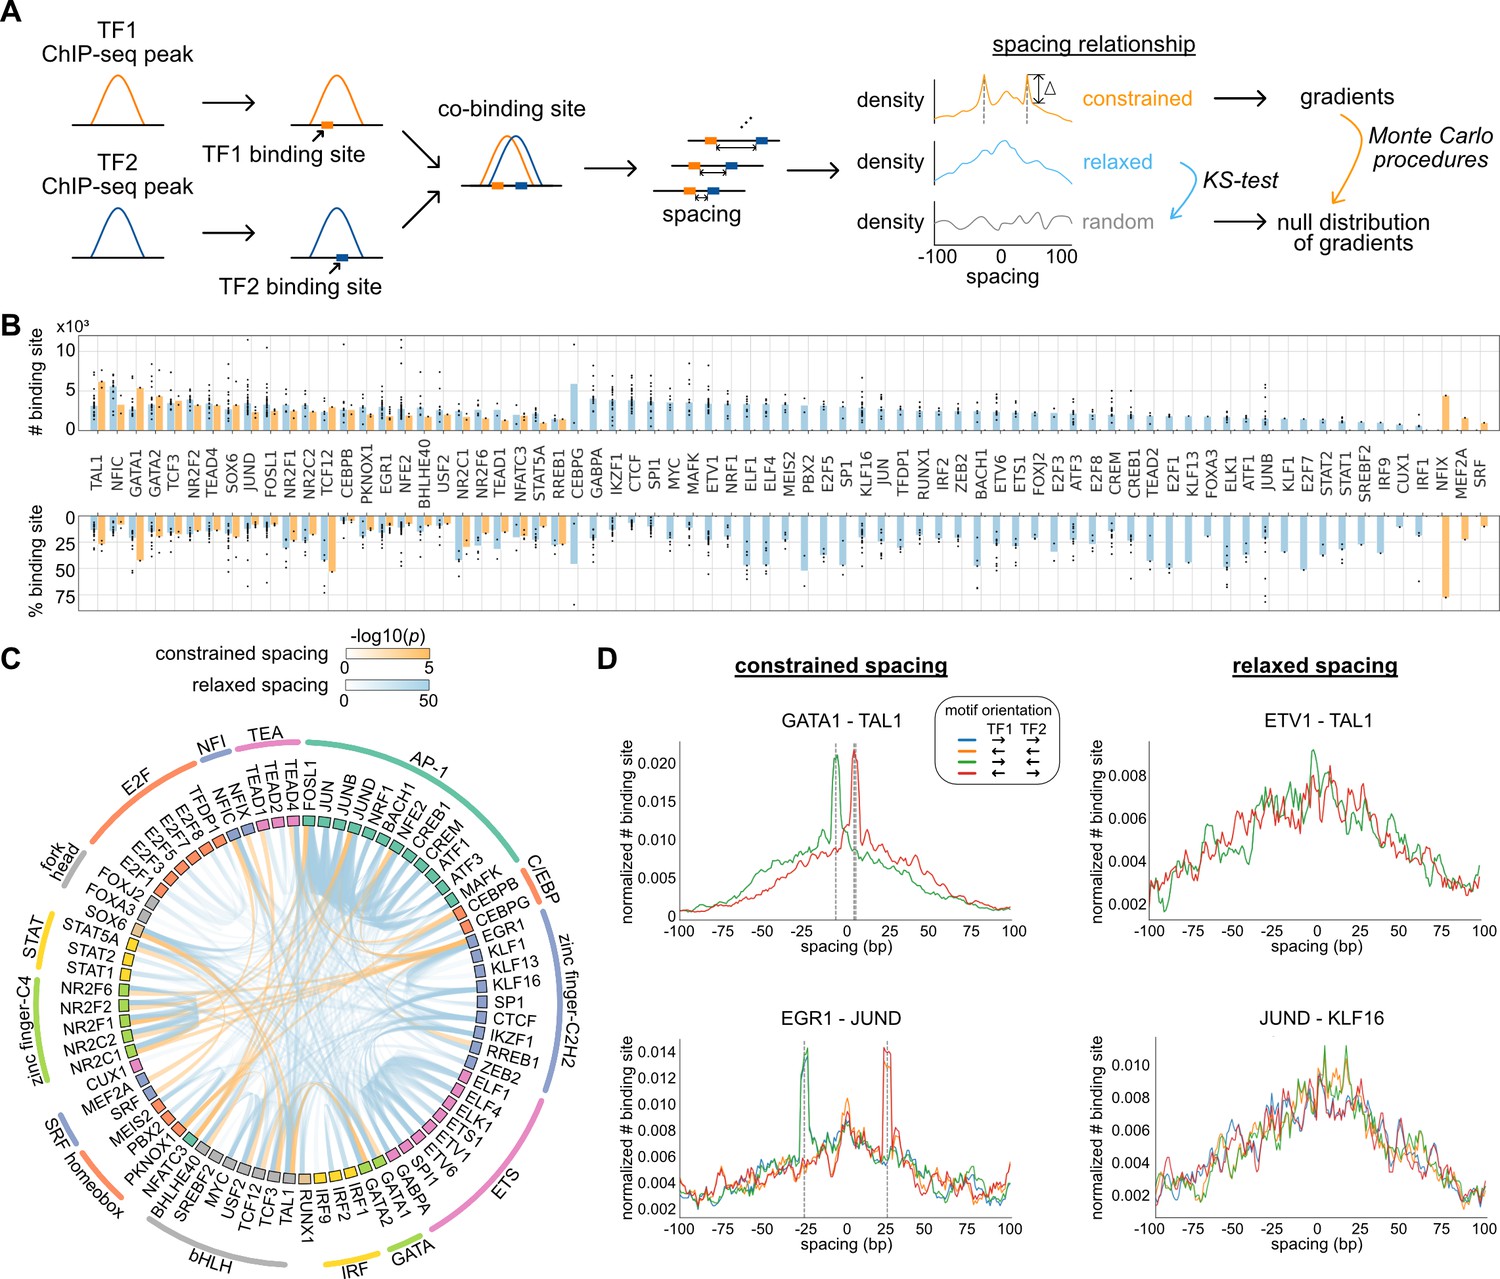
Characterization of spacing relationships for transcription factor (TF) pairs.
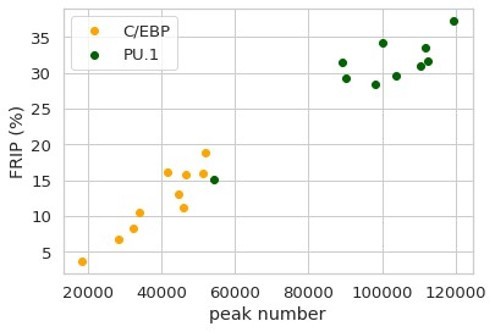
(A) Schematic of data analysis pipeline for characterizing the spacing relationships based on TF chromatin immunoprecipitation sequencing (ChIP-seq) data. (B) Dissection of TF binding sites for TFs in K562 cells based on spacing relationships with co-binding TFs. Each dot represents a TF pair. The bar heights indicate medians. (C) Circos plot summarizing spacing relationships for all the TF pairs analyzed. Orange and blue bands represent significant constrained and relaxed spacing relationships, respectively. Color opacity indicates the level of significance. TFs are grouped and colored by TF family. (D) The spacing distributions of example TF pairs with constrained spacing or relaxed spacing relationships. Dashed lines indicate the significant constrained spacings. Since TAL1 motif is completely palindromic, the motif orientation is only differentiated by its co-binding partners.
-
Figure 1—source data 1
The numbers of co-binding sites for every pair of 73 transcription factors (TFs).
A number represents chromatin immunoprecipitation sequencing (ChIP-seq) peaks of the TF on row that overlap with at least one ChIP-seq peak of the TF on column. Therefore, the number for (TF1, TF2) may not equal but should be close to the number for (TF2, TF1).
- https://cdn.elifesciences.org/articles/70878/elife-70878-fig1-data1-v2.csv
-
Figure 1—source data 2
Statistical test results for significant transcription factors (TF) pairs.
- https://cdn.elifesciences.org/articles/70878/elife-70878-fig1-data2-v2.txt
Figure 1—figure supplement 1
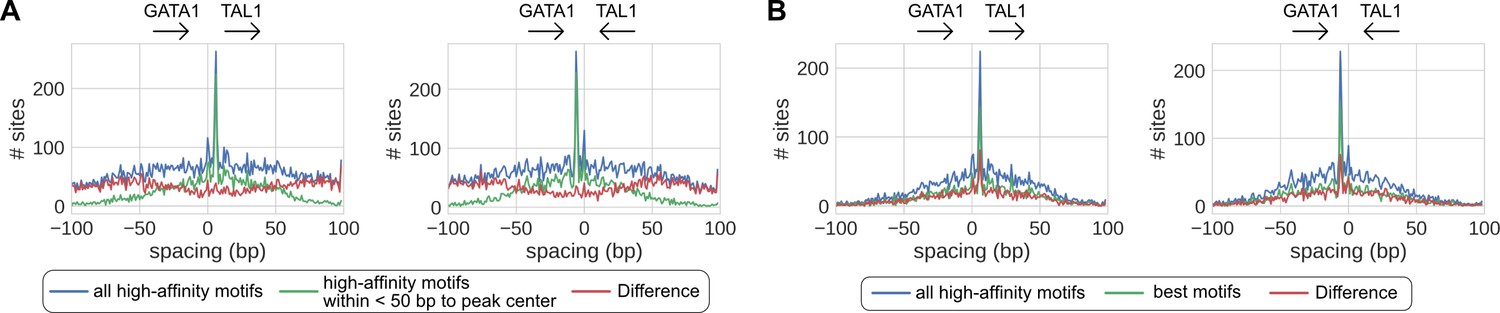
Effects of different motif scanning criteria.
(A) Motifs proximal to peak centers are potentially more confident than motifs distal from peak centers. (B) All motifs passing false positive rate (FPR) <0.001 are potentially as confident as the best motif of every peak.
Figure 1—figure supplement 2
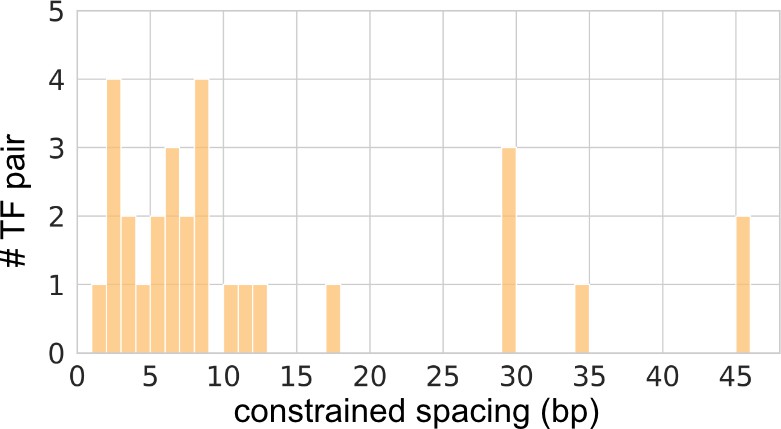
Constrained spacings for the significant transcription factor (TF) pairs with constrained spacing relationships.
Figure 1—figure supplement 3
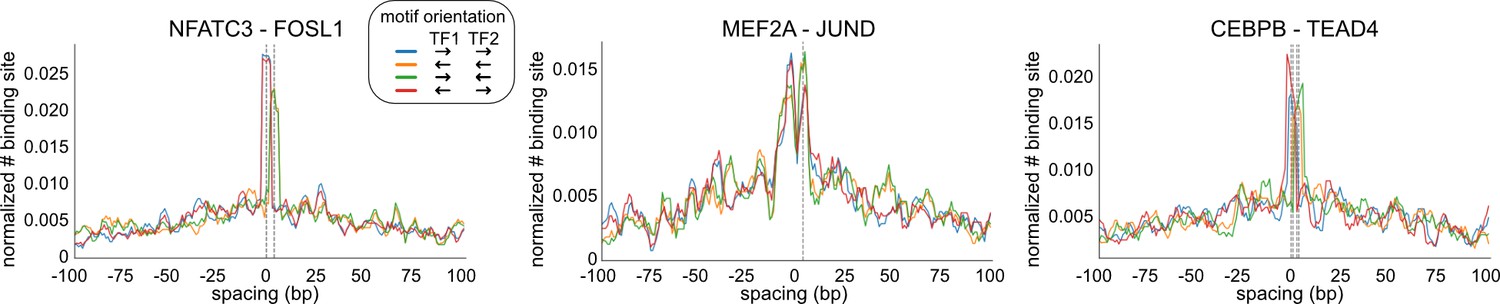
Examples of transcription factor (TF) pairs with constrained spacing relationships.
Figure 1—figure supplement 4
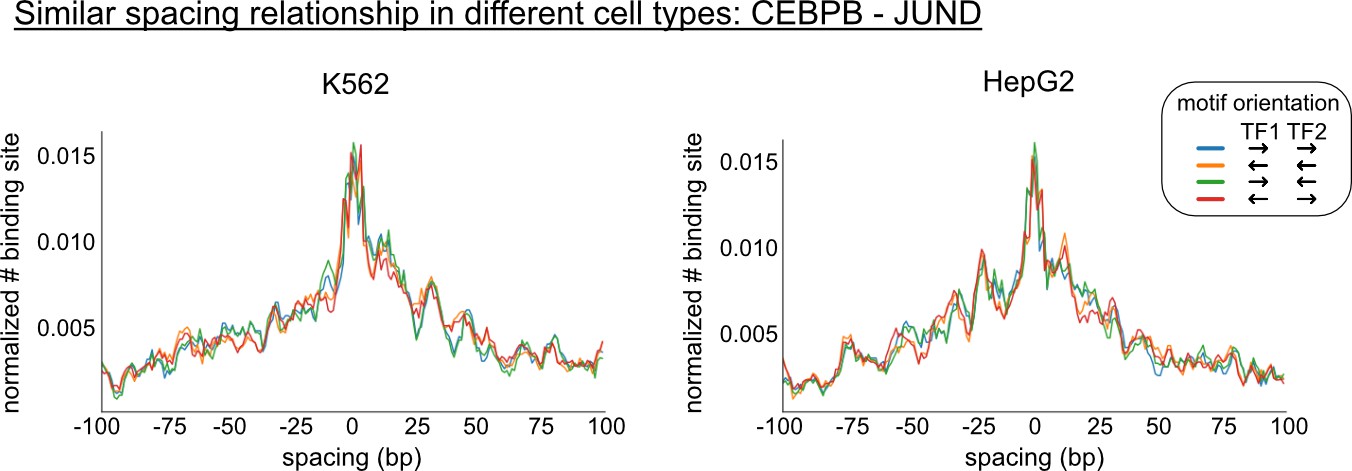
Comparison of the spacing relationships of same transcription factor (TF) pairs in different cell types.
Figure 1—figure supplement 5
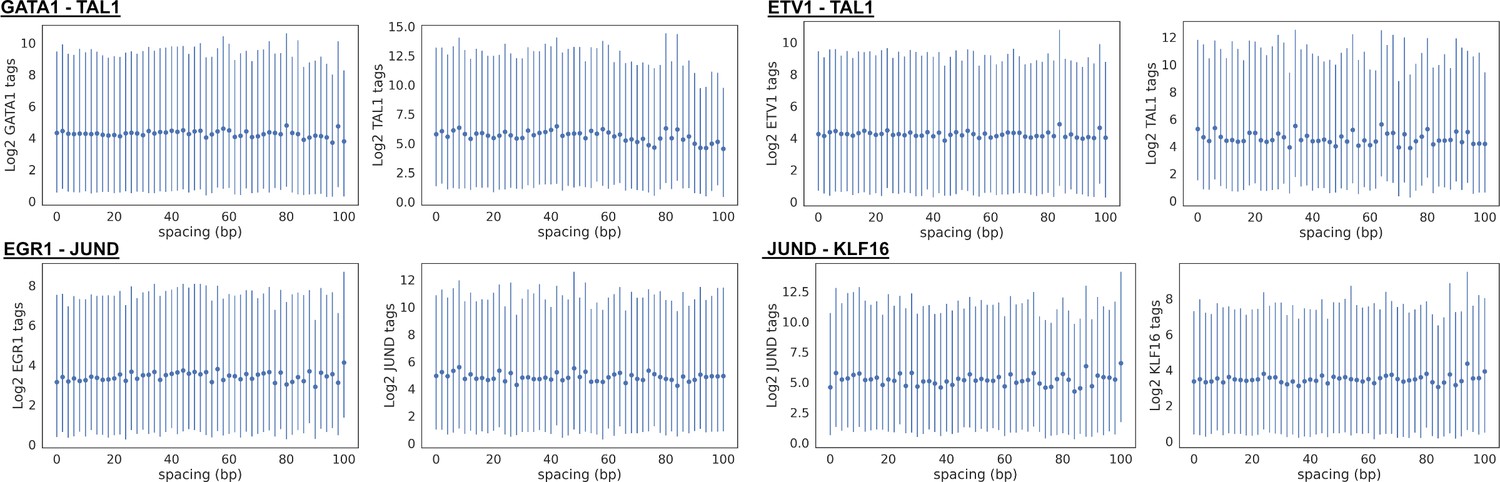
Transcription factor (TF) chromatin immunoprecipitation sequencing (ChIP-seq) tag counts versus spacing for representative TF pairs in Figure 1D.
Figure 1—figure supplement 6
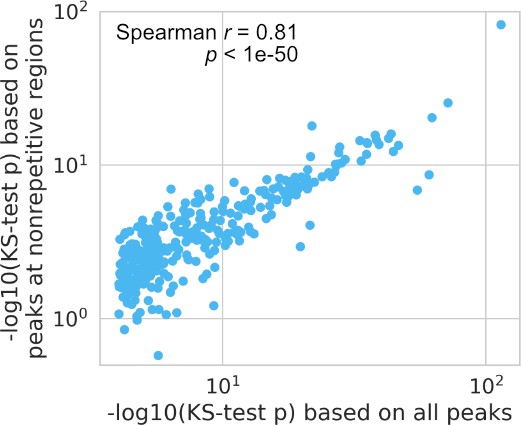
Comparison between all peaks and peaks only at nonrepetitive regions based on their Kolmogorov–Smirnov (KS) test p-values used to test for relaxed spacing relationship.
Each dot represents one transcription factor (TF) pair.
Figure 1—figure supplement 7
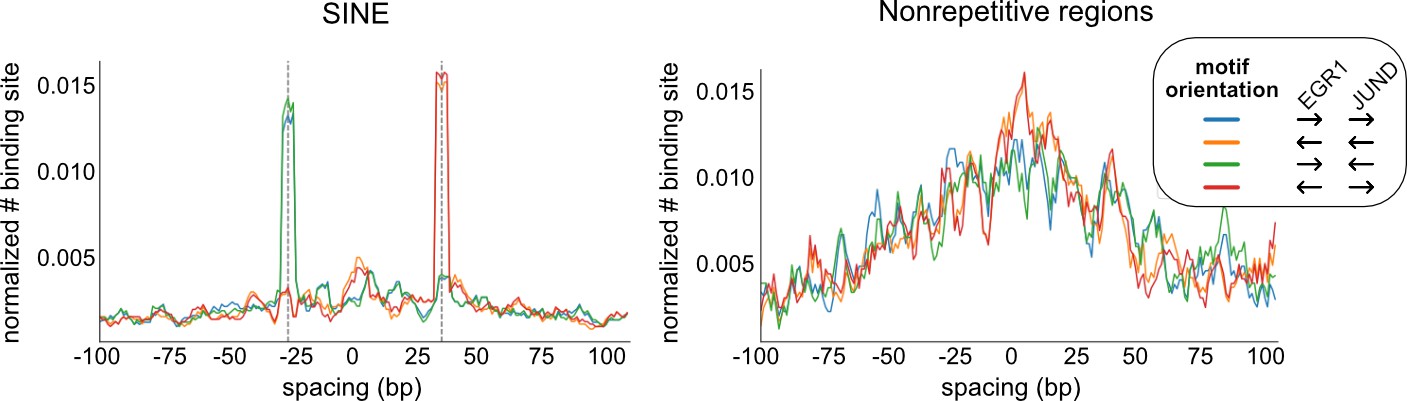
The spacing relationship of EGR1-JUND based on all co-binding peaks (right) or peaks at repetitive regions, specifically SINEs (left).
Figure 2 with 2 supplements
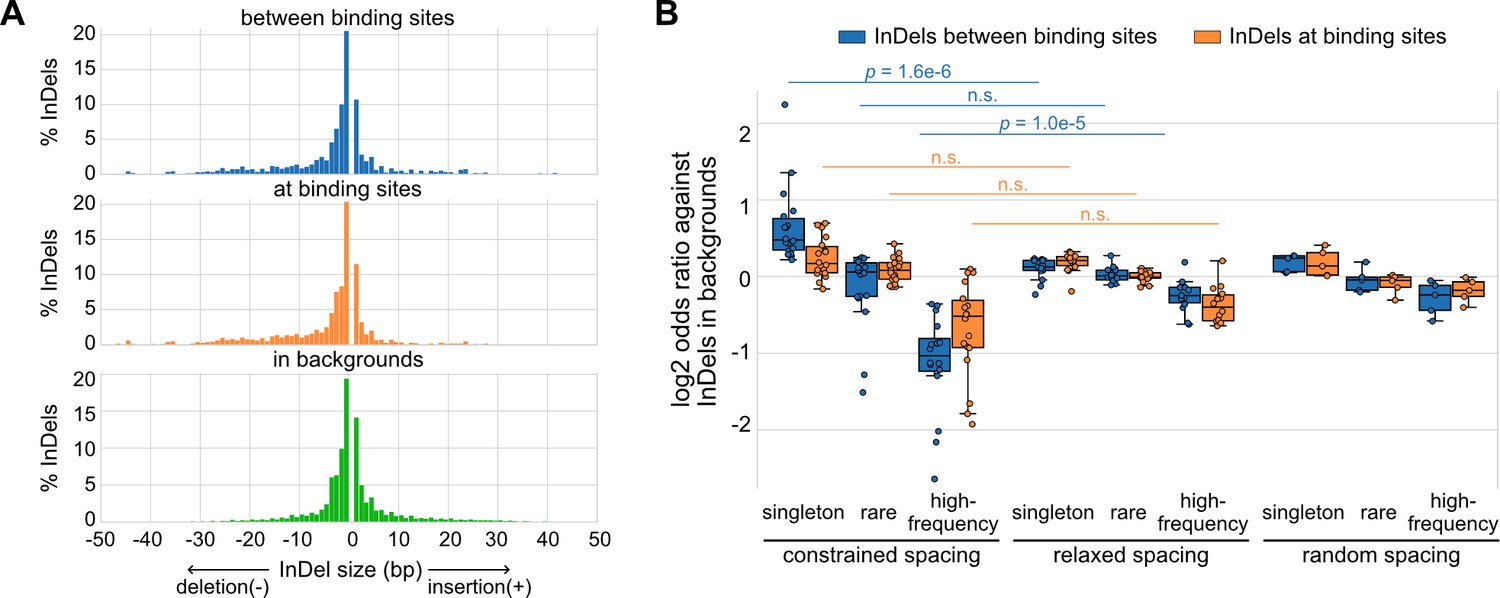
Naturally occurring insertions and deletions (InDels) in human populations.
(A) Size distributions of human InDels within different regions. (B) Log2 odds ratios for different categories of InDels. Each dot represents a transcription factor (TF) pair with corresponding spacing relationship. Mann–Whitney U test was used to compare the odds ratios between different spacing relationships. Non-significant (n.s.) if p-value is larger than 0.01.
-
Figure 2—source data 1
The numbers and odds ratios of different categories of insertions and deletions (InDels) at or between transcription factor (TF) binding sites.
- https://cdn.elifesciences.org/articles/70878/elife-70878-fig2-data1-v2.txt
Figure 2—figure supplement 1
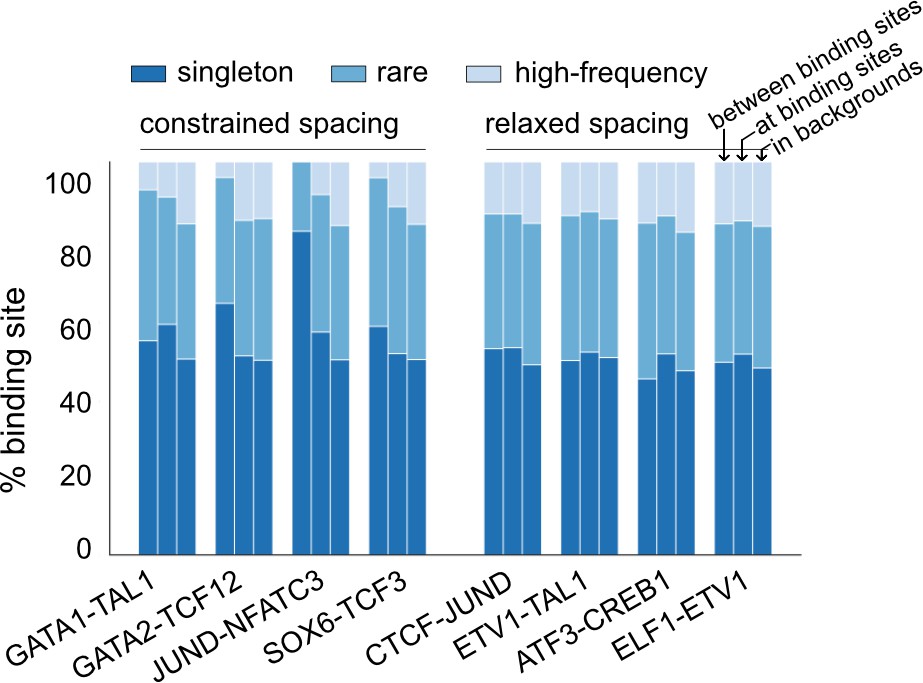
Composition of insertions and deletions (InDels) with different allele frequency (AF) for representative transcription factor (TF) pairs.
InDels were divided into high-frequency variants (AF>0.01%), rare variants (AF<0.01%, allele count [AC]>1), and singletons (AC = 1).
Figure 2—figure supplement 2
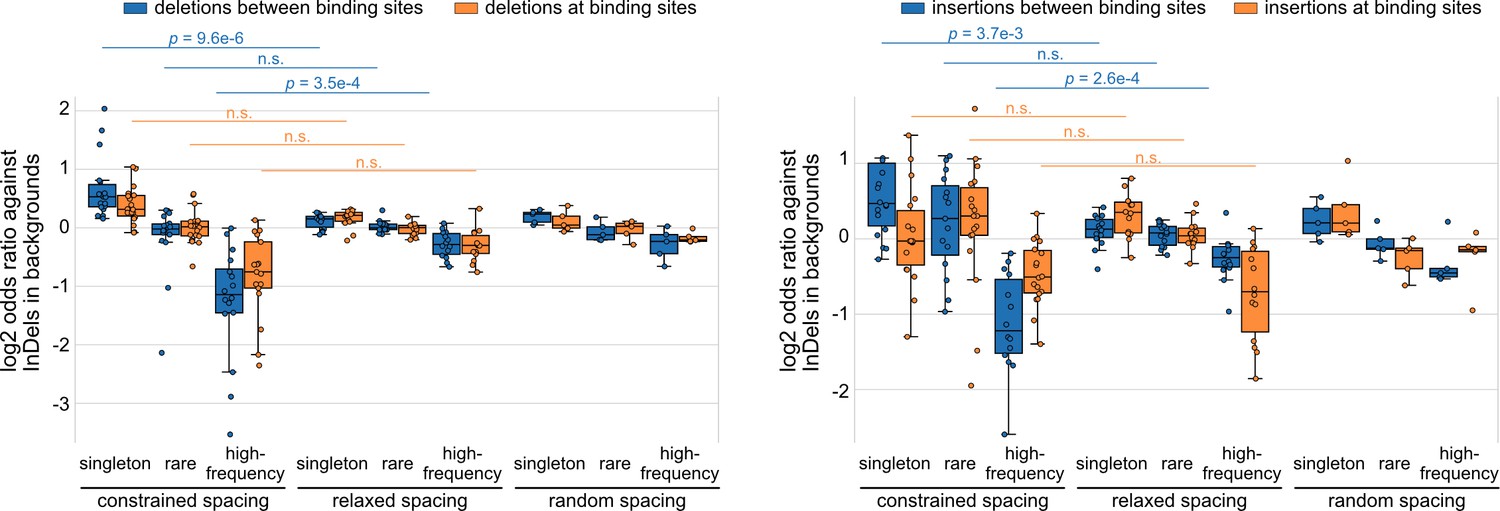
Log2 odds ratios for insertions and deletions (InDels) separately, complementary to the results of all InDels in Figure 2B.
Each dot represents a transcription factor (TF) pair. Mann–Whitney U test was used to compare the odds ratios between different spacing relationships. Non-significant (n.s.) if p-value is larger than 0.01.
Figure 3 with 8 supplements
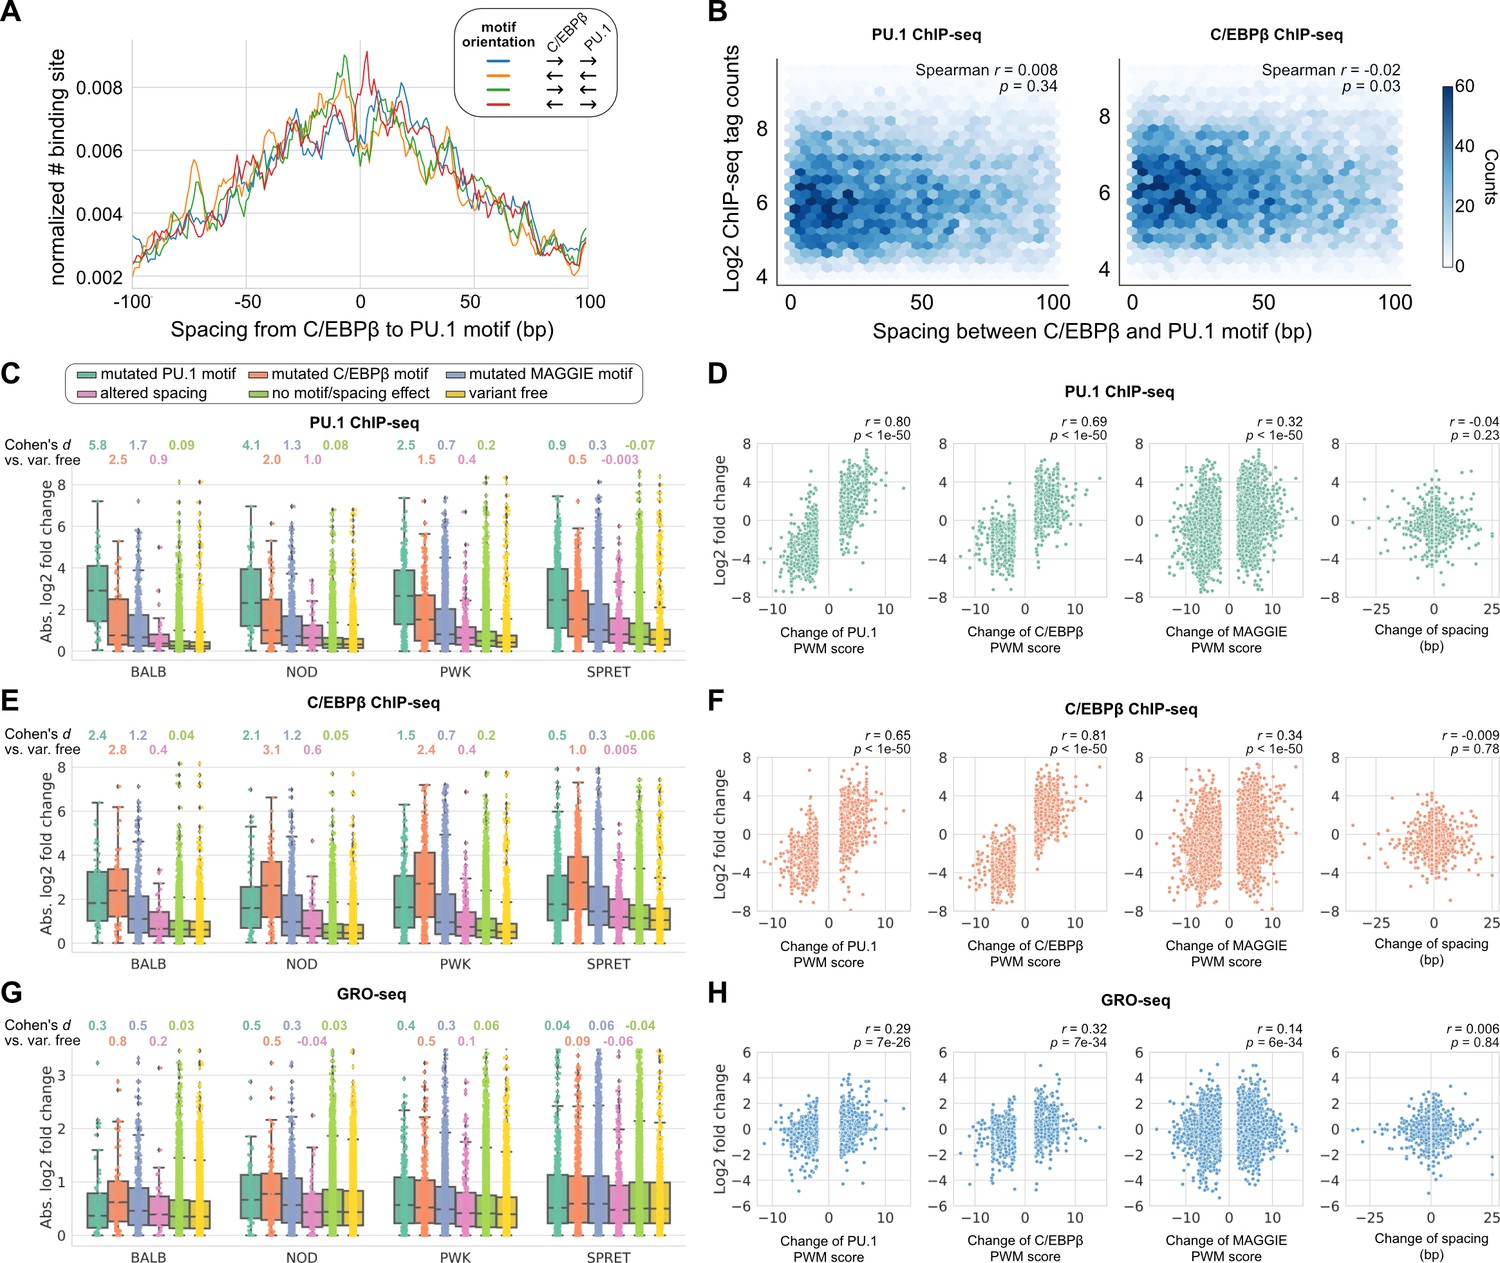
Effects of spacing alterations resulting from natural genetic variation across mouse strains.
(A) Spacing distributions of PU.1 and C/EBPβ binding sites at co-binding sites. (B) Density plots showing the relationship between transcription factor (TF) binding activity and motif spacing for the co-binding sites. Log2 chromatin immunoprecipitation sequencing (ChIP-seq) tags were calculated within 300 bp to quantify the binding activity of PU.1 and C/EBPβ. The color gradients represent the number of sites. Spearman’s correlation coefficients together with p-values are displayed. (C, E, G) Absolute log2 fold changes of ChIP-seq tags between C57 and another strain for (C) PU.1 binding, (E) C/EBPβ binding, or (G) nascent transcripts measured by GRO-seq. Boxplots show the median and quartiles of every distribution. Cohen’s d effect sizes comparing against variant-free regions are displayed on top. (D, F, H) Correlations between change of spacing or position weight matrix (PWM) score and change of (D) PU.1 binding, (F) C/EBPβ binding, or (H) nascent transcript level. Spearman’s correlation coefficients together with p-values are displayed.
-
Figure 3—source data 1
Tag fold changes at individual sites for PU.1 chromatin immunoprecipitation sequencing (ChIP-seq).
- https://cdn.elifesciences.org/articles/70878/elife-70878-fig3-data1-v2.csv
-
Figure 3—source data 2
Tag fold changes at individual sites for C/EBPβ chromatin immunoprecipitation sequencing (ChIP-seq).
- https://cdn.elifesciences.org/articles/70878/elife-70878-fig3-data2-v2.csv
-
Figure 3—source data 3
Tag fold changes at individual sites for GRO-seq.
- https://cdn.elifesciences.org/articles/70878/elife-70878-fig3-data3-v2.csv
-
Figure 3—source data 4
Tag fold changes at individual sites for H3K27ac chromatin immunoprecipitation sequencing (ChIP-seq).
- https://cdn.elifesciences.org/articles/70878/elife-70878-fig3-data4-v2.csv
Figure 3—figure supplement 1
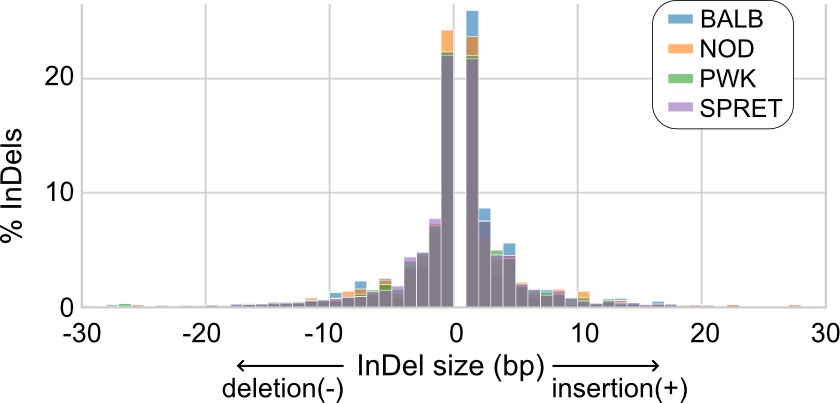
Size distributions of insertions and deletions (InDels) at PU.1 and C/EBPβ co-binding sites across mouse strains.
Figure 3—figure supplement 2
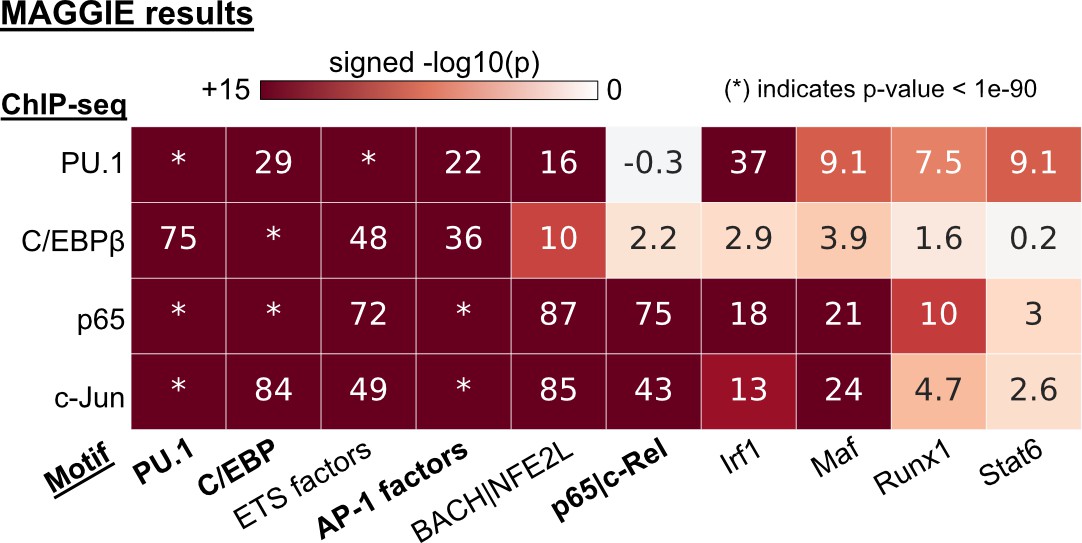
Functional motifs identified by MAGGIE for different transcription factor (TF) binding.
Figure 3—figure supplement 3
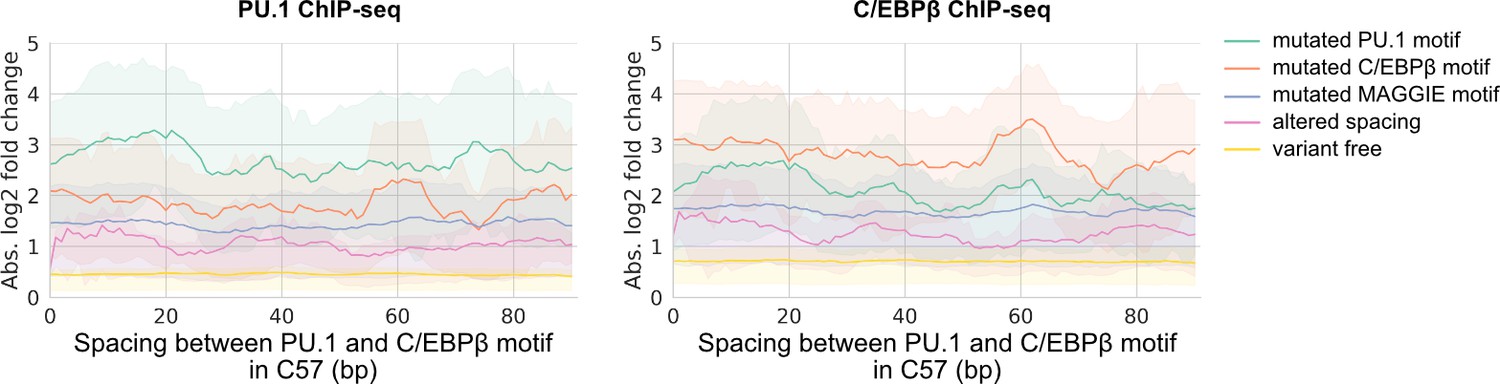
Absolute log2 fold changes of chromatin immunoprecipitation sequencing (ChIP-seq) tags in relationship with the initial spacing between PU.1 and C/EBPβ motif in the reference mm10 genome.
Solid lines represent means based on all four pairwise comparisons.
Figure 3—figure supplement 4
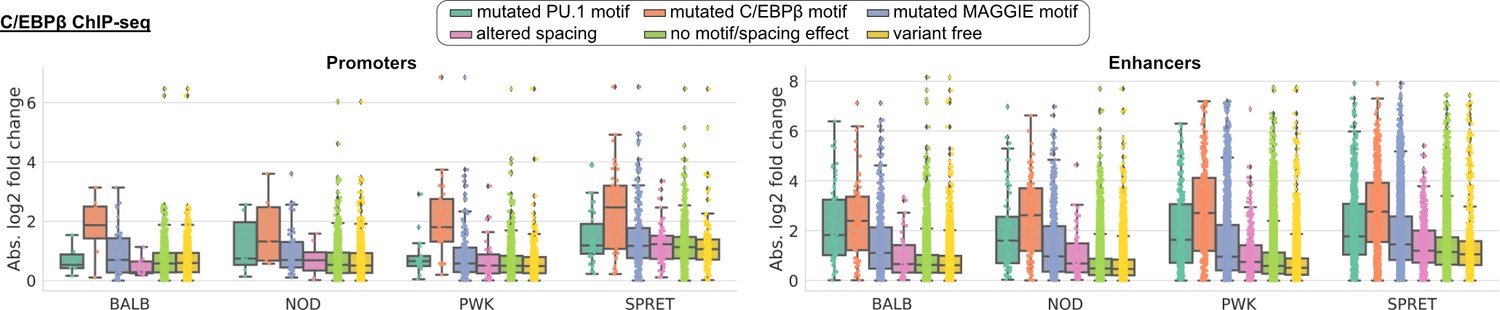
Absolute log2 fold changes of C/EBPβ chromatin immunoprecipitation sequencing (ChIP-seq) tags between C57 and another strain separately showing the distributions of promoters (left) and enhancers (right).
Supplementary to Figure 3E.
Figure 3—figure supplement 5
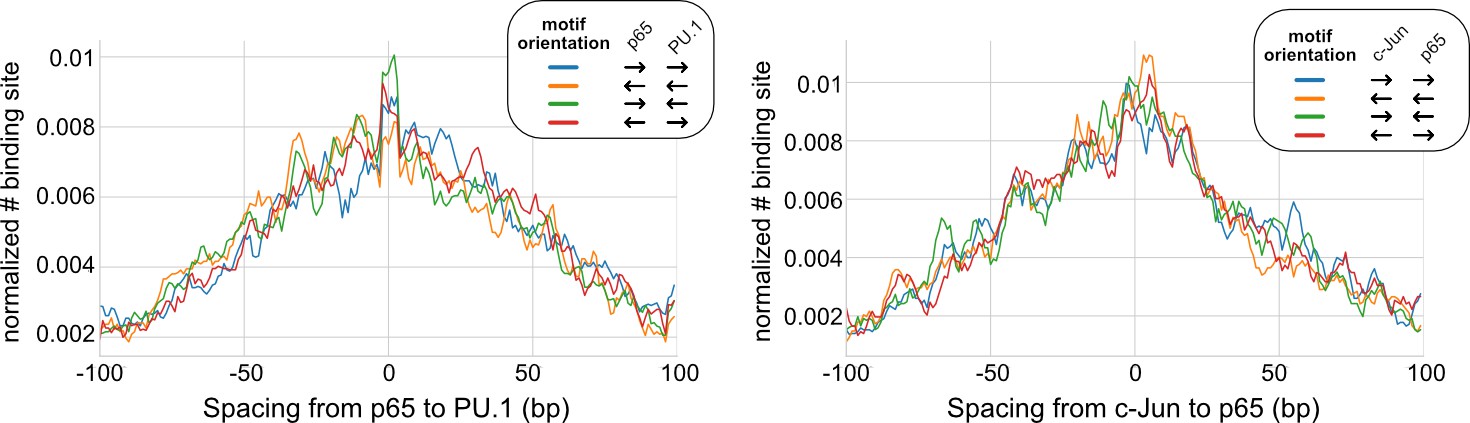
Spacing distributions between lineage-determining transcription factors (LDTFs) and signal-dependent transcription factors (SDTFs).
Left: p65 and PU.1. Right: p65 and c-Jun.
Figure 3—figure supplement 6
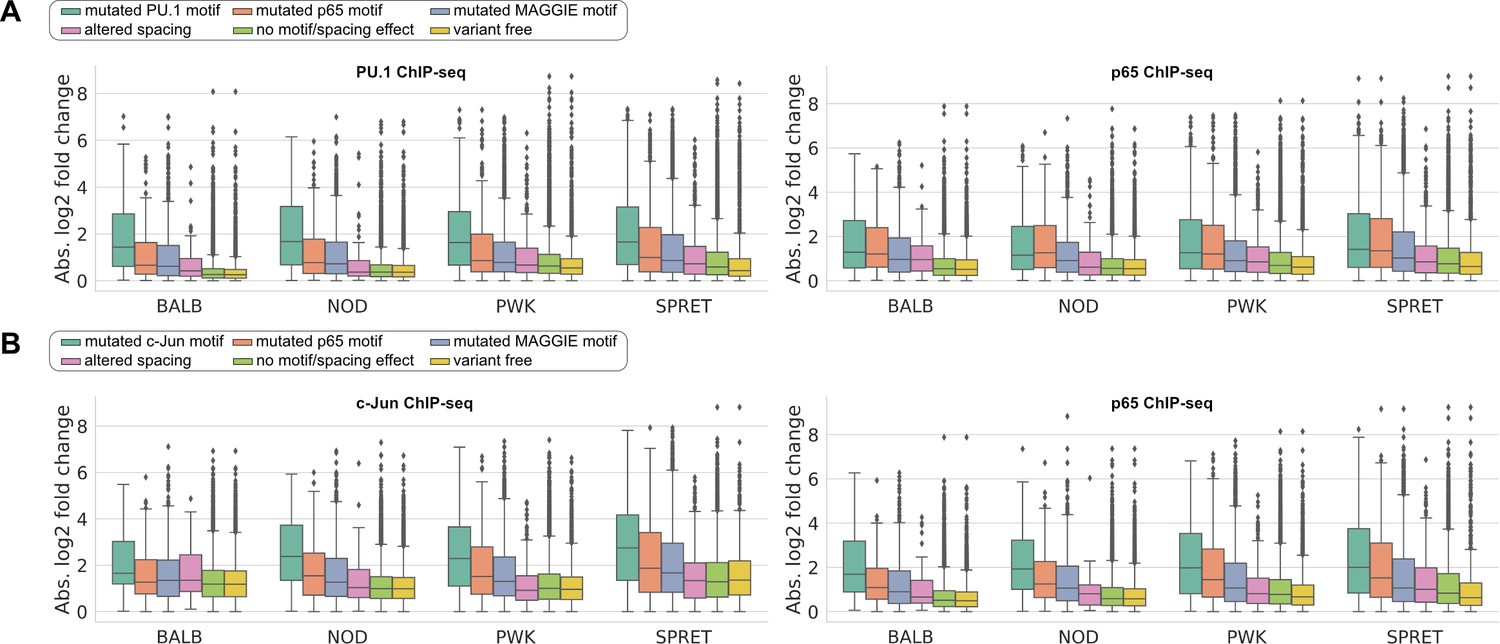
Absolute log2 fold changes of chromatin immunoprecipitation sequencing (ChIP-seq) tags between C57 and another strain for lineage-determining transcription factors (LDTFs) and signal-dependent transcription factors (SDTFs).
(A) PU.1 and p65 binding at their co-binding sites and (B) c-Jun and p65 binding at their co-binding sites.
Figure 3—figure supplement 7
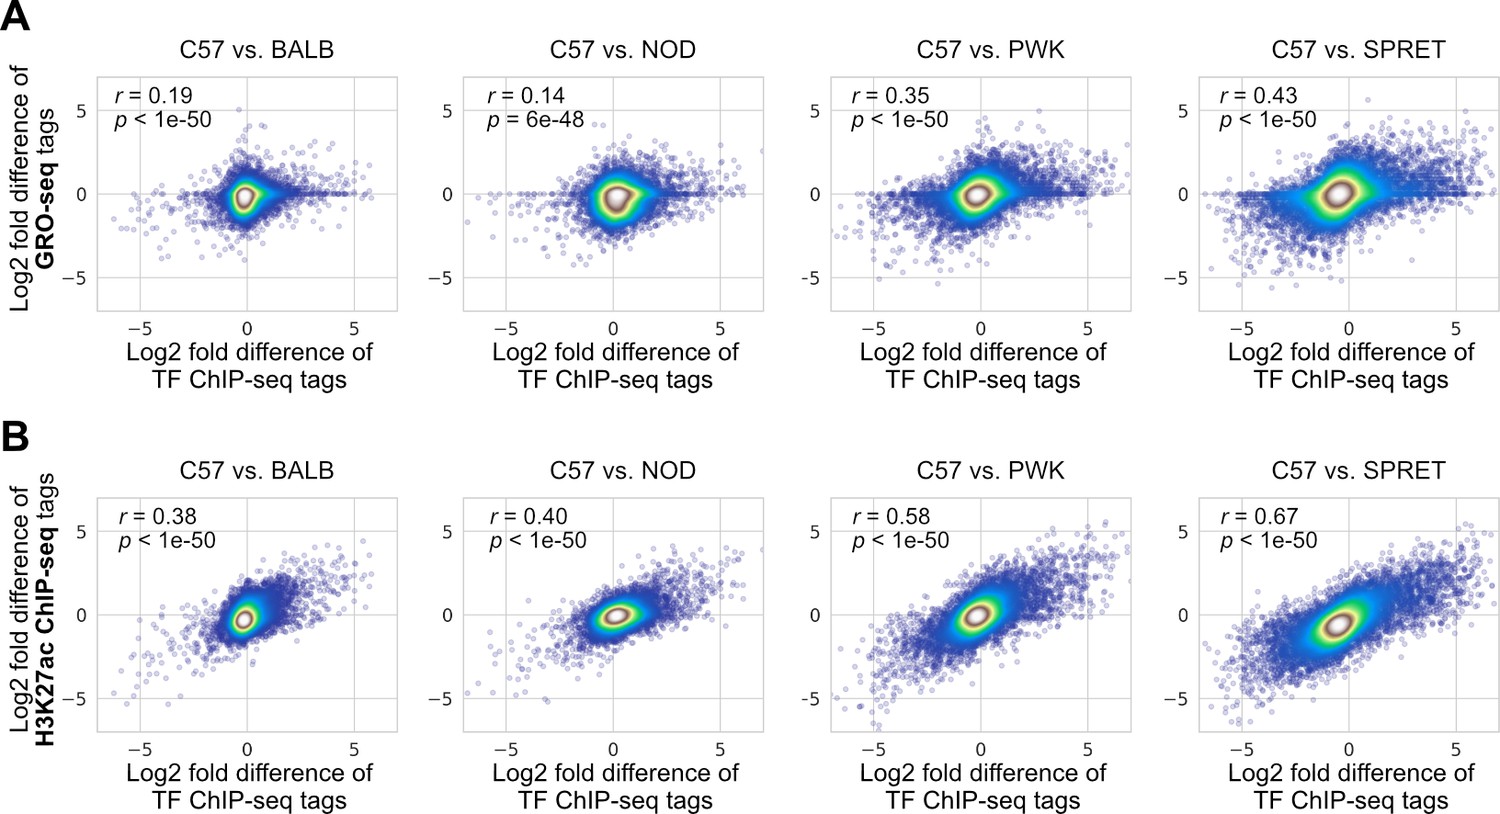
Correlations between changes in transcription factor (TF) binding activity and changes in (A) nascent transcription measured by GRO-seq or (B) the H3K27ac level measured by chromatin immunoprecipitation sequencing (ChIP-seq).
Spearman’s correlation coefficients together with p-values are displayed.
Figure 3—figure supplement 8
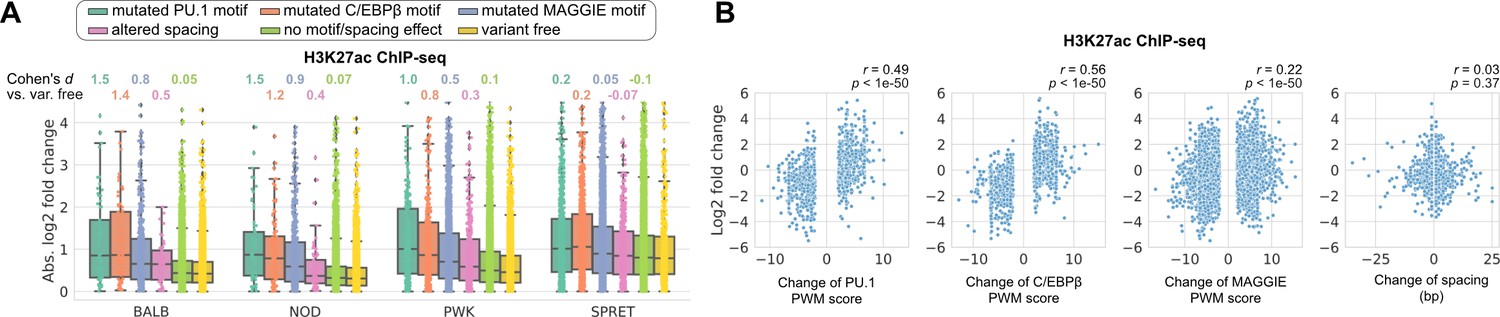
Effects of genetic variation on H3K27ac level.
(A) Absolute log2 fold changes of H3K27ac chromatin immunoprecipitation sequencing (ChIP-seq) tags between C57 and another strain. (B) Correlations between change of spacing or position weight matrix (PWM) score and change of H3K27ac level. Spearman’s correlation coefficients together with p-values are displayed.
Figure 4 with 4 supplements
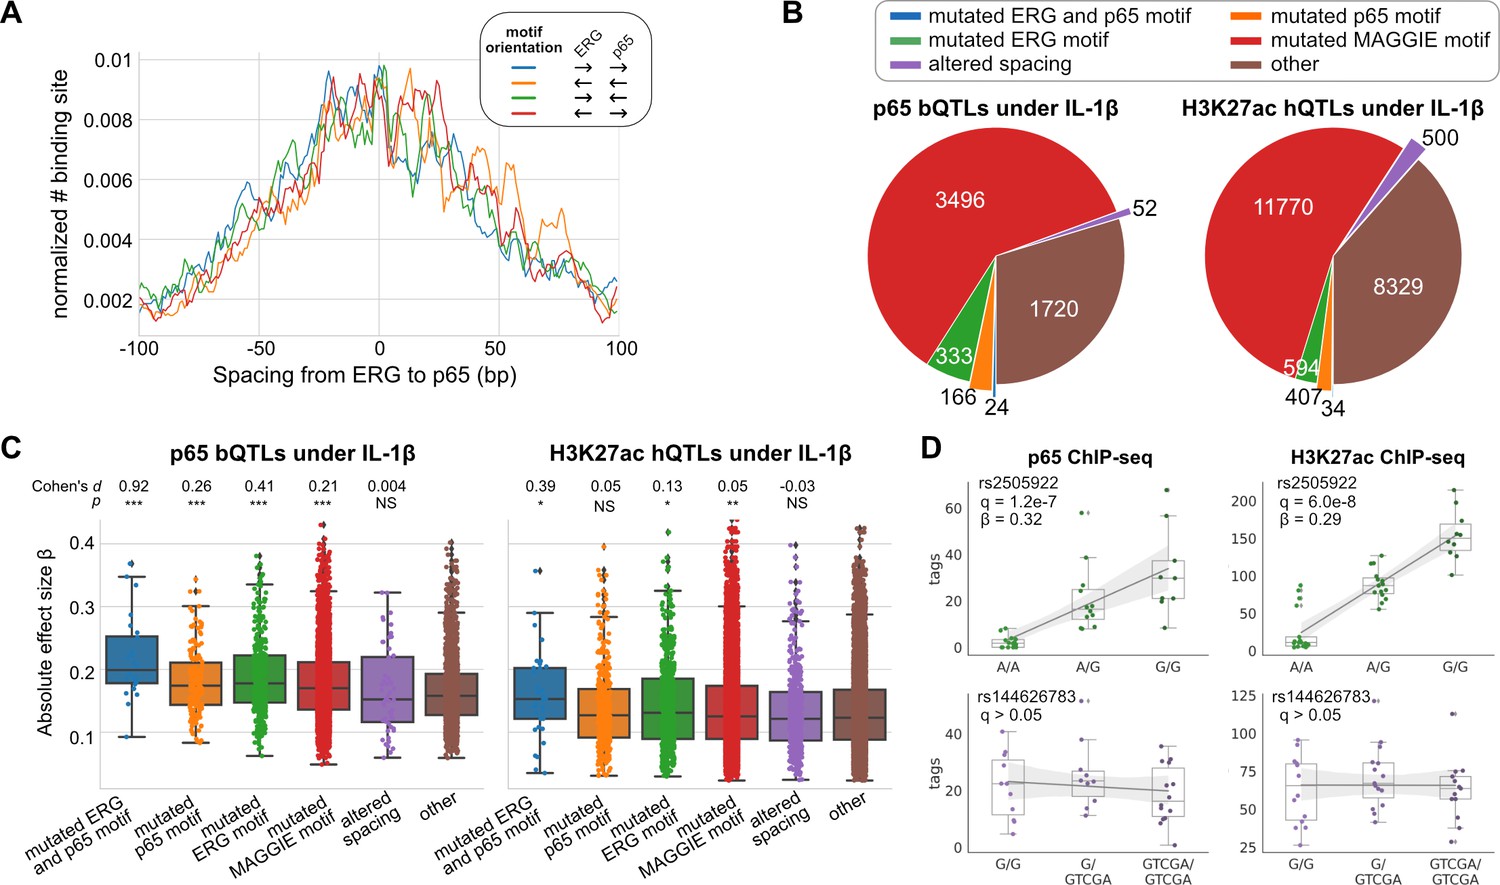
Effects of chromatin quantitative trait loci (QTLs) in human endothelial cells.
(A) Spacing distributions of ERG and p65 binding sites at co-binding sites. (B) Classification of chromatin QTLs based on the impacts on motif and spacing. (C) Absolute correlation coefficients of different QTLs. Cohen’s d and Mann–Whitney U test p-values comparing against the ‘other’ group are displayed on top. *p < 0.01, **p < 0.001, ***p < 0.0001. (D) Example QTLs for large effect size due to ERG motif mutation (upper) and trivial effect due to spacing alteration (lower).
-
Figure 4—source data 1
Effect sizes and categorization of p65 binding quantitative trait loci (bQTLs).
- https://cdn.elifesciences.org/articles/70878/elife-70878-fig4-data1-v2.csv
-
Figure 4—source data 2
Effect sizes and categorization of H3K27ac histone modification quantitative trait loci (hQTLs) at IL-1β.
- https://cdn.elifesciences.org/articles/70878/elife-70878-fig4-data2-v2.csv
-
Figure 4—source data 3
Effect sizes and categorization of ERG binding quantitative trait loci (bQTLs).
- https://cdn.elifesciences.org/articles/70878/elife-70878-fig4-data3-v2.csv
-
Figure 4—source data 4
Effect sizes and categorization of H3K27ac histone modification quantitative trait loci (hQTLs) at basal.
- https://cdn.elifesciences.org/articles/70878/elife-70878-fig4-data4-v2.csv
Figure 4—figure supplement 1
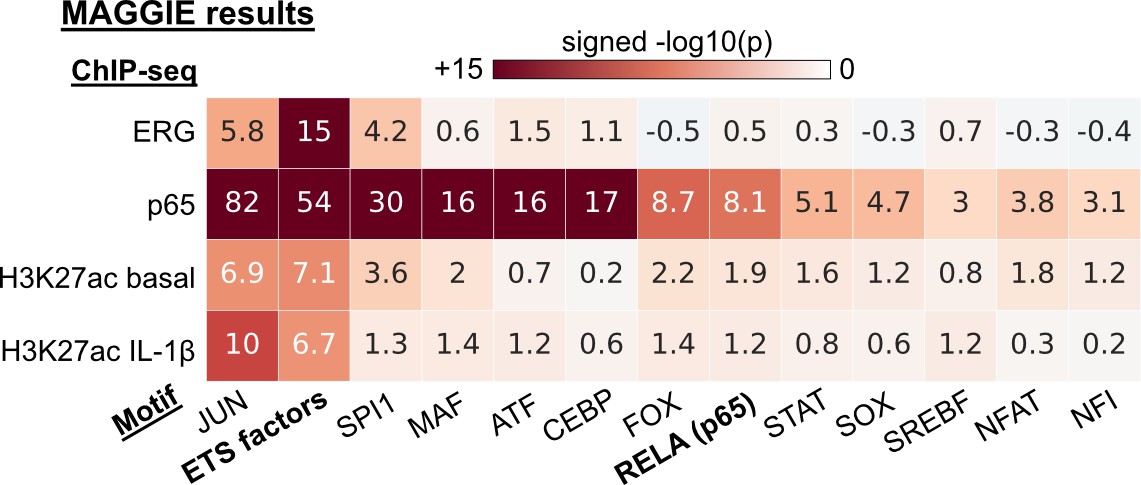
Functional motifs identified by MAGGIE based on binding quantitative trait loci (bQTLs).
Figure 4—figure supplement 2
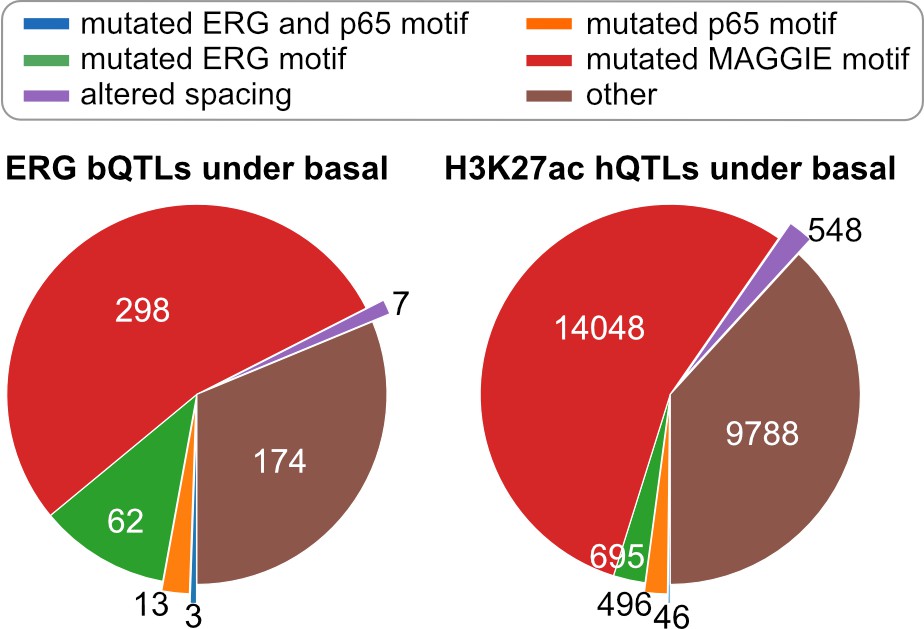
Classification of chromatin quantitative trait loci (QTLs) based on the effects on motif and spacing for basal condition.
Figure 4—figure supplement 3
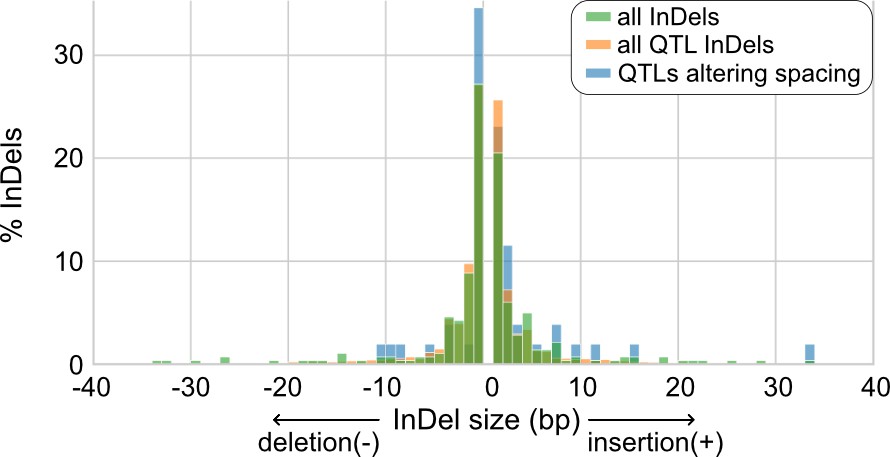
Size distributions of insertions and deletions (InDels) from human endothelial cell donors.
Figure 4—figure supplement 4
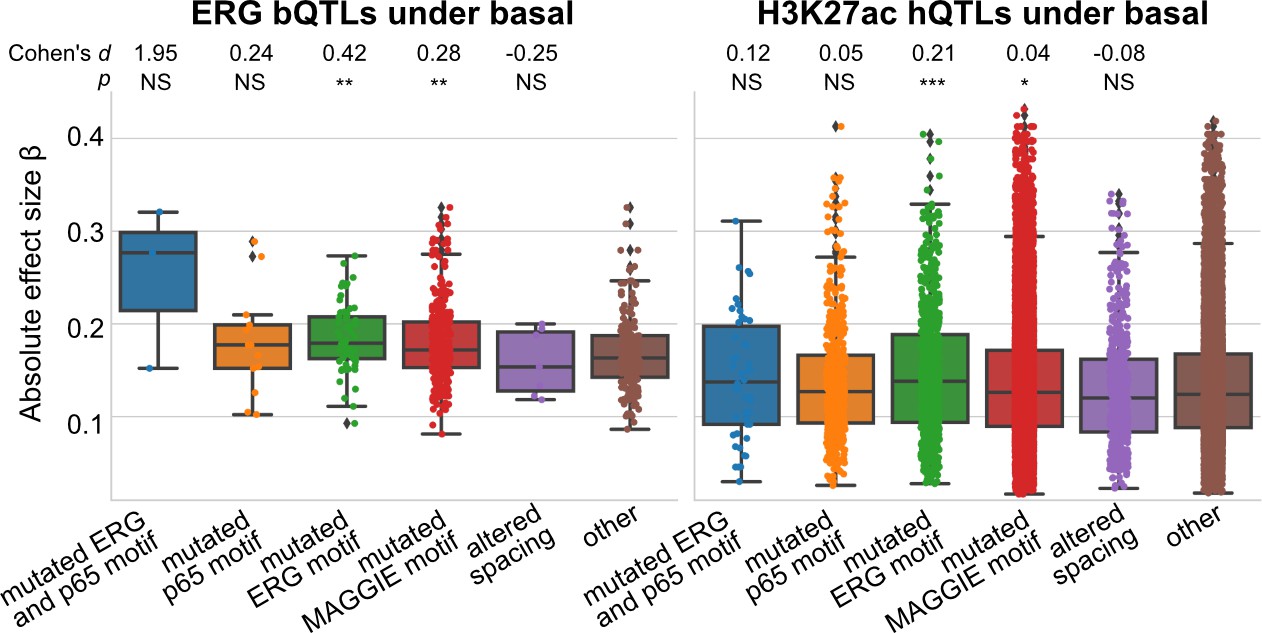
Absolute correlation coefficients of different quantitative trait loci (QTLs) for basal condition.
Cohen’s d and Mann–Whitney U test p-values comparing against the ‘other’ group are displayed on top. *p<0.01, **p<0.001, ***p<0.0001.
Figure 5 with 2 supplements
Effects of variable sizes of synthetic spacing alterations.
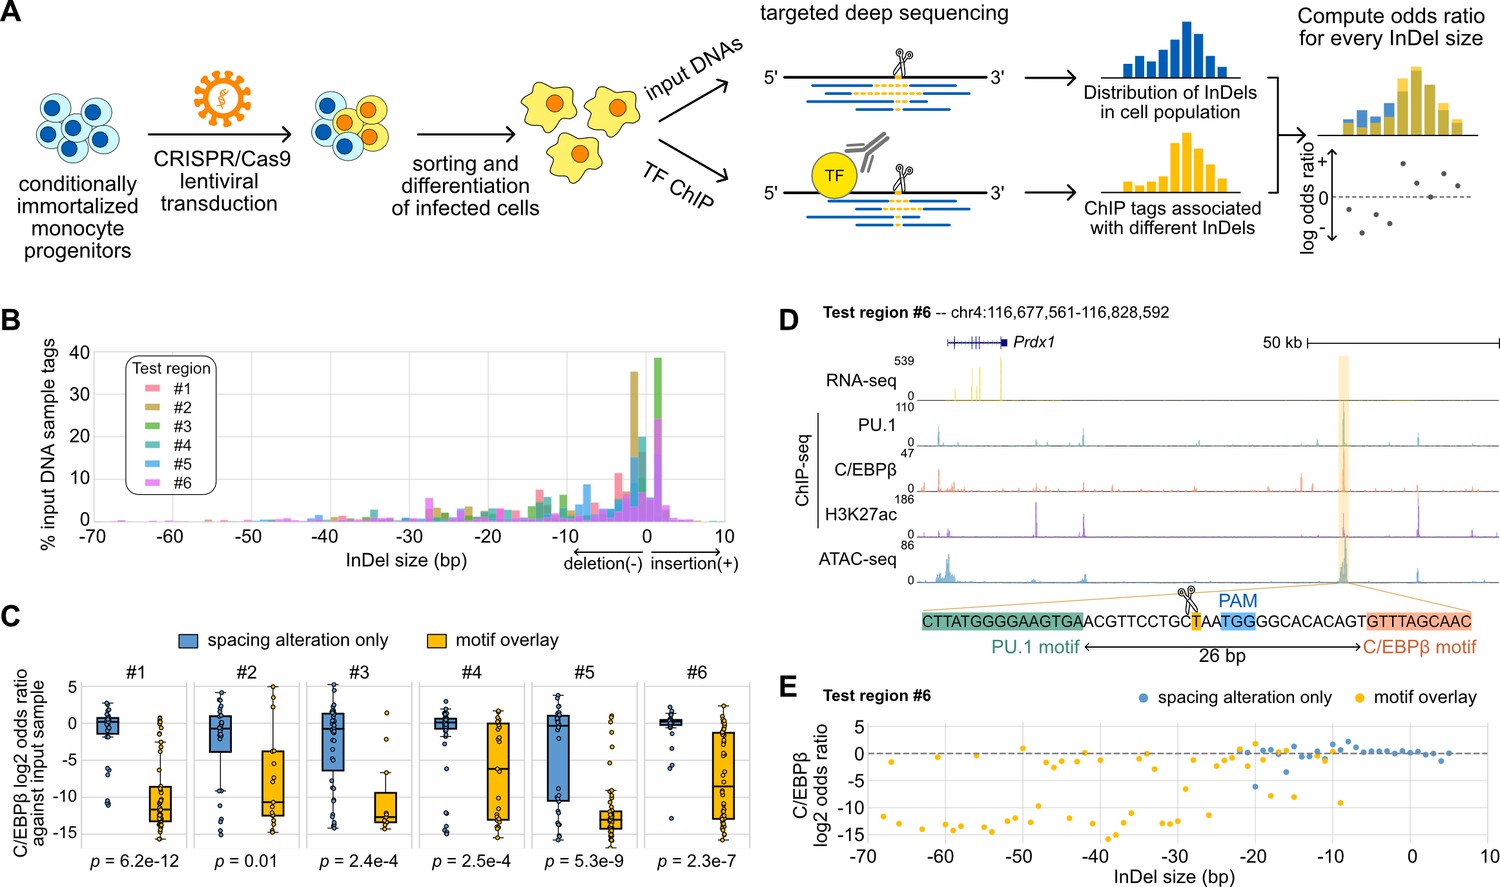
(A) Schematic for generating and analyzing synthetic spacing alterations. (B) The distributions of valid read counts from the input sample based on the InDel sizes of the reads. Negative InDel size indicates deletion, and positive size means insertion. (C) Log2 odds ratios by comparing C/EBPβ chromatin immunoprecipitation sequencing (ChIP-seq) reads and input sample reads. Y = 0 indicates where transcription factor (TF) binding has an expected amount of activity. p-Values were based on two-sample t-tests by comparing the InDel groups of each test region. (D) Sequencing data of ER-HoxB8 cells at co-binding site of PU.1 and C/EBPβ. Highlighted is test region #6 whose DNA sequence from PU.1 binding site to C/EBPβ binding site is shown. (E) Log2 odds ratios of test regions #6 as a function of InDel size.
-
Figure 5—source data 1
Raw chromatin immunoprecipitation sequencing (ChIP-seq) tag counts associated with different sizes of insertions and deletions (InDels).
- https://cdn.elifesciences.org/articles/70878/elife-70878-fig5-data1-v2.txt
Figure 5—figure supplement 1
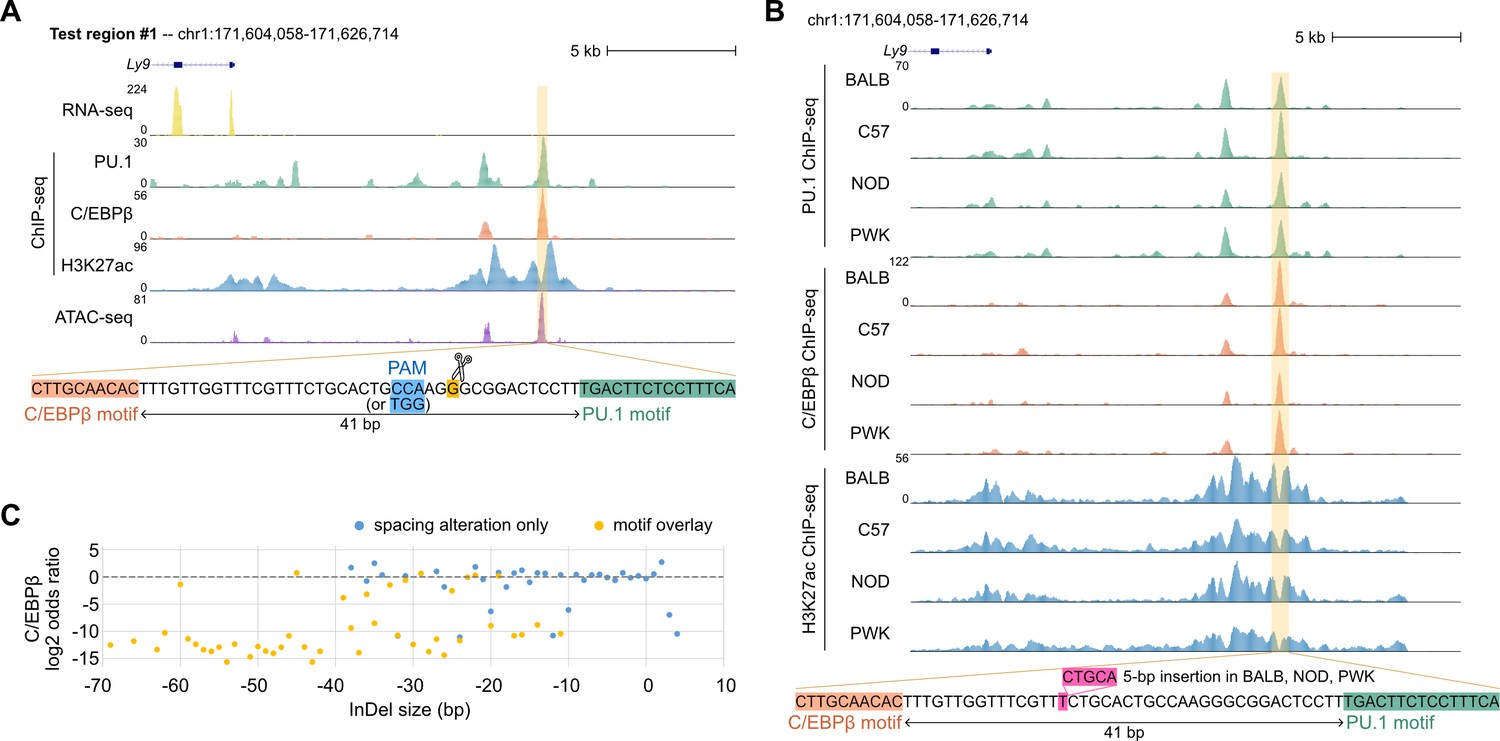
Effects of synthetic spacing alterations for test region #1.
(A) Mouse strains data for test region #1. (B) Sequencing data of ER-HoxB8 cells for test region #1. (C) Log2 odds ratios of test region #1 as a function of InDel size.
Figure 5—figure supplement 2
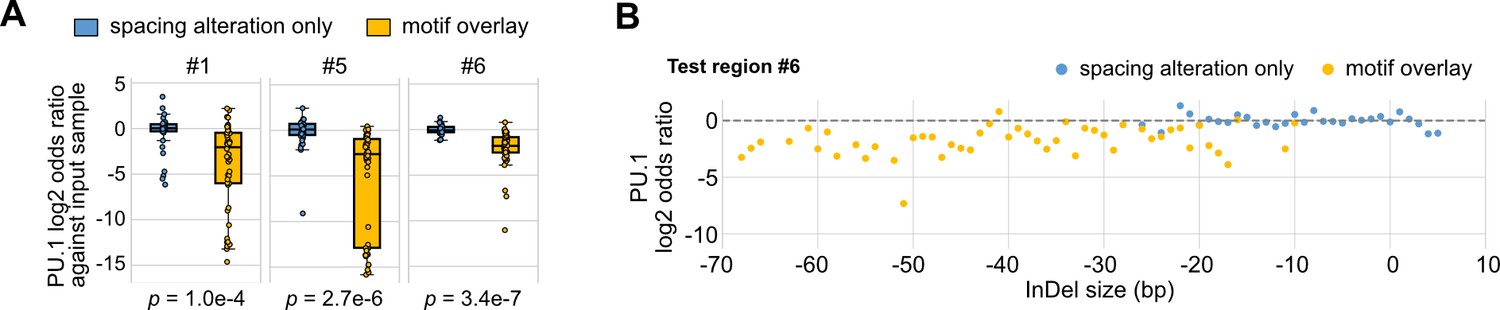
Effects of synthetic spacing alterations on PU.1 binding.
(A) Log2 odds ratios by comparing PU.1 chromatin immunoprecipitation sequencing (ChIP-seq) reads and input sample reads. Y = 0 indicates where transcription factor (TF) binding has an expected amount of activity. p-Values were based on two-sample t-tests between the insertion and deletion (InDel) groups of each test region. (B) Log2 odds ratios of test region #6 as a function of InDel size based on PU.1 ChIP-seq.
Author response image 1
Author response image 2
Tables
Key resources table
| Reagent type (species) or resource | Designation | Source or reference | Identifiers | Additional information |
|---|---|---|---|---|
| Strain, strain background (Mus musculus, male) | B6(C)-Gt(ROSA) 26Sorem1.1(CAG-cas9*,-EGFP)Rsky/J | Jackson Laboratory | Stock No: 028555RRID:IMSR_JAX:028555 | |
| Cell line (Mus musculus) | Cas9-expressing ER-HoxB8 cells | This paper | Gifted from Dr David Sykes | |
| Cell line (human) | Lenti-X 293T cells | Clontech | Cat#: 632180RRID:CVCL_4401 | |
| Transfected construct (retrovirus) | Murine stem cell virus-based vector for ER-HoxB8 | Massachusetts General Hospital, Boston, MA | Gifted from Dr David Sykes | |
| Transfected construct (retrovirus) | lentiGuide-puro | Addgene | Cat#: 52963 | |
| Transfected construct (retrovirus) | psPAX2 | Addgene | Cat#: 12260 | |
| Transfected construct (retrovirus) | pVSVG | Addgene | Cat#: 138479 | |
| Antibody | PU.1/Spi1 (rabbit polyclonal) | Santa Cruz | Cat#: sc-352XRRID:AB_632289 | (1 µL) |
| Antibody | C/EBPβ (rabbit polyclonal) | Santa Cruz | Cat#: sc-150RRID:AB_2260363 | (10 µL) |
| Antibody | H3K27ac (rabbit polyclonal) | Active Motif | Cat#: 39135RRID:AB_2614979 | (2 µL) |
| Recombinant DNA reagent | NEBNext 2× High Fidelity PCR Master Mix | NEB | Cat#: M0541 | |
| Sequence-based reagent | Locus-specific Nextera hybrid primer | This paper | PCR primers | Sequences included in Supplementary file 1 |
| Sequence-based reagent | Nextera index primer | This paper | PCR primers | Sequences included in Supplementary file 1 |
| Peptide, recombinant protein | Recombinant Mouse IL-3 | Peprotech | Cat#: 213–13 | |
| Peptide, recombinant protein | Recombinant Mouse IL-6 | Peprotech | Cat#: 216–16 | |
| Peptide, recombinant protein | Recombinant Mouse SCF | Peprotech | Cat#: 250–03 | |
| Peptide, recombinant protein | Recombinant Mouse GM-CSF | Peprotech | Cat#: 315–03 | |
| Peptide, recombinant protein | Mouse M-CSF | Shenandoah Biotech | Cat#: 200–08 | |
| Commercial assay or kit | Direct-zol RNA MicroPrep kit | Zymo Research | Cat#: R2062 | |
| Commercial assay or kit | Qubit dsDNA HS Assay Kit | Thermo Fisher Scientific | Cat#: Q32851 | |
| Commercial assay or kit | Nextera DNA Library Preparation Kit | Illumina | Cat#: 15028212 | |
| Commercial assay or kit | ChIP DNA Clean & Concentrator | Zymo Research | Cat#: D5205 | |
| Commercial assay or kit | NEBNext Ultra II Library Preparation Kit | NEB | Cat#: E7645L | |
| Chemical compound, drug | LentiBlast Transduction Reagent | OZ Biosciences | Cat#: LB00500 | |
| Chemical compound, drug | Ficoll-Paque-Plus | Sigma-Aldrich | Cat#: GE17-1440-02 | |
| Chemical compound, drug | RPMI-1640 | Corning | Cat#: 10–014-CV | |
| Chemical compound, drug | DMEM high glucose | Corning | Cat#: 10–013-CV | |
| Chemical compound, drug | FBS | Omega Biosciences | Cat#: FB-12 | |
| Chemical compound, drug | 100× Penicillin/ Streptomycin + L-glutamine | Gibco | Cat#: 10378–016 | |
| Chemical compound, drug | β-Estradiol | Sigma-Aldrich | Cat#: E2758 | |
| Chemical compound, drug | G418 | Thermo Fisher | Cat#: 10131035 | |
| Chemical compound, drug | Polybrene | Sigma-Aldrich | Cat#: H9268 | |
| Chemical compound, drug | Fibronectin | Sigma-Aldrich | Cat#: F0895 | |
| Chemical compound, drug | Poly-D-lysin | Sigma-Aldrich | Cat#: DLW354210 | |
| Chemical compound, drug | X-tremeGENE HP DNA Transfection Reagent | Sigma-Aldrich | Cat#: 6366546001 | |
| Chemical compound, drug | Formaldehyde | Thermo Fisher Scientific | Cat#: BP531-500 | |
| Chemical compound, drug | Dynabeads Protein A | Invitrogen | Cat#: 10002D | |
| Chemical compound, drug | SpeedBeads magnetic carboxylate modified particles | Sigma-Aldrich | Cat#: GE65152 105050250 | |
| Chemical compound, drug | Dynabeads MyOne Streptavidin T1 | Invitrogen | Cat#: 65602 | |
| Software, algorithm | CHOPCHOP | CHOPCHOP (https://chopchop.cbu.uib.no/) | RRID:SCR_015723 | |
| Software, algorithm | Bowtie2 | Bowtie2 (http://bowtie-bio.sourceforge.net/bowtie2/index.shtml) | RRID:SCR_016368 | Version 2.3.5.1 |
| Software, algorithm | STAR | STAR (https://github.com/alexdobin/STAR) | RRID:SCR_004463 | Version 2.5.3 |
| Software, algorithm | HOMER | HOMER (https://homer.ucsd.edu/homer/) | RRID:SCR_010881 | Version 4.9.1 |
| Software, algorithm | MAGGIE | MAGGIE (https://github.com/zeyang-shen/maggie) | RRID:SCR_021903 | Version 1.1 |
| Software, algorithm | IDR | IDR (https://www.encodeproject.org/software/idr/) | RRID:SCR_017237 | Version 2.0.3 |
| Software, algorithm | MMARGE | MMARGE (https://github.com/vlink/marge) | RRID:SCR_021902 | Version 1.0 |
Additional files
-
Supplementary file 1
Tables include motif information for transcription factors (TFs), statistics of chromatin immunoprecipitation sequencing (ChIP-seq) peaks based on the ENCODE data, and the region targets and region-specific primers used for the CRISPR experiments.
- https://cdn.elifesciences.org/articles/70878/elife-70878-supp1-v2.xlsx
-
Transparent reporting form
- https://cdn.elifesciences.org/articles/70878/elife-70878-transrepform1-v2.pdf
Download links
A two-part list of links to download the article, or parts of the article, in various formats.
Downloads (link to download the article as PDF)
Open citations (links to open the citations from this article in various online reference manager services)
Cite this article (links to download the citations from this article in formats compatible with various reference manager tools)
Systematic analysis of naturally occurring insertions and deletions that alter transcription factor spacing identifies tolerant and sensitive transcription factor pairs
eLife 11:e70878.
https://doi.org/10.7554/eLife.70878


