Heparan sulfate-dependent RAGE oligomerization is indispensable for pathophysiological functions of RAGE
- Department of Oral Biology, University at Buffalo, State University of New York, United States
- Division of Pulmonary Sciences and Critical Care Medicine, Department of Medicine, University of Colorado Anschutz Medical Campus, United States
- Department of Periodontics, School of Stomatology, China Medical University, China
- Department of Pharmaceutical Sciences, School of Pharmacy and Pharmaceutical Sciences, University at Buffalo, State University of New York, United States
Figures
Figure 1
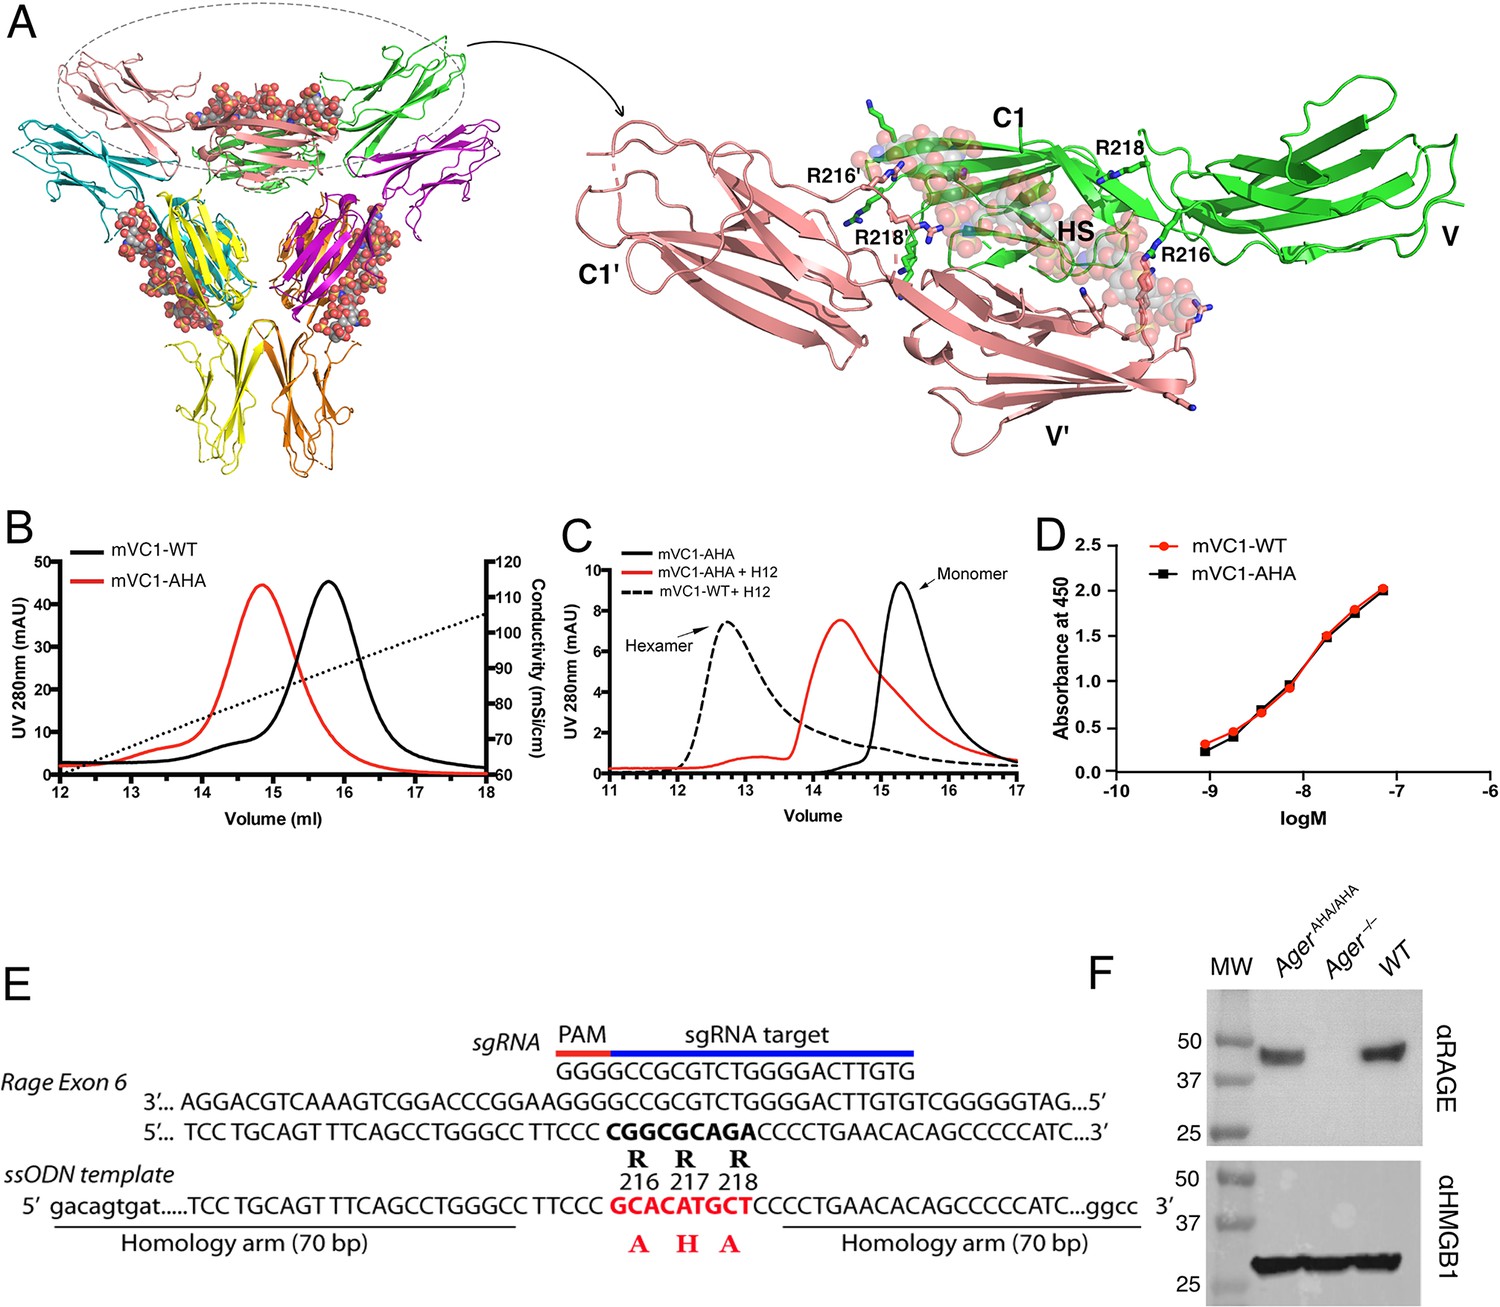
Characterization of HS binding-deficient RAGE mutant (R216R217R218 to A216H217A218) and generation of AgerAHA/AHA knock-in mice.
(A) Cartoon diagram of HS-induced hexamer of RAGE V-C1 domains (PDB 4IMB). The hexamer is organized as trimer of dimers, with each dimer stabilized by one molecule of HS oligosaccharide. Oligosaccharides are shown in space-filling models. One dimer (salmon and green) is enlarged to show HS binding residues (in stick representation). R216 and R218 from both monomers (V-C1 and V’-C1’) are marked. (B) Binding of wild-type murine RAGE V-C1 domain (mVC1-WT) and RAGE-AHA mutant (mVC1-AHA) to heparin Sepharose column. RAGE-AHA mutant had reduced HS-binding capacity. (C) mVC1-WT or mVC1-AHA were incubated with HS dodecasaccharide (H12) and the mixtures were resolved on a Superdex 200 (10/300 mm) gel filtration column. H12 was unable to induce RAGE-AHA to form a stable RAGE hexamer. (D) Binding affinity of mVC1-WT and mVC1-AHA to immobilized HMGB1 was determined by enzyme-linked immunosorbent assay (ELISA). RAGE-AHA displayed WT-like binding affinity to ligand. (E) Targeting strategy for generating AgerAHA/AHA knock-in mice. Sequences of the targeting single guide RNA (sgRNA), the mutation sites in Ager exon 6, and the repairing template single-stranded donor oligonucleotides (ssODN) are shown. (F) Western blotting analysis of RAGE expression in lung lysate. Top panel, lung lysates from WT, AgerAHA/AHA, and Ager−/− mice were blotted with a rat anti-RAGE mAb (R&D system), which showed RAGE was expressed at normal level in AgerAHA/AHA mice. Bottom panel, as a protein loading control, the blot was reprobed with anti-HMGB1, which is universally expressed by all cells.
-
Figure 1—source data 1
Binding affinity of mVC1-WT and mVC1-AHA to immobilized HMGB1 was determined by enzyme-linked immunosorbent assay (ELISA).
- https://cdn.elifesciences.org/articles/71403/elife-71403-fig1-data1-v2.zip
-
Figure 1—source data 2
Western blotting analysis of RAGE expression in lung lysate.
- https://cdn.elifesciences.org/articles/71403/elife-71403-fig1-data2-v2.zip
Figure 2 with 2 supplements
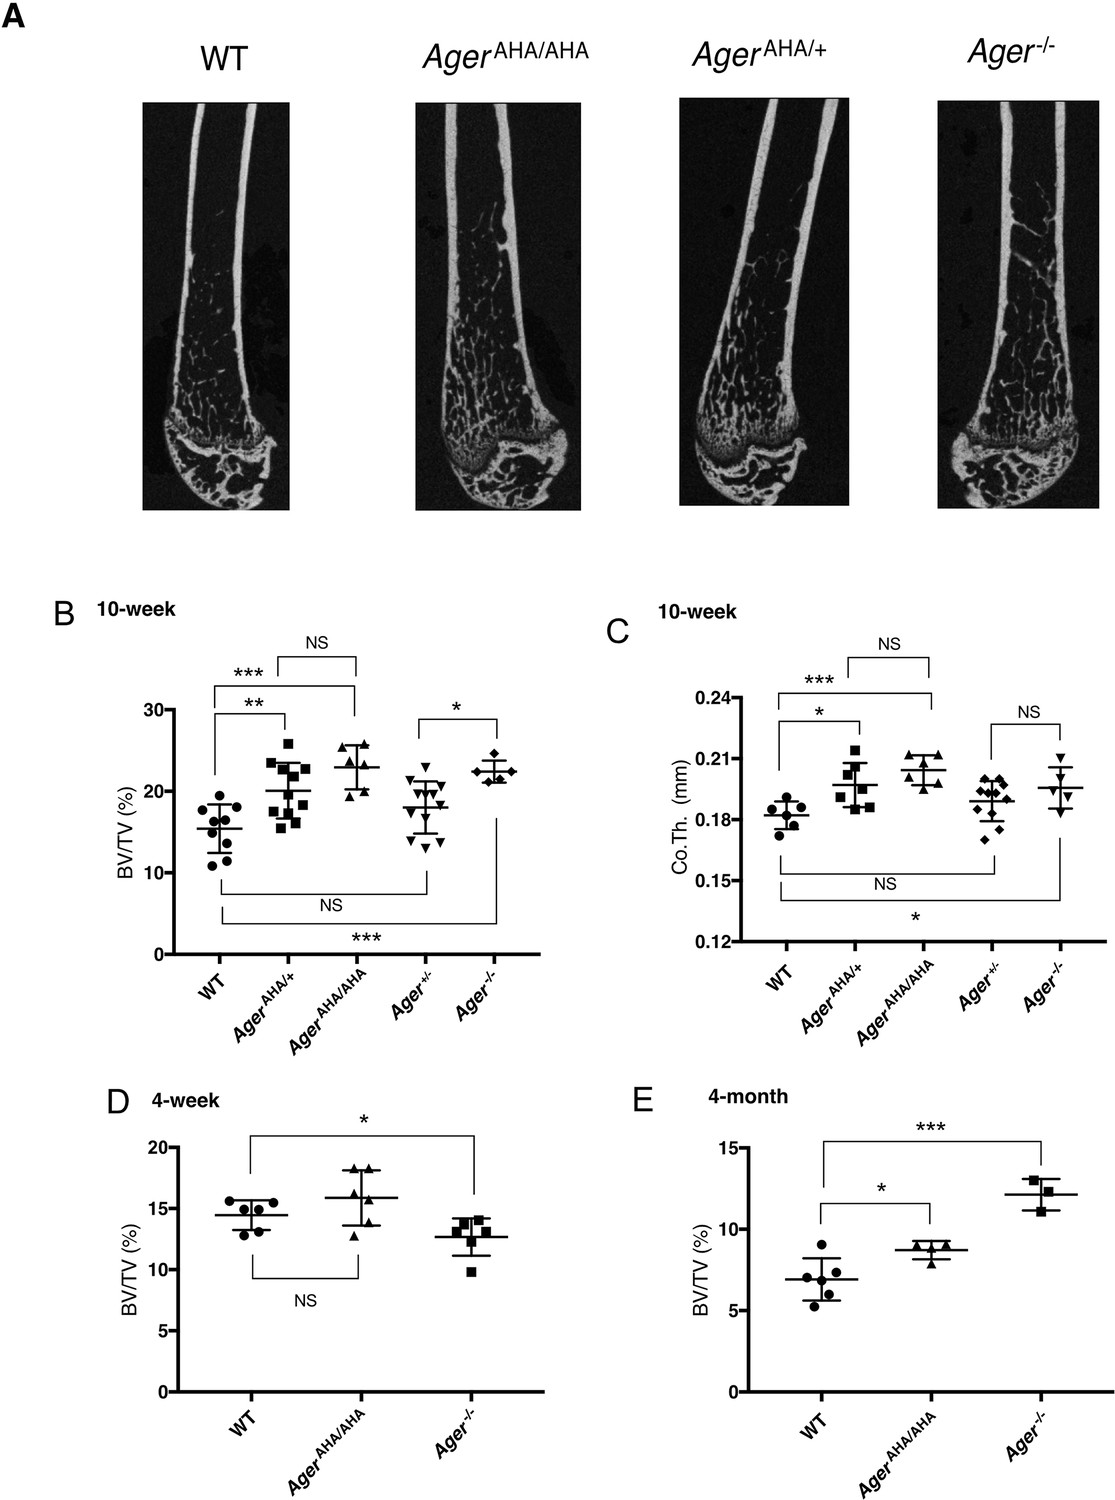
AgerAHA/AHA and AgerAHA/+ mice develop osteopetrotic phenotype.
(A) Representative μCT images of the femurs from 10-week-old male WT, AgerAHA/AHA, AgerAHA/+, and Ager−/− mice. (B) Trabecular bone volume/tissue volume ratio (BV/TV), n=5–12, and (C) cortical bone thickness of femurs from 10-week-old male WT, AgerAHA/AHA, AgerAHA/+, Ager+/−, and Ager−/− mice, n=5–12. (D) Trabecular BV/TV of 4-week-old male WT, AgerAHA/AHA, and Ager−/− mice, n=6. (E) Trabecular BV/TV of 4-month-old male WT, AgerAHA/AHA, and Ager−/− mice, n=3–6. Error bars represent SD. *, **, and *** represent p<0.05, 0.01, and 0.001, respectively.
-
Figure 2—source data 1
AgerAHA/AHA and AgerAHA/+ mice develop osteopetrotic phenotype.
- https://cdn.elifesciences.org/articles/71403/elife-71403-fig2-data1-v2.zip
Figure 2—figure supplement 1
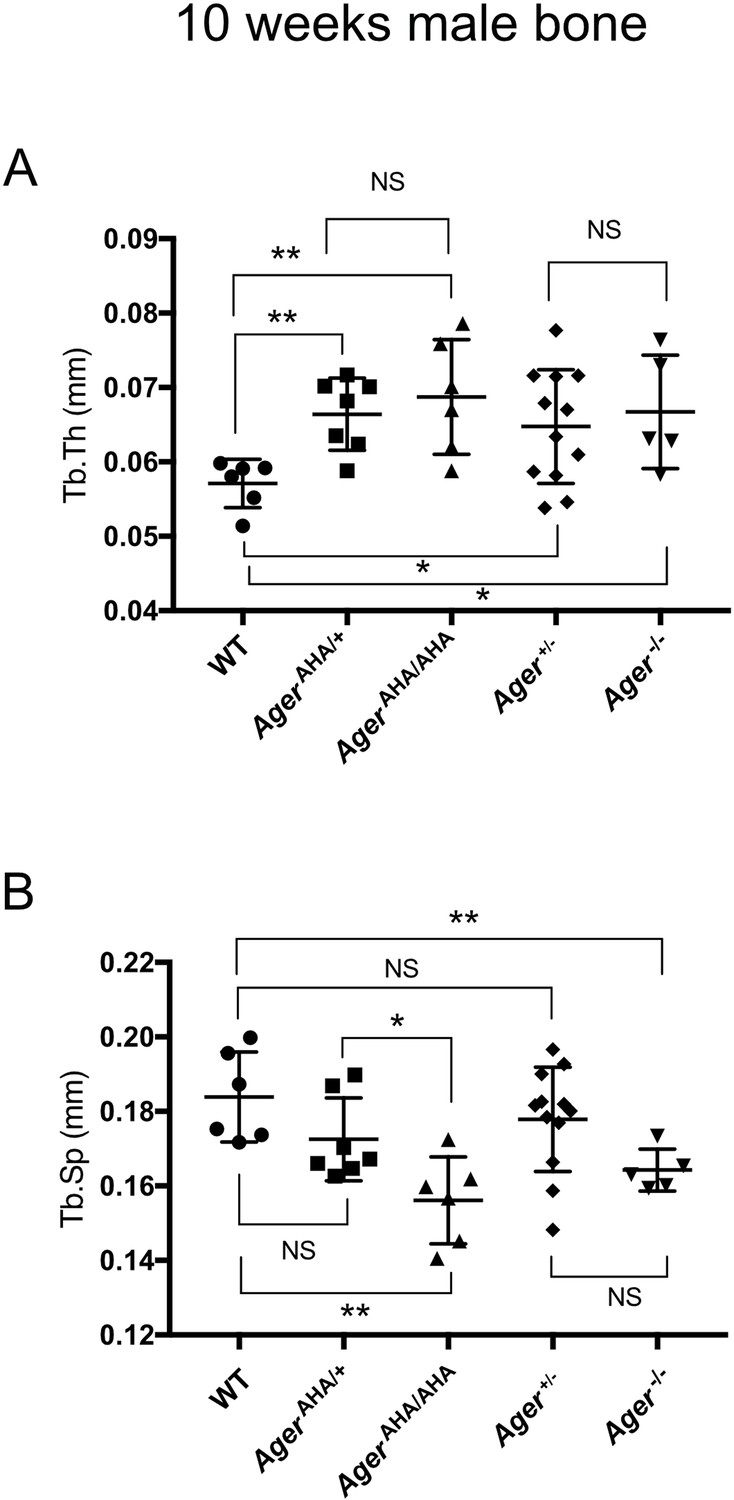
Trabecular bone morphometric analysis of 10-week-old male WT, AgerAHA/AHA, AgerAHA/+, Ager−/−, and Ager+/− mice.
(A) Trabecular thickness (Tb.Th) and (B) Trabecular separation (Tb.sp) as determined by µCT analysis. Error bars represent SD. *, **, and *** represent p<0.05, 0.01, and 0.001, respectively.
-
Figure 2—figure supplement 1—source data 1
Trabecular bone morphometric analysis of 10-week-old male WT, AgerAHA/AHA, AgerAHA/+, Ager−/−, and Ager+/− mice.
- https://cdn.elifesciences.org/articles/71403/elife-71403-fig2-figsupp1-data1-v2.zip
Figure 2—figure supplement 2
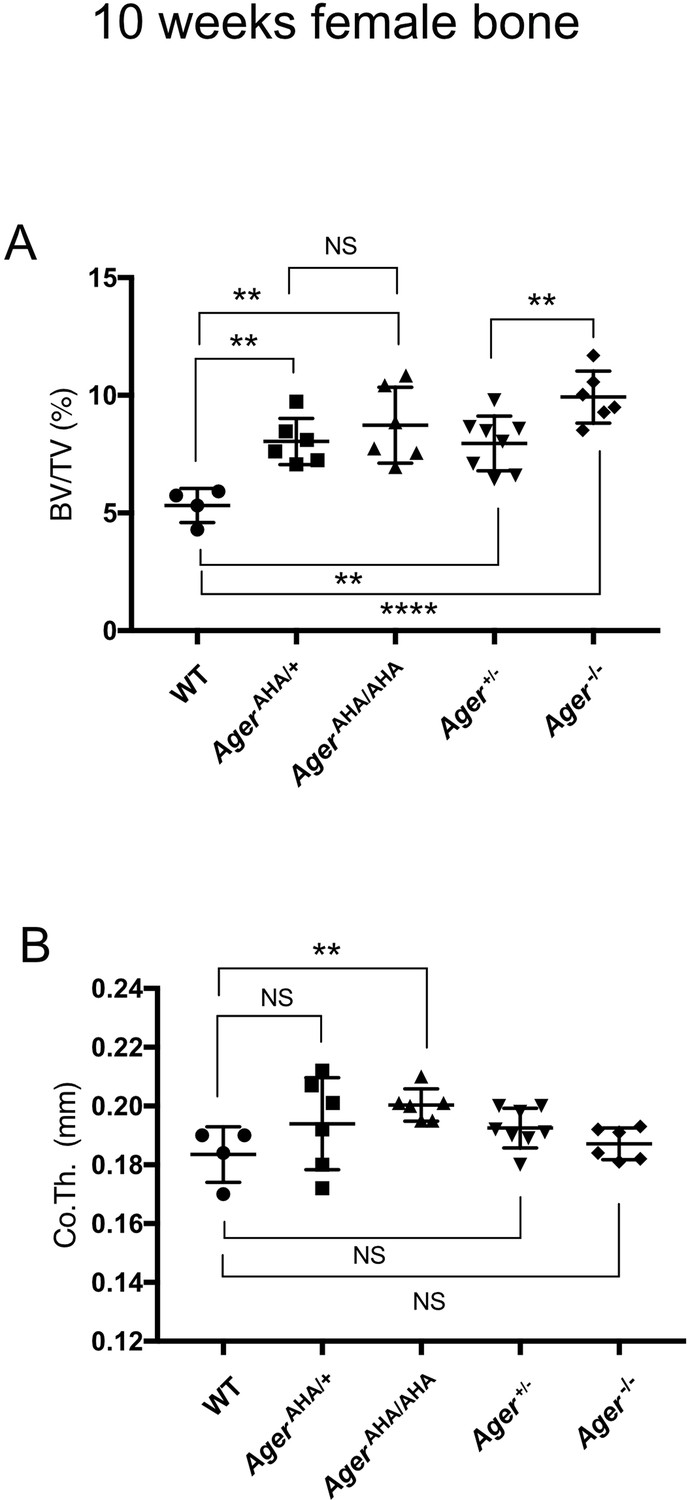
Female AgerAHA/AHA and AgerAHA/+ mice develop osteopetrotic phenotype.
(A) Trabecular bone volume/tissue volume ratio (BV/TV) and (B) cortical bone thickness of femurs from 10-week-old female WT, AgerAHA/AHA, AgerAHA/+, Ager+/−, and Ager−/− mice.
-
Figure 2—figure supplement 2—source data 1
Female AgerAHA/AHA and AgerAHA/+ mice develop osteopetrotic phenotype.
- https://cdn.elifesciences.org/articles/71403/elife-71403-fig2-figsupp2-data1-v2.zip
Figure 3 with 1 supplement
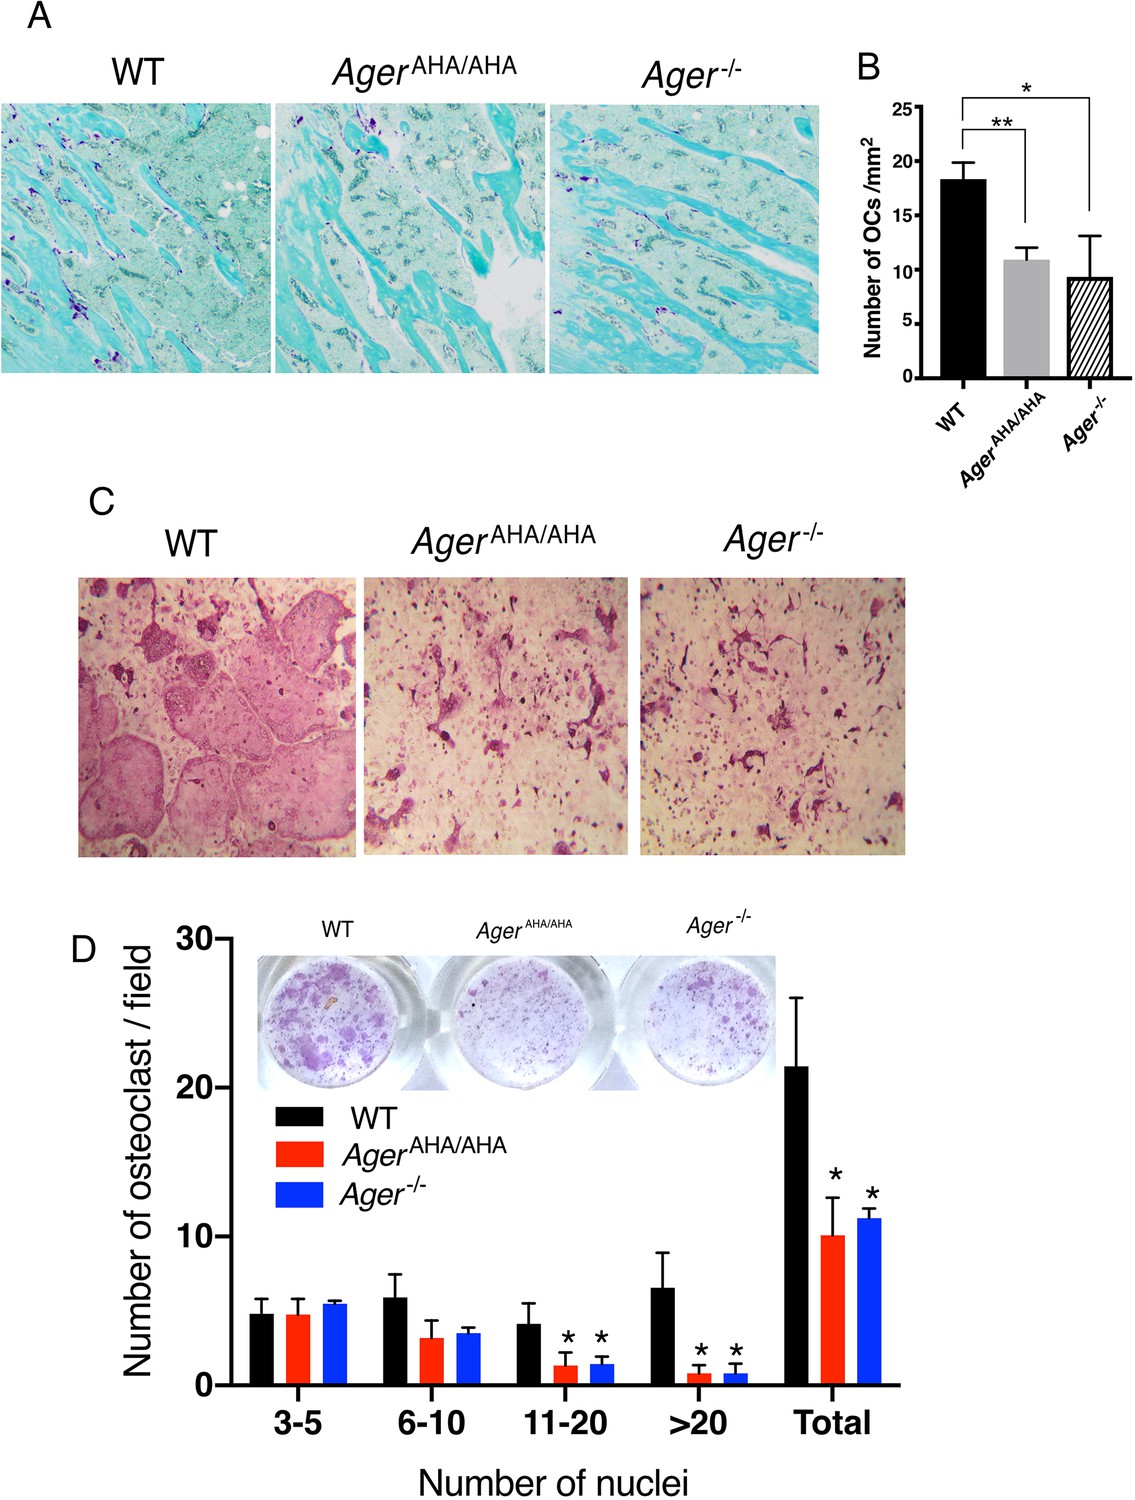
AgerAHA/AHA mice display impaired osteoclastogenesis.
(A) TRAP staining of paraffin sections of WT, AgerAHA/AHA, and Ager−/− tibias. Mature osteoclasts were stained purple, and bone was counterstained with Fast Green. (B) Quantification of osteoclasts (OCs) in tibia sections. n=3 mice. (C) BMM isolated from WT, AgerAHA/AHA, or Ager−/− mice was co-cultured with WT osteoblasts. Mature osteoclasts are visualized by TRAP staining. (D) Quantification of the number of osteoclasts per 100× field. Osteoclasts were sub-grouped into four categories based on the number of nuclei they contain. n=3 wells. * and ** represent p<0.05 and 0.01, respectively. Data are representative of at least three separate assays. TRAP, tartrate-resistant acid phosphatase; WT, wild-type.
-
Figure 3—source data 1
AgerAHA/AHA mice display impaired osteoclastogenesis.
- https://cdn.elifesciences.org/articles/71403/elife-71403-fig3-data1-v2.zip
Figure 3—figure supplement 1

Bone formation was unaltered in AgerAHA/AHA and Ager−/− mice.
(A–C) Analysis of bone formation by calcein/Alizarin Red S double labeling in 8-week-old WT, AgerAHA/AHA, and Ager−/− tibia. (D) Mineral apposition rate (MAR) calculated from the double-labeling analysis in 8-week-old WT, AgerAHA/AHA, and Ager−/− tibia, n=6–8.
-
Figure 3—figure supplement 1—source data 1
Mineral apposition rate (MAR) calculated from the double-labeling analysis in 8-week-old WT, AgerAHA/AHA, and Ager−/− tibia.
- https://cdn.elifesciences.org/articles/71403/elife-71403-fig3-figsupp1-data1-v2.zip
Figure 4
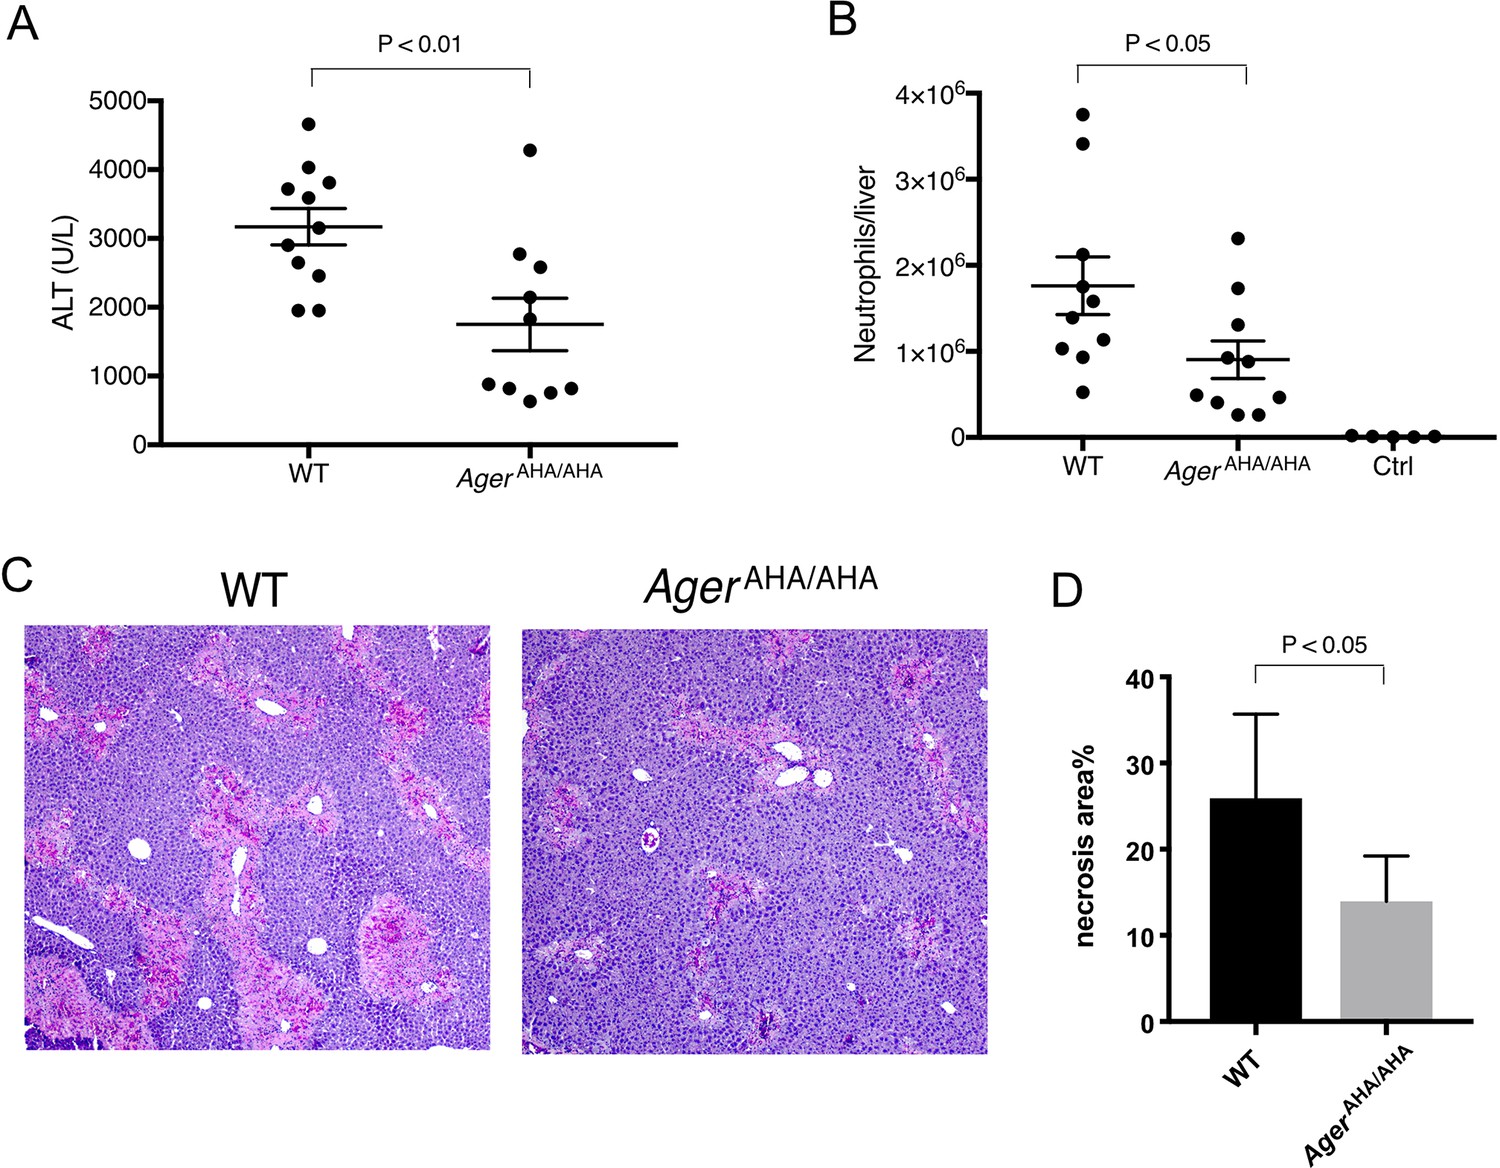
AgerAHA/AHA mice were protected from liver injury after APAP overdose.
(A) WT and AgerAHA/AHA mice were treated with 300 mg/kg APAP to induce liver injury and plasma ALT concentrations were measured 24 hr post injury, n=10–11. (B) Neutrophils recruitment into the liver after APAP-induced liver injury, n=5–10. (C) Hematoxylin and eosin (H&E) staining of paraffin-embedded liver tissues to show the extent of liver necrosis. (D) The necrotic area of H&E stained liver tissues was quantified with ImageJ, n=5.
-
Figure 4—source data 1
AgerAHA/AHA mice were protected from liver injury after APAP overdose.
- https://cdn.elifesciences.org/articles/71403/elife-71403-fig4-data1-v2.zip
Figure 5 with 4 supplements
RNA-seq transcriptome analysis of AgerAHA/AHA mice and Ager−/− mice.
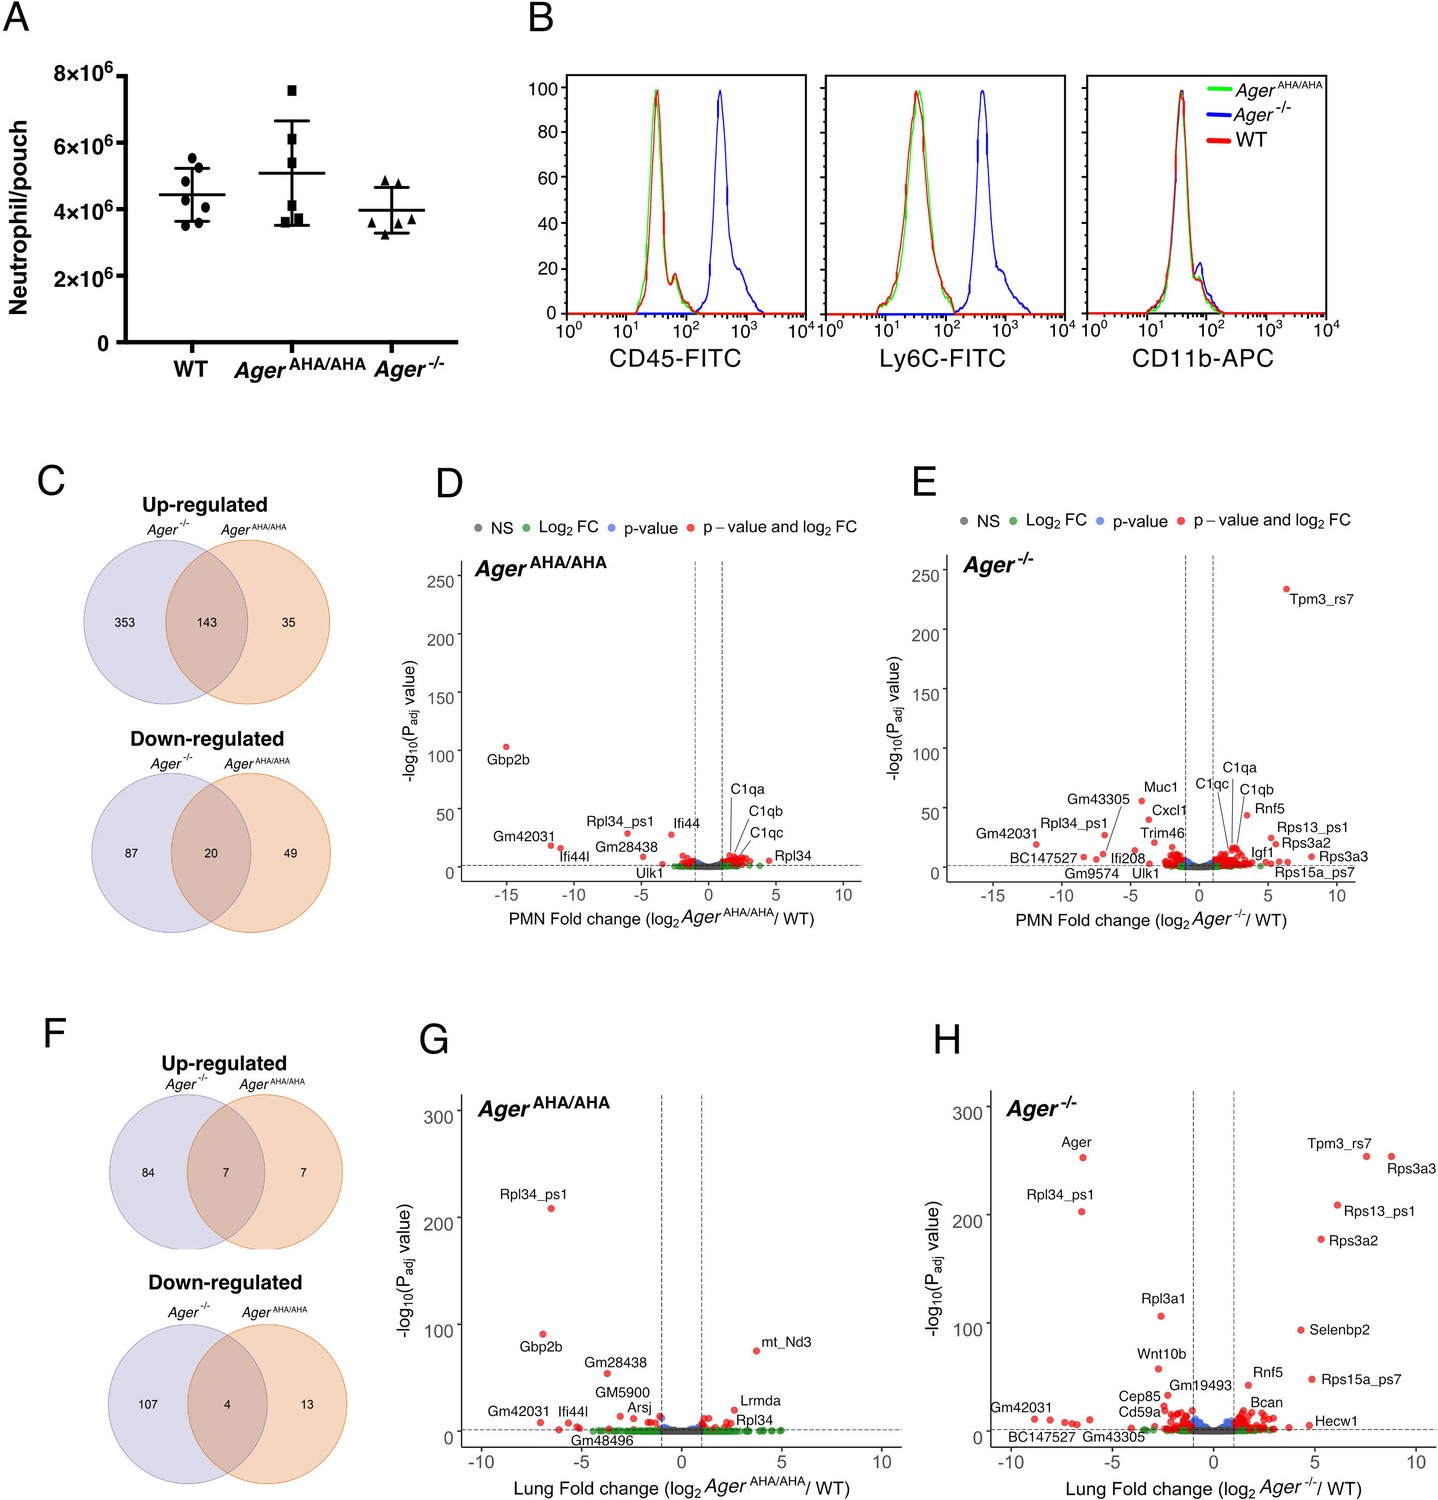
(A) LPS-induced neutrophil infiltration into air pouch in WT, AgerAHA/AHA, and Ager−/− mice, n=6–7. Neutrophils were quantified 4 hr after LPS injection. (B) Surface marker (CD45, Ly6C, and CD11b) analysis of air pouch neutrophils by FACS. Cells from six mice of each genotype were analyzed with identical result. (C–E) RNA-seq transcriptome analysis of AgerAHA/AHA and Ager−/− mice PMN. (C) Plot of up- and downregulated genes in AgerAHA/AHA and Ager−/− PMN. DEGs between AgerAHA/AHA and WT PMNs were determined based on Benjamin–Hochberg multicomparison correction p values. 178 genes were found to be significantly upregulated (padj value≤0.05, log2 fold change≥1) while 69 genes were found to be significantly downregulated (padj value≤0.05, log2 fold change≤–1). DEGs between Ager−/− and WT PMNs were determined similarly. 476 genes were found to be significantly upregulated (padj value≤0.05, log2 fold change≥1) while 107 genes were found to be significantly downregulated (padj value≤0.05, log2 fold change≤–1). (D) Volcano plot of DEGs between AgerAHA/AHA PMN and WT PMNs. Genes with most significant changes were marked in the plot. (E) Volcano plot of DEGs between Ager−/− PMN and WT PMNs. (F–H) RNA-seq transcriptome analysis of whole lungs from AgerAHA/AHA and Ager−/− mice. (F) Plot of up- and downregulated genes in AgerAHA/AHA and Ager−/− lungs. 14 genes were found to be significantly upregulated while 17 genes were found to be significantly downregulated in AgerAHA/AHA lungs. In Ager−/− lungs, 91 genes were found to be significantly upregulated while 111 genes were found to be significantly downregulated. (G) Volcano plot of DEGs between AgerAHA/AHA and WT lungs. Genes with most significant changes were marked in the plot. (H) Volcano plot of DEGs between Ager−/− and WT lungs. DEG, differentially expressed gene; PMN, polymorphonuclear; WT, wild-type.
-
Figure 5—source data 1
LPS-induced neutrophil infiltration into air pouch in WT, AgerAHA/AHA , and Ager−/− mice.
- https://cdn.elifesciences.org/articles/71403/elife-71403-fig5-data1-v2.zip
Figure 5—figure supplement 1
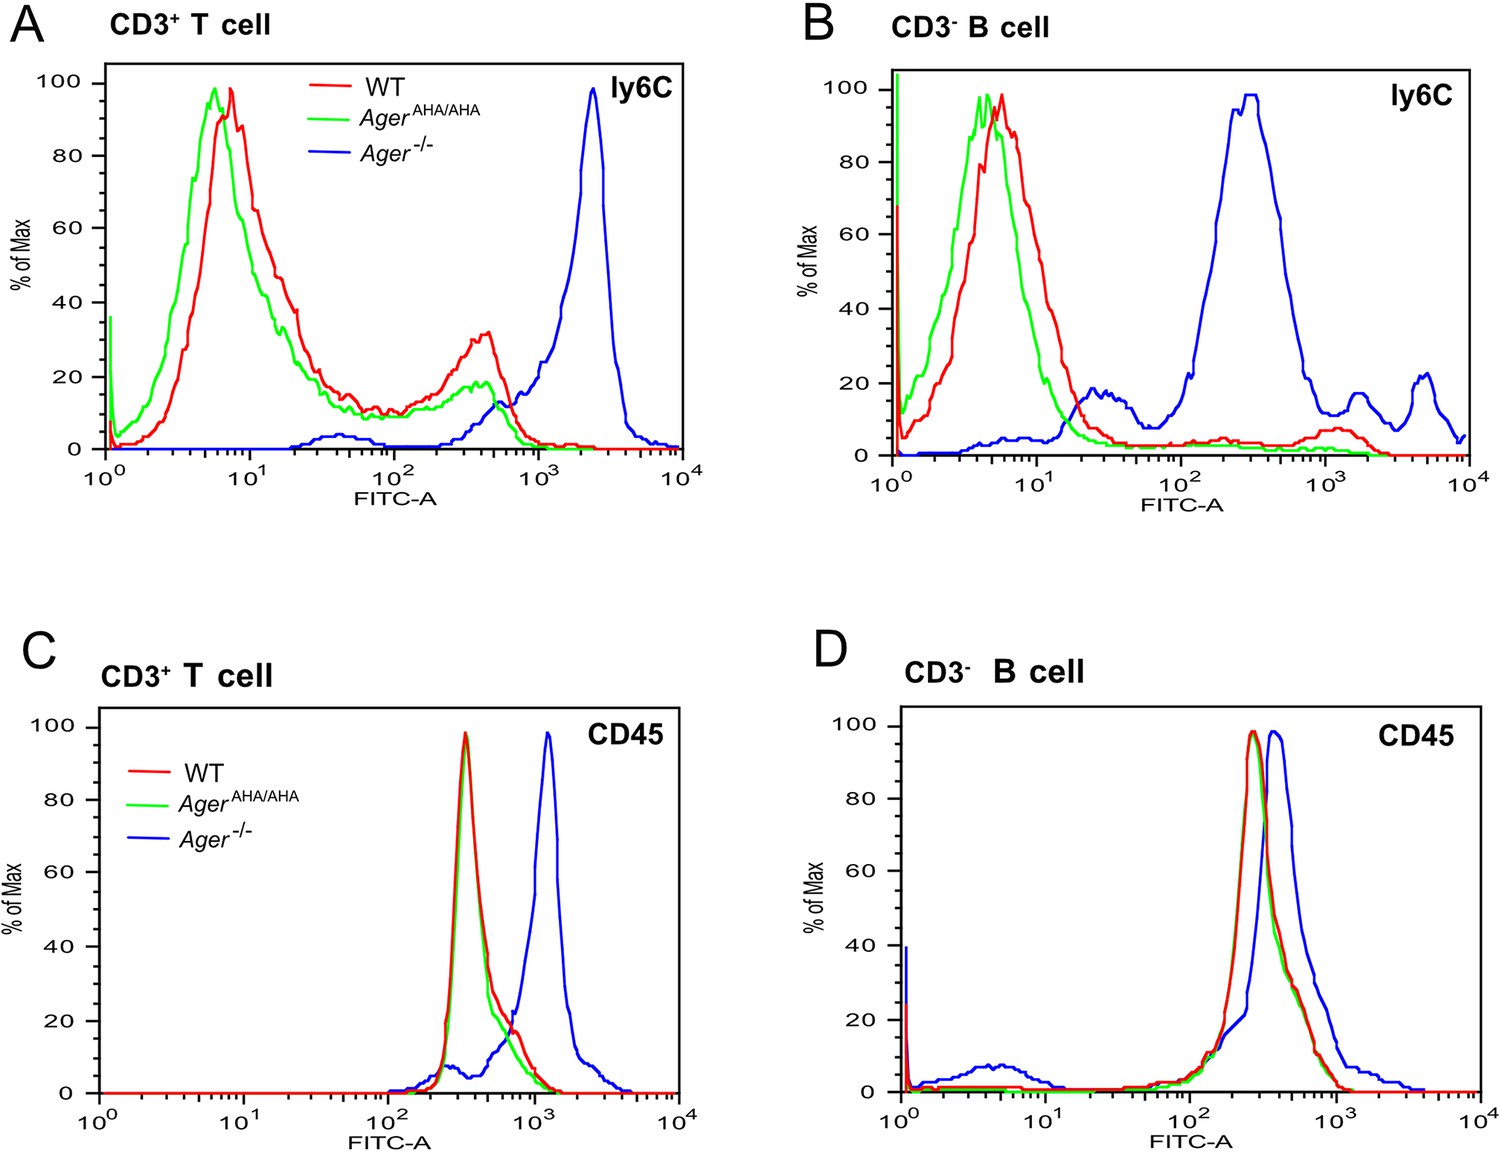
T cells and B cells from Ager−/− mice display greatly elevated surface expression of Ly6C and CD45.
(A) CD3+ T cells and (B) CD3− B cells from WT, AgerAHA/AHA, and Ager−/− mice were stained with a rat anti-Ly6C-FITC mAb. (C) CD3+ T cells and (D) CD3− B cells were stained with a rat anti-CD45-FITC mAb. Cells isolated from four mice in each genotype were analyzed with almost identical result.
Figure 5—figure supplement 2
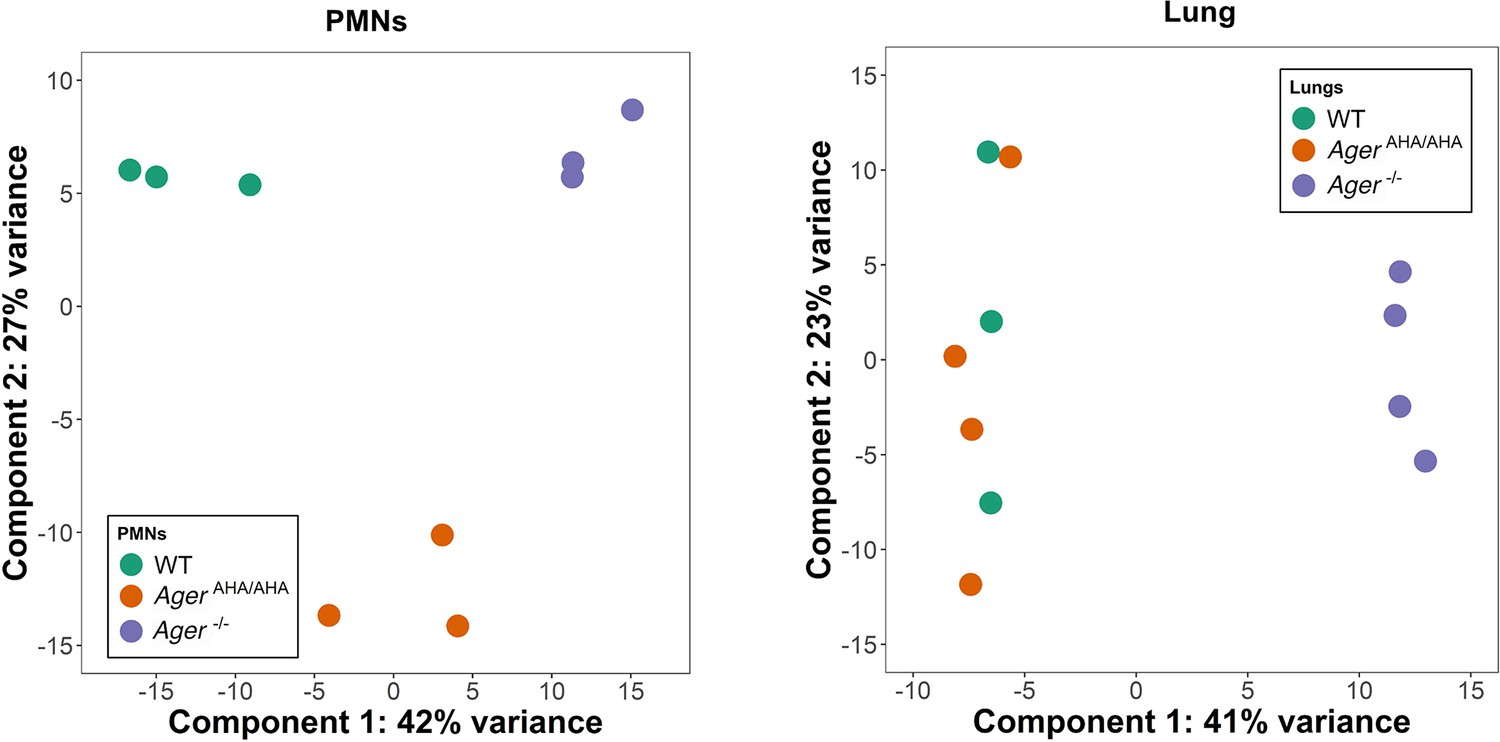
Principal component analysis of RNAseq data.
PMN and lung transcriptome of WT, AgerAHA/AHA, and Ager−/− mice (3–4 mice for each) were analyzed by principal component analysis using DESeq2 R package (v1.30.1). Delineation of the PMN transcriptome suggests clear separation between AgerAHA/AHA and Ager−/− compared to WT mice while the lung transcriptome suggests overlap between AgerAHA/AHA and WT mice with Ager−/− having clear separation. PMN, polymorphonuclear; WT, wild-type.
Figure 5—figure supplement 3
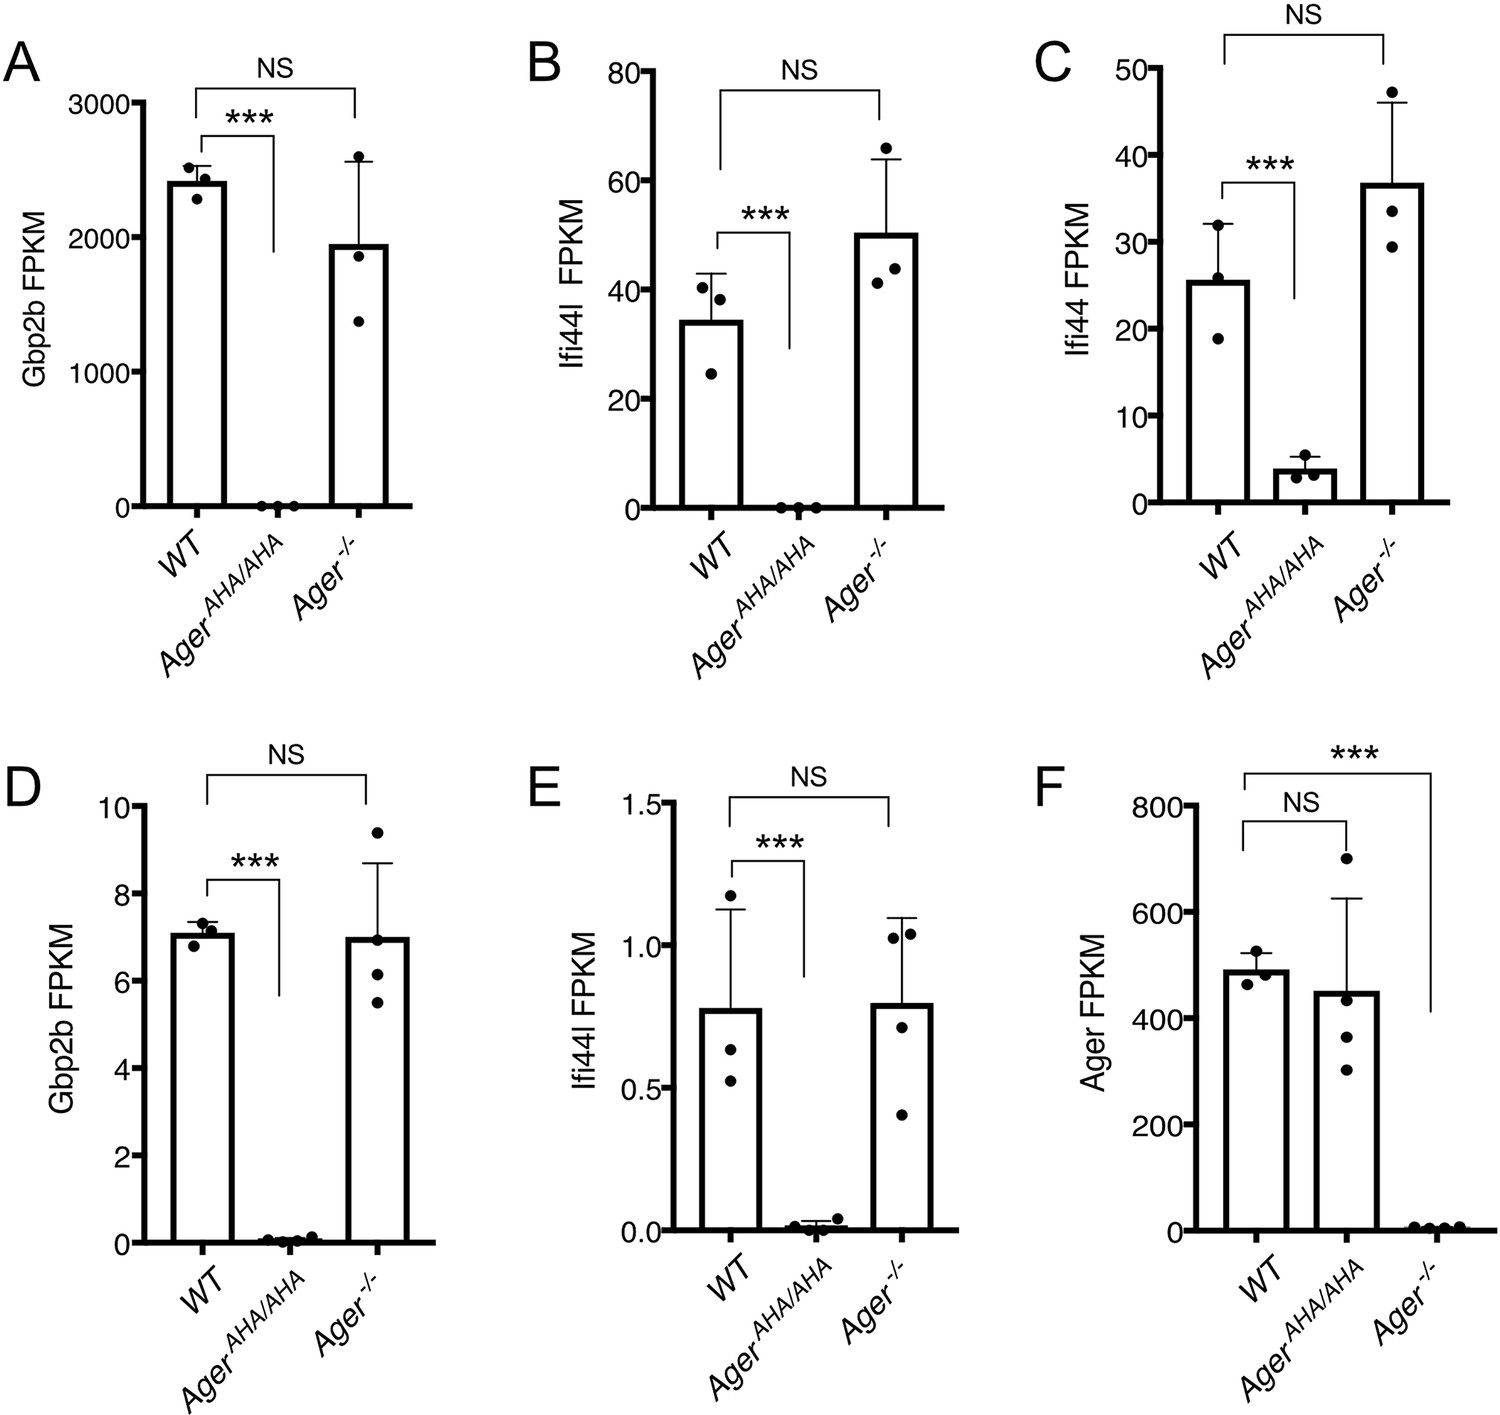
Expression levels of selected genes as determined by RNA-seq.
(A–C) Expression levels of Gbp2b, Ifi44L, and Ifi44 in neutrophils, respectively, were plotted in FPKM (expected number of Fragments Per Kilobase of transcript sequence per Millions base pairs sequence). (D–F) Expression levels of Gbp2b, Ifi44L, and Ager in lungs, respectively, were plotted in FPKM.
-
Figure 5—figure supplement 3—source data 1
Expression levels of selected genes as determined by RNA-seq.
- https://cdn.elifesciences.org/articles/71403/elife-71403-fig5-figsupp3-data1-v2.zip
Figure 5—figure supplement 4
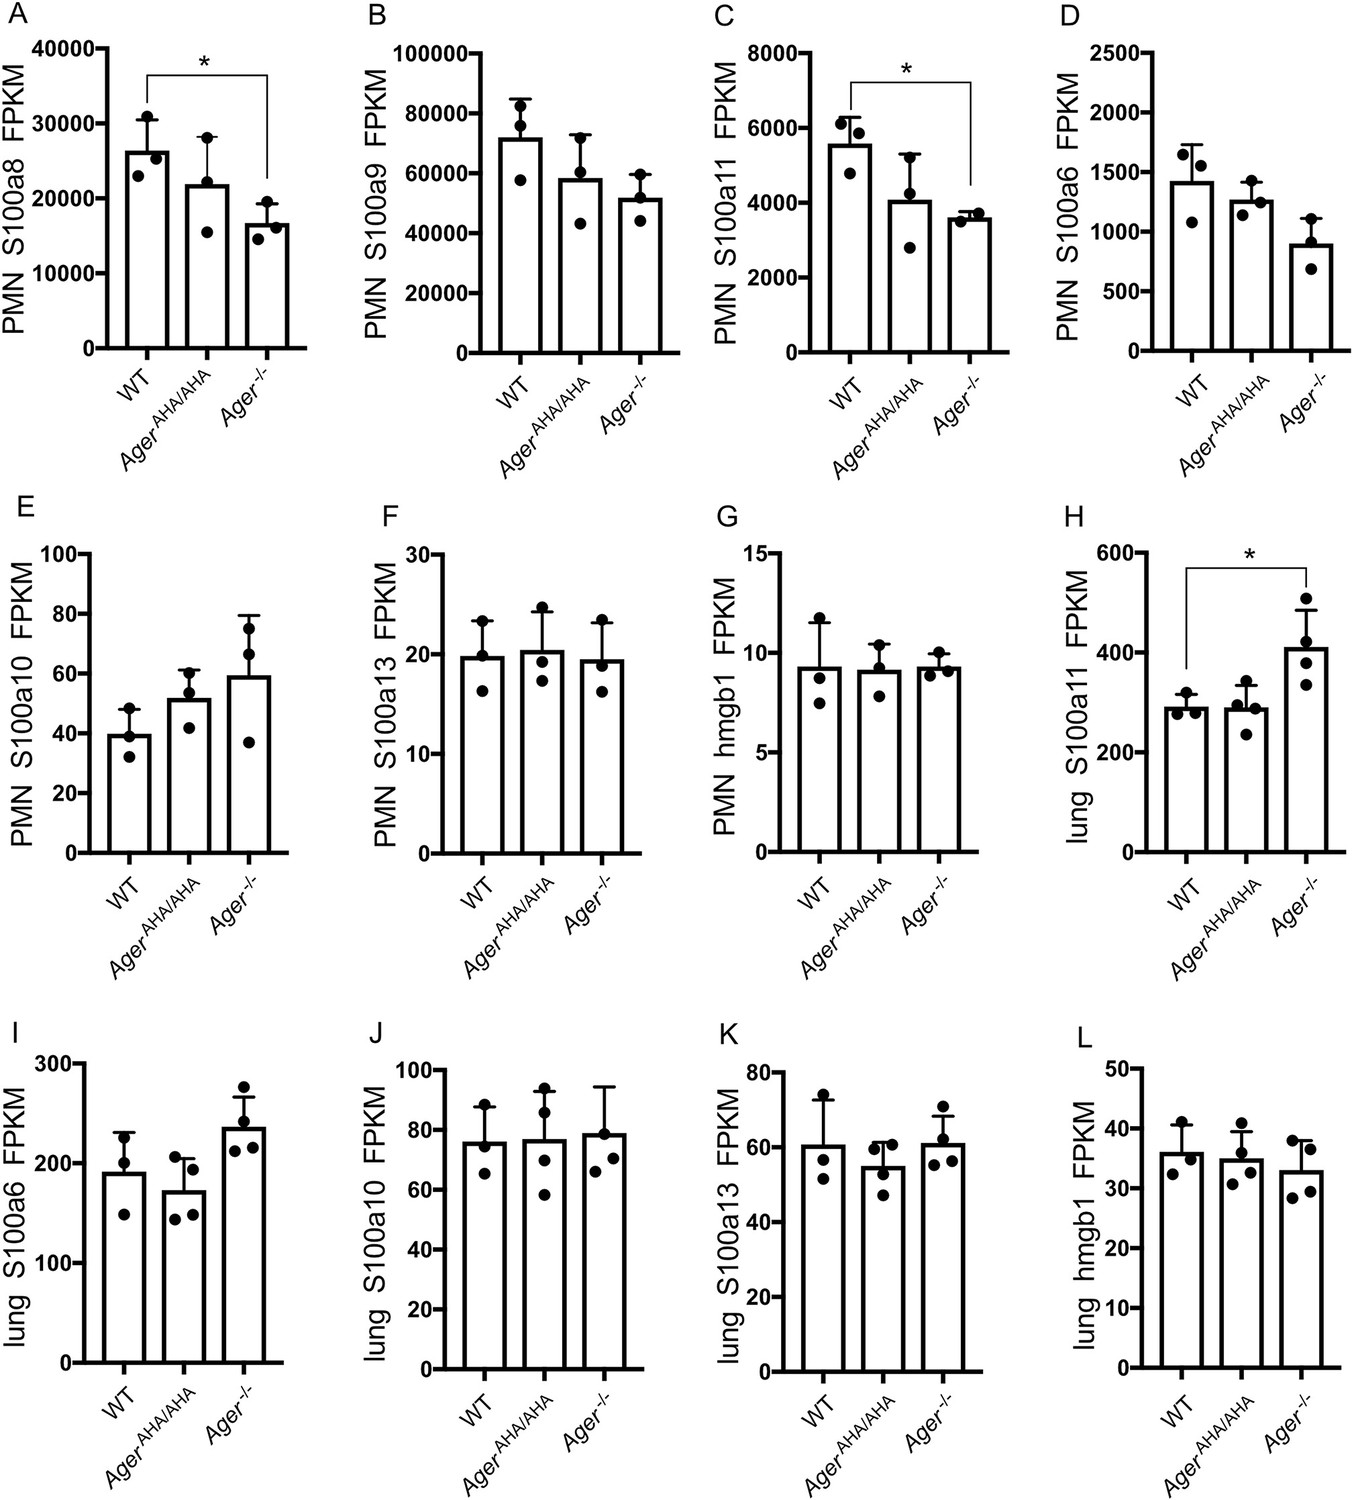
Expression levels of highly expressed AGER ligands as determined by RNA-seq.
(A–G) Expression levels of S100a8, S100a9, S100a11, S100a6, S100a10, S100a13, and hmgb1 in neutrophils were plotted in FPKM. (H–L) Expression levels of S100a11, S100a6, S100a10, S100a13, and hmgb1 in lungs were plotted in FPKM. * represents p<0.05. For all unlabeled bars, no significant difference was detected compared to WT level.
-
Figure 5—figure supplement 4—source data 1
Expression levels of highly expressed AGER ligands as determined by RNA-seq.
- https://cdn.elifesciences.org/articles/71403/elife-71403-fig5-figsupp4-data1-v2.zip
Figure 6
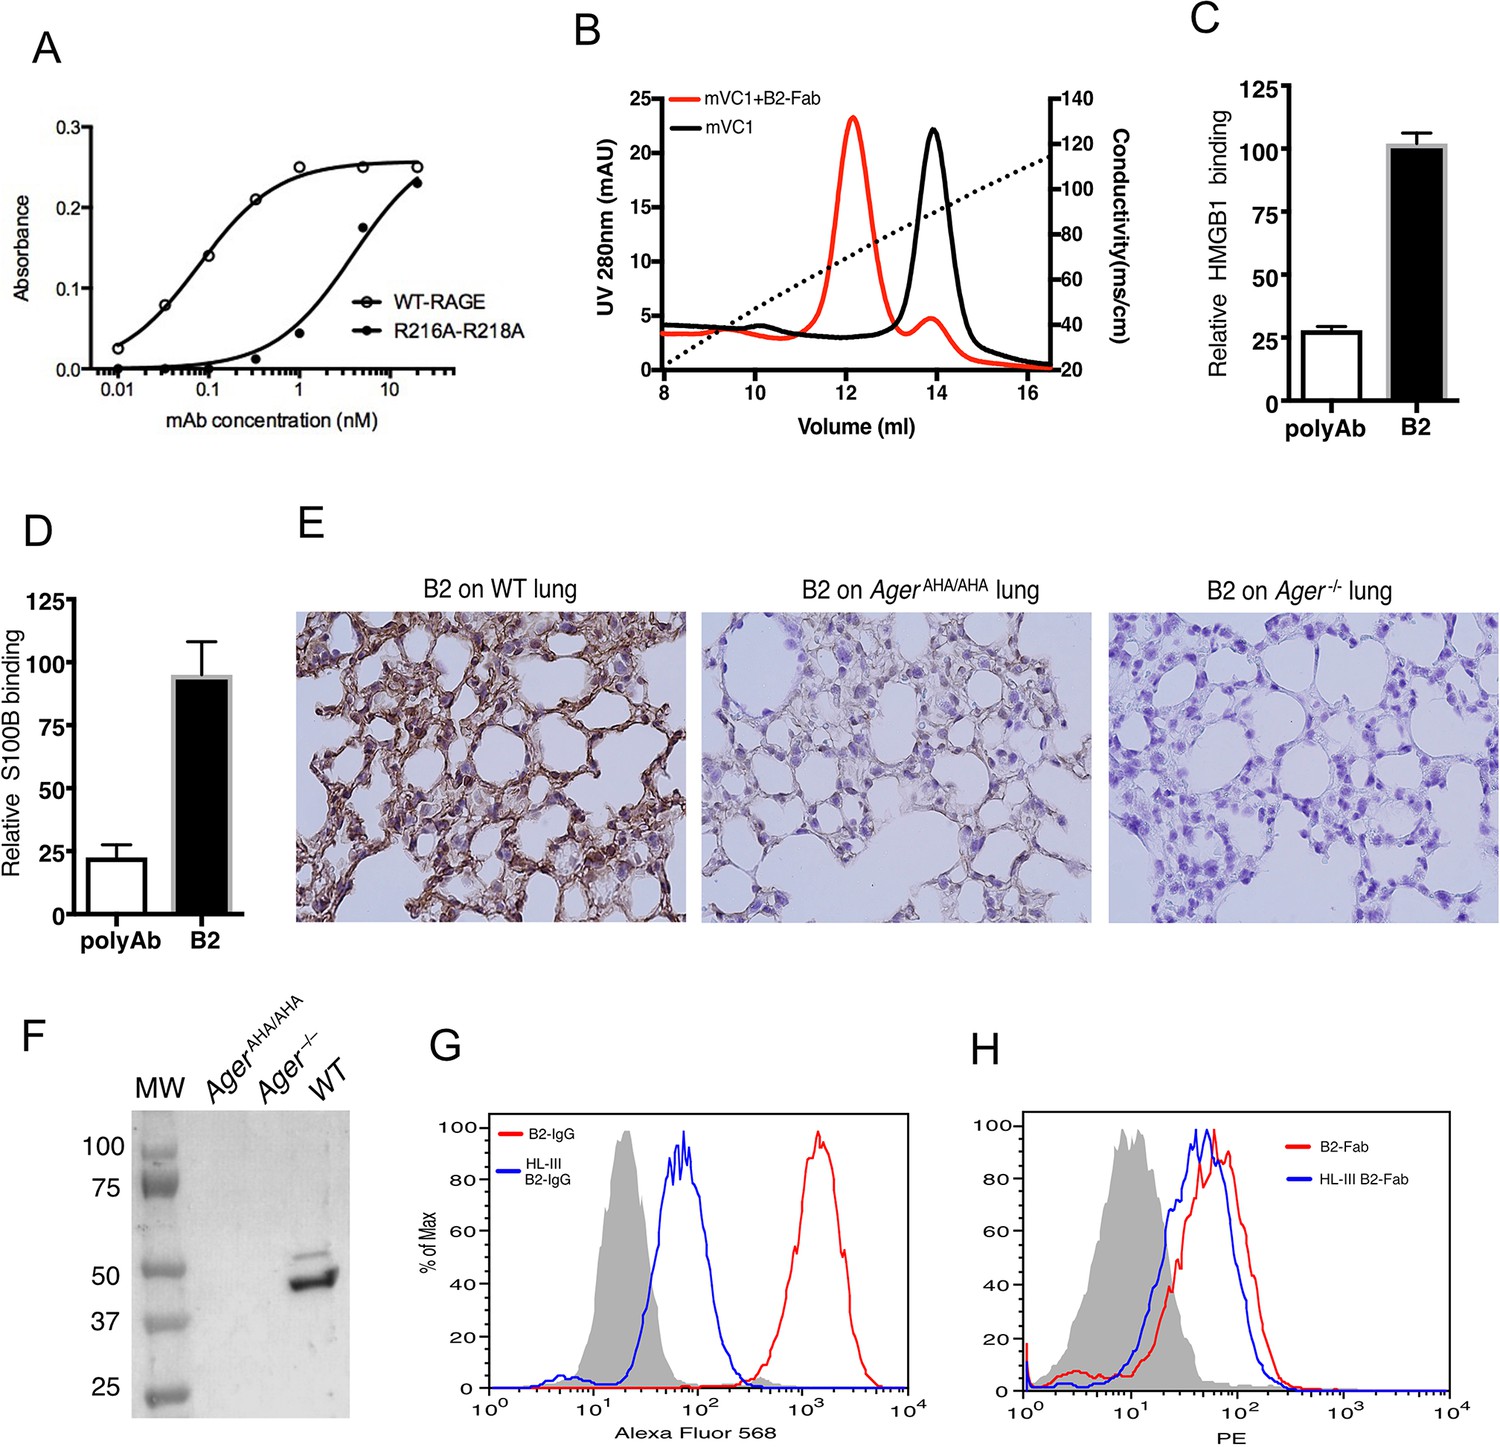
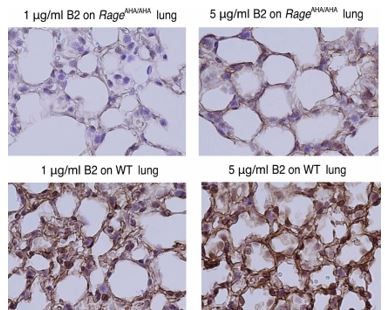
Development of a rabbit mAb that targets specifically to the HS-binding site of RAGE.
(A) Binding of rabbit mAb B2 to immobilized wild-type (WT) sRAGE or R216A-R218A mutant was determined by ELISA. The dramatically reduced binding affinity of B2 to R216A-R218A mutant (Kd=4 nM) compared to its affinity to WT sRAGE (Kd=0.1 nM) indicates that R216 and R218 are part of the epitope for B2. (B) B2 directly inhibits binding of RAGE to heparin. WT mouse RAGE VC1 domain (mVC1) were either directly loaded onto heparin Sepharose column, or loaded after 30 min incubation with Fab fragment of B2 at 1:1 molar ratio. B2-Fab bound mVC1 displayed greatly reduced binding to heparin column. (C) Binding of biotinylated sRAGE to immobilized HMGB1 was measured in the presence of anti-RAGE rabbit polyclonal Ab or B2 at 5 µg/ml. Binding of sRAGE to HMGB1 in the absence of antibodies was set to 100%. (D) Binding of biotinylated sRAGE to immobilized S100B was measured in the presence of anti-RAGE rabbit polyclonal Ab or B2 at 5 µg/ml. (E) Determine the specificity of B2 by immunostaining of lung sections from WT, AgerAHA/AHA, and Ager−/− mice with 1 µg/ml B2. (F) Western blot analysis of the specificity of B2 using lung lysate from WT, AgerAHA/AHA, and Ager−/− mice. Please note B2 failed to detect RAGE-AHA mutant, again confirming the epitope of B2. The loading ctrl is the same as shown in Figure 1F. (G) Binding of B2 IgG to untreated MDA-453 cells or cells pretreated with heparin lyase III (HL-III). Whole IgG form of B2 (bivalent) binds to cell surface RAGE in an HS-dependent manner. (H) Binding of B2 Fab fragment to untreated MDA-453 cells or cells pretreated with HL-III. Binding of the Fab form of B2 (monovalent) to RAGE was not sensitive to HL-III treatment. The shaded histograms in (G–H) are from cells stained only with control antibodies.
-
Figure 6—source data 1
Development of a rabbit mAb that targets specifically to the HS-binding site of RAGE.
- https://cdn.elifesciences.org/articles/71403/elife-71403-fig6-data1-v2.zip
-
Figure 6—source data 2
Western blot analysis of the specificity of B2 using lung lysate from WT, AgerAHA/AHA, and Ager−/− mice.
- https://cdn.elifesciences.org/articles/71403/elife-71403-fig6-data2-v2.zip
Figure 7
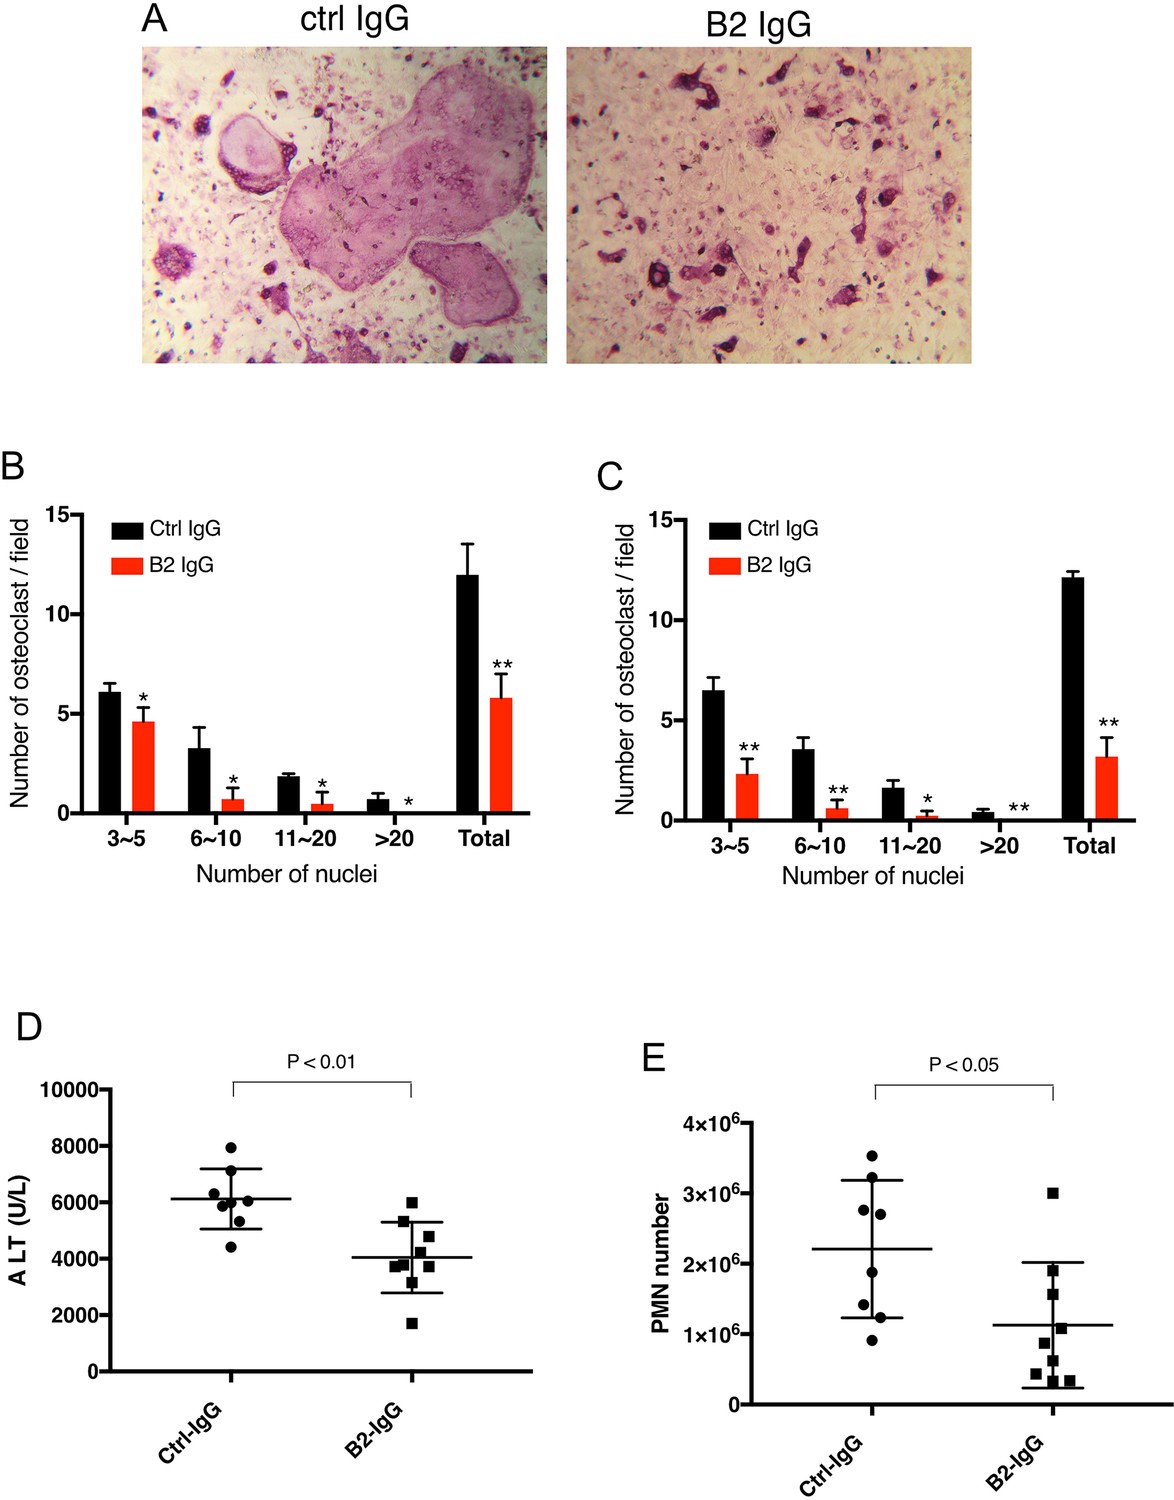
B2 inhibits RAGE-dependent biological processes in cell and animal models.
(A) B2 inhibits osteoclastogenesis in vitro. Representative images of TRAP staining of WT bone marrow cells co-cultured with WT osteoblasts in the presence of 20 µg/ml B2 or control IgG. Mature osteoclasts were stained pink. (B) Osteoclasts were sub-grouped into four categories based on the number of nuclei and quantified, n=3 wells. (C) B2 also inhibits osteoclastogenesis in monoculture assay, where differentiation of bone marrow macrophages was induced by exogenous RANKL and m-CSF, n=3 wells. (D, E) B2 was protective as a pretreatment in APAP-induced liver injury. WT mice were pretreated with 10 mg/kg of B2-IgG 12 h before APAP overdose (300 mg/kg). Plasma ALT concentrations (D) and neutrophils recruitment into to liver, n=8–9 (E) were quantified 24 hr post liver injury, n=8–9. TRAP, tartrate-resistant acid phosphatase; WT, wild-type.
-
Figure 7—source data 1
B2 inhibits RAGE-dependent biological processes in cell and animal models.
- https://cdn.elifesciences.org/articles/71403/elife-71403-fig7-data1-v2.zip
Author response image 1
Tables
Key resources table
| Reagent type (species) or resource | Designation | Source or reference | Identifiers | Additional information |
|---|---|---|---|---|
| Genetic reagent(Mus musculus) | AgerAHA/AHA | This paper | Knockin mouse created by CRISPR | |
| Genetic reagent(M. musculus) | Ager−/− | PMID:15173891 | MGI:2451038 | RAGE knockout mouse: Agertm1.1Arnd |
| Strain, strain background (Escherichia coli) | Origami-B (DE3) | MilliporeSigma | Cat#: 70837 | |
| Cell line (Hamster) | Flp-In-CHO Cell Line | Invitrogen | Cat#: R75807RRID:CVCL_U424 | Directly purchased from manufacture, negative for mycoplasma |
| Cell line (Homo-sapiens) | MDA-MB-453 | ATCC | Cat#: HTB-131RRID:CVCL_0418 | Identity authenticated by SRT profiling, negative for mycoplasma |
| Antibody | Anti-RAGE (rabbit monoclonal) | This paper | B2 | WB: 1 µg/mlFunctional: 5–20 µg/ml |
| Antibody | Anti-RAGE (human monoclonal) | This paper | B2, rabbit-human chimeric | IHC: 1 µg/mlFC: 10 µg/mlIn vivo: 10 mg/kg |
| Antibody | Anti-mouse Ly-6G-PE (rat monoclonal) | BD Biosciences | Cat#: 561104RRID:AB_10563079 | FC: 1:100 |
| Antibody | Anti-mouse CD45-FITC (rat monoclonal) | BioLegend | Cat#: 103107RRID:AB_312972 | FC: 1:100 |
| Antibody | Anti-mouse CD11b-APC (rat monoclonal) | BD Biosciences | Cat#: 561690RRID:AB_10897015 | FC: 1:100 |
| Antibody | Anti-mouse Ly-6C-FITC (rat monoclonal) | BioLegend | Cat#: 128005RRID:AB_1186134 | FC: 1:100 |
| Antibody | Anti-mouse CD3-PE (rat monoclonal) | BioLegend | Cat#: 100205RRID:AB_312662 | FC: 1:100 |
| Antibody | Anti-mouse CD8a-APC (rat monoclonal) | BioLegend | Cat#: 100711RRID:AB_312750 | FC: 1:100 |
| Antibody | Anti-mouse RAGE (rat monoclonal) | R&D Systems | Cat#: MAB1179RRID:AB_2289349 | WB: 2 µg/ml |
| Antibody | Anti-HMGB1 (rabbit monoclonal) | Abcam | Cat#: Ab79823RRID:AB_1603373 | WB: 1:10,000 |
| Recombinant DNA reagent | pcDNA5⁄FRT(plasmid) | Invitrogen | Cat#: V601020 | |
| Recombinant DNA reagent | pET21b (plasmid) | MilliporeSigma | Cat#: 69741 | |
| Recombinant protein | m-CSF | PeproTech | Cat#: 315-02 | |
| Recombinant protein | RANKL | PMID:15173891 | ||
| Recombinant protein | VC1 domain of mouse RAGE | PMID:23679870 | ||
| Sequence-based reagent | sgRNA | This paper | sgRNA | GGGGCCGCGTCTGGGGACTTGTG |
| Commercial assay or kit | Leukocyte Acid Phosphatase Kit | Sigma-Aldrich | Cat#: 387A-1KT | |
| Commercial assay or kit | RNeasy Mini Kit | QIAGEN | Cat#: 74134 | |
| Chemical compound, drug | Acetaminophen | Sigma-Aldrich | Cat#: A5000 | |
| Software, algorithm | ImageJ(v1.50i) | PMID:22930834 | RRID:SCR_003070 | https://imagej.nih.gov/ij/index.html |
| Software, algorithm | Graphpad Prism 7 | GraphPad Software | RRID:SCR_002798 | |
| Software, algorithm | AnalyzePro 1.0 | AnalyzeDirect Inc | RRID:SCR_005988 | https://analyzedirect.com |
| Software, algorithm | DESeq2 R package (v1.30.1) | PMID:25516281 | RRID:SCR_015687 | |
| Software, algorithm | clusterProfiler R package (v3.18.1) | PMID:22455463 | RRID:SCR_016884 |
Additional files
-
Supplementary file 1
List of differentially expressed genes (DEGs) from WT, AgerAHA/AHA and Ager−/− PMNs.
- https://cdn.elifesciences.org/articles/71403/elife-71403-supp1-v2.xlsx
-
Supplementary file 2
Gene ontology analysis of genes from Ager−/− PMNs.
- https://cdn.elifesciences.org/articles/71403/elife-71403-supp2-v2.xlsx
-
Supplementary file 3
Gene ontology analysis of genes from AgerAHA/AHA PMNs.
- https://cdn.elifesciences.org/articles/71403/elife-71403-supp3-v2.xlsx
-
Supplementary file 4
List of differentially expressed genes (DEGs) from WT, AgerAHA/AHA and Ager−/− lungs.
- https://cdn.elifesciences.org/articles/71403/elife-71403-supp4-v2.xlsx
-
Supplementary file 5
Gene ontology analysis of genes from WT, AgerAHA/AHA and Ager−/− lungs.
- https://cdn.elifesciences.org/articles/71403/elife-71403-supp5-v2.xlsx
-
Transparent reporting form
- https://cdn.elifesciences.org/articles/71403/elife-71403-transrepform1-v2.docx
Download links
A two-part list of links to download the article, or parts of the article, in various formats.
Downloads (link to download the article as PDF)
Open citations (links to open the citations from this article in various online reference manager services)
Cite this article (links to download the citations from this article in formats compatible with various reference manager tools)
Heparan sulfate-dependent RAGE oligomerization is indispensable for pathophysiological functions of RAGE
eLife 11:e71403.
https://doi.org/10.7554/eLife.71403


