Signature-scoring methods developed for bulk samples are not adequate for cancer single-cell RNA sequencing data
- Greehey Children’s Cancer Research Institute, UT Health San Antonio, United States
- Department of Population Health Sciences, UT Health San Antonio, United States
Figures
Figure 1 with 3 supplements
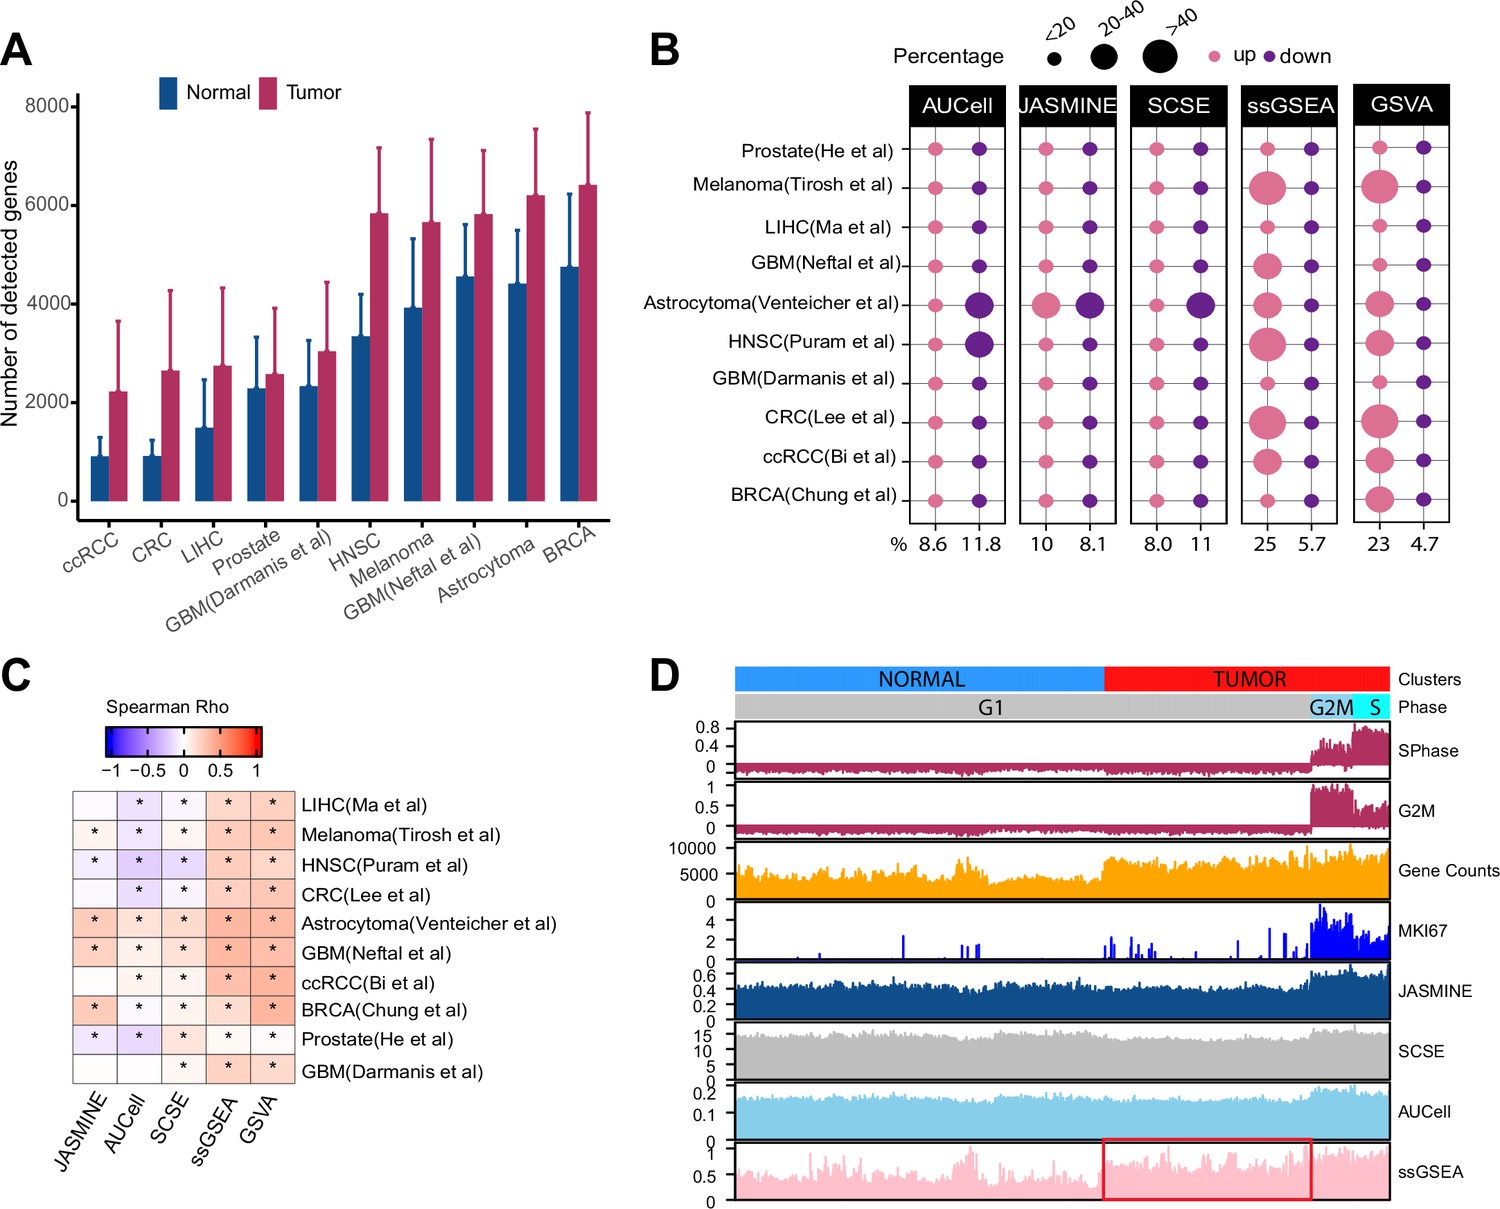
Gene count imbalances affect signature scoring.
(A) The number of detected genes in tumor and normal cell populations in 10 single cell cancer RNAseq datasets. The height of each bar represents average, and whiskers represent standard deviation. In all cases, the difference is statistically significant (student t test, p < 2.2e-16). (B) Percentage of up and down regulated gene signatures in cancer cells relative to normal cells based on Cohen’s d. Dot size corresponds to the percentage of all signatures tested (n = 7503). (C) Spearman correlation coefficients of Cohen’s d with signature sizes across the datasets and methods. Asterisk (*) in each cell indicates p-value < 0.01. Color of the heatmap represents correlation coefficient. (D) Scores of a cell cycle gene set (GO:0007049) calculated using four methods along with MKI67 expression, gene counts, and cell cycle phases predicted by Seurat in Tumor and normal cell populations of HNSC dataset (GSE103322). The red box highlights non-cycling tumor cells that exhibit higher scores than non-cycling normal cells.
-
Figure 1—source data 1
Source data for Figure 1.
- https://cdn.elifesciences.org/articles/71994/elife-71994-fig1-data1-v2.xlsx
Figure 1—figure supplement 1
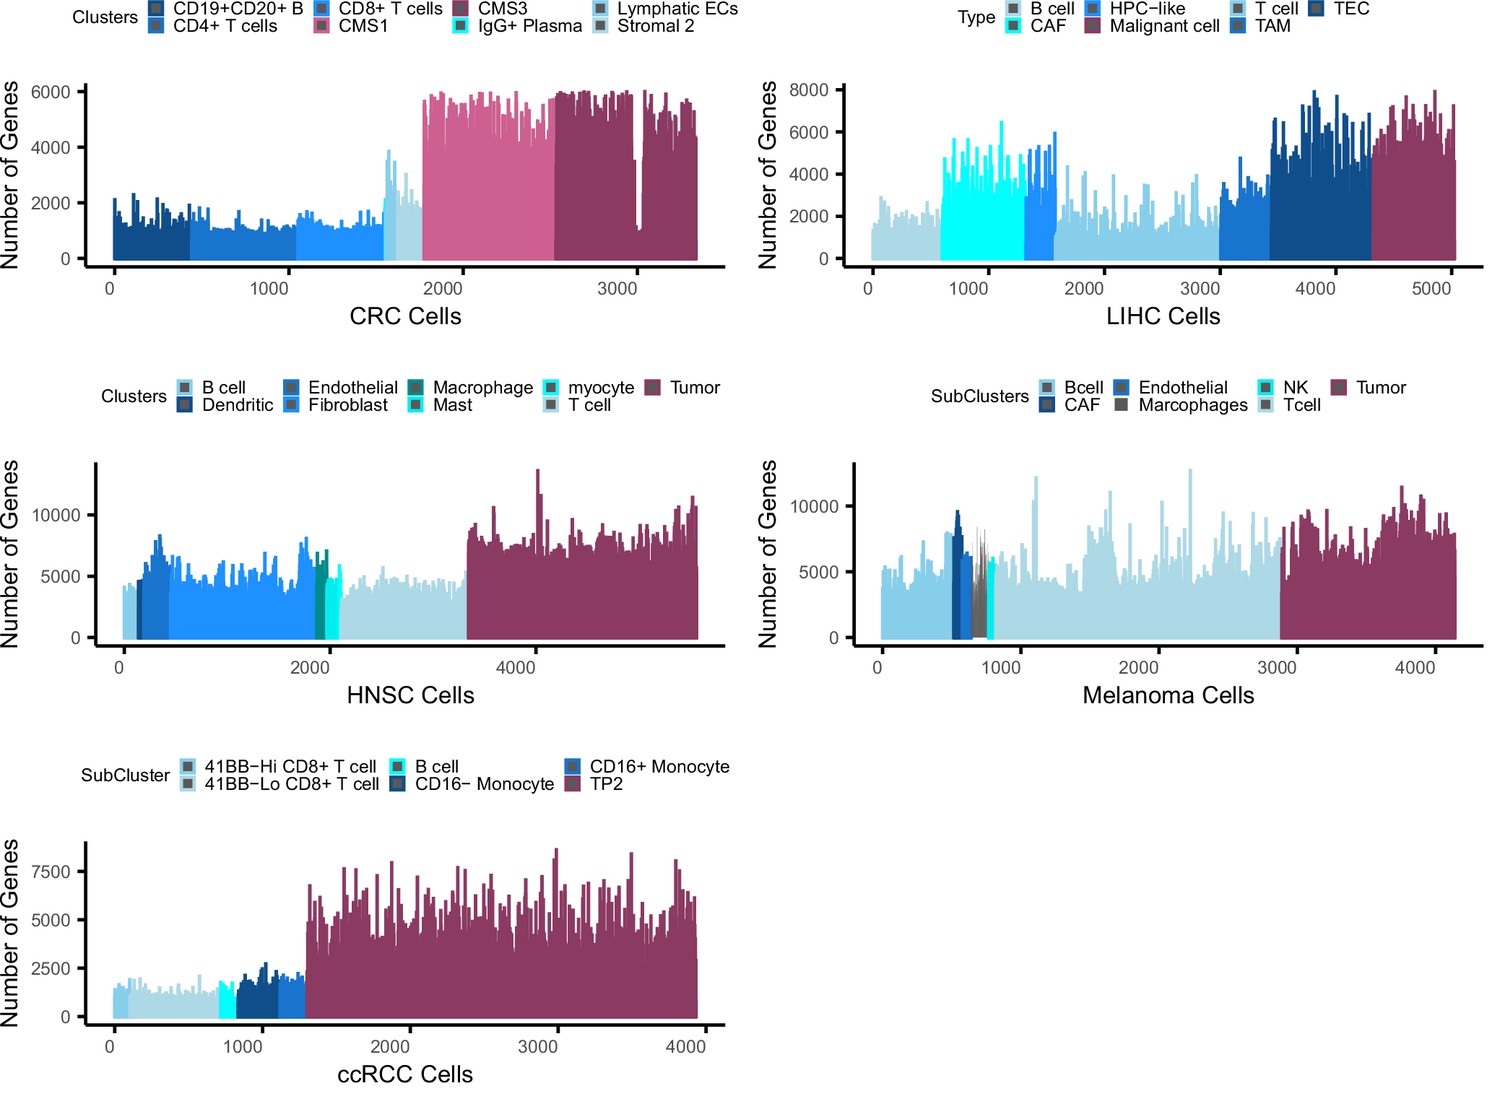
Bias in gene counts.
Number of genes expressed in tumor and normal cell types across five single cell data sets including colorectal cancer (CRC), liver cancer (LIHC), head and neck cancer (HNSC), melanoma, and clear cell renal carcinoma (ccRCC). Maroon colors represent tumor cell populations in each data set while blue represents normal cell populations across the datasets. Note that in the LIHC dataset, CAF, TAM, and TEC are cancer-associated fibroblasts, tumor-associated macrophages, and tumor-related endothelial cells, respectively.
Figure 1—figure supplement 2
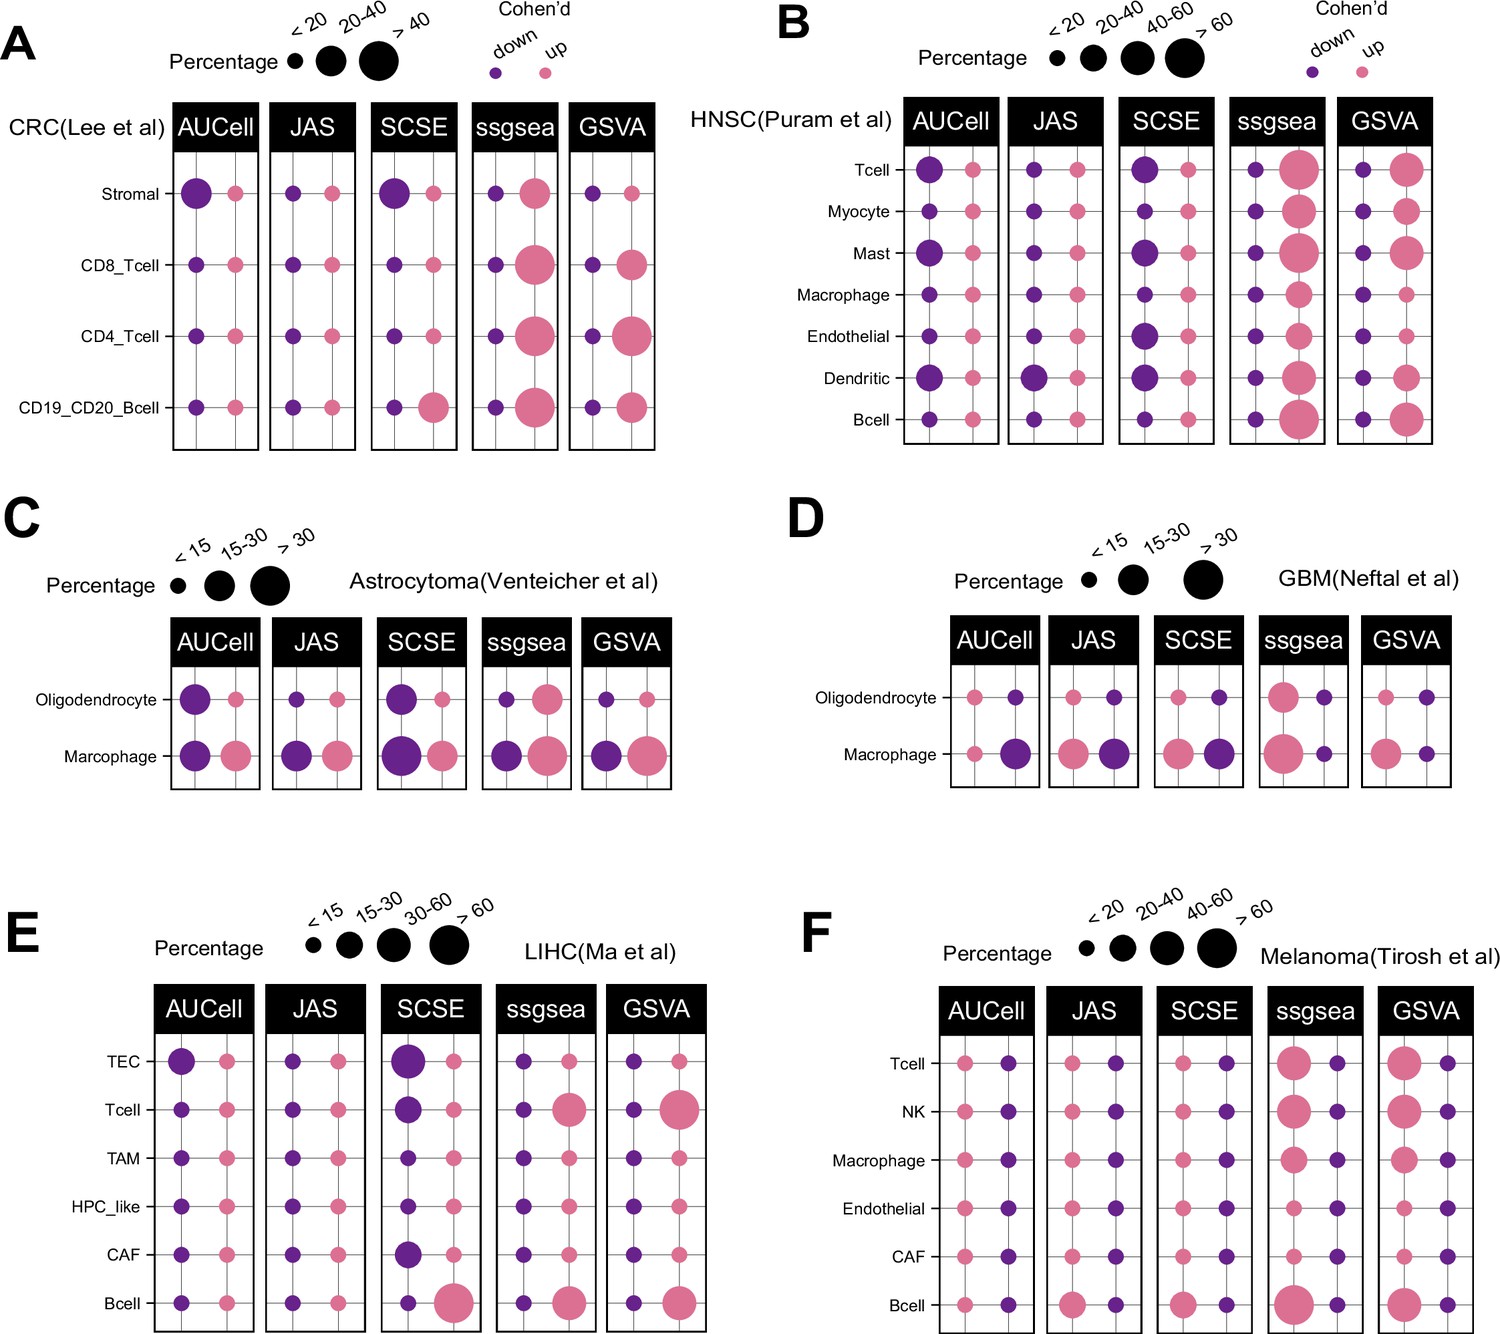
Patterns of up and down regulated signatures.
Comparing tumor and normal cell populations across six additional datasets, including (A) colorectal, (B) head and neck cancer, (C) astrocytoma, (D) IDHwt GBM, (E) liver, and (F) melanoma. The size of each dot represents the percentage of up or down signatures over all signatures tested (n = 7503).
Figure 1—figure supplement 3
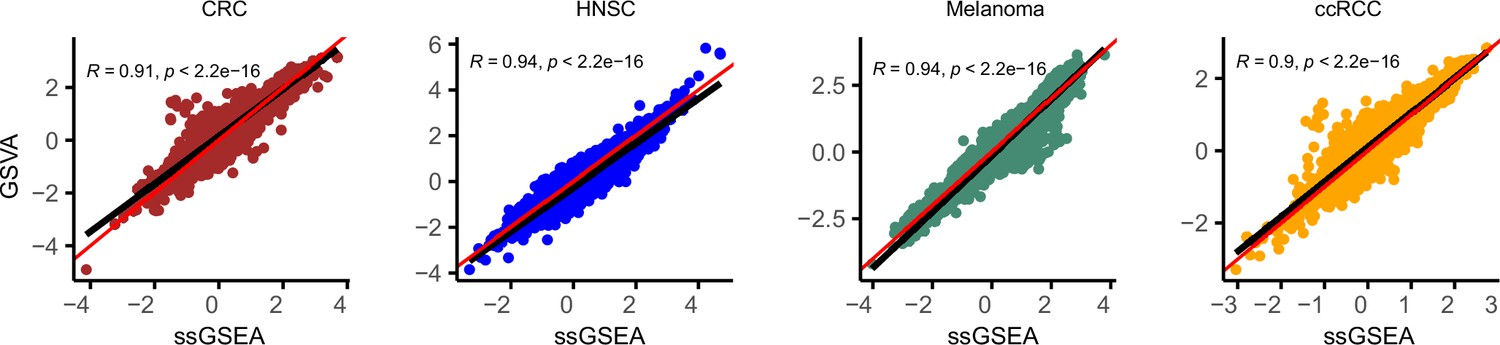
GSVA and ssGSEA comparison.
Comparison of effect size (Cohen’s d) for ssGSEA (x-axis) and GSVA (y-axis) in four datasets: colorectal cancer (CRC) , head and neck cancer, melanoma, and clear cell renal carcinoma. Red line represents X = Y and black line is the regression line. Correlation is calculated using Spearman method.
Figure 2 with 5 supplements
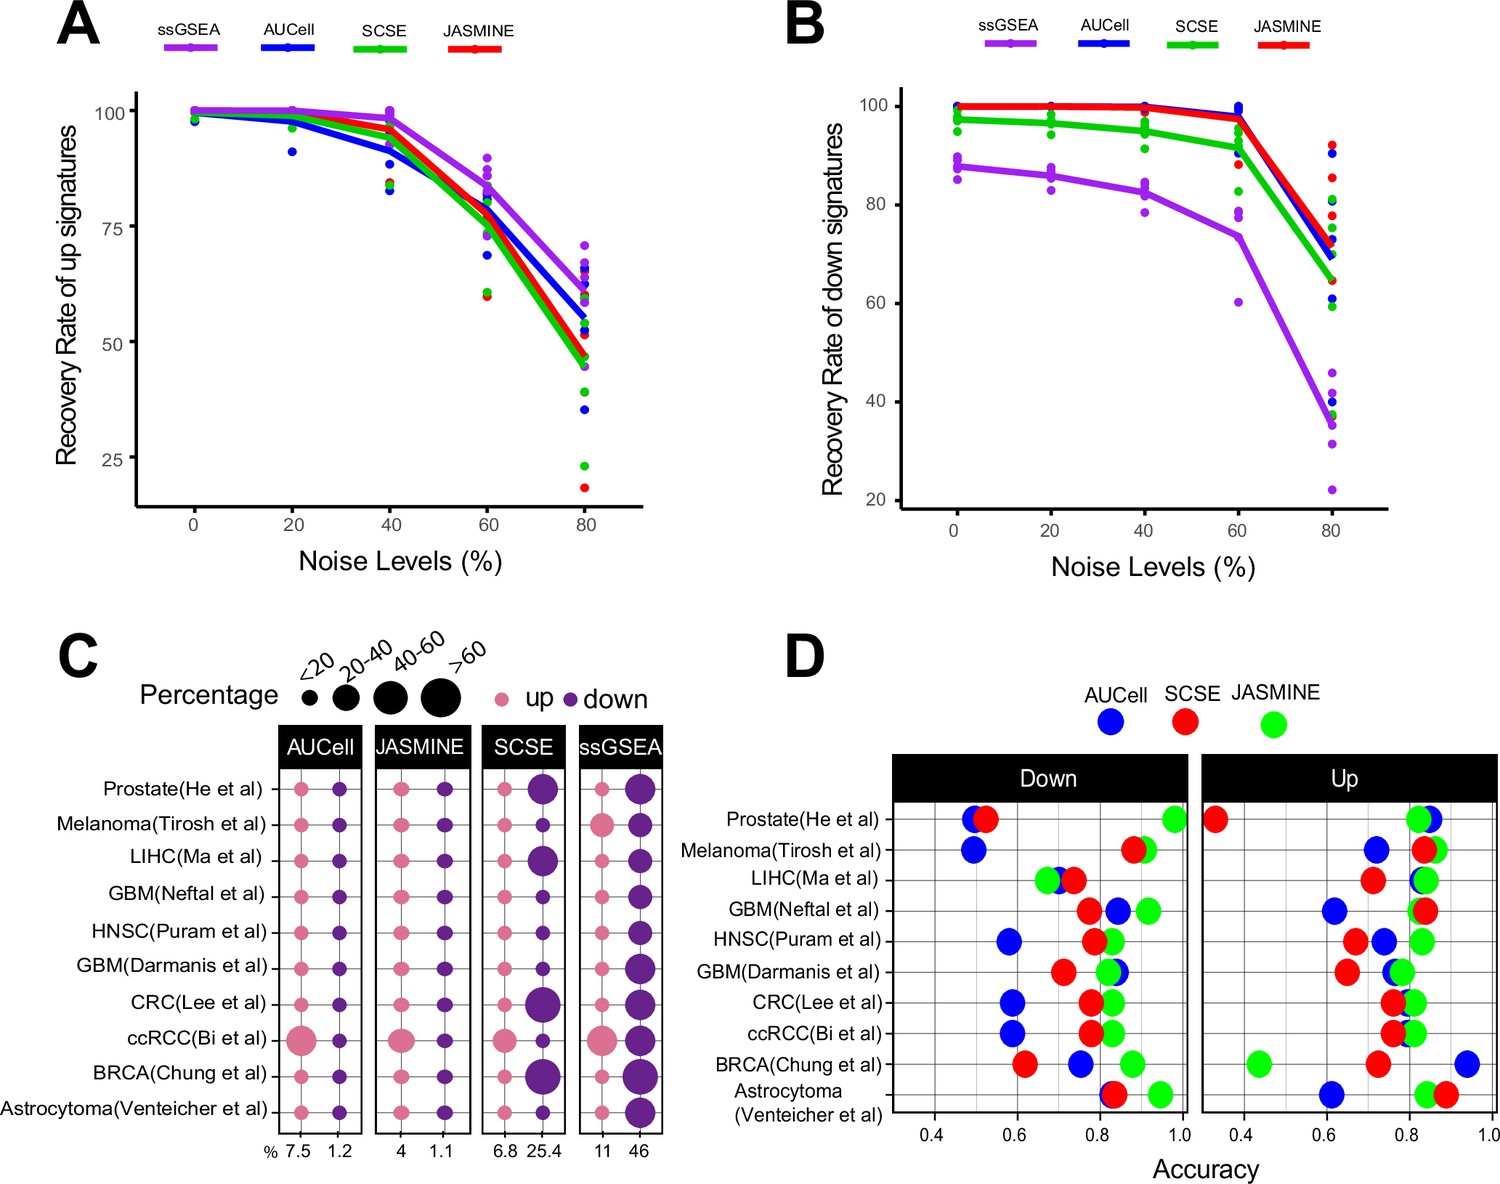
Sensitivity, specificity and accuracy.
(A) Recovery rate for up gene signatures across five noise levels by the four methods. Each dot represents one dataset. At each noise level, average of all datasets is used to represent the performance of each method. (B) Similarly, for down signatures. (C) Percentages of false up and down signatures. The size of the dots corresponds to the percentages of all the signatures tested. Because the contrasting groups are generated by down sampling, no signatures are expected to be identified. The numbers below the heatmap are the average percentage. (D) Accuracy of the three methods, separated into up and down signatures. Accuracy is calculated as the agreement with consensus calls by at least two methods.
-
Figure 2—source data 1
Source data for Figure 2.
- https://cdn.elifesciences.org/articles/71994/elife-71994-fig2-data1-v2.xlsx
Figure 2—figure supplement 1

Benchmarking sensitivity using simulated gene signatures.
We simulated four gene set sizes (50, 100, 150, 200, and 300), each with five levels of noise (0, 20, 40, 60, and 80%). For each size/noise combination, we randomly generated 1000 signatures. The results shown in this figure are percentage of the 1000 random signatures. (A) Detection sensitivity for up gene signatures. Deeper color indicates lower recovery rates (thus more misses). (B) Detection sensitivity for down signatures.
Figure 2—figure supplement 2

Coefficient of Variance.
Average coefficient of variance between the original datasets and the 50% down-sampled datasets. Each dot represents one dataset.
Figure 2—figure supplement 3
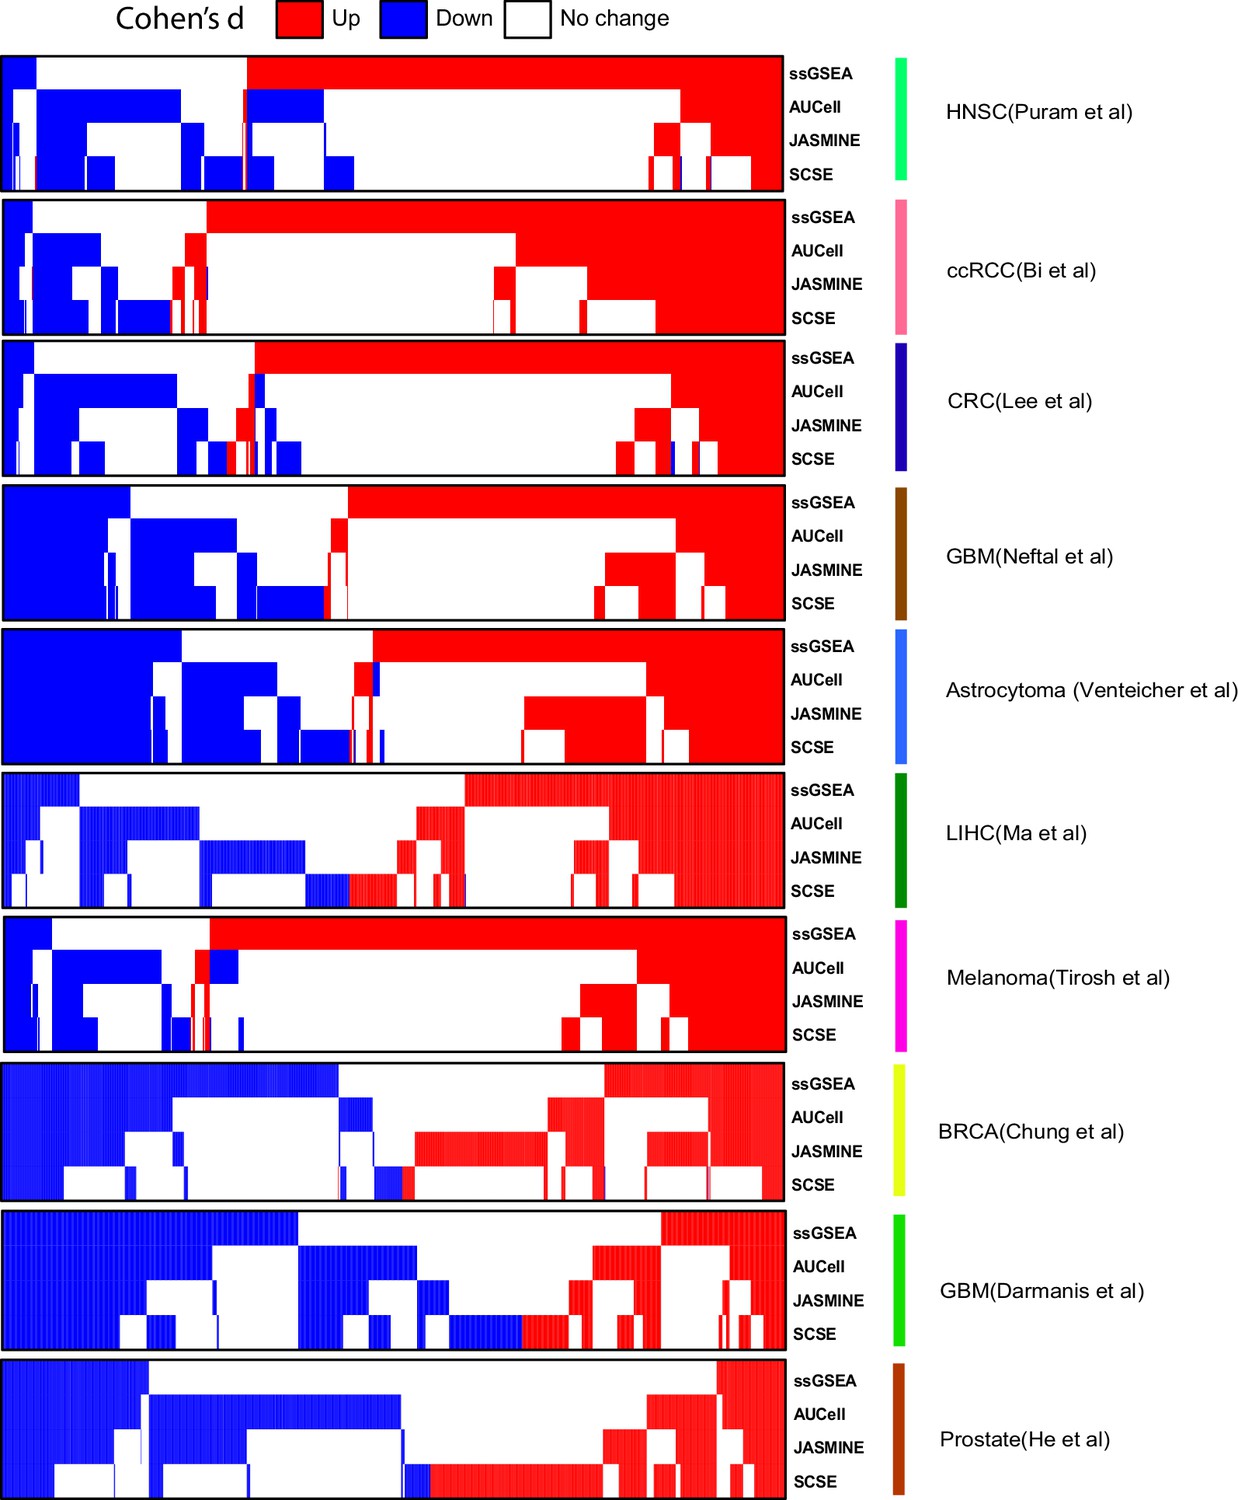
Comparison of calling results from the four methods across the seven datasets.
In heatmap, each column represents one signature. Blue, down signature; red, up signature.
Figure 2—figure supplement 4
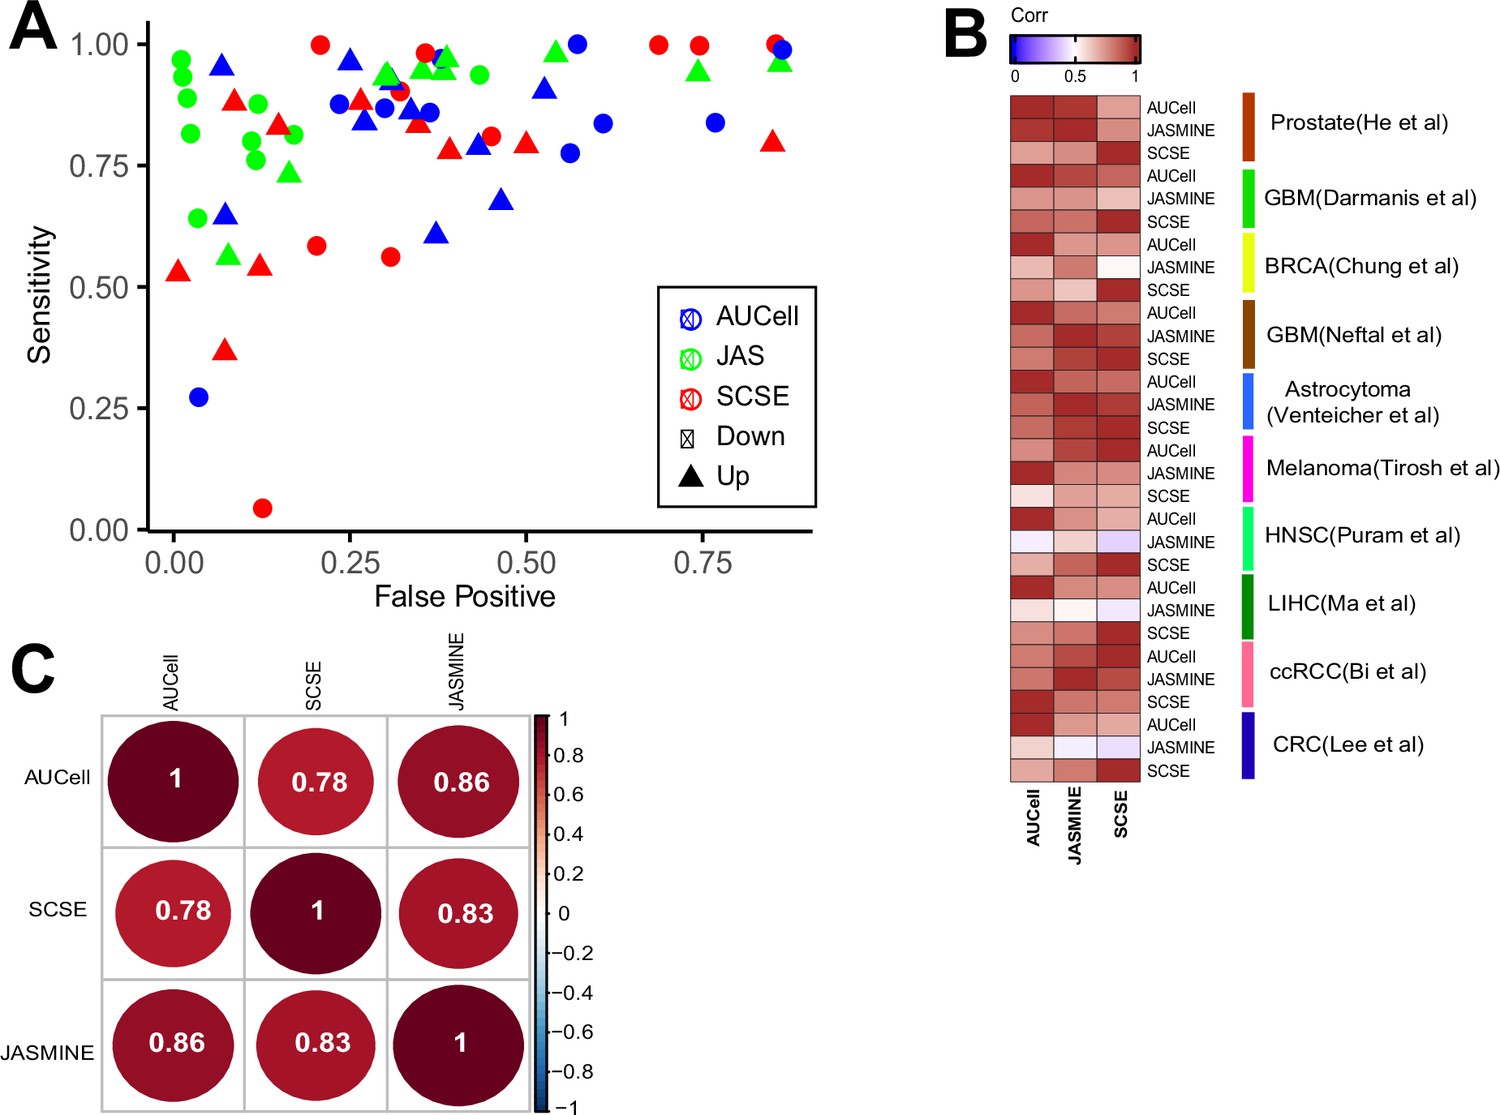
Consistency with consensus and pairwise comparison.
(A) Sensitivity and false positive benchmarked against the consensus calls (signatures called by at least two methods). (B) Spearman correlation of Cohen’s d broken down to each dataset. (C) Consistency between three methods, numbers are Spearman correlation coefficients.
Figure 2—figure supplement 5
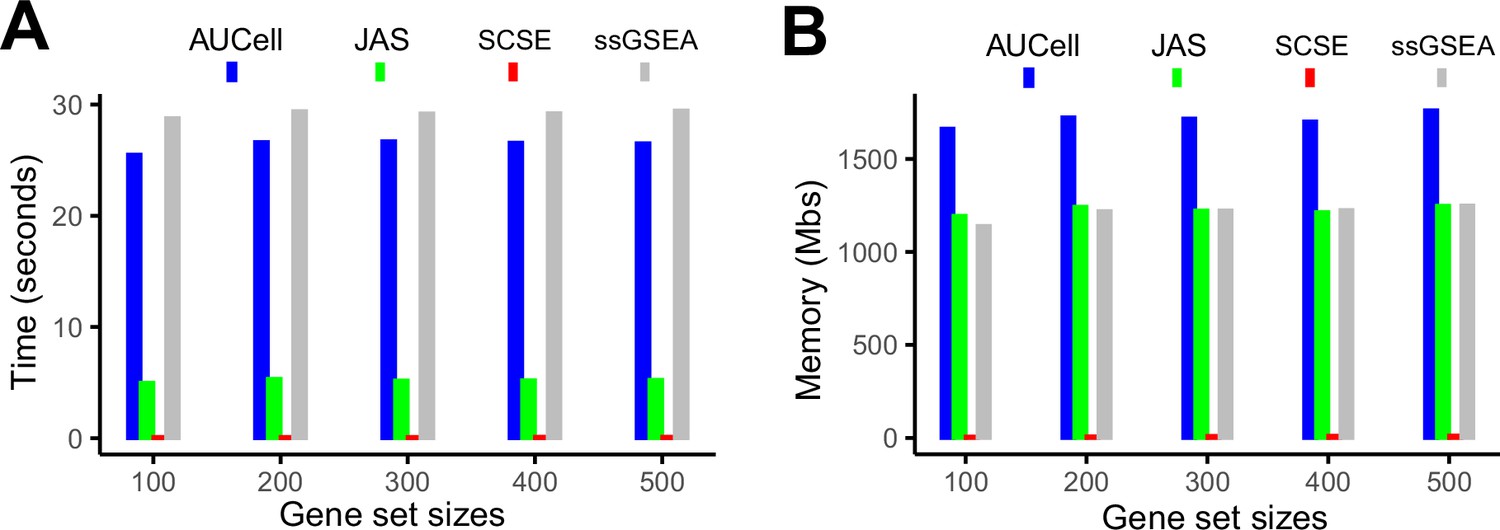
Evaluation of computing cost.
(A) Average time consumption for completing 50 gene signatures using a 2.2 GHz, 32 GB memory CPU. (B) Memory cost for completing 50 gene signatures using a 2.2 GHz, 32 GB memory CPU.
Figure 3 with 2 supplements
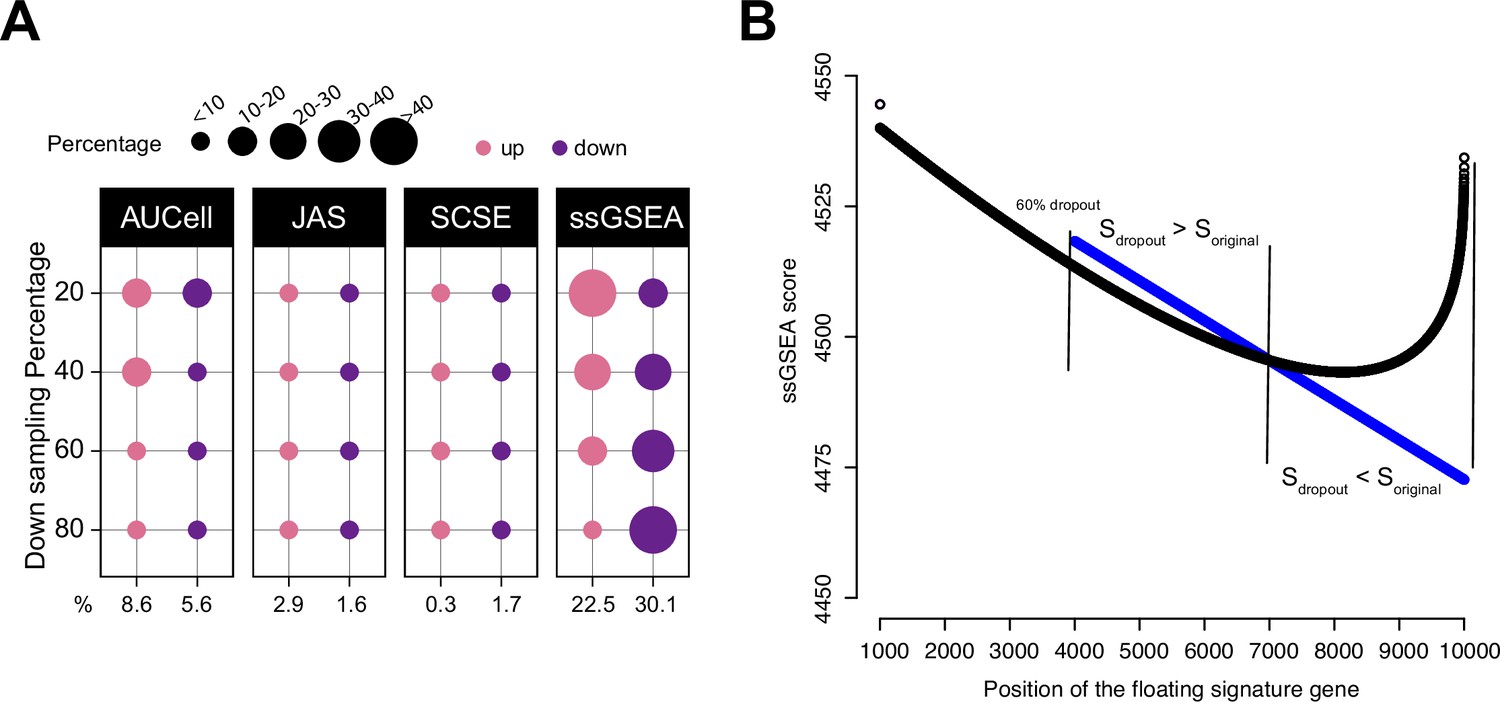
Impact of dropouts on ssGSEA signature scoring.
(A) Percentages of up and down regulated gene signatures in original cells relative to down sampled cells for four levels of down sampling (20, 40, 60, and 80%) based on Cohen’s d. Dot size corresponds to the percentage of all signatures tested (n = 7503) in Head and Neck (Puram et al., 2017). (B) Effect of dropouts on ssGSEA scoring using a dummy expression matrix. The black line denotes the cell without any dropouts, and the blue line denotes the same cell with a 60% dropout rate. Note that for the gene signature, the first 99 genes are fixed. The x axis reflects the position of the last signature gene. When the gene is at rank <4000. The two cells give identical scores. However, after entering dropout zone, the scores start to deviate.
-
Figure 3—source data 1
Source data for Figure 3.
- https://cdn.elifesciences.org/articles/71994/elife-71994-fig3-data1-v2.xlsx
Figure 3—figure supplement 1
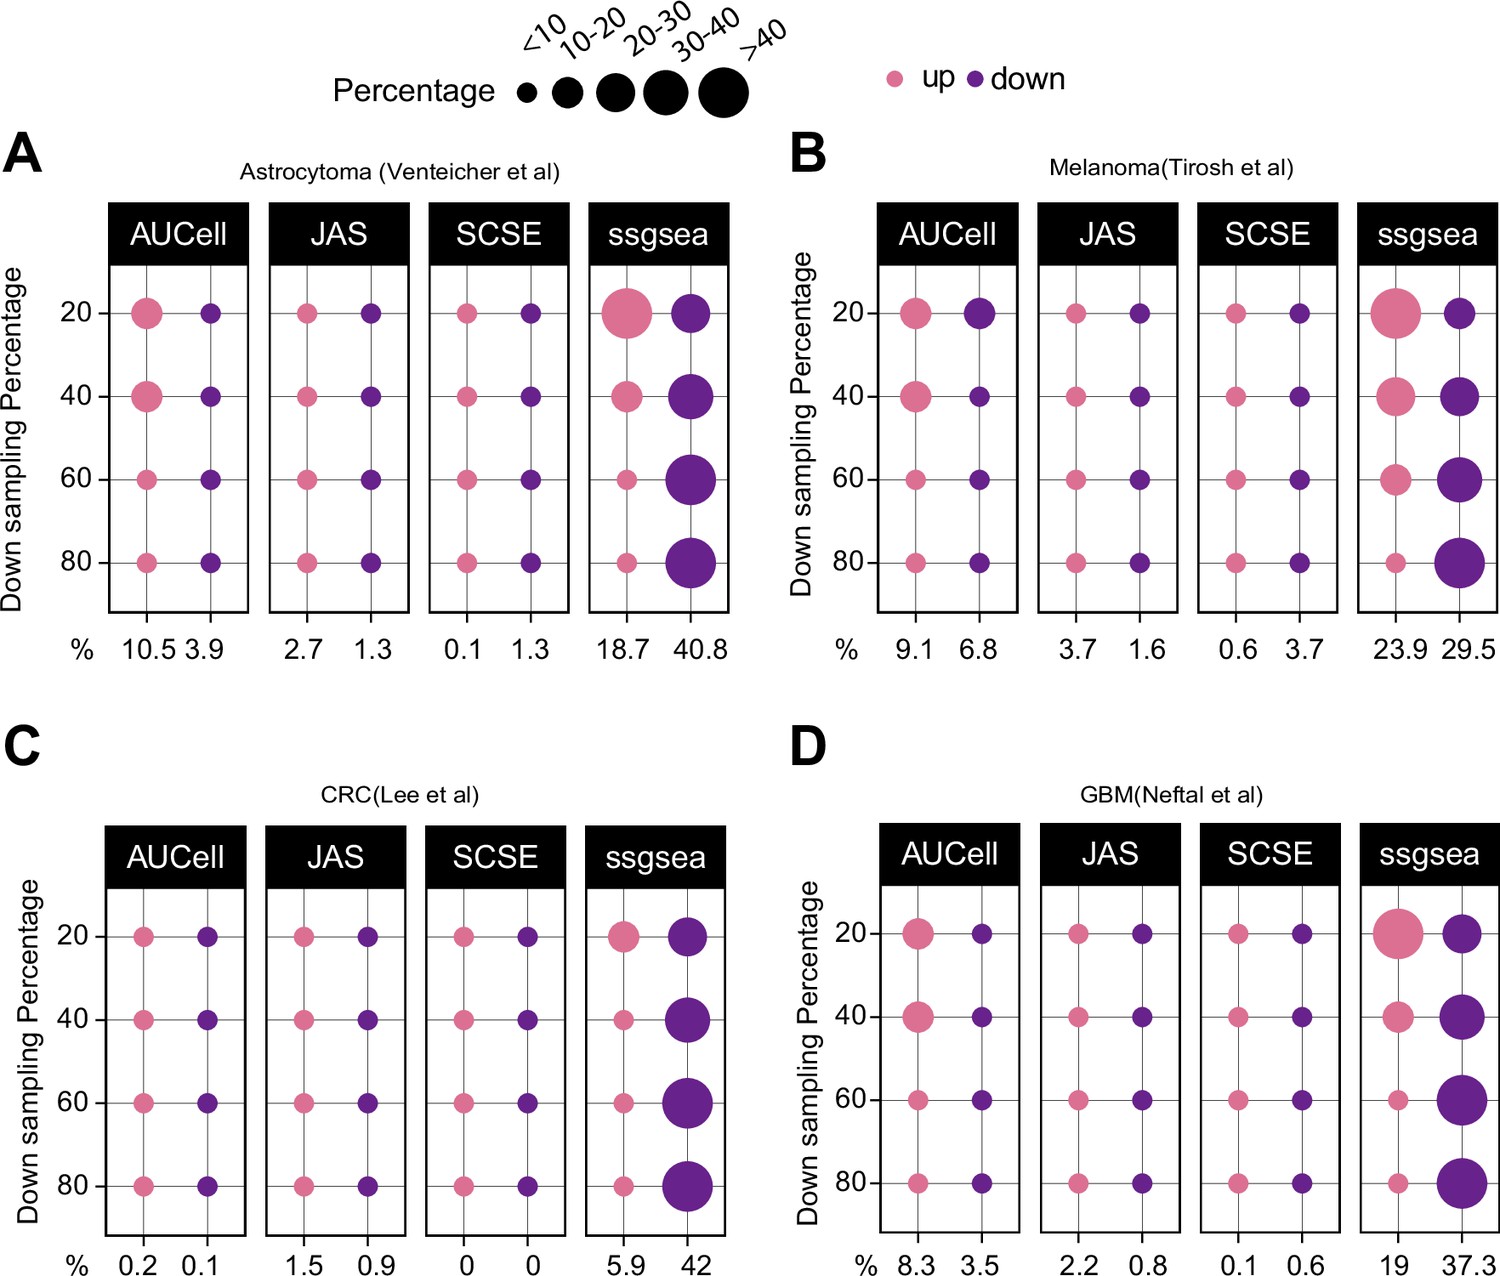
Down sampling levels affect signature scoring.
Percentage of up and down regulated gene signatures in original cells relative to down sampled cells for four levels of down sampling (20, 40, 60, and 80%) based on Cohen’s d. Dot size corresponds to the percentage of all signatures tested (n = 7503) (A) in astrocytoma, (B) melanoma, (C) colorectal cancer, and (D) in glioblastoma data.
Figure 3—figure supplement 2
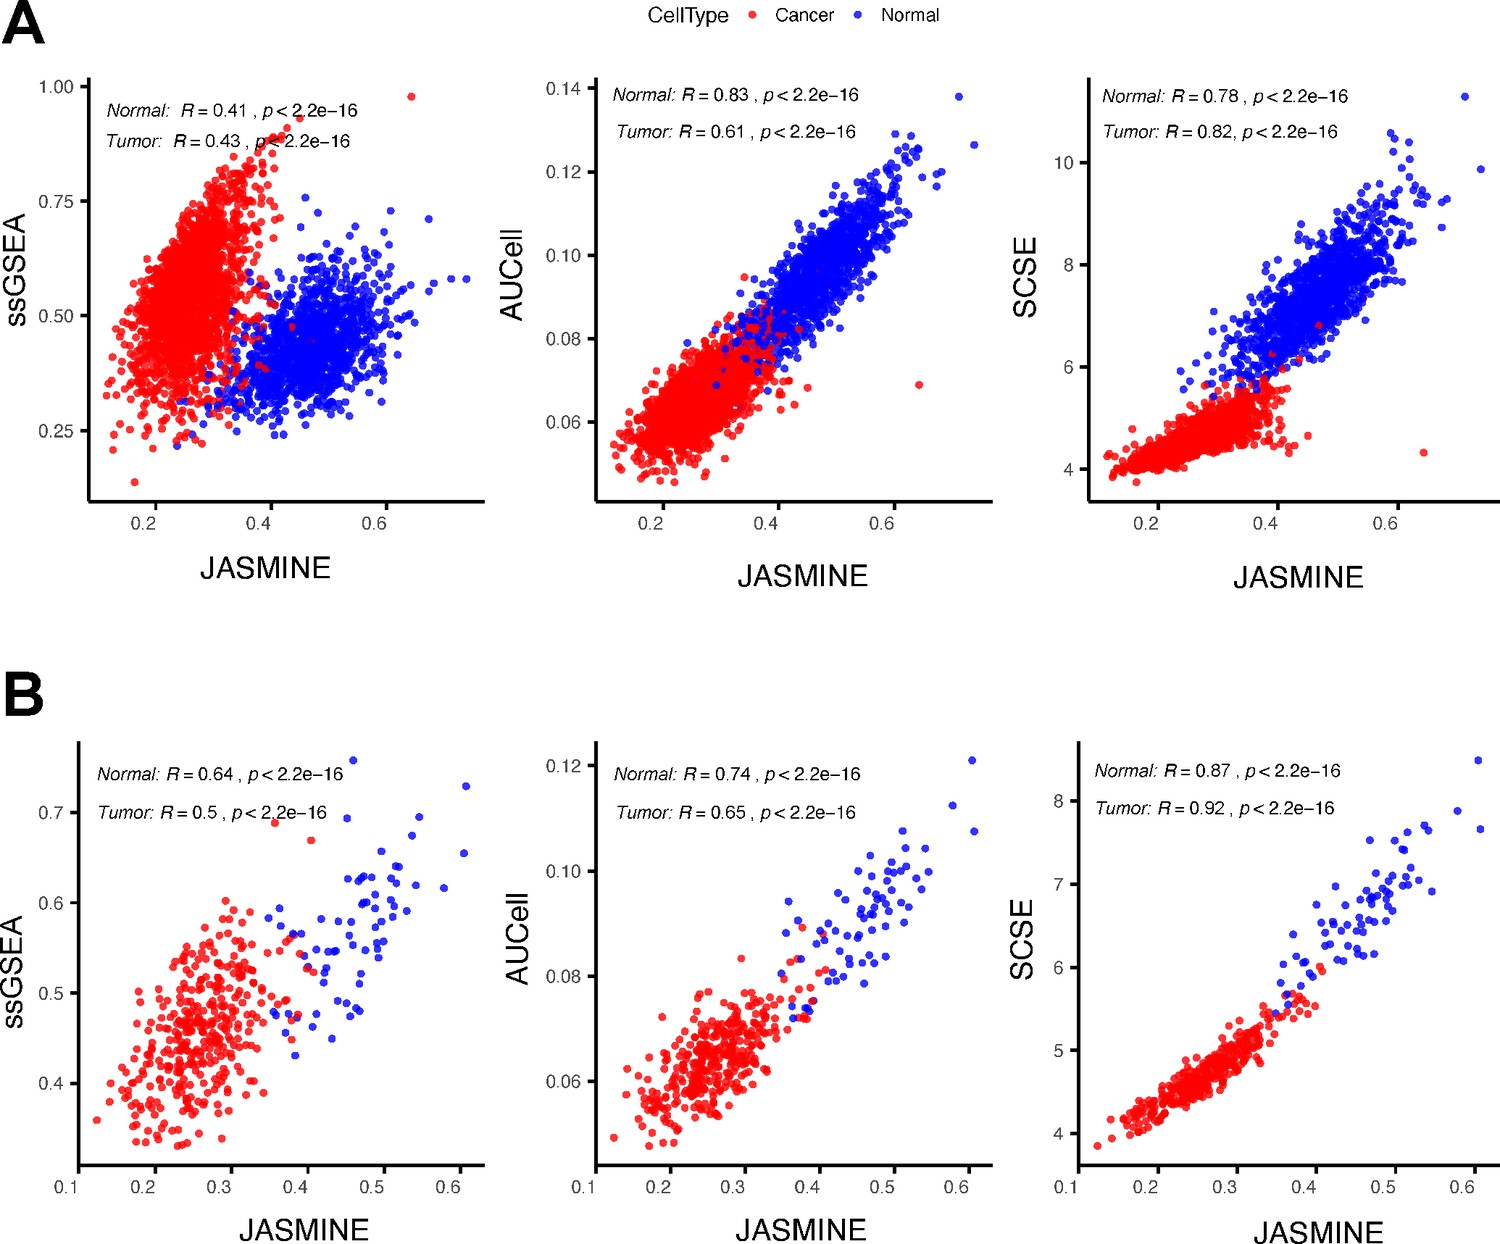
An example showing ssGSEA score changes.
(A) Comparing scores of a gene signature (‘ZNF597_TARGET_GENES’) between JASMINE and other tools in all tumor and normal cells using the head and neck data. (B) The same comparison but limited to cells with the number of expressed genes between 4000 and 5000.
Tables
Author response table 1
A breakdown of signature genes in a single cell expression profile.
The four numbers are used in signature enrichment calculation by JASMINE.
| Expressed | Not-expressed | |
|---|---|---|
| Signature gene | a | b |
| Non-signature gene | c | d |
Author response table 2
Counts and frequencies of signatures with b=0 in 0, 1, 2 and ≥3 cells across datasets.
The number of cells analyzed in each dataset is given in the parenthesis at the column name.
| cell # (b=0) | Astrocytoma(n=6176) | BRCA(n=515) | IDHwtGBM(n=5742) | HNSC(n=5560) | GBM(n=3589) |
|---|---|---|---|---|---|
| 0 | 7425 (98.96) | 7438 (99.13) | 7395 (98.56) | 7194 (95.88) | 7326 (99.84) |
| 1 | 33 (0.44) | 25 (0.33) | 33 (0.44) | 161 (2.15) | 7 (0.1) |
| 2 | 18 (0.24) | 10 (0.13) | 17 (0.23) | 46 (0.61) | 2 (0.03) |
| ≥3 | 27 (0.36) | 30 (0.4) | 58 (0.6) | 102 (1.36) | 3 (0.04) |
| cell # (b=0) | LIHC(n=5023) | CRC(n=3336) | ccRCC(n=3933) | Prostate(n=2170) | Melanoma(n=4645) |
| 0 | 7482 (99.72) | 7496 (99.91) | 7489 (99.81) | 7493 (99.87) | 7253 (96.67) |
| 1 | 8 (0.11) | 2 (0.03) | 7 (0.09) | 7 (0.09) | 79 (1.05) |
| 2 | 7 (0.09) | 3 (0.04) | 1 (0.01) | 2 (0.03) | 43 (0.57) |
| ≥3 | 6 (0.08) | 2 (0.03) | 6 (0.08) | 1 (0.01) | 128 (1.71) |
Additional files
-
Supplementary file 1
Single cell RNAseq datasets.
The table lists all the ten datasets used in this study. Cell annotations were downloaded from the original publications.
- https://cdn.elifesciences.org/articles/71994/elife-71994-supp1-v2.xlsx
-
Transparent reporting form
- https://cdn.elifesciences.org/articles/71994/elife-71994-transrepform1-v2.docx
Download links
A two-part list of links to download the article, or parts of the article, in various formats.
Downloads (link to download the article as PDF)
Open citations (links to open the citations from this article in various online reference manager services)
Cite this article (links to download the citations from this article in formats compatible with various reference manager tools)
Signature-scoring methods developed for bulk samples are not adequate for cancer single-cell RNA sequencing data
eLife 11:e71994.
https://doi.org/10.7554/eLife.71994


