Local chromatin fiber folding represses transcription and loop extrusion in quiescent cells
- Basic Sciences Division, Fred Hutchinson Cancer Research Center, United States
- Department of Genome Sciences, University of Washington, United States
- Department of Chemistry, New York University, United States
- Institute of Cellular and Organismic Biology, Academia Sinica, Taiwan
- Courant Institute of Mathematical Sciences, New York University, United States
- New York University-East China Normal University Center for Computational Chemistry at New York University Shanghai, China
- Paul G. Allen School of Computer Science and Engineering, University of Washington, United States
Figures
Figure 1 with 3 supplements
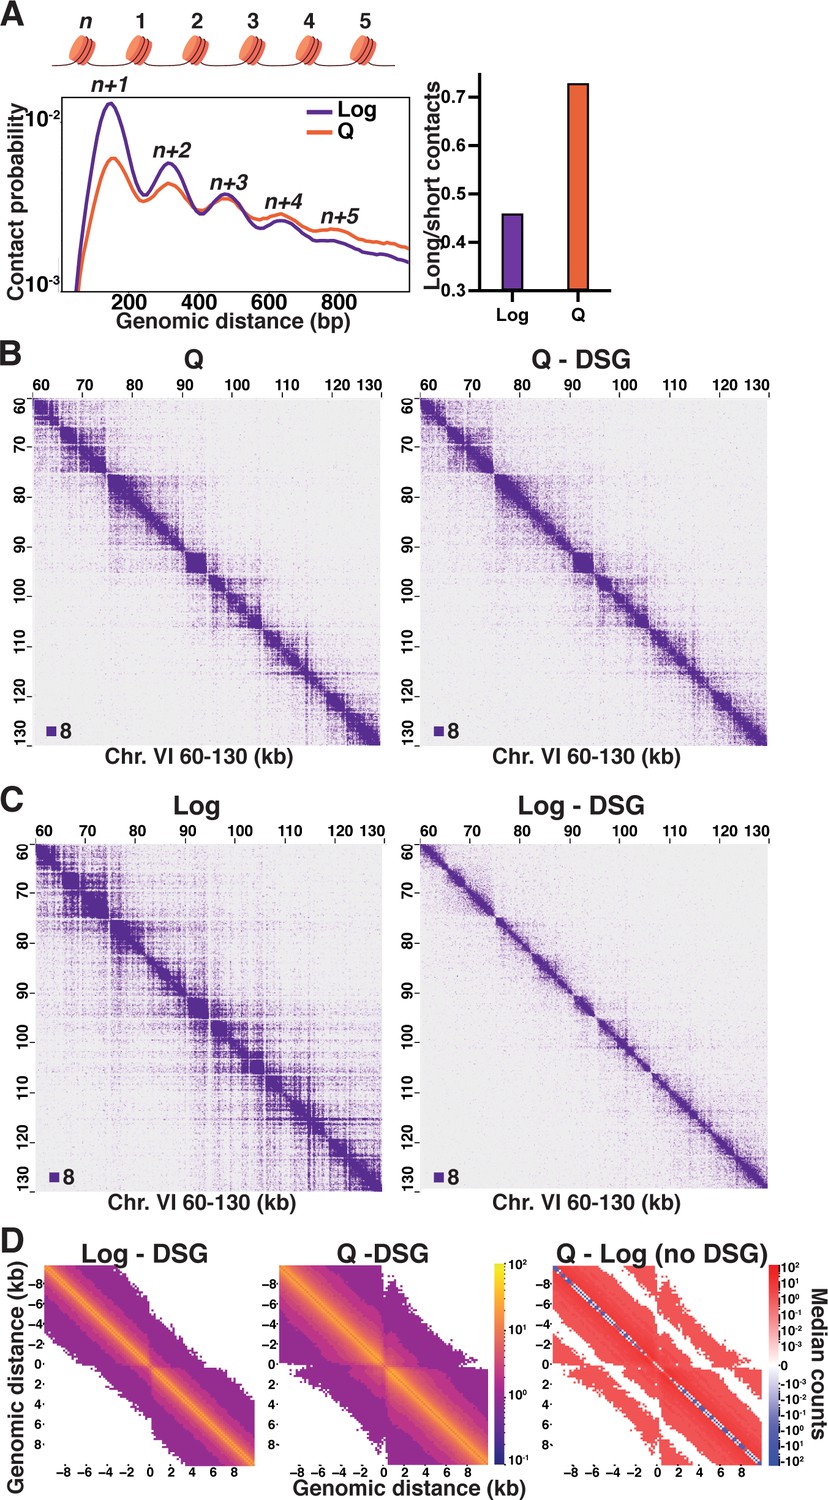
Local inter-nucleosome interactions are distinct in quiescent cells.
(A) Left, contact probability map of nucleosome (n) interactions from exponentially growing (Log) and quiescent (Q) Micro-C XL data (3). Contacts between ligated di-nucleosomes in the ‘same’ orientation (including ‘in-out’ and ‘out-in’ pairs) are shown (4). Data are normalized so that the total probability of intranucleosomal contacts on the same chromosome is equal to 1. Right, ratio of contacts between 500 and 1000 bp to contacts between 50 and 500 bp. (B) Representative Q and (C) Log Micro-C XL with or without DSG at 200 bp resolution. For this and all subsequent Micro-C analyses, all in-facing read pairs were omitted to avoid contamination from undigested di-nucleosomes. (D) Micro-C XL metaplots of median interactions ±10 kb around sites of condensin-bound L-CID boundaries at 200 bp resolution. The scale shows the difference between median counts so that contacts in red are increased in Q and contacts in blue are increased in Log. Rightmost plot shows subtraction of the leftmost plot from the center plot.
Figure 1—figure supplement 1
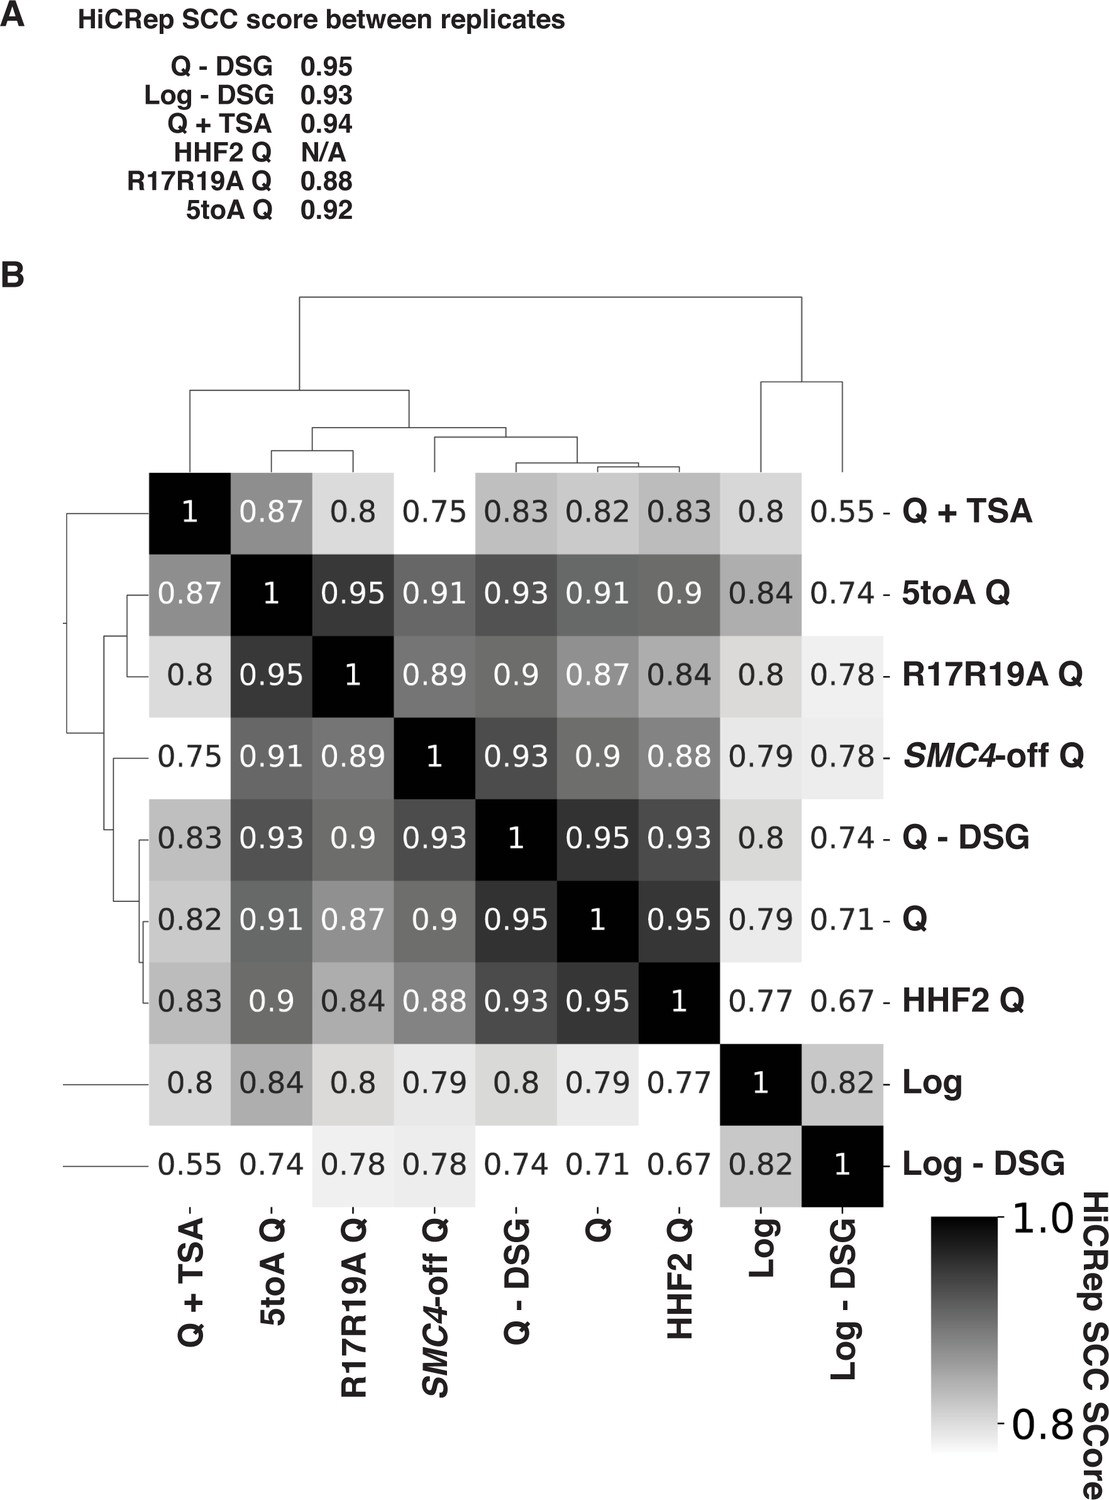
HiCRep scores of Micro-C data.
(A) Stratum-adjusted correlation coefficients (SCCs) calculated by HiCRep of Micro-C XL data from two biological replicates of each of the indicated conditions. HHF2 was completed in only one replicate to determine similarity to true WT. (B) SCCs calculated and hierarchically sorted between conditions. Micro-C XL data of biological replicates were merged prior to analysis. Log, quiescent (Q), and SMC4-off cell Micro-C XL data were previously published in Swygert et al., 2019. Log and Q represent data from true WT strains. WT, wild-type.
Figure 1—figure supplement 2
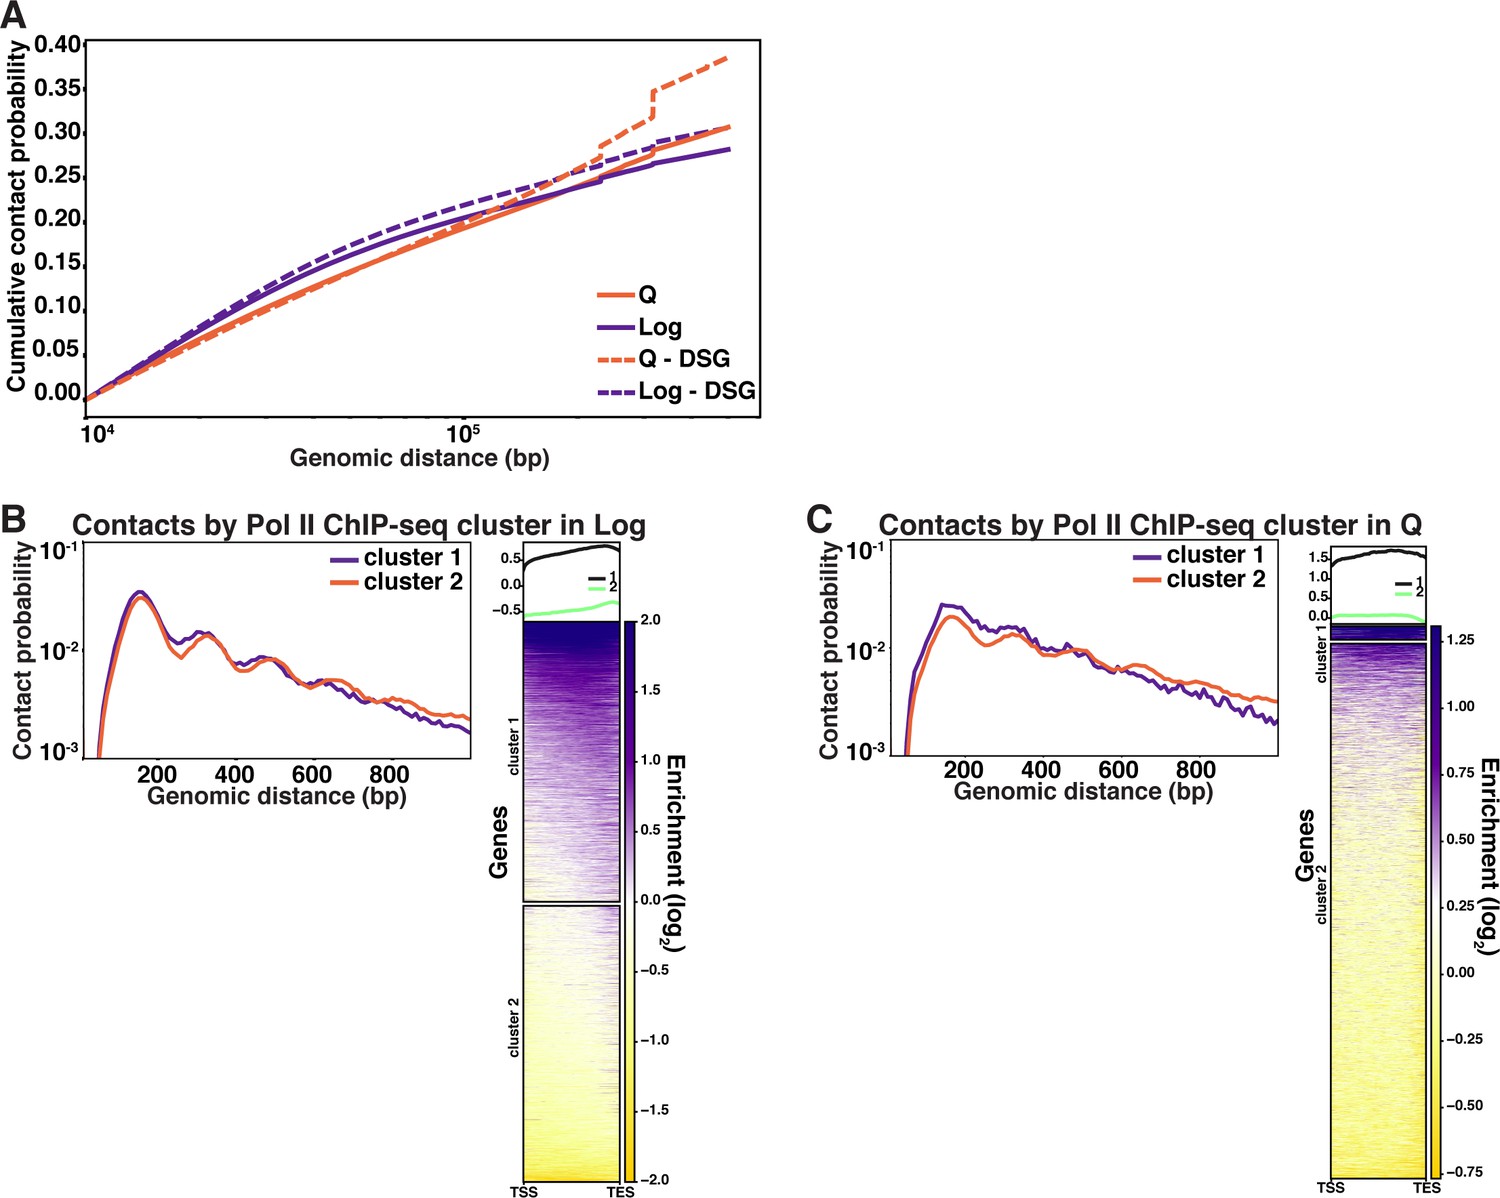
Long-distance and gene-specific contacts in Log and Q.
(A) Cumulative contact probability of contacts between distances of 10 kb and 1000 kb. (A, B) Left, contacts separated into clusters based on RNA Polymerase II (Pol II) occupancy in Log (A) and Q (B). Right, ChIP-seq heatmap showing hierarchical clustering of annotated Pol II transcripts based on Pol II occupancy.
Figure 1—figure supplement 3
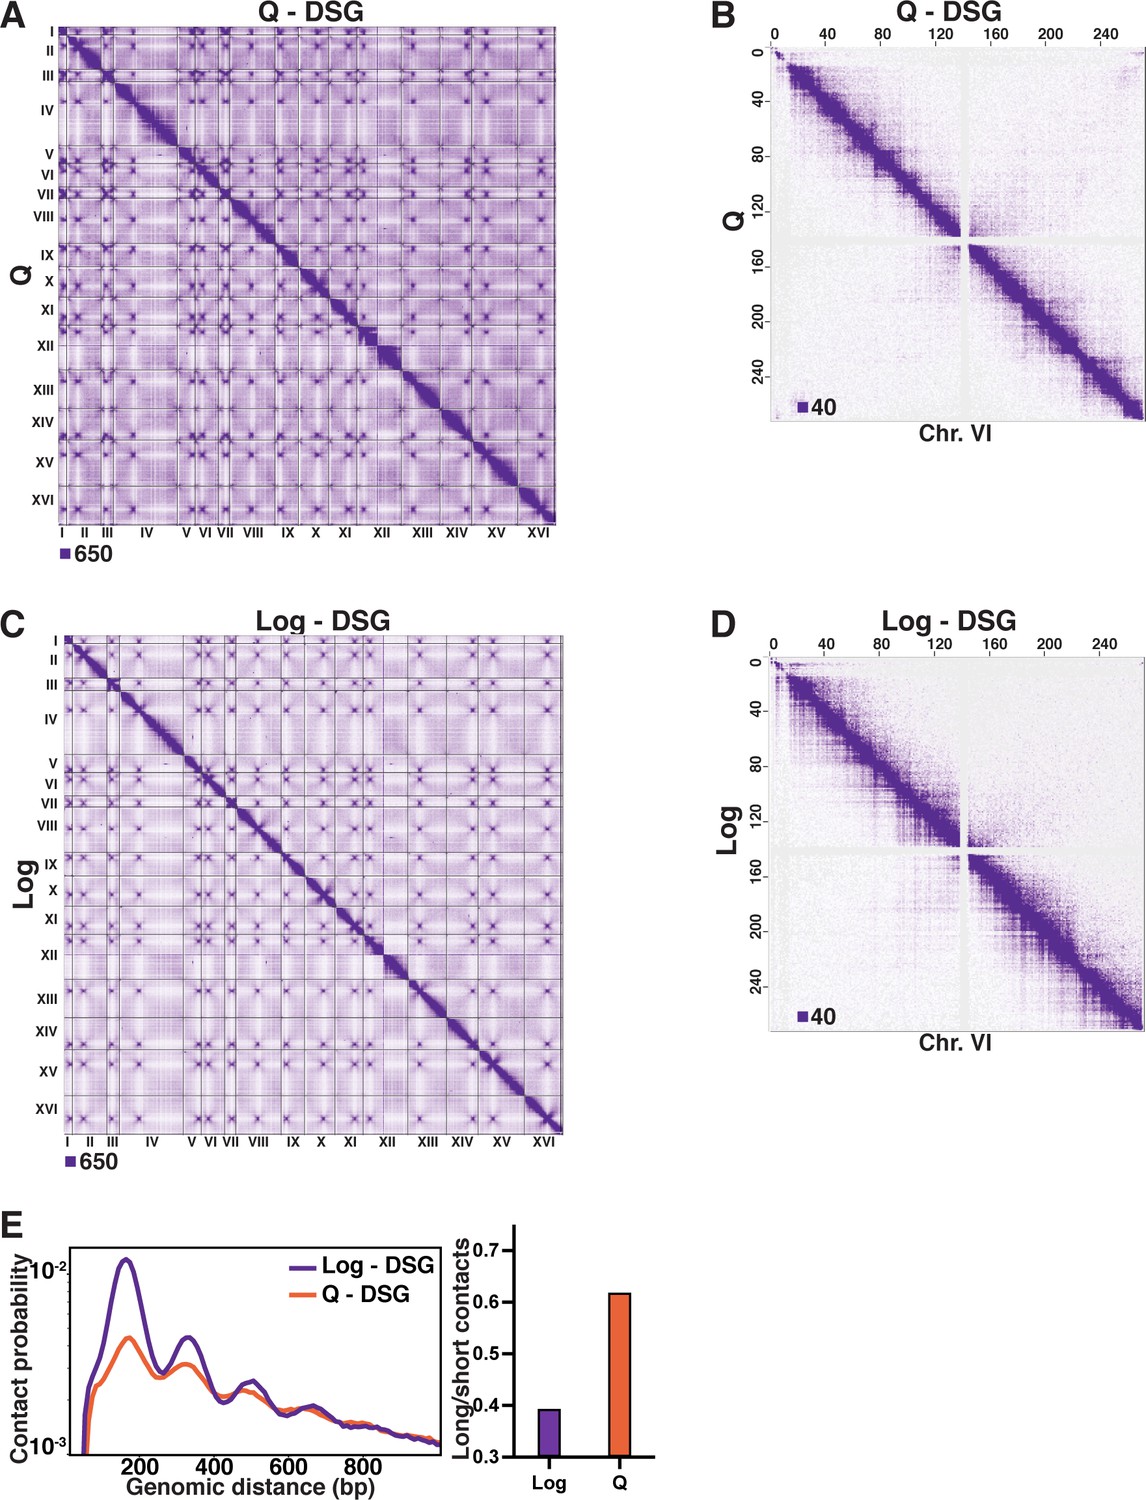
Omitting DSG from the Micro-C XL protocol diminishes contacts in log cells.
(A) Genome-wide Micro-C XL data in Q with and without DSG. (B) Micro-C XL data at 1 kb resolution. (C) Genome-wide Micro-C XL data in Log with and without DSG. (D) Micro-C XL data at 1 kb resolution. (E) Left, contact probability map of Micro-C XL short crosslinker data in Log and Q. Data are normalized so that the total probability of intranucleosomal contacts on the same chromosome is equal to 1. Right, ratio of contacts between 500 and 1000 bp to contacts between 50 and 500 bp.
Figure 2 with 3 supplements
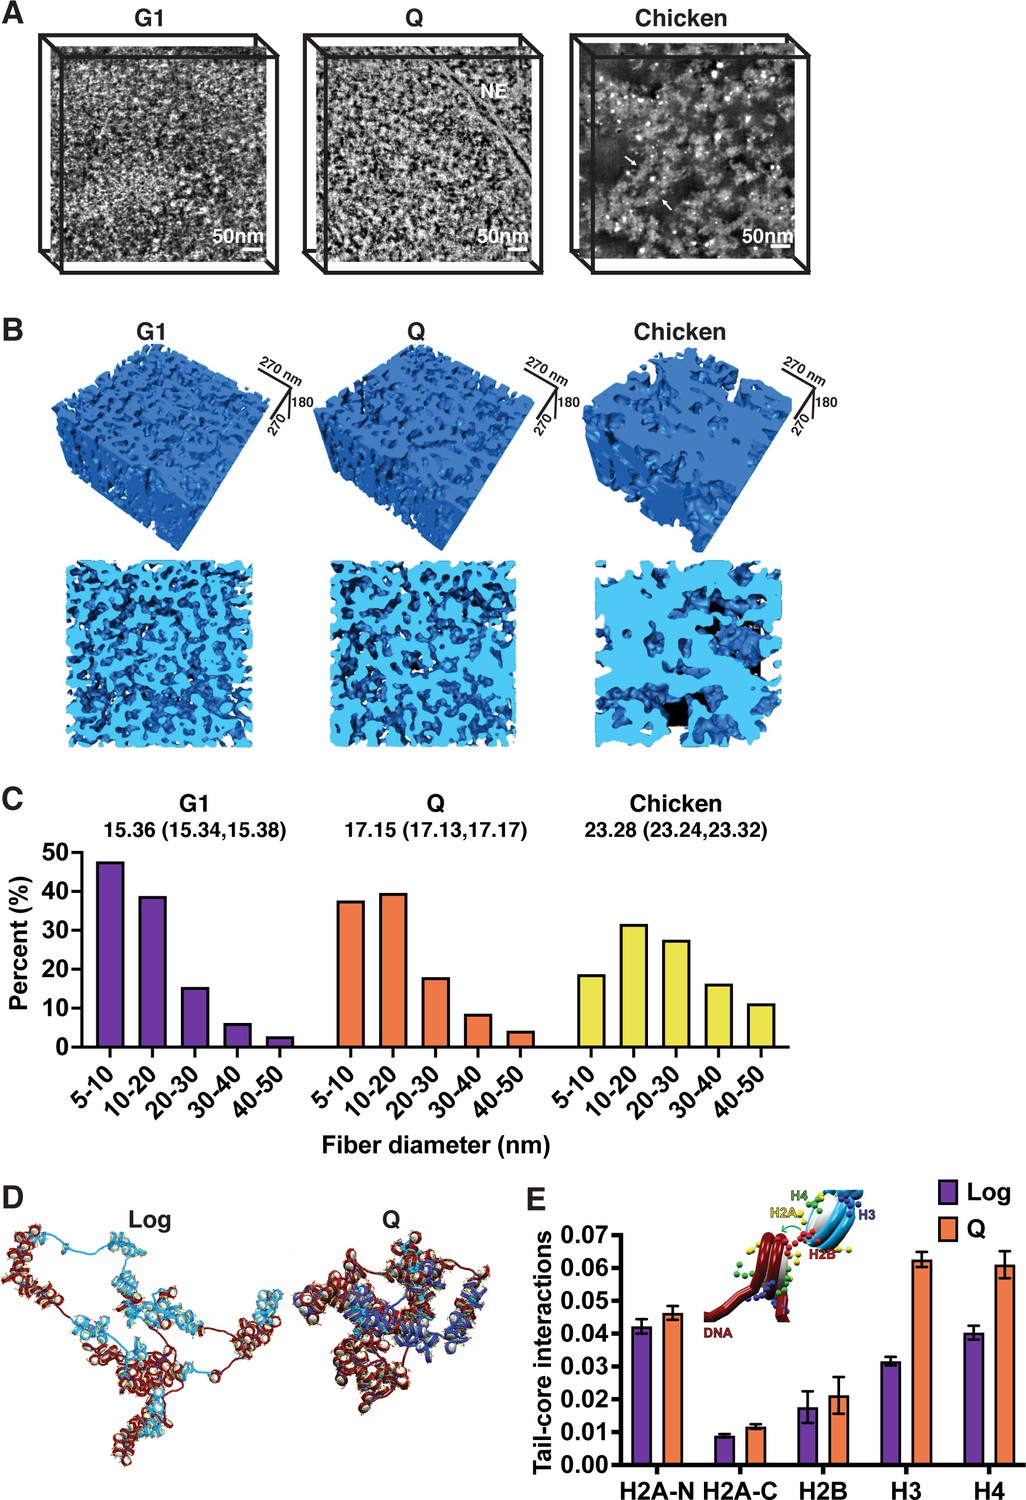
Local chromatin fiber compaction increases in quiescent cells.
(A) HAADF-STEM images of uranyl acetate and lead citrate stained G1-arrested, Q cell, and magnesium-treated chicken erythrocyte nuclei slices. Chromatin fibers appear as white. NE is nuclear envelope. Arrows point to 30 nm fibers. Scale bar represents 50 nm. (B) Three-dimensional tomographic reconstructions of yeast and magnesium-treated chicken erythrocyte nuclei. (C) Histograms of fiber diameter counts calculated using the surface thickness function in Amira software. Numbers shown are mean diameter and 95% confidence interval of the mean. For G1, n=1,028,741. For Q, n=952,372. For chicken erythrocytes, n=316,608. (D) Representative equilibrated configurations of Log and Q chromatin fiber models of Chromosome I, 130–170 kb. Genes are shown in blue and intergenic regions are shown in red. Linker histone is shown in turquoise, and histone tails are shown in blue (H3), green (H4), yellow (H2A N- and C-terminal), and red (H2B). (E) Normalized contact counts between histone tails and nucleosome cores of separate nucleosomes across 50 trajectories. Here, the normalization of total contacts is determined so that all contacts for each histone tail with other chromatin elements (e.g., DNA beads, nucleosome cores, or other tails) sum up to unity. Refer to the method section ‘Tail interaction’ for details. Error bars show standard deviation. Inset shows example tail-core contact. ANOVA analysis p-values between log and Q are as follows: H2A-N 6.8e–16, H2A-C 7.9e–43, H2B 0.0009, H3 1.1e–92, and H4 5.6e–53. HAADF-STEM, high-angle annular dark-field scanning transmission electron microscopy.
-
Figure 2—source data 1
Tail-core contact counts.
- https://cdn.elifesciences.org/articles/72062/elife-72062-fig2-data1-v2.xlsx
Figure 2—figure supplement 1
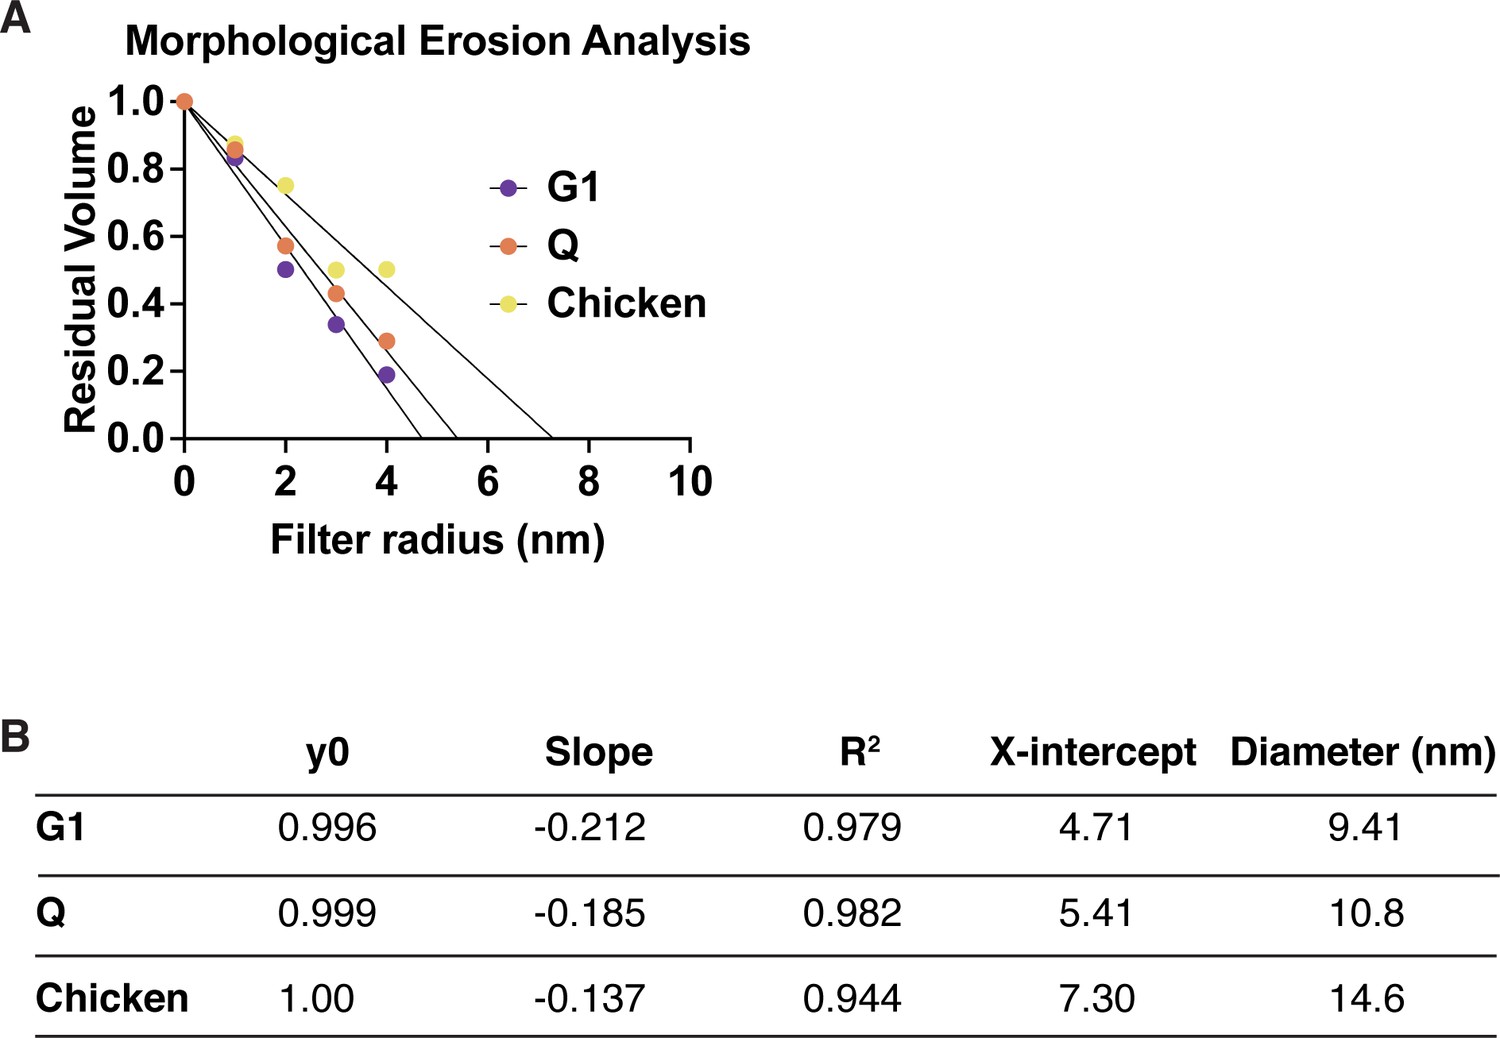
Morphological erosion analysis of chromatin fiber diameters.
(A) The residual volume of the chromatin fiber is plotted against the filter radius. A liner function is used to fit the first five data points to estimate the diameter of chromatin fibers based on the x-axis intercept. The resulting numbers and diameter estimates are shown in (B).
Figure 2—figure supplement 2
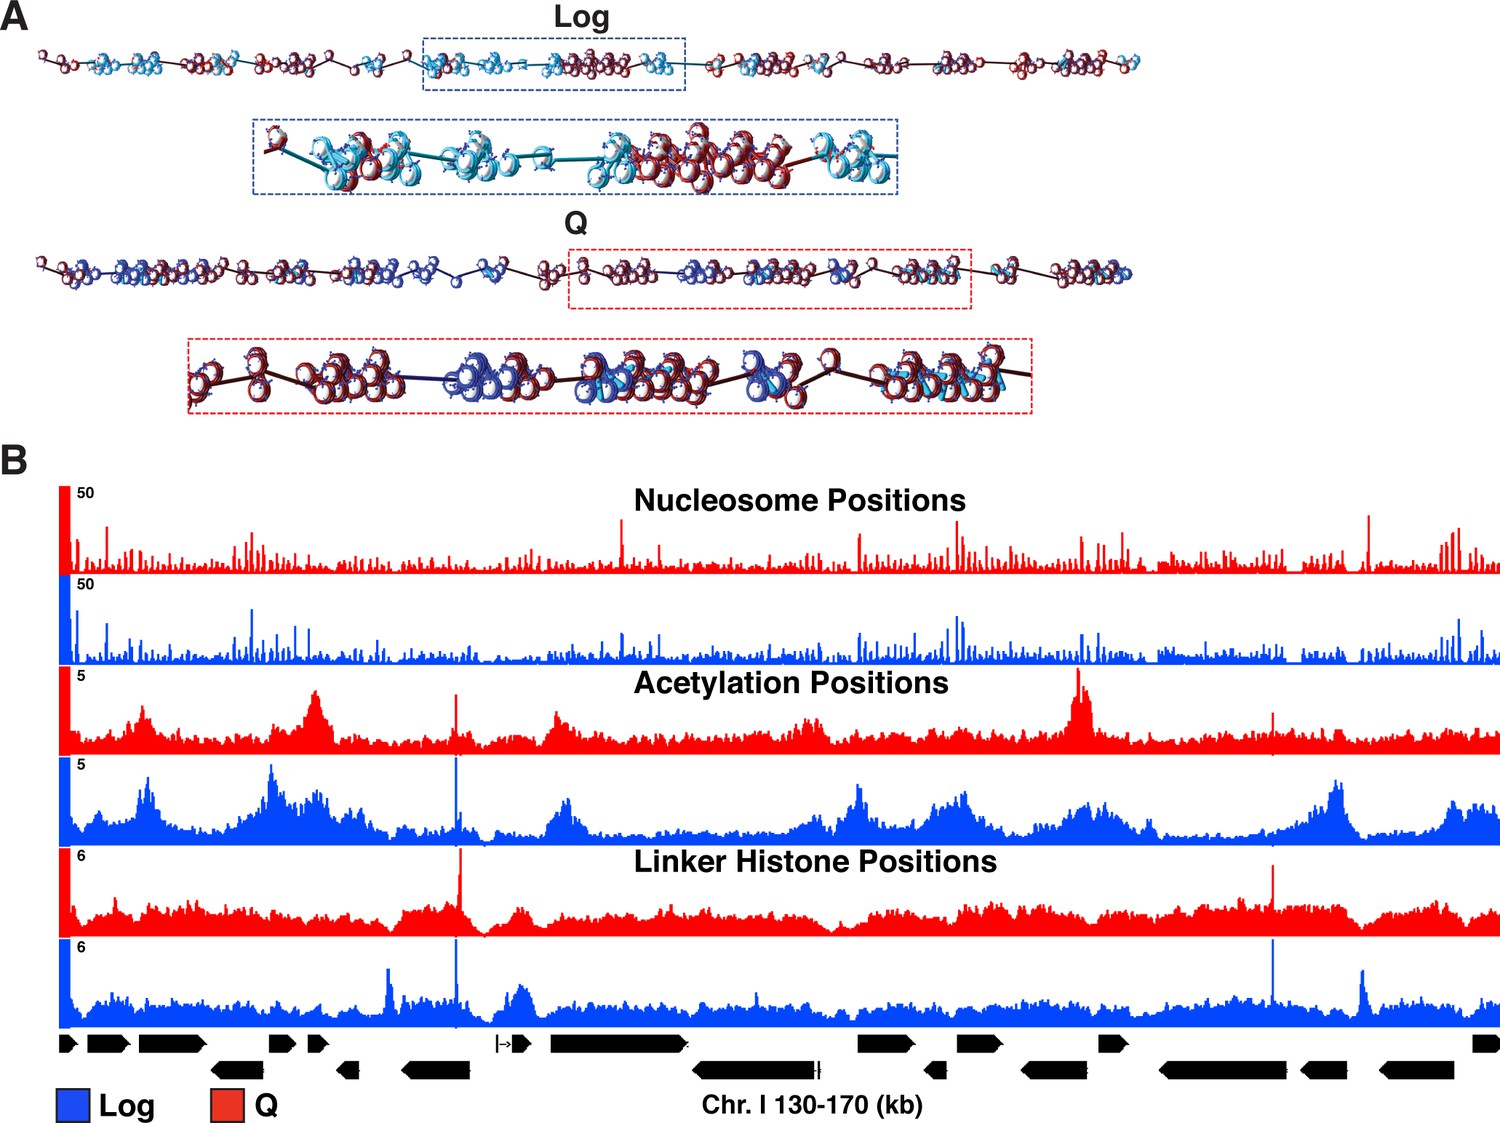
Input parameters for mesoscale modeling.
(A) Starting configurations for Q and Log cell chromatin fibers. Genes are shown in light blue and blue for Log and Q, respectively. For both systems, intergenic regions are shown in dark red, linker histone in turquoise, wild-type histone tails in blue, and acetylated histone tails in red. (B) Genome-browser view of nucleosome positions, histone acetylation occupancy, and linker histone occupancy based on MNase-seq, H4 tail penta-acetyl ChIP-seq, and H1 ChIP-seq, respectively.
-
Figure 2—figure supplement 2—source data 1
Input parameters for modeling.
- https://cdn.elifesciences.org/articles/72062/elife-72062-fig2-figsupp2-data1-v2.xlsx
Figure 2—figure supplement 3
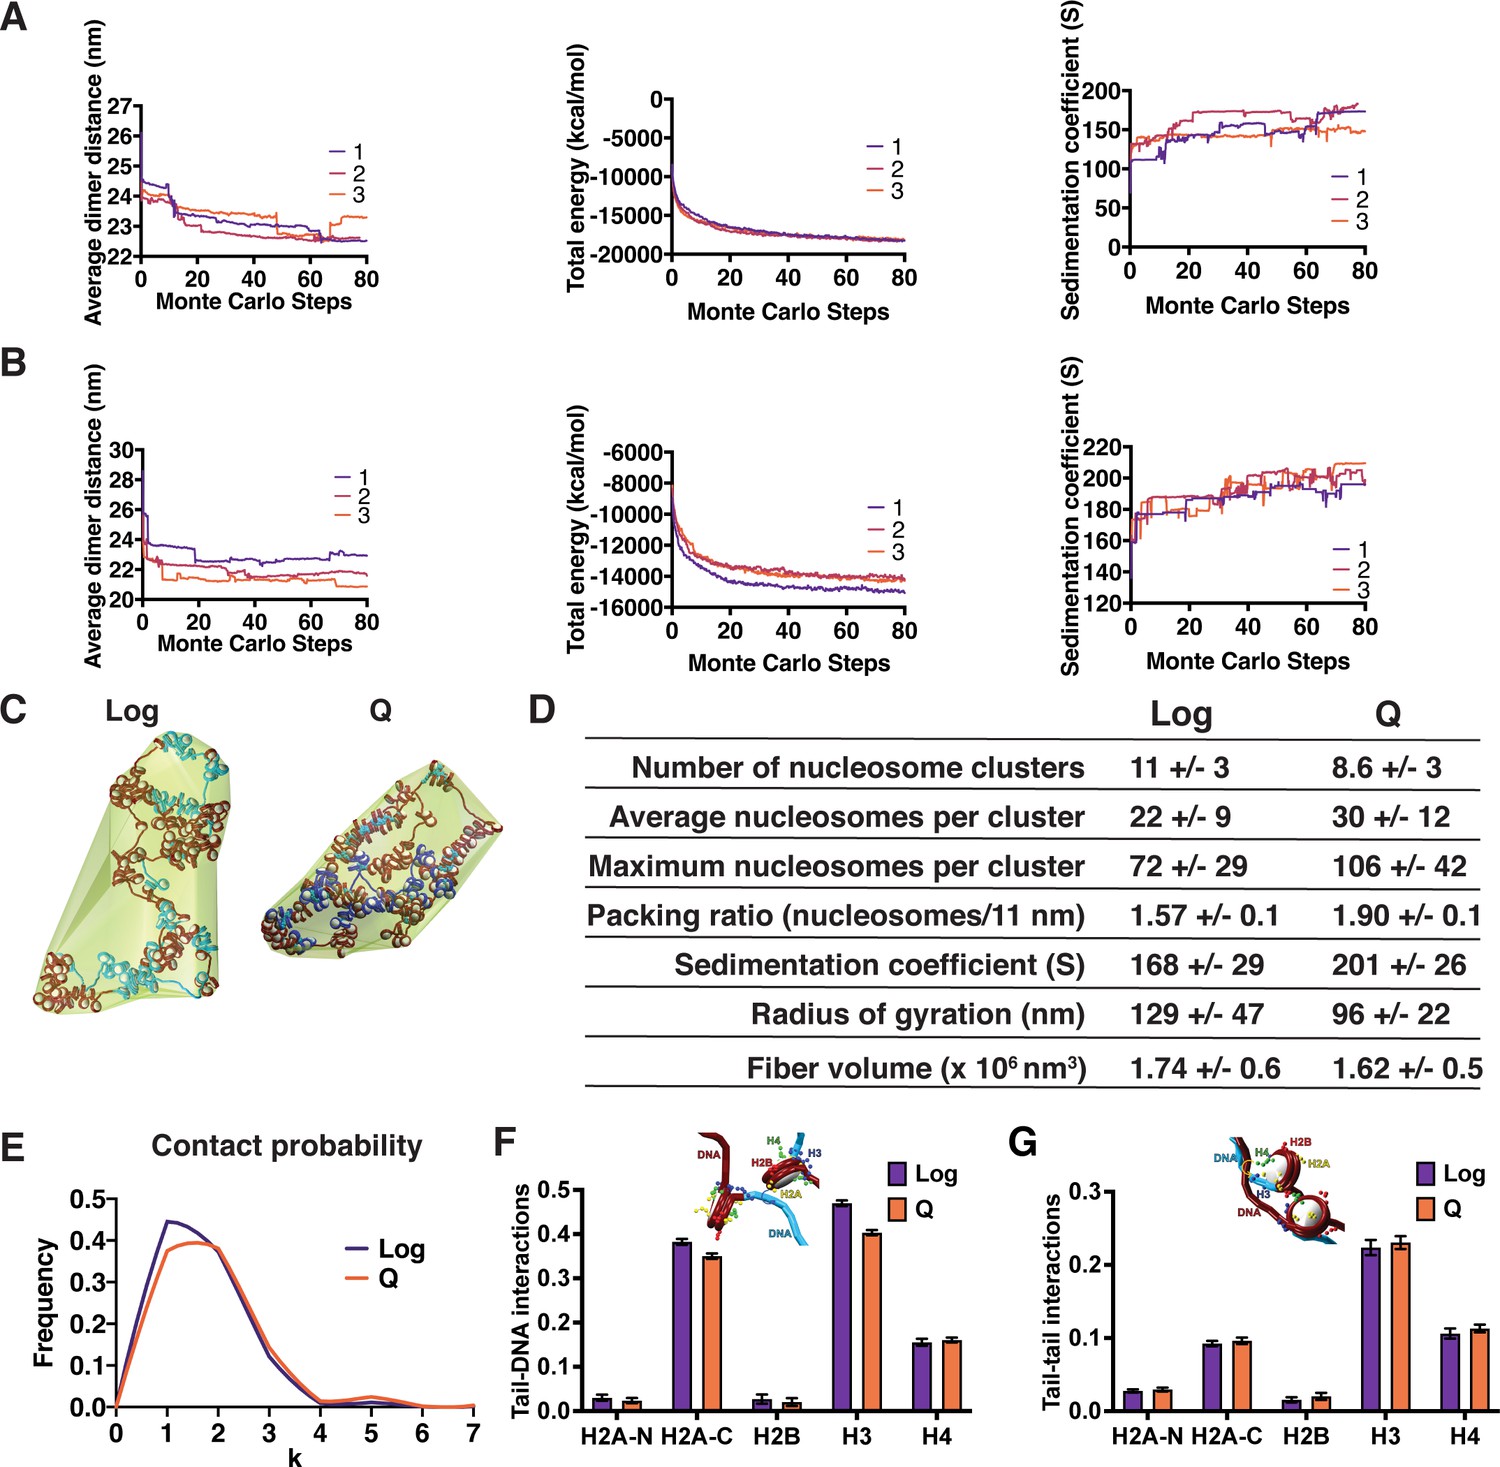
Mesoscale modeling of Log and Q chromatin fibers.
(A, B) Simulation convergence assessed through global and local properties. Shown are the average dimer distance, total energy, and sedimentation coefficient along 80 million MC steps. We show the convergence for three independent trajectories for log (A) and Q (B). (C) Representative final configurations showing bounding surface. Genes are shown in blue and intergenic regions are shown in red. H1 is shown in turquoise. (D) Fiber compaction and morphology parameters for the 5000-configuration ensemble of each system. (E) Modeled frequency of nucleosome contact probabilities between a nucleosome and each subsequent nucleosome (k). (F) Normalized contact counts between histone tails and the DNA of separate nucleosomes across 50 trajectories. Here, the normalization of contact counts is done so that a type of histone tail’s total contacts to all chromatin elements such as histone cores or DNA are summed to one. Refer to the method section ‘Tail interaction’ for details. Error bars show standard deviation. (G) Normalized contact counts between histone tails and the tails of separate nucleosomes across 50 trajectories. Here, the normalization of contact counts is done so that a type of histone tail’s total contacts to all chromatin elements such as histone cores or DNA are summed to one. Refer to the method section ‘Tail interaction’ for details. Error bars show standard deviation.
-
Figure 2—figure supplement 3—source data 1
Compaction parameters.
- https://cdn.elifesciences.org/articles/72062/elife-72062-fig2-figsupp3-data1-v2.xlsx
-
Figure 2—figure supplement 3—source data 2
Tail-tail contact counts.
- https://cdn.elifesciences.org/articles/72062/elife-72062-fig2-figsupp3-data2-v2.xlsx
-
Figure 2—figure supplement 3—source data 3
Tail-DNA contact counts.
- https://cdn.elifesciences.org/articles/72062/elife-72062-fig2-figsupp3-data3-v2.xlsx
Figure 3 with 1 supplement
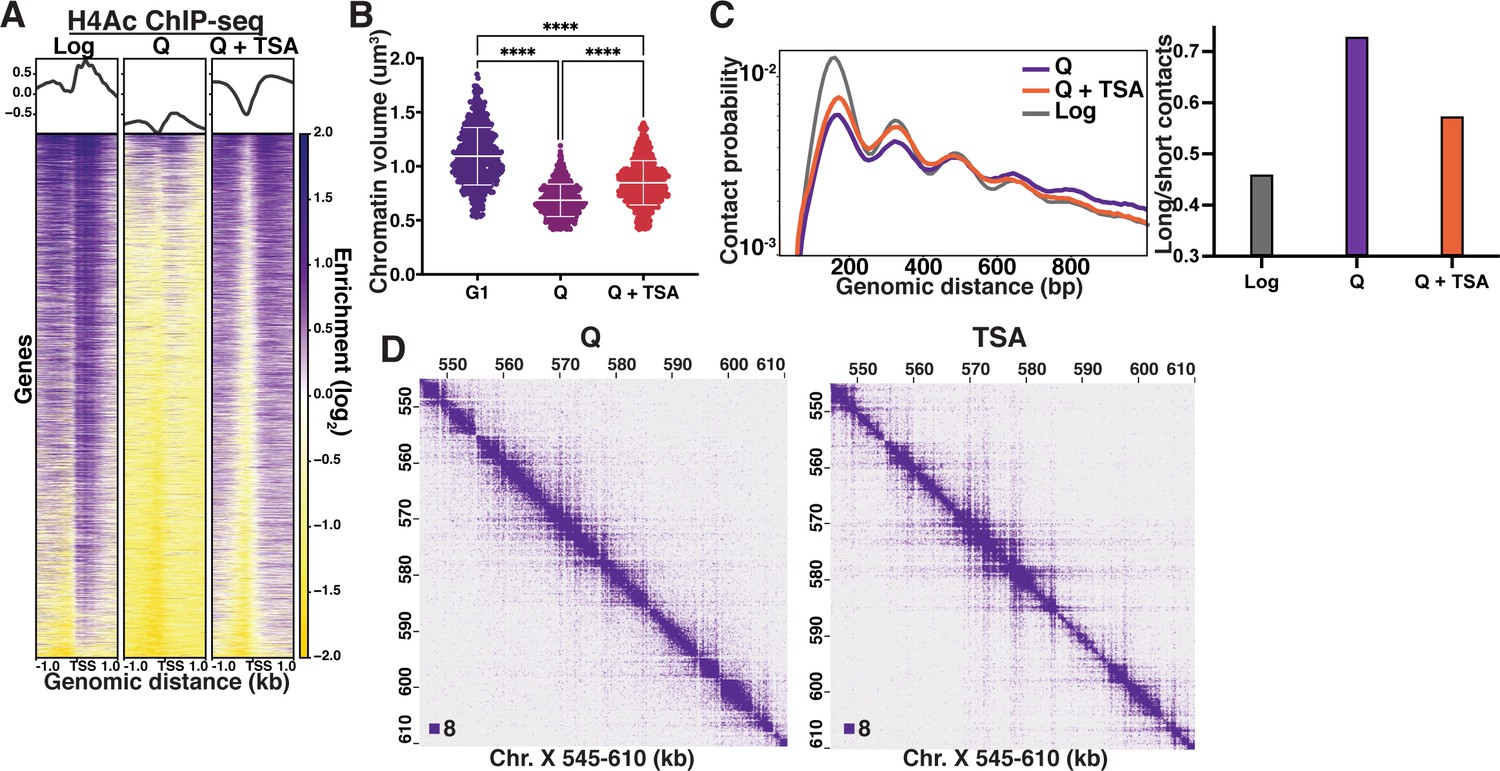
Histone deacetylation is necessary for quiescence-specific chromatin folding.
(A) H4 tail penta-acetylation ChIP-seq heatmaps ±1 kb of all transcription start sites (TSS). Rows are linked across all heatmaps. (B) Chromatin volume measurements following DAPI staining of at least 100 cells each of two biological replicates. Bars represent mean and standard deviation. Significance was determined using Welch’s ANOVA followed by Games-Howell’s multiple comparisons test. Raw data are listed in Figure 3—source data 1, and statistics are listed in Supplementary file 1. Here, G1 indicates cells arrested in G1. (C) Left, contact probability map generated from Micro-C XL data. Data are normalized so that the total probability of intranucleosomal contacts on the same chromosome is equal to 1. Right, ratio of contacts between 500 and 1000 bp to contacts between 50 and 500 bp. (D) Representative Micro-C XL data of quiescent cells without (left) and with (right) TSA treatment at 200 bp resolution.
-
Figure 3—source data 1
Chromatin volume measurements.
- https://cdn.elifesciences.org/articles/72062/elife-72062-fig3-data1-v2.xlsx
Figure 3—figure supplement 1
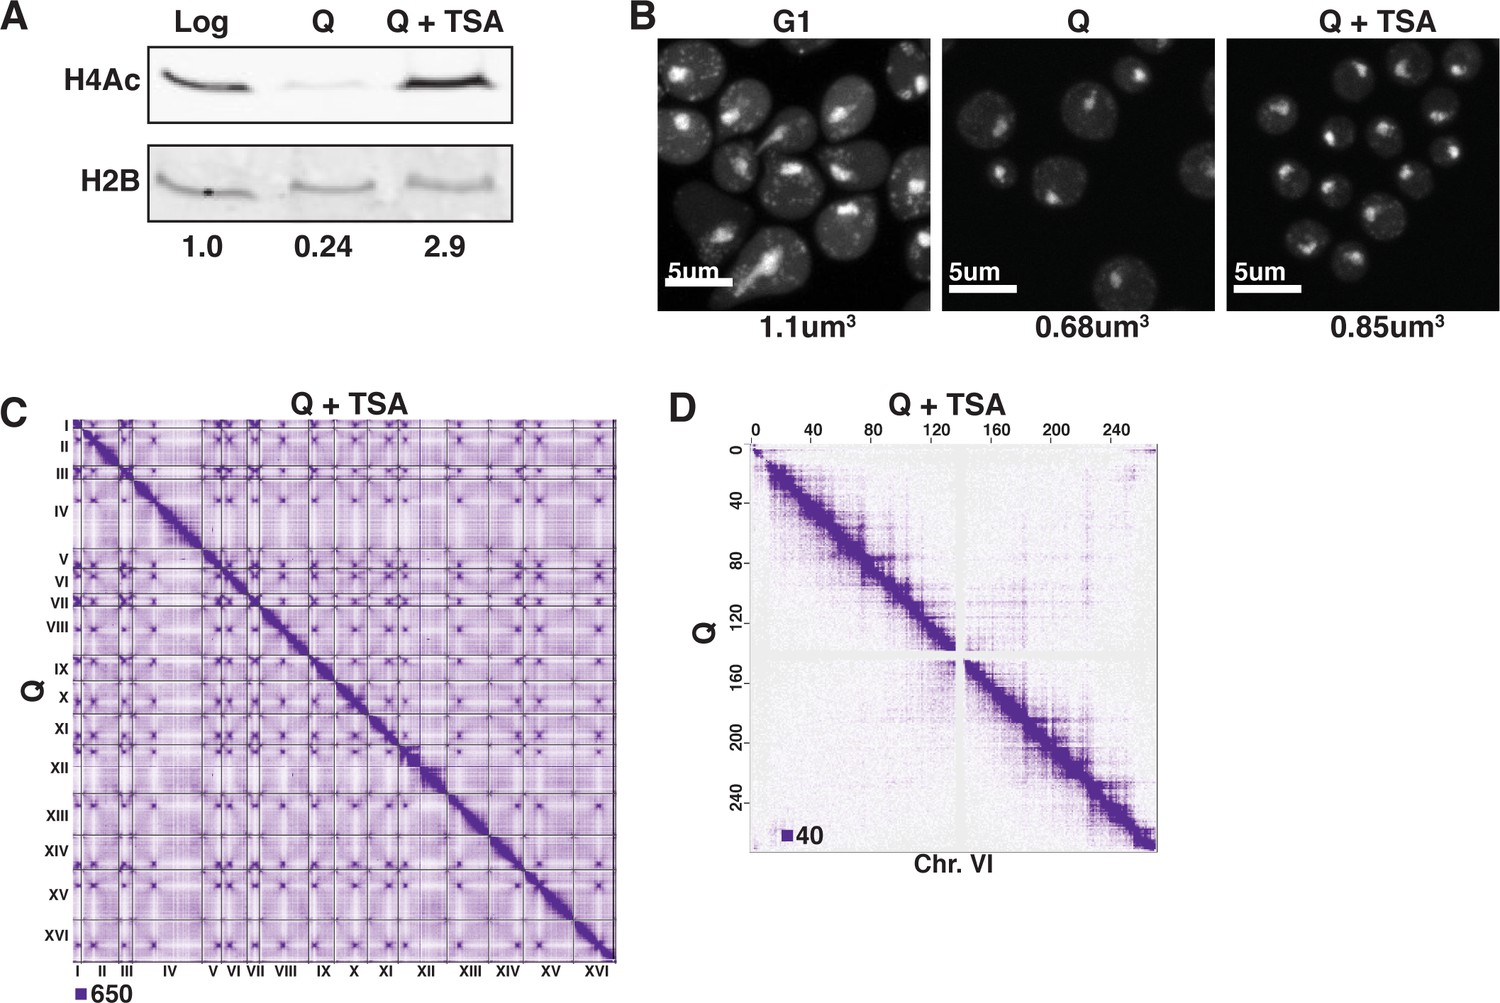
TSA treatment increases H4 tail acetylation and decompacts chromatin in Q cells.
(A) Representative Western blots of H4 penta-acetylation (H4Ac) and H2B in Log, Q, and TSA-treated Q cells. Band volumes were quantified using Fiji and H4Ac volumes were normalized to H2B volumes. This Western was completed twice using two biological replicates of each condition. The H2B control was run on a separate gel. (B) Representative images of DAPI-stained cells. Chromatin volumes were calculated as described in Figure 3 and in the Materials and methods. Raw data are listed in Figure 3—source data 1, and statistics are listed in Supplementary file 1. (C) Genome-wide Micro-C XL data in Q cells with (top) and without (bottom) TSA treatment. (D) Micro-C XL data at 1 kb resolution with (top) and without (bottom) TSA treatment.
-
Figure 3—figure supplement 1—source data 1
H4Ac and H2B Western blots.
- https://cdn.elifesciences.org/articles/72062/elife-72062-fig3-figsupp1-data1-v2.pdf
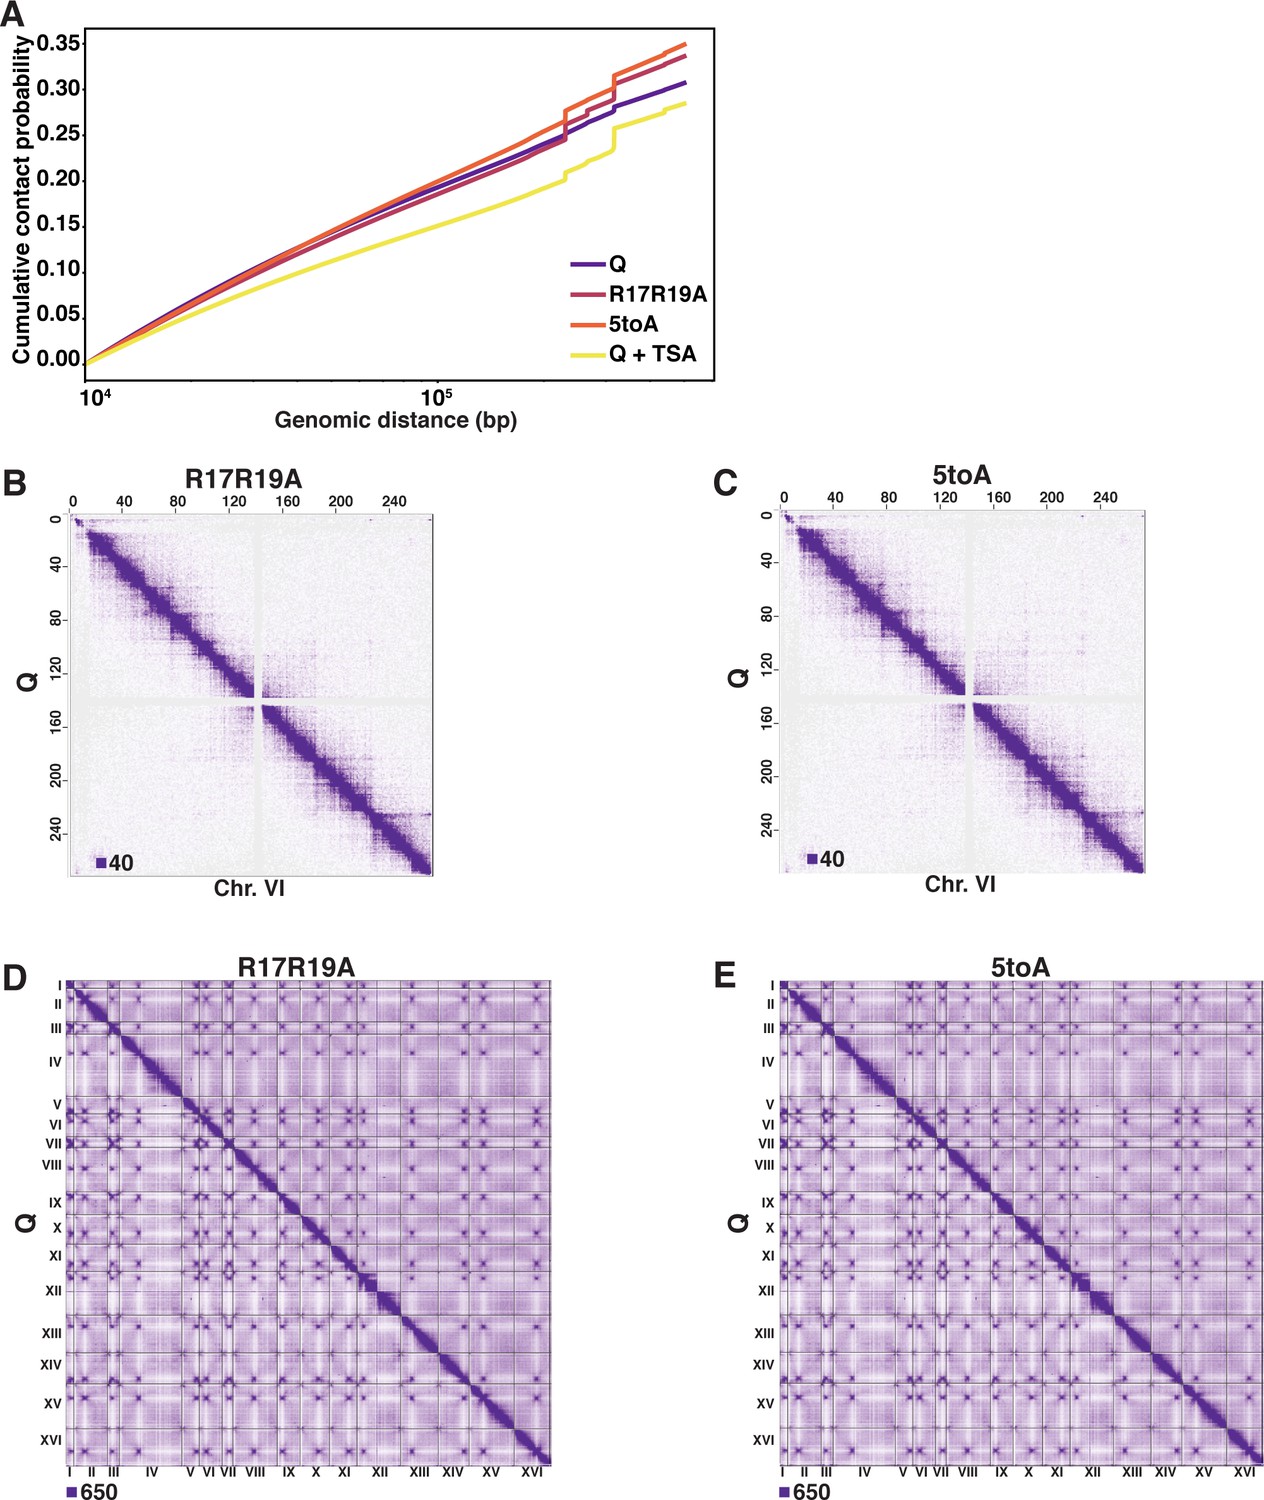
Figure 4 with 2 supplements
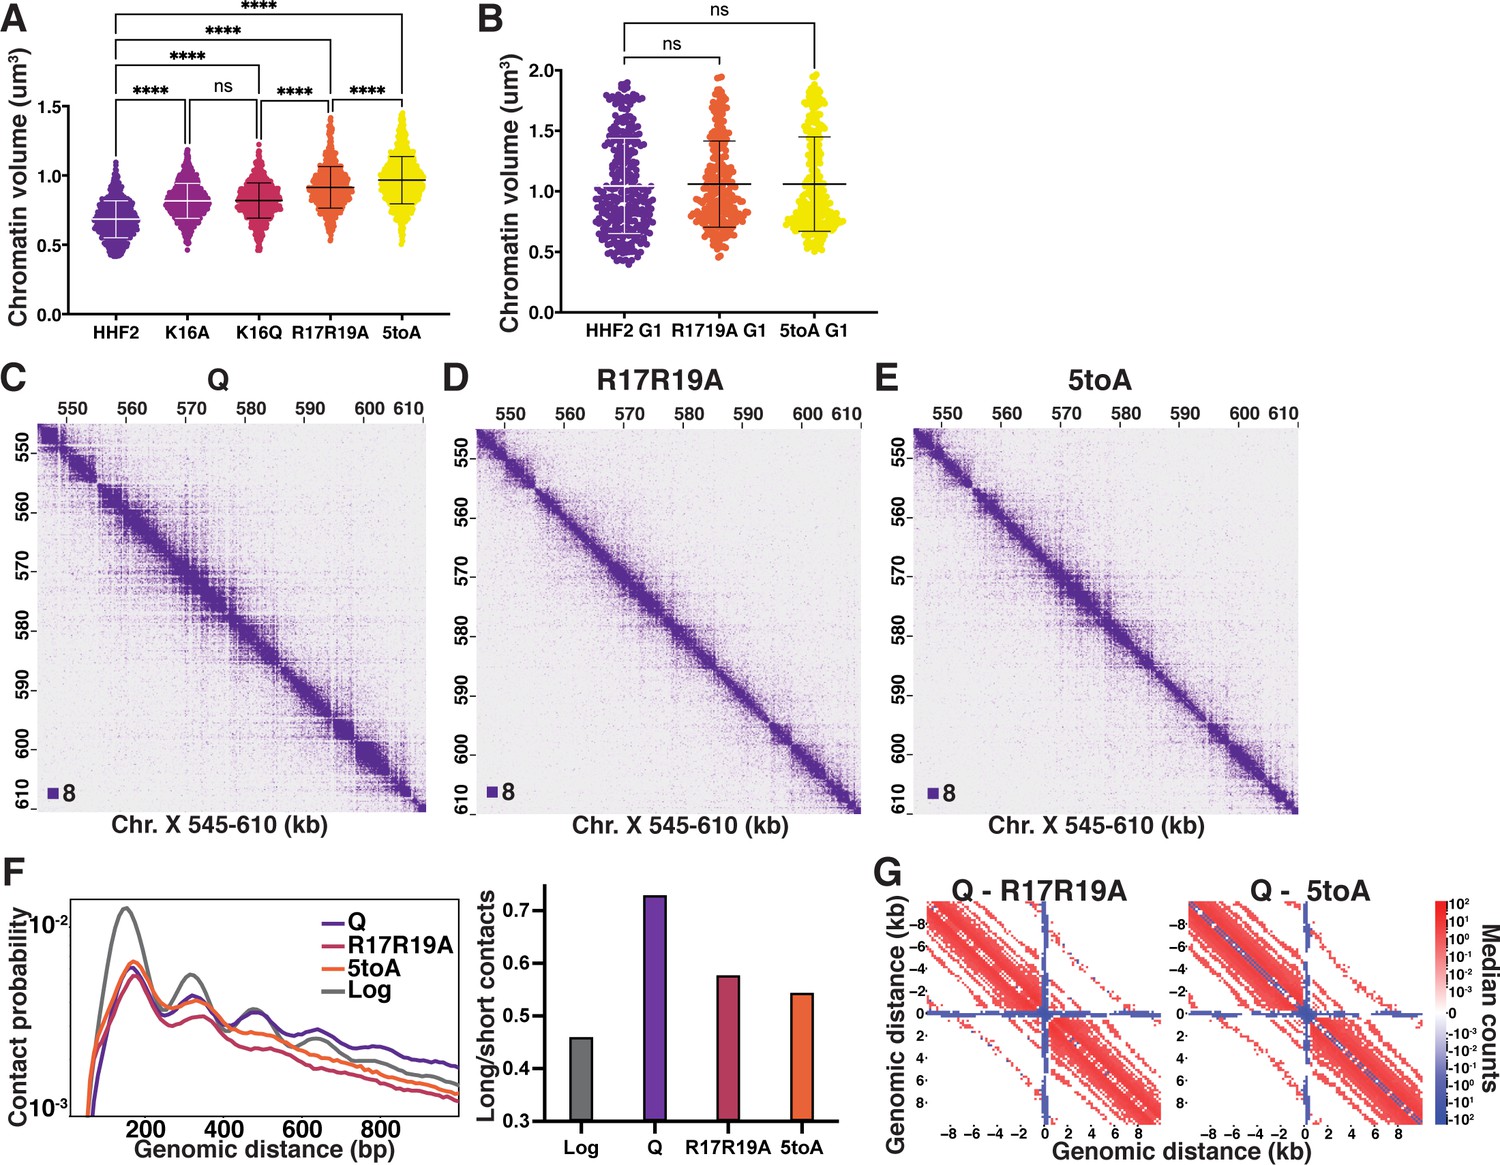
The H4 tail basic patch regulates quiescence-specific chromatin folding.
(A) Chromatin volume measurements following DAPI staining of at least 100 cells of two biological replicates of quiescent H4 mutant cells. HHF2 is the single-copy HHT2-HHF2 WT control strain. Bars represent mean and standard deviation. Significance was determined using Welch’s ANOVA followed by Games-Howell’s multiple comparisons test. Raw data are listed in Figure 4—source data 1, and statistics are listed in Supplementary file 1. (B) Chromatin volume measurements as in (A) of HHF2 and H4 mutant G1 cells following DAPI staining of two biological replicates. G1 cells were selected by morphology as H4 mutant strains cannot be arrested in G1. Raw data are listed in Figure 4—source data 1, and statistics are listed in Supplementary file 1. (C–E) Representative Micro-C XL data of WT (C) and H4 mutant (D–E) quiescent cells at 200 bp resolution. (F) Left, contact probability map generated from Micro-C XL data. Q and Log indicate cells in the indicated stage from true WT strains. Data are normalized so that the total probability of intranucleosomal contacts on the same chromosome is equal to 1. Right, ratio of contacts between 500 and 1000 bp to contacts between 50 and 500 bp. (G) Subtraction Micro-C XL metaplots of median interactions around sites of condensin-bound L-CID boundaries in quiescent cells at 200 bp resolution. The scale shows the difference between median counts so that contacts in red are increased in WT Q and contacts in blue are increased in the mutants.
-
Figure 4—source data 1
Chromatin volume measurements.
- https://cdn.elifesciences.org/articles/72062/elife-72062-fig4-data1-v2.xlsx
Figure 4—figure supplement 1
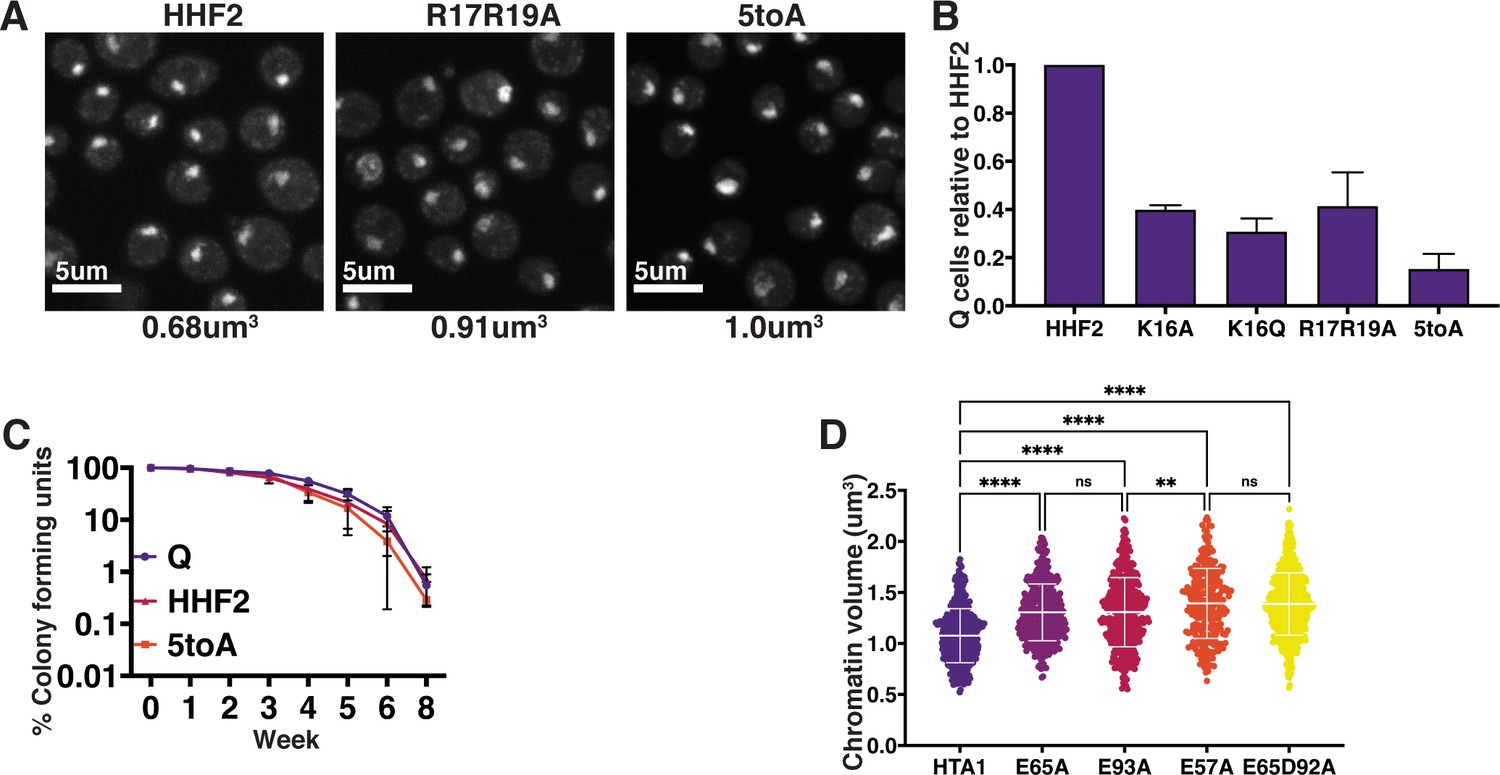
Phenotypes of H4 basic patch and H2A acidic patch substitutions in quiescence.
(A) Representative images of DAPI-stained cells. Chromatin volumes were calculated as described in Figure 3 and in the Materials and methods. Mean volumes are shown below. HHF2 is a WT control. Raw data are listed in Figure 4—figure supplement 1—source data 3, and statistics are listed in Supplementary file 1. (B) Normalized optical density units of purified Q cells of two biological replicates of the indicated condition to show Q entry efficiency. Error bars represent standard deviation. (C) The longevity of purified Q cells was measured by following the ability of cells to form colonies after the indicated number of weeks. Numbers shown represent two to three technical replicates each of two biological replicates. Error bars show standard deviation. (D) Chromatin volume measurements of H2A mutant Q cells following DAPI staining of at least 100 cells each of two biological replicates. Bars represent mean and standard deviation. Significance was determined using Welch’s ANOVA followed by Games-Howell’s multiple comparisons test. Exact numbers are listed in the Materials and methods. HTA1 is WT. Note: As H2A mutants were generated in auxotrophic strain backgrounds in which chromatin volumes are greater than in prototrophic backgrounds, these data cannot be directly compared to other DAPI data sets in this manuscript.
-
Figure 4—figure supplement 1—source data 1
Q cell counts.
- https://cdn.elifesciences.org/articles/72062/elife-72062-fig4-figsupp1-data1-v2.xlsx
-
Figure 4—figure supplement 1—source data 2
Q cell longevity.
- https://cdn.elifesciences.org/articles/72062/elife-72062-fig4-figsupp1-data2-v2.xlsx
-
Figure 4—figure supplement 1—source data 3
Chromatin volume measurements.
- https://cdn.elifesciences.org/articles/72062/elife-72062-fig4-figsupp1-data3-v2.xlsx
Figure 4—figure supplement 2
H4 basic patch substitutions decompact chromatin in Q.
(A) Cumulative contact probability of contacts between distances of 10 kb to 1000 kb. (B, C) Genome-wide Micro-C XL data. (D, E) Micro-C XL data at 1 kb resolution.
Figure 5 with 1 supplement
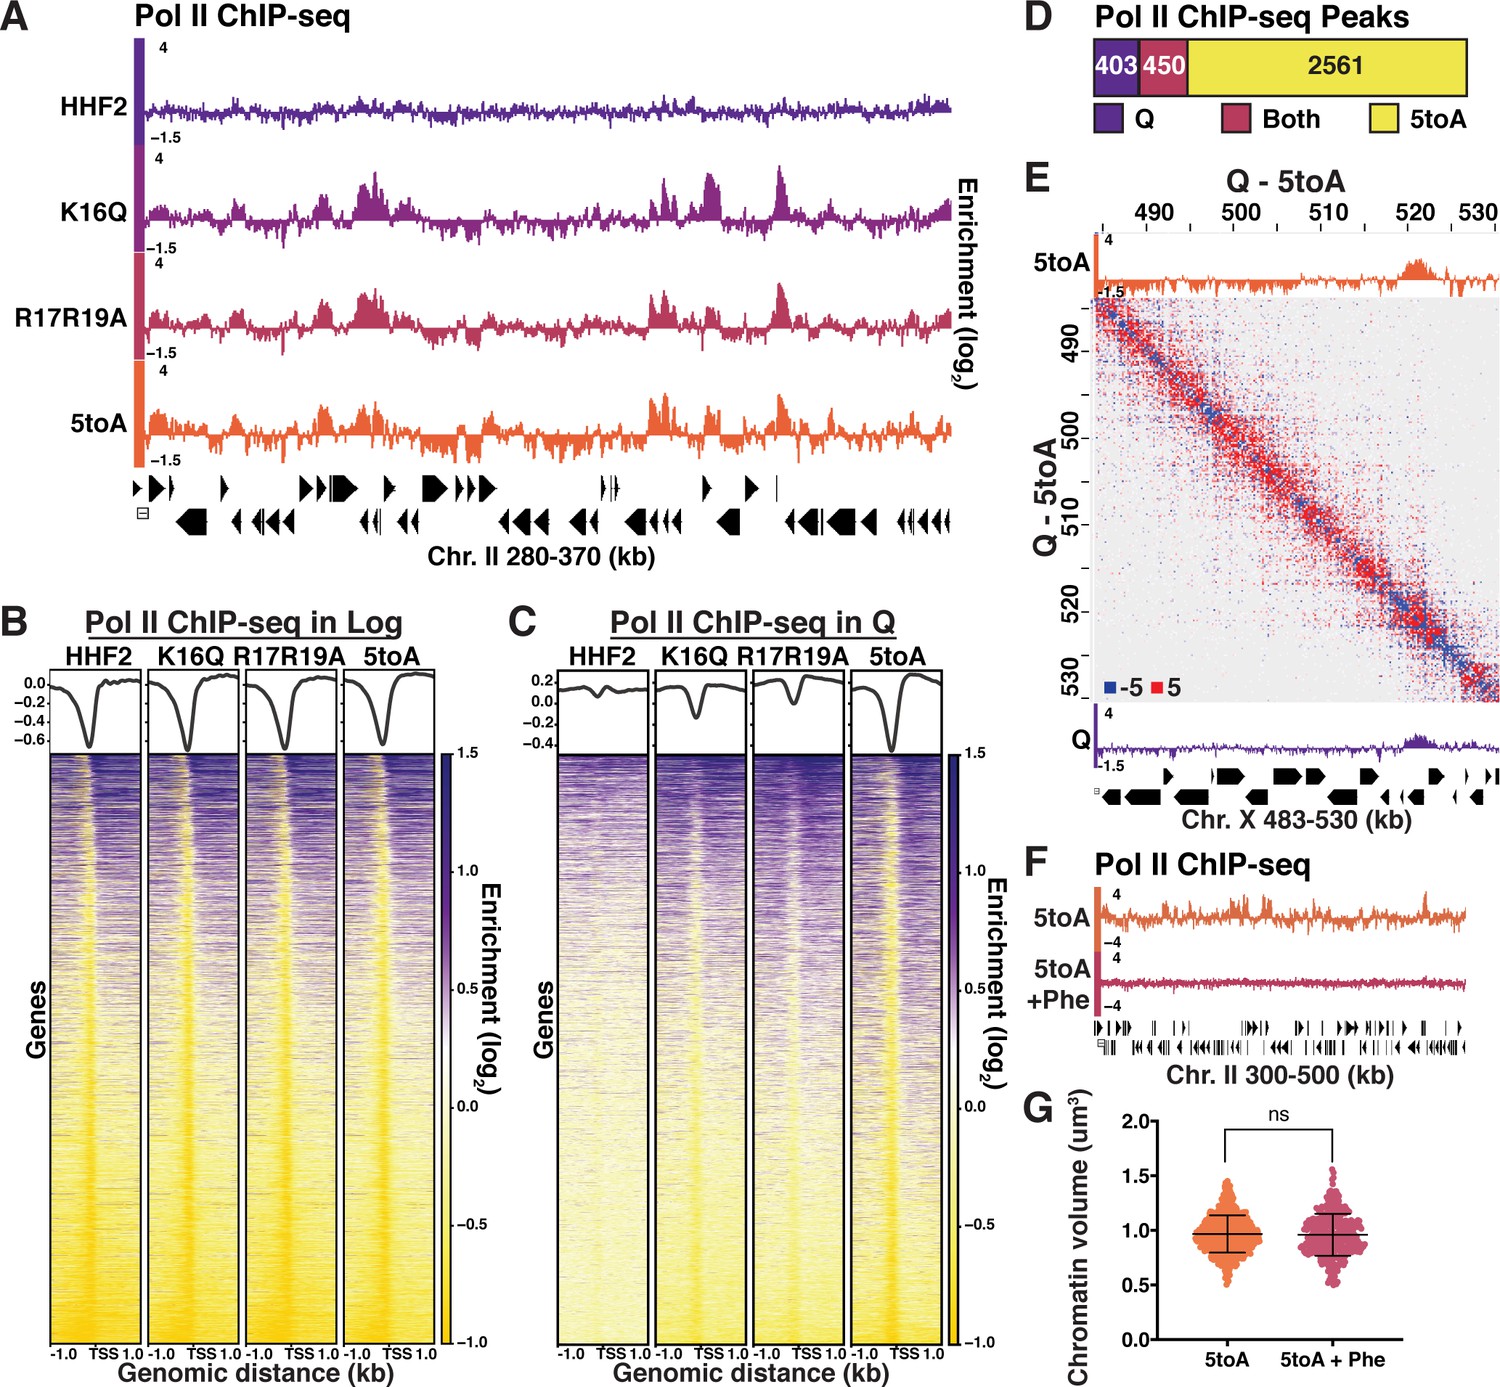
Quiescence-specific local chromatin folding represses transcription.
(A) Genome browser view of Pol II subunit Rpb3 ChIP-seq data in quiescent mutant strains across a portion of Chromosome II. (B) Heatmaps of Rpb3 across all TSSs in Log and (C) Q cells. Rows are the same across all heatmaps in a panel. (D) MACS differential peak calls for WT and 5toA Rpb3 ChIP-seq in Q. (E) Pol II ChIP-seq data in 5toA (top) and true WT Q (bottom) cells overlaid on a representative heatmap showing 5toA Micro-C XL data subtracted from WT Q data. Positive (red) indicates contacts that are higher in WT cells. (F) Genome browser view of Rpb3 ChIP-seq data in 5toA quiescent cells with or without 1,10-phenanthroline treatment (5toA+Phe). (G) Chromatin volume measurements following DAPI staining of at least 100 cells each of two biological replicates. Bars represent mean and standard deviation. Significance was determined using a two-tailed unpaired t-test with Welch’s correction. Exact numbers are listed in the Materials and methods. TSS, transcription start site.
-
Figure 5—source data 1
Chromatin volume measurements.
- https://cdn.elifesciences.org/articles/72062/elife-72062-fig5-data1-v2.xlsx
Figure 5—figure supplement 1
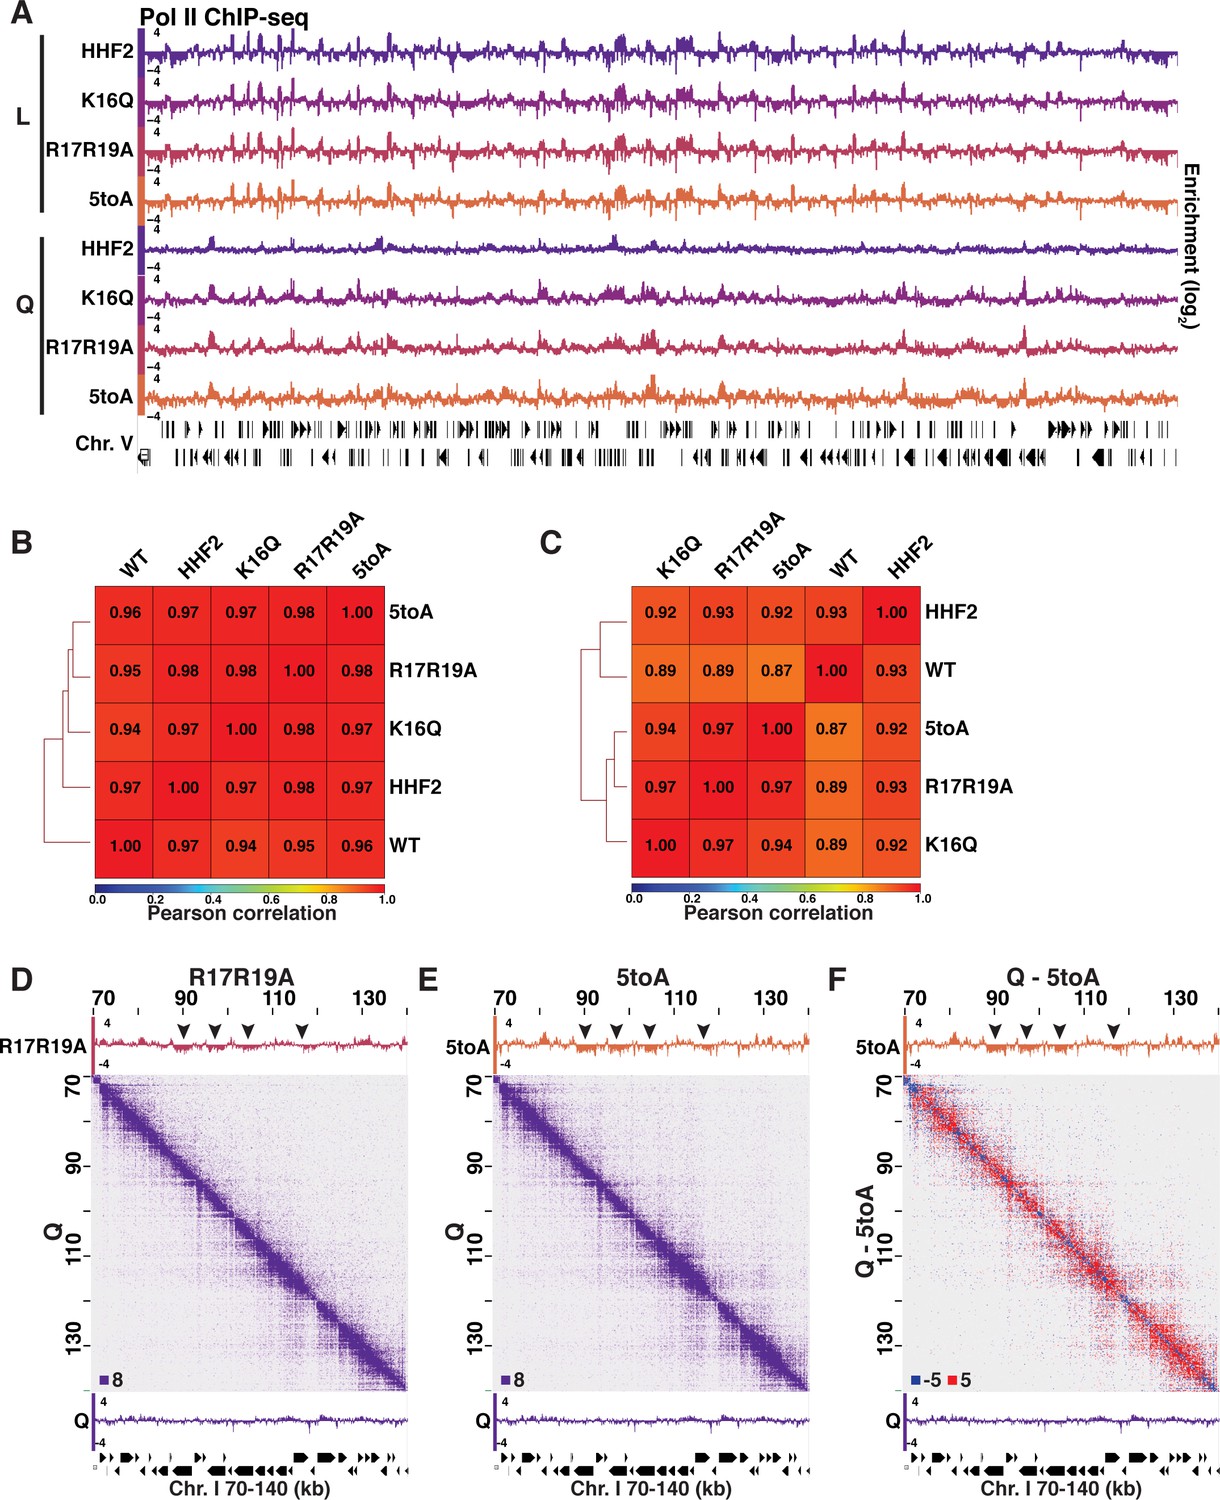
Pol II and H3 ChIP-seq in Log and Q.
(A) Genome browser view of Pol II subunit Rpb3 ChIP-seq data in log and quiescent mutant strains across the entirety of Chromosome V. (B) Pearson correlation scores calculated and hierarchically sorted using deepTools of Rpb3 (Pol II) ChIP-seq data in log and (C) Q. (D–F) Micro-C XL and Pol II ChIP-seq data in mutant and WT quiescent (Q) cells. Arrowheads point to regions that are decompacted but not expressed in mutant cells. Micro-C XL data subtraction is shown in (F).
Figure 6 with 1 supplement

H4-tail mediated chromatin folding inhibits condensin loop extrusion.
(A) Condensin subunit Brn1 ChIP-seq data overlayed beneath representative Micro-C XL data at 200 bp resolution. (B) Schematic showing one-sided loop extrusion by condensin between two boundaries. (C) Metaplots of Micro-C XL data showing aggregate peak analysis of trans nucleosome contacts ±10 kb between Brn1 ChIP-seq peaks in the indicated condition. Data shown are the median contact values. (D) Heatmaps of Brn1 ChIP-seq ±3 kb of all TSSs. Rows are the same across all heatmaps. (E) Metaplot of Brn1 ChIP-seq data ±5 kb of L-CID boundaries. (F) MACS differential peak calls for HHF2 and 5toA Brn1 ChIP-seq in Q. (G) Model: In WT quiescent cells, local nucleosome interactions drive the compaction of chromatin fibers. This compaction inhibits condensin loop extrusion, resulting in slow or paused extrusion. In H4 mutant quiescent cells, loss of nucleosome interactions leads to fiber decompaction and an increased rate of condensin loop extrusion. TSS, transcription start site; WT, wild-type.
Figure 6—figure supplement 1
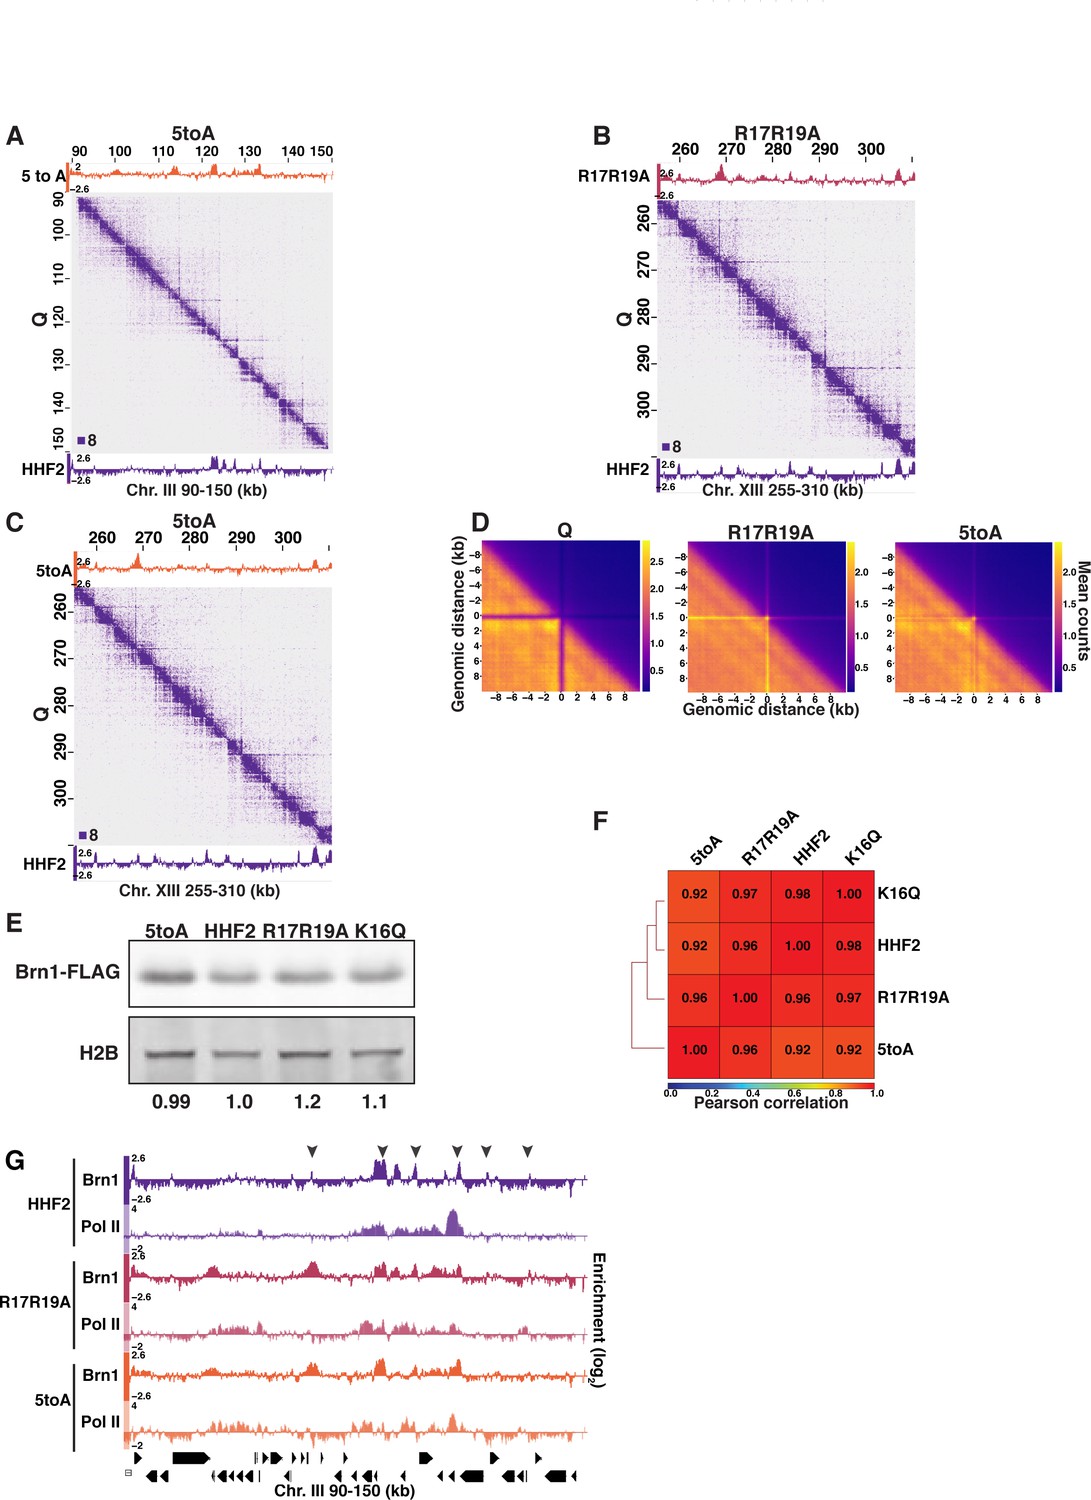
H4-mediated chromatin fiber folding represses condensin loop extrusion.
(A–C) Condensin subunit Brn1 ChIP-seq in R17R19A (top) and HHF2 (bottom) data overlayed across Micro-C XL data at 200 bp resolution. (D) Metaplots of Micro-C XL data showing aggregate peak analysis of trans nucleosome contacts ±10 kb between Brn1 ChIP-seq peaks in the indicated condition. Data shown are the mean contact values. (E) Representative Western blots of Brn1-FLAG and H2B in H4 mutant and HHF2 (WT) strains. Band volumes were quantified using Fiji and Brn1-FLAG volumes were normalized to H2B volumes. This Western was completed four times using two biological replicates of each condition. The H2B loading control was run on the same gradient gel. (F) Pearson correlation scores calculated and hierarchically sorted using deepTools of Brn1-FLAG in H4 mutant and HHF2 (WT) strains. (G) Genome browser view of Pol II subunit Rpb3 and Brn1-FLAG ChIP-seq data in H4 mutant strains across part of Chromosome III. Positions of stripes are indicated with arrowhead. WT, wild-type.
-
Figure 6—figure supplement 1—source data 1
Brn1-FLAG and H2B Western blots.
- https://cdn.elifesciences.org/articles/72062/elife-72062-fig6-figsupp1-data1-v2.pdf
Figure 7
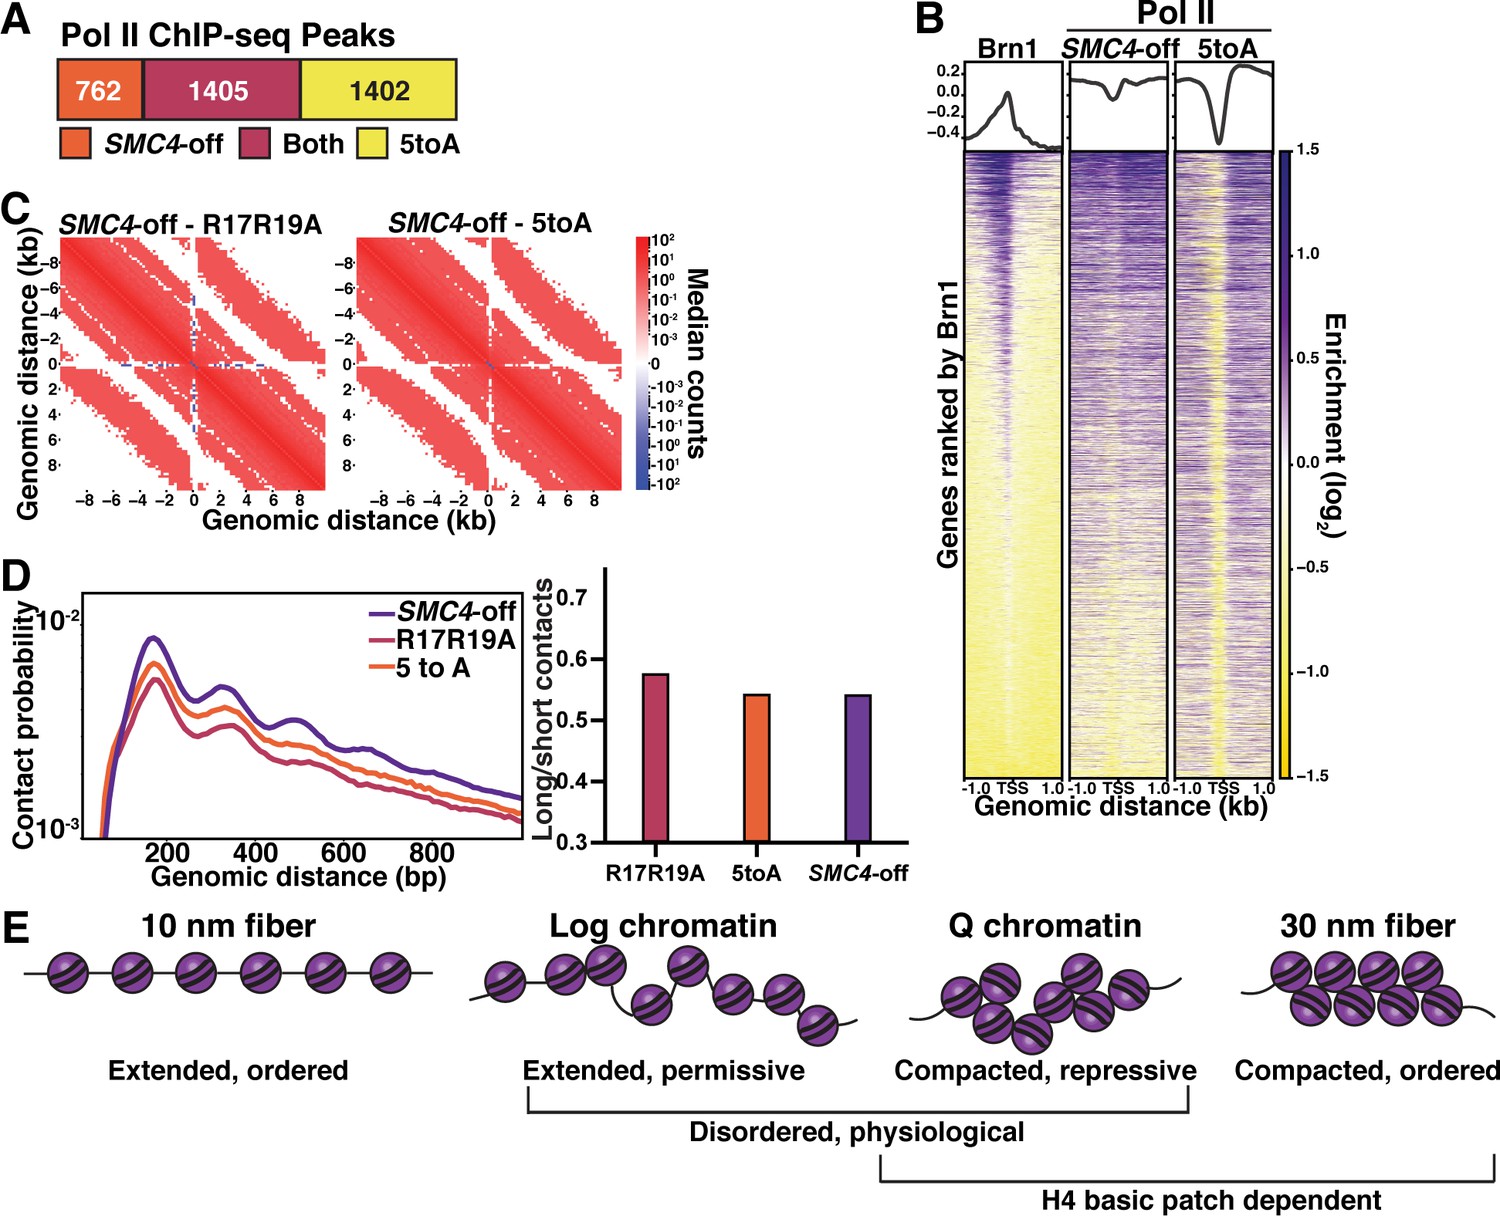
Chromatin fiber folding and condensin looping are complementary mechanisms of transcriptional repression.
(A) MACS differential peak calls for SMC4-off and 5toA Brn1 ChIP-seq in Q. SMC4-off cells contain a doxycycline-inducible Tet repressor system to shut off the expression of the condensin subunit SMC4. SMC4-off data were previously published in Swygert et al., 2019. (B) Heatmaps of Brn1 and Pol II (subunit Rbp3) ChIP-seq ±1 kb of all TSSs. All heatmaps are ordered by descending Brn1 occupancy in WT Q (leftmost heatmap). (C) Micro-C XL subtraction metaplots of median interactions around sites of condensin-bound L-CID boundaries in quiescent cells at 200 bp resolution. The scale shows the difference between median counts. Plots show mutant Micro-C XL data subtracted from previously published SMC4-off Micro-C XL data (Swygert et al., 2019). (D) Left, contact probability map of Micro-C XL data. Data are normalized so that the total probability of intranucleosomal contacts on the same chromosome is equal to 1. Right, ratio of contacts between 500 and 1000 bp to contacts between 50 and 500 bp. (E) Model of physiologically relevant local chromatin fiber compaction compared to canonical chromatin fiber models. In log, chromatin fibers are in a disordered, extended state that is permissive to transcription. In Q, an increase in local nucleosomal interactions driven by H4 deacetylation promotes folding into disordered, compacted structures that are transcriptionally repressive. TSS, transcription start site.
Tables
Key resources table
| Reagent type (species) or resource | Designation | Source or reference | Identifiers | Additional information |
|---|---|---|---|---|
| Strain, strain background (Saccharomyces cerevisiae) | WT | McKnight et al., 2015 | yTT5781 | MATa RAD5+ prototroph: |
| Strain, strain background (S. cerevisiae) | WT | McKnight et al., 2015 | yTT5783 | MATa RAD5+ prototroph |
| Strain, strain background (S. cerevisiae) | Hho1-FLAG | This Paper | yTT6336 | MATa RAD5+ prototroph HHO1- 2L-3FLAG::KanMX |
| Strain, strain background (S. cerevisiae) | Hho1-FLAG | This Paper | yTT6337 | MATa RAD5+ prototroph HHO1- 2L-3FLAG::KanMX |
| Strain, strain background (S. cerevisiae) | HHF2 | This Paper | yTT7177 | MATa RAD5+ ura3-1 hht1-hhf1::Nat hht2- hhf2::Hyg trp1-1::pRS 404-HHT2-HHF2 |
| Strain, strain background (S. cerevisiae) | HHF2 | This Paper | yTT7206 | MATa RAD5+ ura3-1 hht1-hhf1::Nat hht2- hhf2::Hyg trp1-1::pRS 404-HHT2-HHF2 |
| Strain, strain background (S. cerevisiae) | hhf2-5toA | This Paper | yTT7175 | MATa RAD5+ ura3-1 hht1-hhf1::Nat hht2- hhf2::Hyg trp1-1::pRS 404-HHT2-hhf2-K16A, R17A,H18A,R19A,K20A |
| Strain, strain background (S. cerevisiae) | hhf2-5toA | This Paper | yTT7208 | MATa RAD5+ ura3-1 hht1-hhf1::Nat hht2- hhf2::Hyg trp1-1::pRS 404-HHT2-hhf2-K16A, R17A,H18A,R19A,K20A |
| Strain, strain background (S. cerevisiae) | hhf2-R17A,R19A | This Paper | yTT7200 | MATa RAD5+ ura3-1 hht1-hhf1::Nat hht2- hhf2::Hyg trp1-1::pRS 404-HHT2-hhf2- R17A,R19A |
| Strain, strain background (S. cerevisiae) | hhf2-R17A,R19A: | This Paper | yTT7207 | MATa RAD5+ ura3-1 hht1-hhf1::Nat hht2- hhf2::Hyg trp1-1::pRS 404-HHT2-hhf2-R17A, R19A |
| Strain, strain background (S. cerevisiae) | hhf2-K16A | This Paper | yTT7202 | MATa RAD5+ ura3-1 hht1-hhf1::Nat hht2- hhf2::Hy g trp1-1::pRS404- HHT2-hhf2-K16A |
| Strain, strain background (S. cerevisiae) | hhf2-K16A | This Paper | yTT7209 | MATa RAD5+ ura3-1 hht1-hhf1::Nat hht2- hhf2::Hyg trp1-1::pRS404- HHT2-hhf2-K16A |
| Strain, strain background (S. cerevisiae) | hhf2-K16Q | This Paper | yTT7205 | MATa RAD5+ ura3-1 hht1-hhf1::Nat hht2- hhf2::Hyg trp1-1::pRS 404-HHT2-hhf2-K16Q |
| Strain, strain background (S. cerevisiae) | hhf2-K16Q | This Paper | yTT7210 | MATa RAD5+ ura3-1 hht1-hhf1::Nat hht2- hhf2::Hyg trp1-1::pRS404- HHT2-hhf2-K16Q |
| Strain, strain background (S. cerevisiae) | HHF2 Brn1-FLAG | This Paper | yTT7390 | MATa RAD5+ ura3-1 hht1-hhf1::Nat hht2- hhf2::Hyg trp1-1::pRS 404-HHT2-HHF2 Brn1- 2L-3FLAG::KanMX |
| Strain, strain background (S. cerevisiae) | HHF2 Brn1-FLAG | This Paper | yTT7391 | MATa RAD5+ ura3-1 hht1-hhf1::Nat hht2- hhf2::Hyg trp1-1::pRS 404-HHT2-HHF2 Brn1- 2L-3FLAG::KanMX |
| Strain, strain background (S. cerevisiae) | hhf2-5toA Brn1-FLAG | This Paper | yTT7388 | MATa RAD5+ ura3-1 hht1-hhf1::Nat hht2- hhf2::Hyg trp1-1::pRS 404-HHT2-hhf2-K16A, R17A,H18A,R19A, K20A Brn1-2L- 3FLAG::KanMX |
| Strain, strain background (S. cerevisiae) | hhf2-5toA Brn1-FLAG | This Paper | yTT7389 | MATa RAD5+ ura3-1 hht1-hhf1::Nat hht2- hhf2::Hyg trp1-1::pRS 404-HHT2-hhf2-K16A, R17A,H18A,R19A,K20A Brn1-2L-3FLAG::KanMX |
| Strain, strain background (S. cerevisiae) | hhf2-R17A,R19A Brn1-FLAG | This Paper | yTT7392 | MATa RAD5+ ura3-1 hht1-hhf1::Nat hht2- hhf2::Hyg trp1-1::pRS 404-HHT2-hhf2-R17A, R19A Brn1-2L- 3FLAG::KanMX |
| Strain, strain background (S. cerevisiae) | hhf2-R17A,R19A Brn1-FLAG | This Paper | yTT7393 | MATa RAD5+ ura3-1 hht1-hhf1::Nat hht2- hhf2::Hyg trp1-1::pRS 404-HHT2-hhf2-R17A, R19A Brn1-2L- 3FLAG::KanMX |
| Strain, strain background (S. cerevisiae) | hhf2-K16Q Brn1-FLAG | This Paper | yTT7394 | MATa RAD5+ ura3-1 hht1-hhf1::Nat hht2- hhf2::Hyg trp1-1::pRS404- HHT2-hhf2-K16Q Brn1- 2L-3FLAG::KanMX |
| Strain, strain background (S. cerevisiae) | hhf2-K16Q Brn1-FLAG | This Paper | yTT7395 | MATa RAD5+ ura3-1 hht1-hhf1::Nat hht2- hhf2::Hyg trp1-1::pRS 404-HHT2-hhf2-K16Q Brn1-2L-3FLAG::KanMX |
| Strain, strain background (S. cerevisiae) | HTA1 | This Paper | yTT6767 | MATa W303 Rad5+ ade2-1 can1-100 his3- 11,15 leu2-3,112 ura3-1 hta1-htb1::Hyg hta2- htb2::Nat trp1-1::pRS 404-HTA1-HTB1 |
| Strain, strain background (S. cerevisiae) | HTA1 | This Paper | yTT6773 | MATa W303 Rad5+ ade2-1 can1-100 his3- 11,15 leu2-3,112 ura3- 1 hta1-htb1::Hyg hta2- htb2::Nat trp1-1::pRS 404-HTA1-HTB1 |
| Strain, strain background (S. cerevisiae) | hta1-E57A | This Paper | yTT6768 | MATa W303 Rad5+ ade2-1 can1-100 his3- 11,15 leu2-3,112 ura3-1 hta1-htb1::Hyg hta2- htb2::Nat trp1-1::pRS404- hta1-E57A-HTB1 |
| Strain, strain background (S. cerevisiae) | hta1-E57A | This Paper | yTT6774 | MATa W303 Rad5+ ade2-1 can1-100 his3-11, 15 leu2-3,112 ura3-1 hta1- htb1::Hyg hta2-htb2::Nat trp1-1::pRS404-hta1- E57A-HTB1 |
| Strain, strain background (S. cerevisiae) | hta1-E65A | This Paper | yTT6769 | MATa W303 Rad5+ ade2-1 can1-100 his3- 11,15 leu2-3,112 ura3-1 hta1-htb1::Hyg hta2- htb2::Nat trp1-1::pRS404- hta1-E65A-HTB1 |
| Strain, strain background (S. cerevisiae) | hta1-E65A | This Paper | yTT6776 | MATa W303 Rad5+ ade2-1 can1-100 his3- 11,15 leu2-3,112 ura3-1 hta1-htb1::Hyg hta2- htb2::Nat trp1-1::pRS404- hta1-E65A-HTB1 |
| Strain, strain background (S. cerevisiae) | hta1-E93A | This Paper | yTT6772 | MATa W303 Rad5+ ade2-1 can1-100 his3- 11,15 leu2-3,112 ura3-1 hta1-htb1::Hyg hta2- htb2::Nat trp1-1::pRS404- hta1-E93A-HTB1 |
| Strain, strain background (S. cerevisiae) | hta1-E93A | This Paper | yTT6779 | MATa W303 Rad5+ ade2-1 can1-100 his3- 11,15 leu2-3,112 ura3-1 hta1-htb1::Hyg hta2- htb2::Nat trp1-1::pRS 404-hta1-E93A-HTB1 |
| Strain, strain background (S. cerevisiae) | hta1-E65A,D92A | This Paper | yTT6618 | MATa W303 Rad5+ ade2-1 can1-100 his3- 11,15 leu2-3,112 ura3- 1 hta1-htb1::Hyg hta2- htb2::Nat trp1-1::pRS 404-hta1-E65A, D92A-HTB1 |
| Strain, strain background (S. cerevisiae) | hta1-E65A,D92A | This Paper | yTT6765 | MATa W303 Rad5+ ade2-1 can1-100 his3-11, 15 leu2-3,112 ura3-1 hta1- htb1::Hyg hta2-htb2::Nat trp1-1::pRS404-hta1- E65A,D92A-HTB1 |
| Antibody | H2B (polyclonal, rabbit) | Active Motif | 39237 | WB (1:5000) |
| Antibody | H3 (rabbit polyclonal) | Abcam | 1791 | ChIP (1 μl) |
| Antibody | H4 penta-acetyl (rabbit polyclonal) | MilliporeSigma | 06-946 | WB (1:1000)ChIP (2 μl) |
| Antibody | Rpb3 (mouse monoclonal) | BioLegend | 665003 | ChIP (2 μl) |
| Antibody | FLAG M2 (mouse monoclonal) | Sigma-Aldrich | F1804 | WB (1:3000)ChIP (4 μl) |
| Chemical compound | Percoll | GE | 17-0891-01 | |
| Chemical compound, drug | Trichostatin A (TSA) | TCI | T247710MG | |
| Chemical compound, drug | Disuccinimidyl glutarate (DSG) | Thermo Fisher Scientific | PI20593 | |
| Commercial assay or kit | MinElute PCR Cleanup Kit | Qiagen | 28004 | |
| Other | Dynabeads M-280 sheep anti-mouse IgG beads | Invitrogen | 11201D | 20 μl |
| Other | Dynabeads Protein G beads | Invitrogen | 10004D | 20 μl |
| Commercial assay or kit | Ovation Ultralow v2 Kit | Tecan | 0344 | |
| Other | PTFE printed slides | Electron Microscopy Sciences | 63430-04 |
Additional files
-
Supplementary file 1
Statistical values for all chromatin volume measurements, including n, mean, and standard deviation for all replicates as well as p values of comparisons between samples.
- https://cdn.elifesciences.org/articles/72062/elife-72062-supp1-v2.docx
-
Transparent reporting form
- https://cdn.elifesciences.org/articles/72062/elife-72062-transrepform1-v2.docx
Download links
A two-part list of links to download the article, or parts of the article, in various formats.
Downloads (link to download the article as PDF)
Open citations (links to open the citations from this article in various online reference manager services)
Cite this article (links to download the citations from this article in formats compatible with various reference manager tools)
Local chromatin fiber folding represses transcription and loop extrusion in quiescent cells
eLife 10:e72062.
https://doi.org/10.7554/eLife.72062


