Stereospecific lasofoxifene derivatives reveal the interplay between estrogen receptor alpha stability and antagonistic activity in ESR1 mutant breast cancer cells
- Ben May Department for Cancer Research, University of Chicago, United States
- Institute for Research in Immunology and Cancer, Université de Montréal, Canada
- Department of Cancer Biology, Loyola University Chicago, United States
Figures
Figure 1
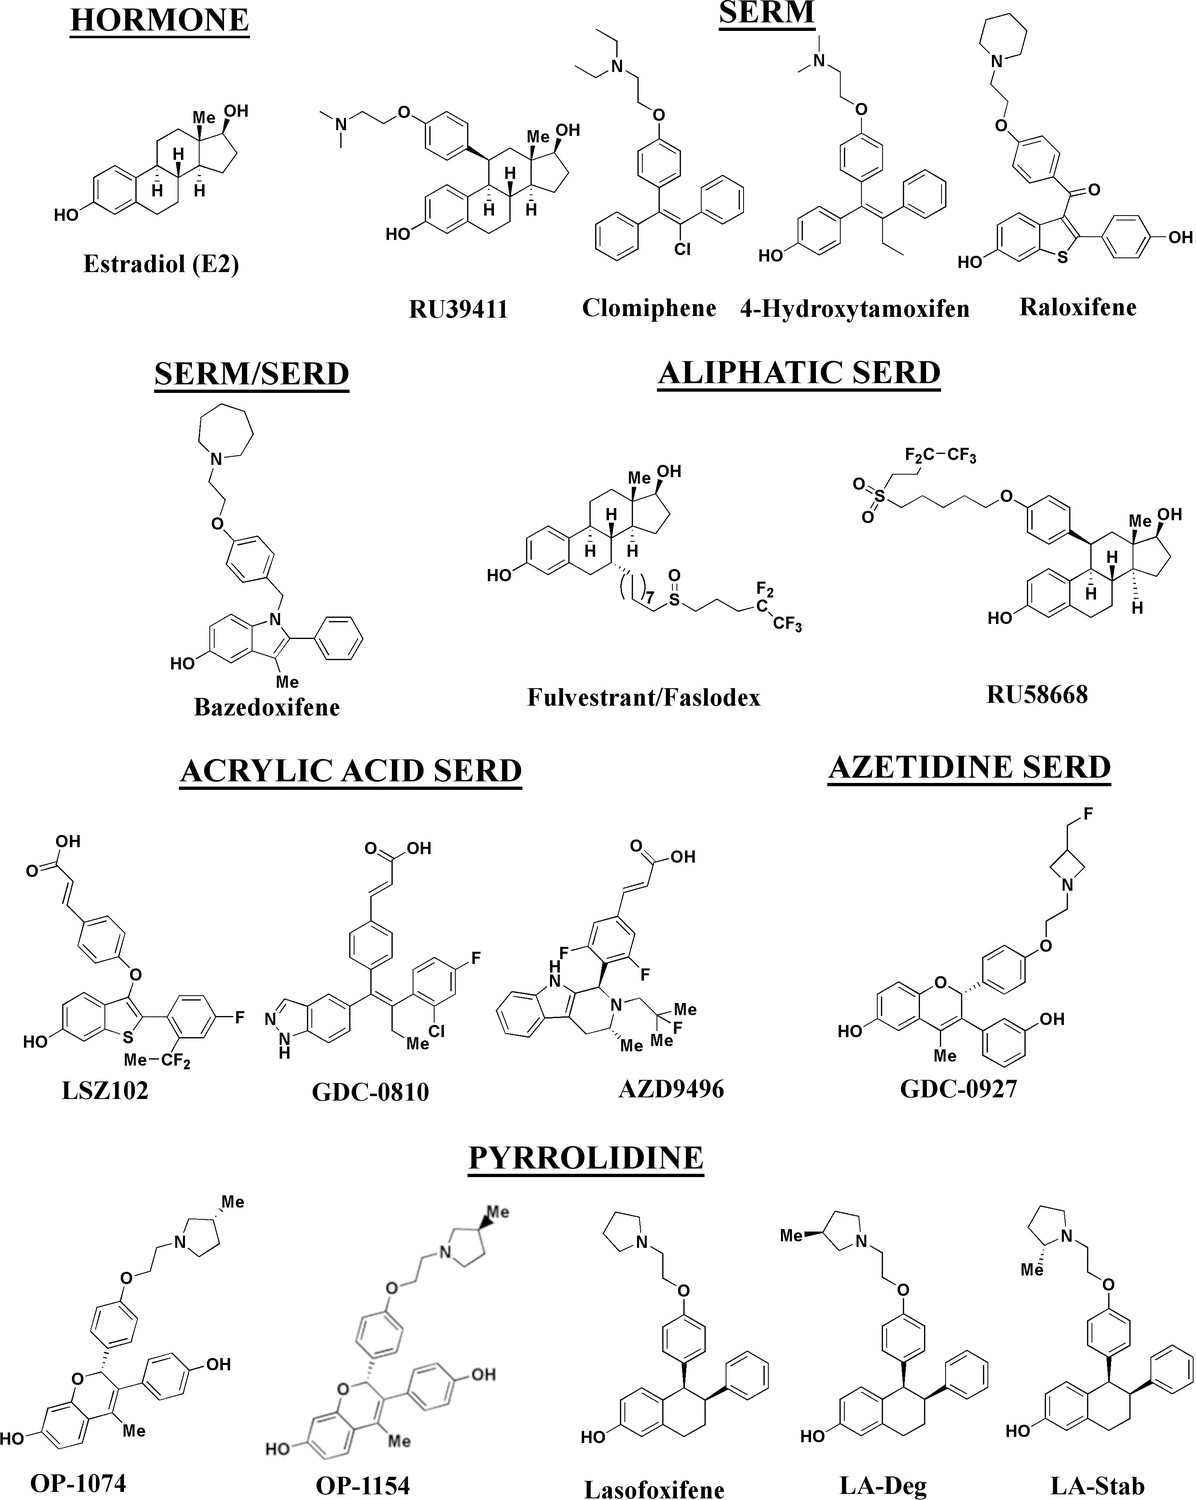
Estrogen receptor alpha ligands evaluated in this study including estradiol, selective estrogen receptor modulators (SERMs), and selective estrogen receptor degraders/downregulators (SERDs).
Figure 2 with 3 supplements
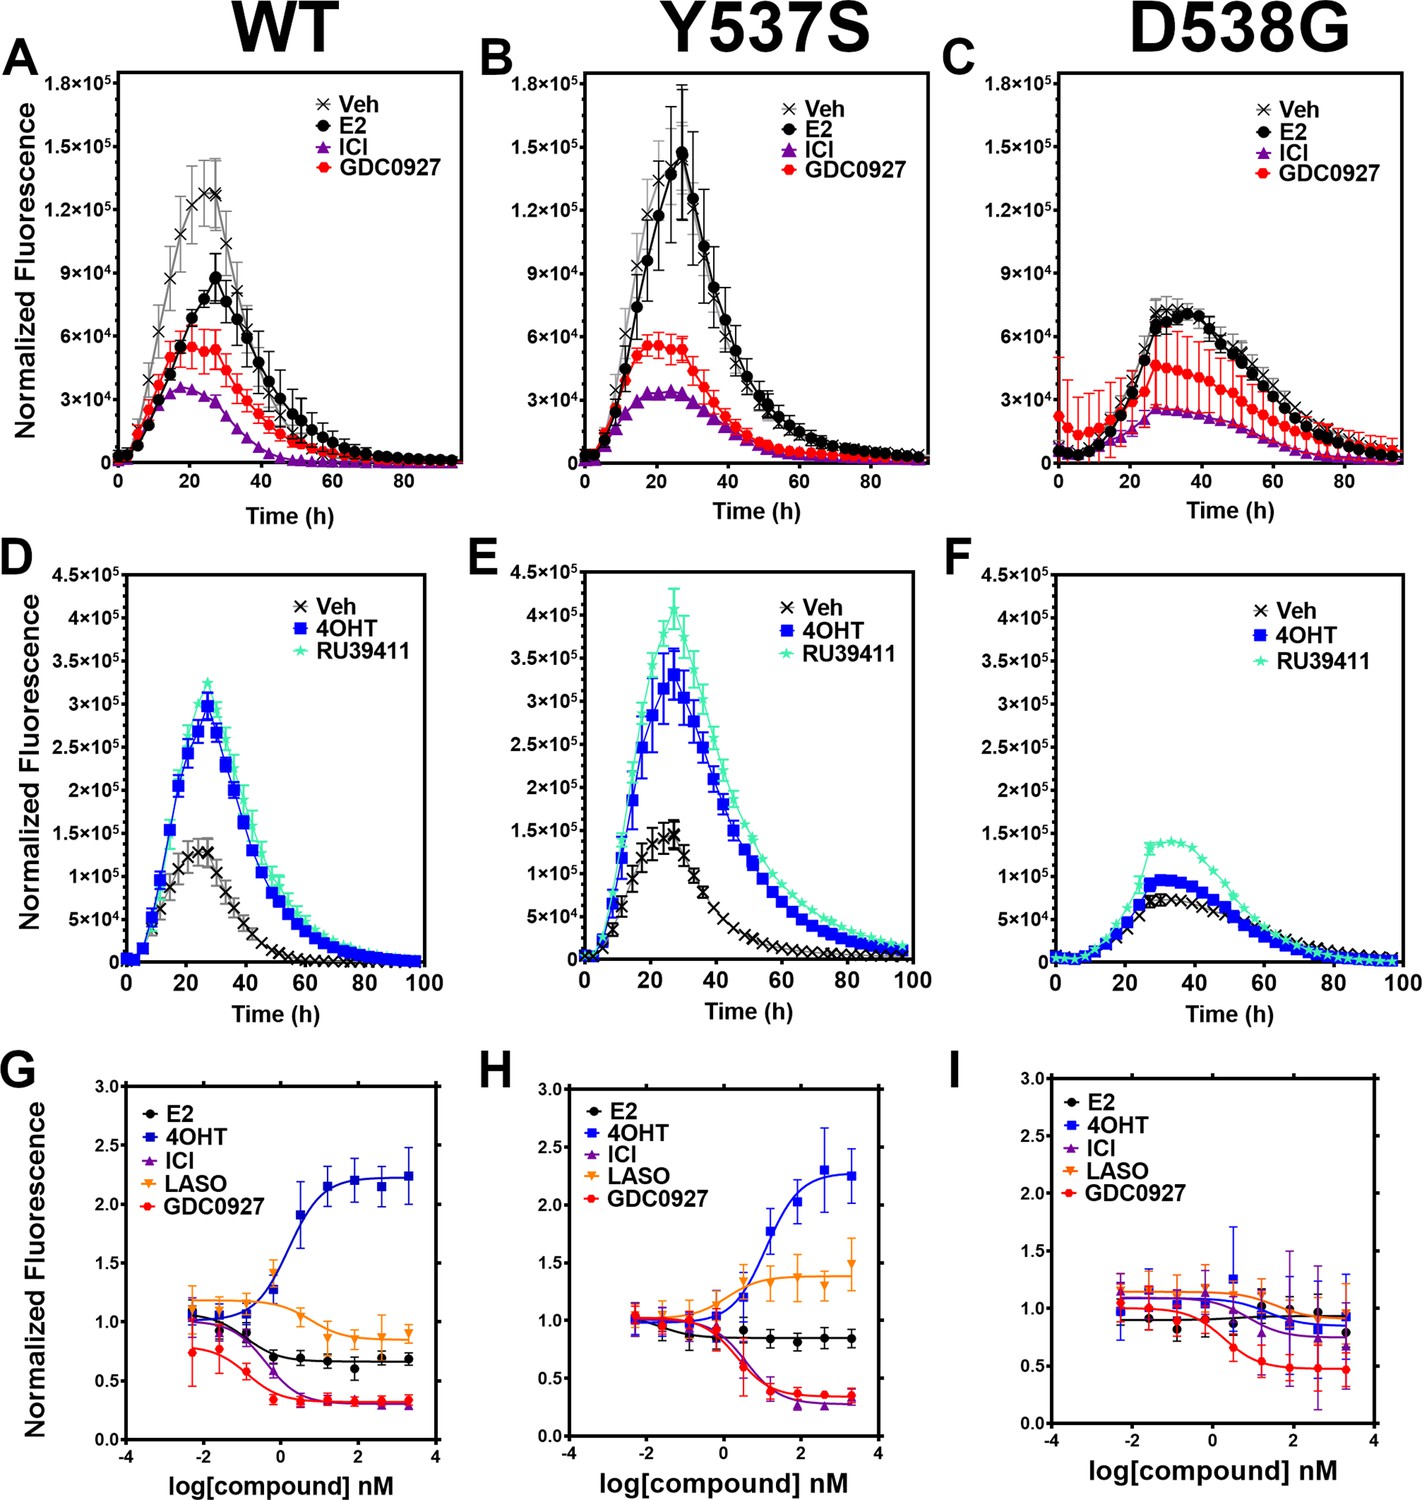
Impact of ligand and mutation on Halo-estrogen receptor alpha (ERα) lifetime in T47D breast cancer cells.
(A–C) Halo-618 fluorescence measured every 4 hr in T47D cells expressing WT halo-ERα (A), Y537S (B), and D538G (C) treated over 100 hr with vehicle (Veh), 1 μM estradiol (E2), fulvestrant (ICI), or GDC0927 following induction of expression. (D–F) Same conditions as in (A–C), except that cells were treated with Veh, 4-hydroxytamoxifen (4OHT) or RU39411. Data are normalized to cell count in each well and are shown as the mean of two biological replicates ± SD (G–I) TMR signal in T47D breast cancer WT (G), Y537S (H), or D538G (I) ERα treated for 24 hr with between 2.5 pm and 1 μM E2, 4OHT, ICI, lasofoxifene (Laso), or GDC0927. All data are normalized to vehicle and are shown as the mean of two biological replicates ± SD.
-
Figure 2—source data 1
Ligand and mutational influences on estrogen receptor alpha (ERα) cellular turnover after 24 hr.
Data were normalized by cell count. Antiestrogens are categorized as stabilizers if their maximum signal for WT ERα at 5 µM is greater than 1.5, neutral if between 0.9 and 1.1, and degrader if less than 0.9 in this assay.
- https://cdn.elifesciences.org/articles/72512/elife-72512-fig2-data1-v4.docx
Figure 2—figure supplement 1

Doxycycline induction of Halo-ERα after 24 hr.
Data are representative of the mean of three replicates ± standard error.
Figure 2—figure supplement 2
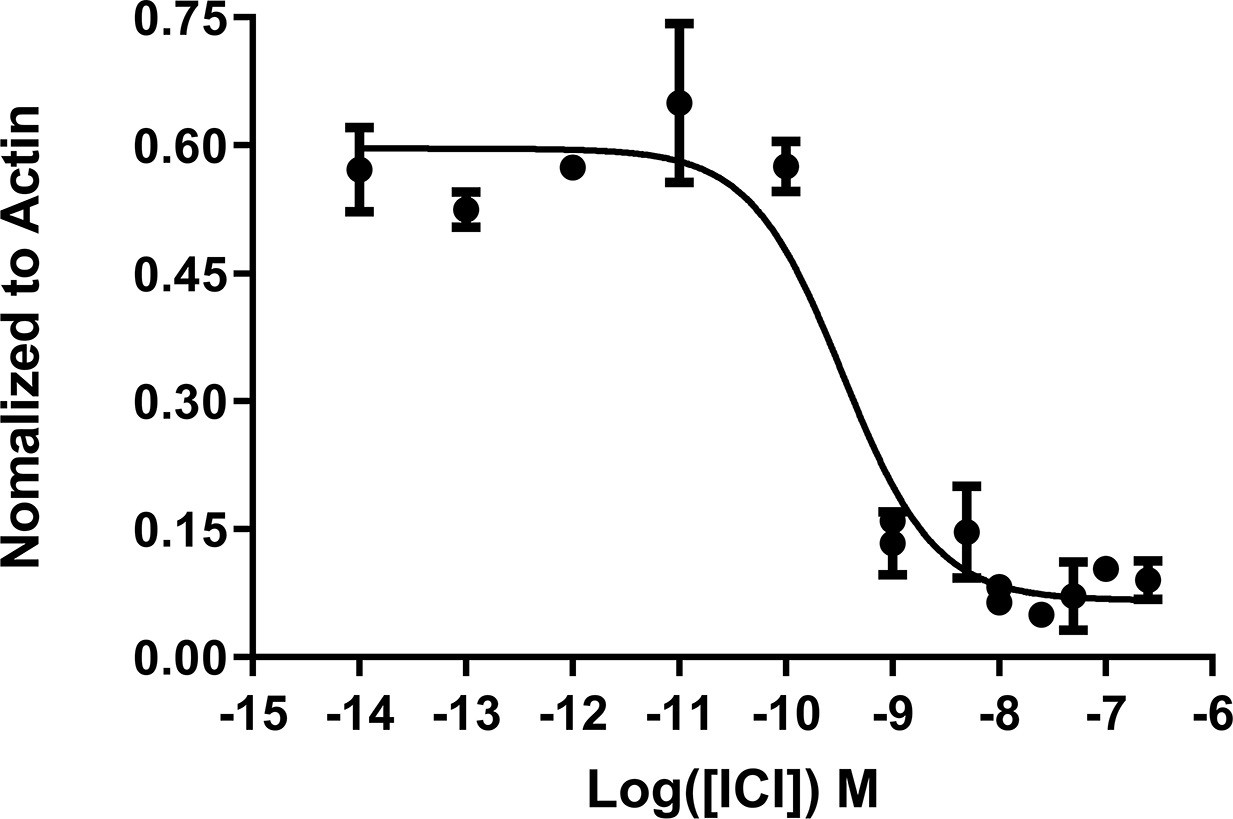
IC50 of fulvestrant (ICI) in normal T47D cells.
Data are representative of three replicates per concentration ± SD. All data were normalized to actin control in the individual treatments.
Figure 2—figure supplement 3
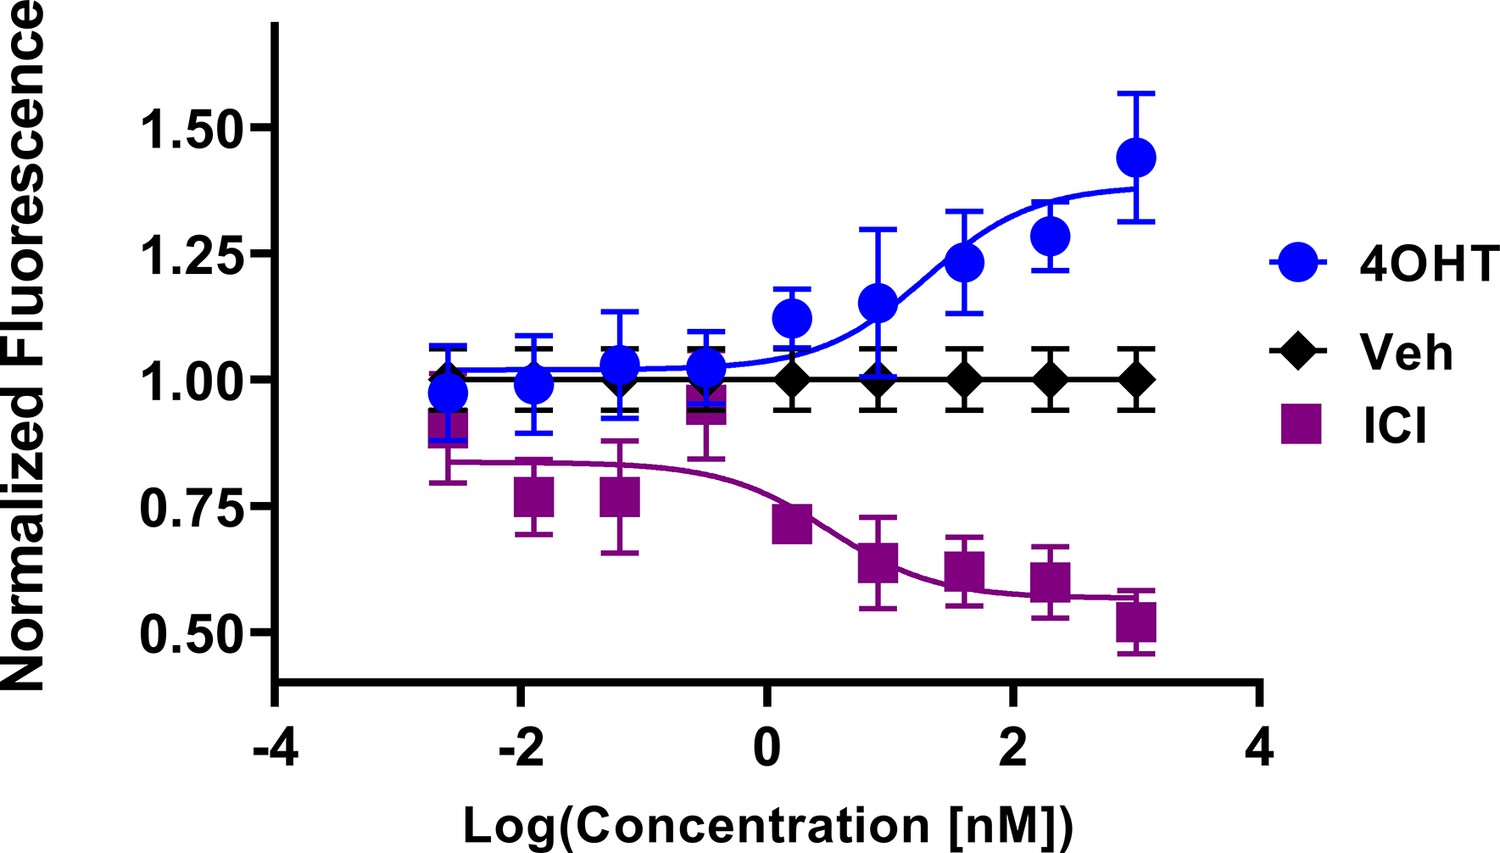
In-cell western of T47D breast cancer cells treated for 24 hr with 4-hydroxytamoxifen (4OHT) or fulvestrant (ICI).
Data are shown as the mean of 3 replicates ± SD.
Figure 3 with 2 supplements
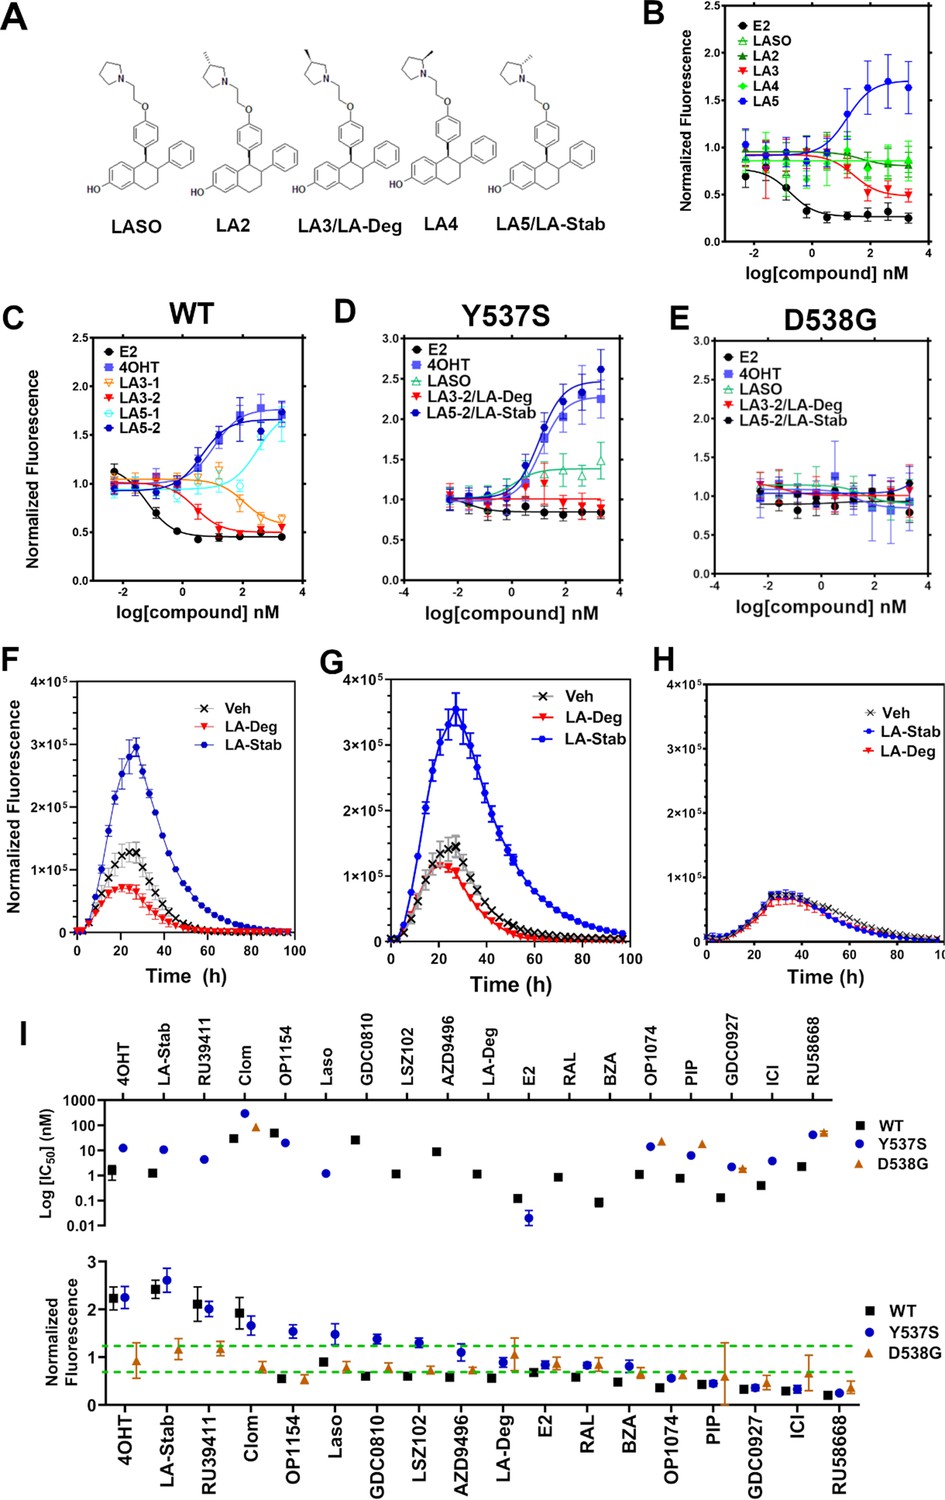
Stereospecific methyl additions onto the pyrrolidine of lasofoxifene (Laso) impact estrogen receptor alpha (ERα) levels in T47D breast cancer cells.
(A) Chemical structures of Laso and the synthesized stereospecific methyl derivatives. (B) Dose-response curves of hormone (E2) alongside LASOLaso and derivatives after 24 hr treatment for WT halo-ERα. (C) Dose-response curves of chirally purified LA3 and LA5 alongside E2 and 4-hydroxytamoxifen (4OHT) for WT halo-ERα. LA3/5-1 and LA3/5-2 represent the first and second major peaks separated by chiral affinity chromatography. (D/E) Dose-response curves of LA-Deg and LA-Stab for Y537S and D537G halo-ERα after 24 hr compared to E2, Laso, and 4OHT. (F–H) TMR fluorescence measured every 4 hr in T47D breast cancer cells with WT halo-ERα (F), Y537S (G), and D538G (H) treated over 100 hr at 1 μM LA-Stab or LA-Deg following induction of expression. Data are shown as the mean of two biological replicates ± SD.
Figure 3—figure supplement 1
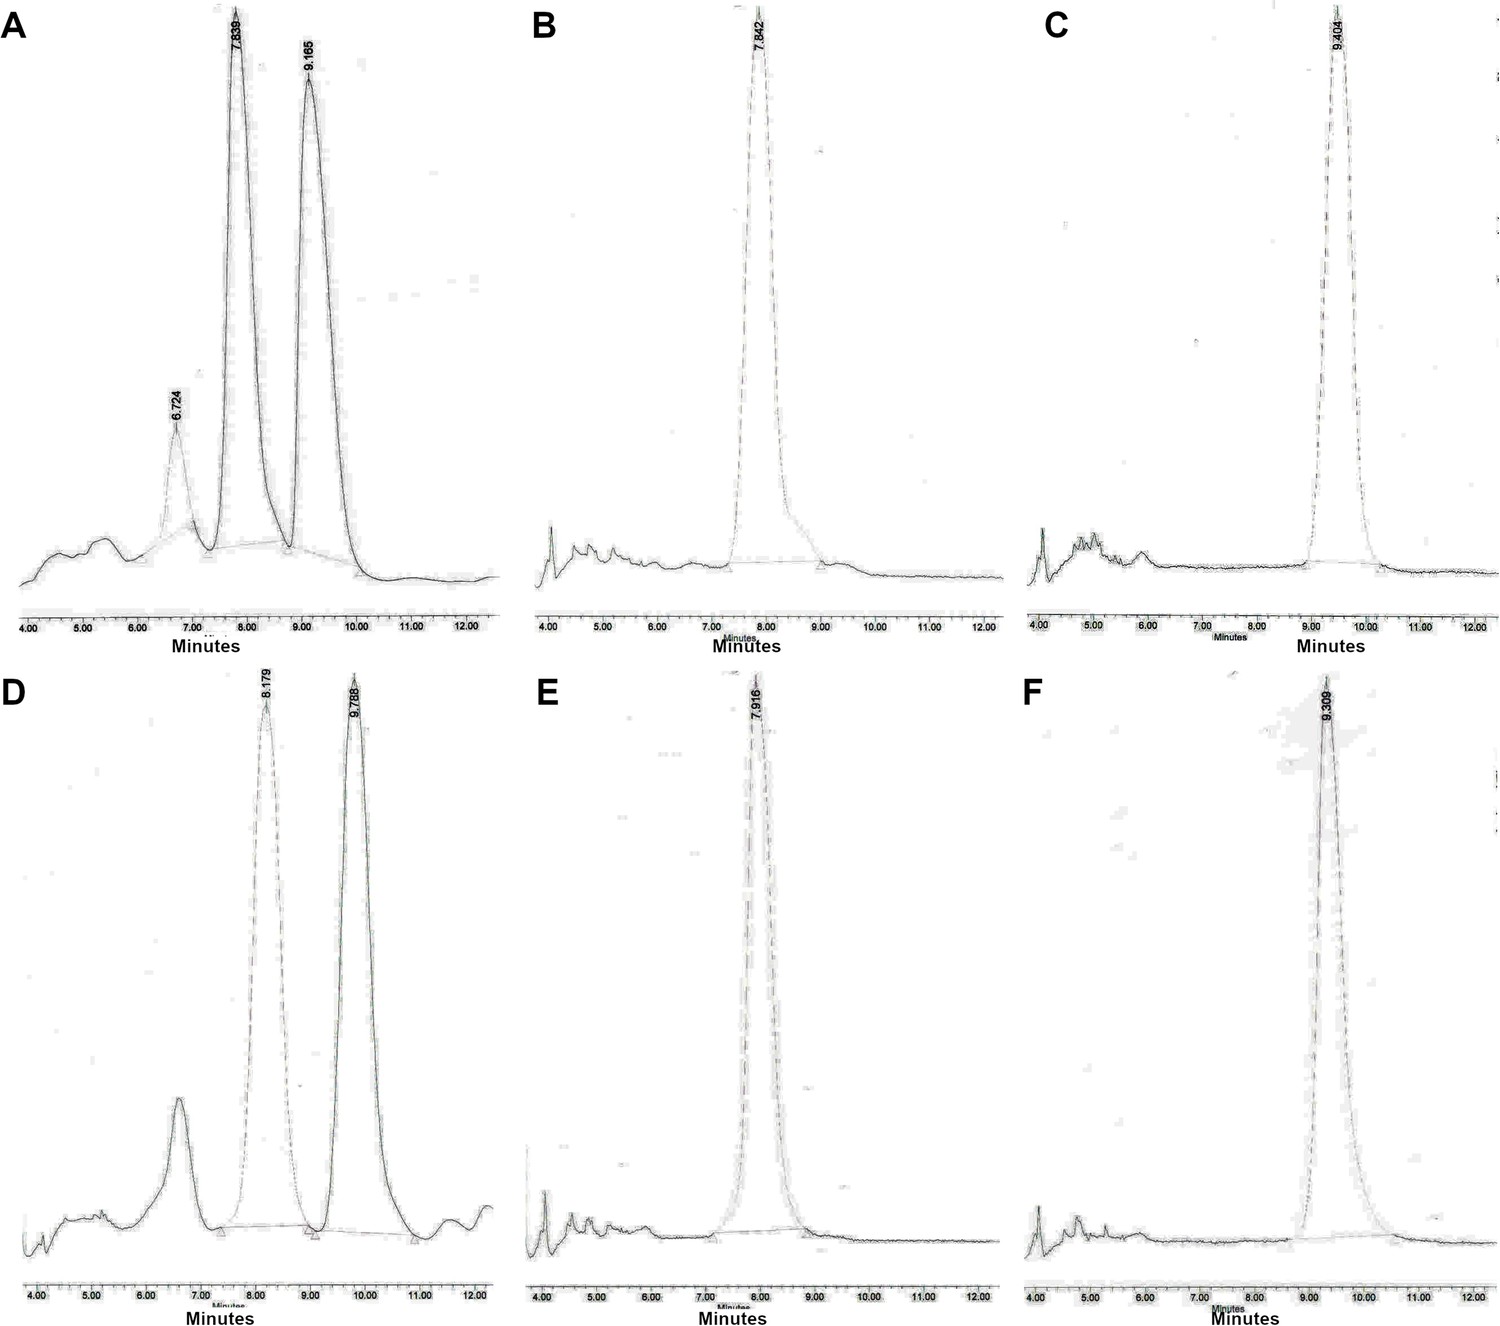
Chiral separation of 3 R (LA-Deg) and 2S-methylpyrrolidine (LA-Stab) lasofoxifene derivatives.
(A) Chromatogram of LA-Deg chiral separation. (B) Purification of the LA-Deg peak 1. (C) Purification of LA-Deg peak 2. (D) Chromatogram of LA-Stab chiral separation. (E) Purification of LA-Stab peak 1. (F) Purification of LA-Stab peak 2.
Figure 3—figure supplement 2
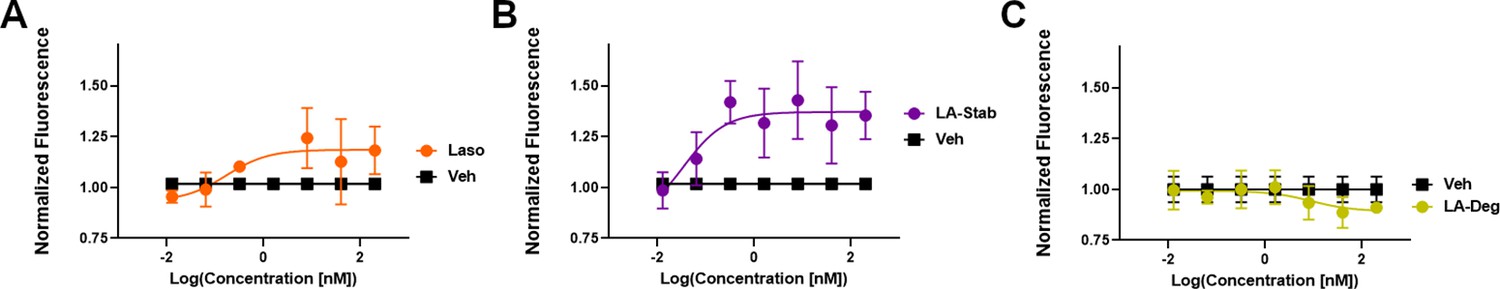
In-cell western of T47D breast cancer cells treated with lasofoxifene (Laso).
(A), LA-Stab (B), or LA-Deg (C) for 24 hours. Data shown are the mean of 3 replicates ± SD.
Figure 4 with 1 supplement
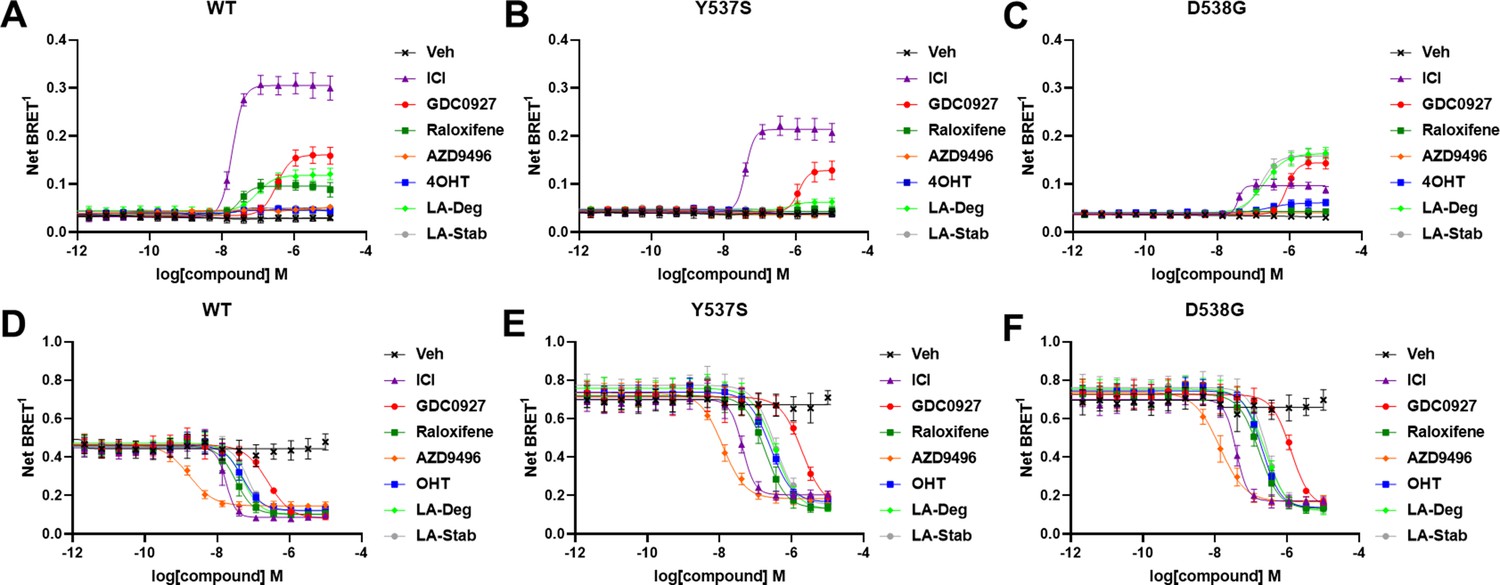
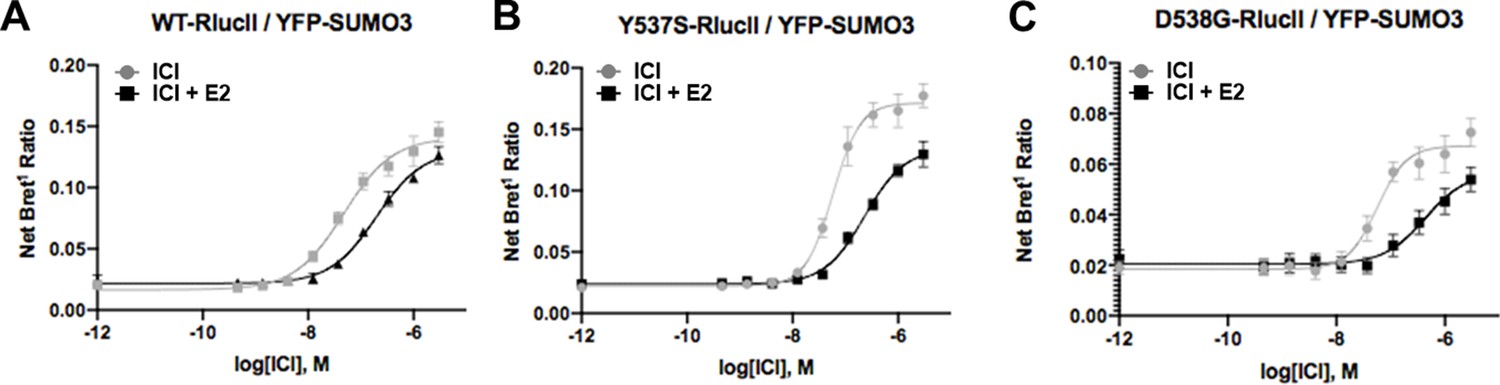
Impact of Y537S and D538G mutation on ligand-induced estrogen receptor alpha (ERα) SUMOylation and SRC1 coactivator binding.
SUMOylation of WT (A), Y537S (B), or D538G (C) ERα in the presence of vehicle, fulvestrant, GDC0927, raloxifene, AZD9496, 4-hydroxytamoxifen (4OHT), lasofoxifene-degrader (LA-Deg), or lasofoxifene-stabilizer (LA-Stab). Data are shown as the mean ± SEM n=3–5 biological replicates. Association of WT (D), Y537S (E), and D538G (F) ERα and the receptor-interacting domain of SRC1. Data are shown as the mean ± SEM, n=3 biologic replicates.
-
Figure 4—source data 1
Ligand and Mutational Influences on Estrogen Receptor SUMOylation.
The SEM values for IC50s were all within 20% except for Ral with WT (21.4%) and OHT for D538G (26.2%).
- https://cdn.elifesciences.org/articles/72512/elife-72512-fig4-data1-v4.docx
-
Figure 4—source data 2
IC50 of SRC1 receptor interacting domain binding to WT and mutant estrogen receptor alpha.
The SEM values for IC50s were all within 50% except for D538G with AZD9496 (52%).
- https://cdn.elifesciences.org/articles/72512/elife-72512-fig4-data2-v4.docx
Figure 4—figure supplement 1
Fulvestrant-induced SUMOylation WT.
(A), Y537S (B), and D538G (C) estrogen receptor alpha in the presence and absence of 5 nM estradiol (E2). Data are mean of three biological replicates ± SD.
Figure 5
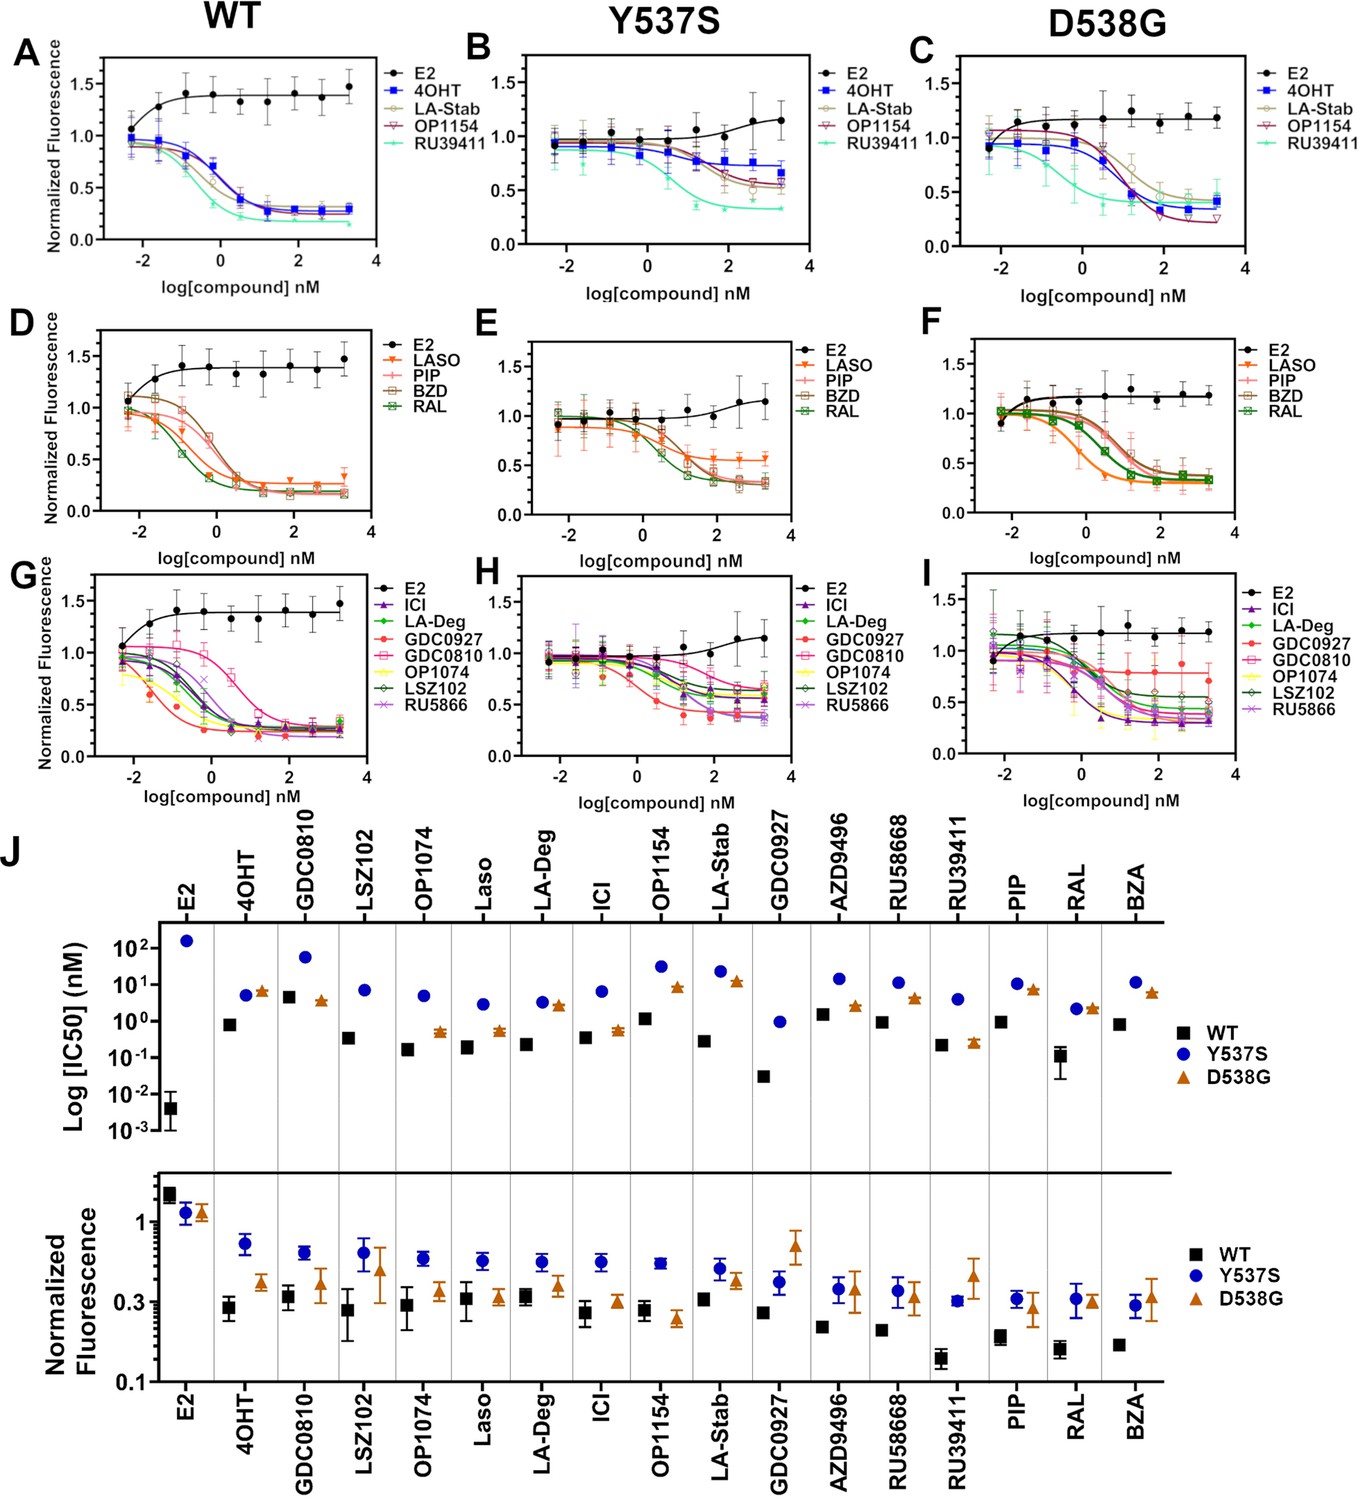
Transcriptional reporter gene assays in MCF7 cells with WT, WT/Y537S, and WT/D538G ESR1.
Selective estrogen receptor modulators (SERMs) in (A) WT, (B) WT/Y537S, and (C) WT/D538G MCF7 cells. SERM/selective estrogen receptor degraders/downregulators (SERDs) in (D) WT, (E) WT/Y537S, (F) WT/D538G MCF7 cells. SERDs in (G) WT, (H) WT/Y537S, and (I) WT/D538G MCF7 cells. (J) Summary of IC50 and normalized fluorescence at 5 μM compound after 24 hr for each compound. Data are ordered from left to right based on normalized fluorescence at highest dose in Y573S MCF7. Poor IC50 fits were omitted. Data are shown as the mean of two biologic replicates ± SD. All data are normalized to cell count in their respective wells.
-
Figure 5—source data 1
Ligand and mutational influences on estrogen receptor alpha reporter gene transcription after 24 hr.
Data were normalized by cell count.
- https://cdn.elifesciences.org/articles/72512/elife-72512-fig5-data1-v4.docx
Figure 6
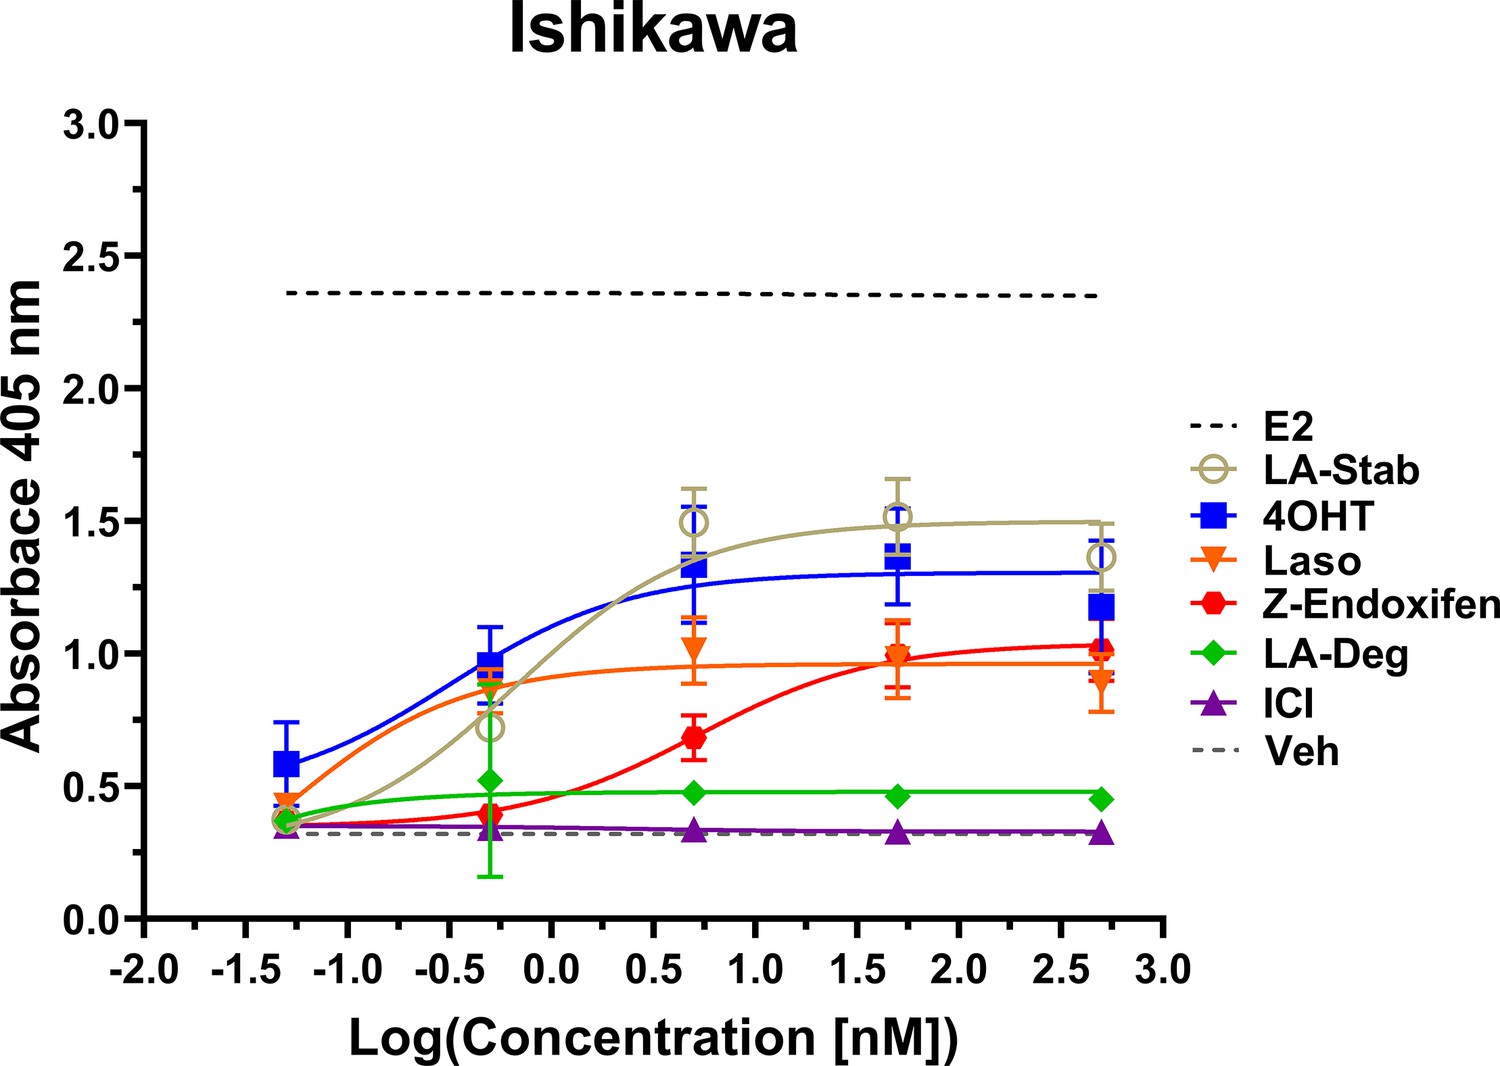
LA-Stab induces uterotrophic activity.
Ishikawa cells treated with representative selective estrogen receptor modulators (SERM) or selective estrogen receptor degraders/downregulators (SERD) for 3 days in the absence of E2 and assayed for AP activity. Data shown are the mean ± SD. (n=3 independent replicates, 9 technical replicates total).
-
Figure 6—source data 1
Selective estrogen receptor modulator-agonist activities in uterine epithelial cells measured by induction of alkaline phosphatase.
- https://cdn.elifesciences.org/articles/72512/elife-72512-fig6-data1-v4.docx
Figure 7
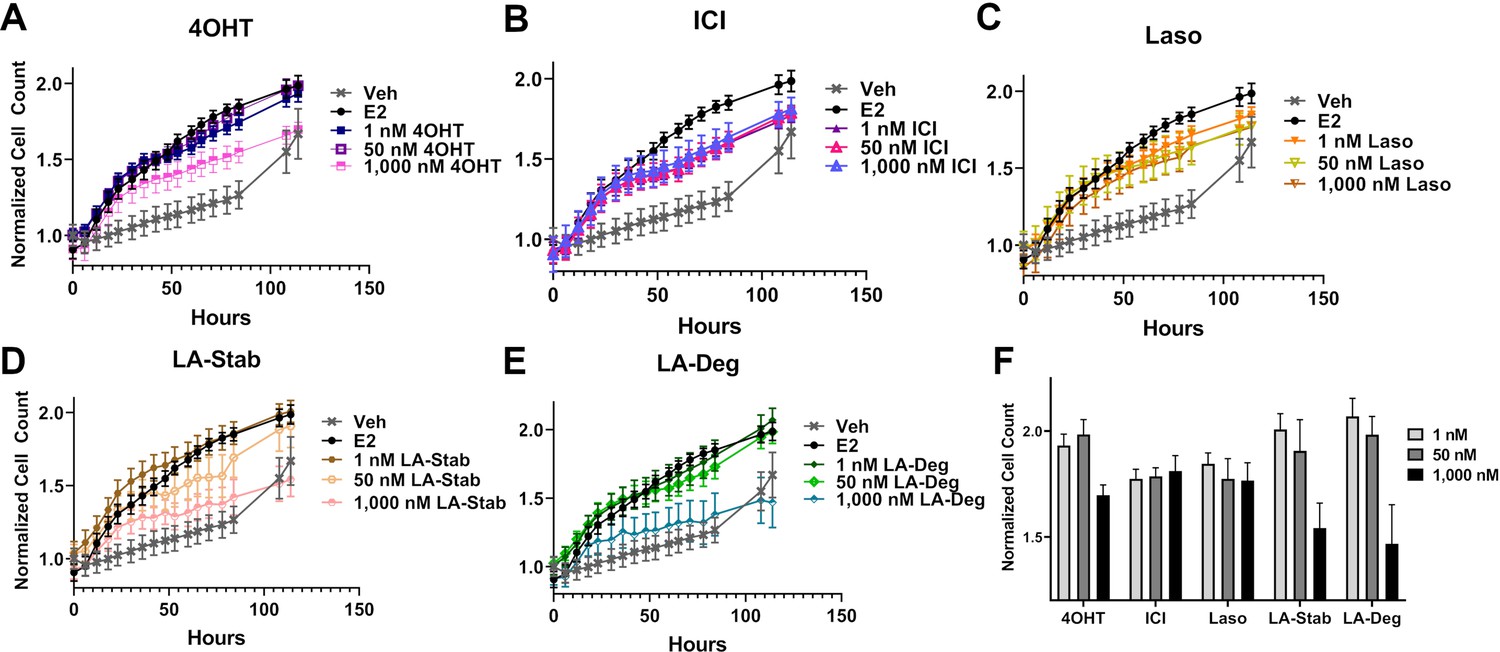
Anti-proliferative activities of selective estrogen receptor modulators (SERMs) and selective estrogen receptor degraders/downregulators (SERDs) in MCF7 cells with heterozygous WT/Y537S ESR1.
(A) 4-hydroxytamoxifen (4OHT). (B) Fulvestrant (ICI). (C) Lasofoxifene (Laso). (D) Lasofoxifene-Stabilizer (LA-Stab). (E) Lasofoxifene-Degrader (LA-Deg). (F) Normalized cell count after 84 hr. All antagonist treatments are in the presence of 1 nM estradiol (E2). All data are normalized to initial cell count of the vehicle wells in their respective plates. All data are mean ± SEM for three biological replicates and a total of nine technical replicates.
Figure 8 with 3 supplements

Enforcing helix 12 AF-2 cleft burial enhances Y537S estrogen receptor alpha (ERα) transcriptional inhibition.
(A) Superposition of each monomer in the asymmetric unit of WT (green) or Y537S (cyan) ERα LBD in complex with RAL. (B) 2mFo-DFc difference map (yellow mesh) of the electron density around E380 (magenta) and H12 (cyan) of the Y537S-RAL structure contoured to 1.0 σ. (C) Hydrogen bond formed between E380 and S537 in Chain A of Y537S-RAL. (D) Superposition of each monomer in the asymmetric unit of WT (green) or Y537S (cyan) ERα in complex with 4OHT. (E) 2mFo-DFc difference map (yellow mesh) of the electron density around E380 (magenta) and H12 (cyan) of the Y537S-4OHT structure contoured to 1.0 σ. (F) Position of S537 relative to E380 in the Y537S-4OHT structure. Raloxifene PDBs: 7KBS and 7UJC and 4OHT PDBs: 5 W9C and 7UJ8.
-
Figure 8—source data 1
X-ray crystal structure data collection and refinement statistics.
- https://cdn.elifesciences.org/articles/72512/elife-72512-fig8-data1-v4.docx
Figure 8—figure supplement 1
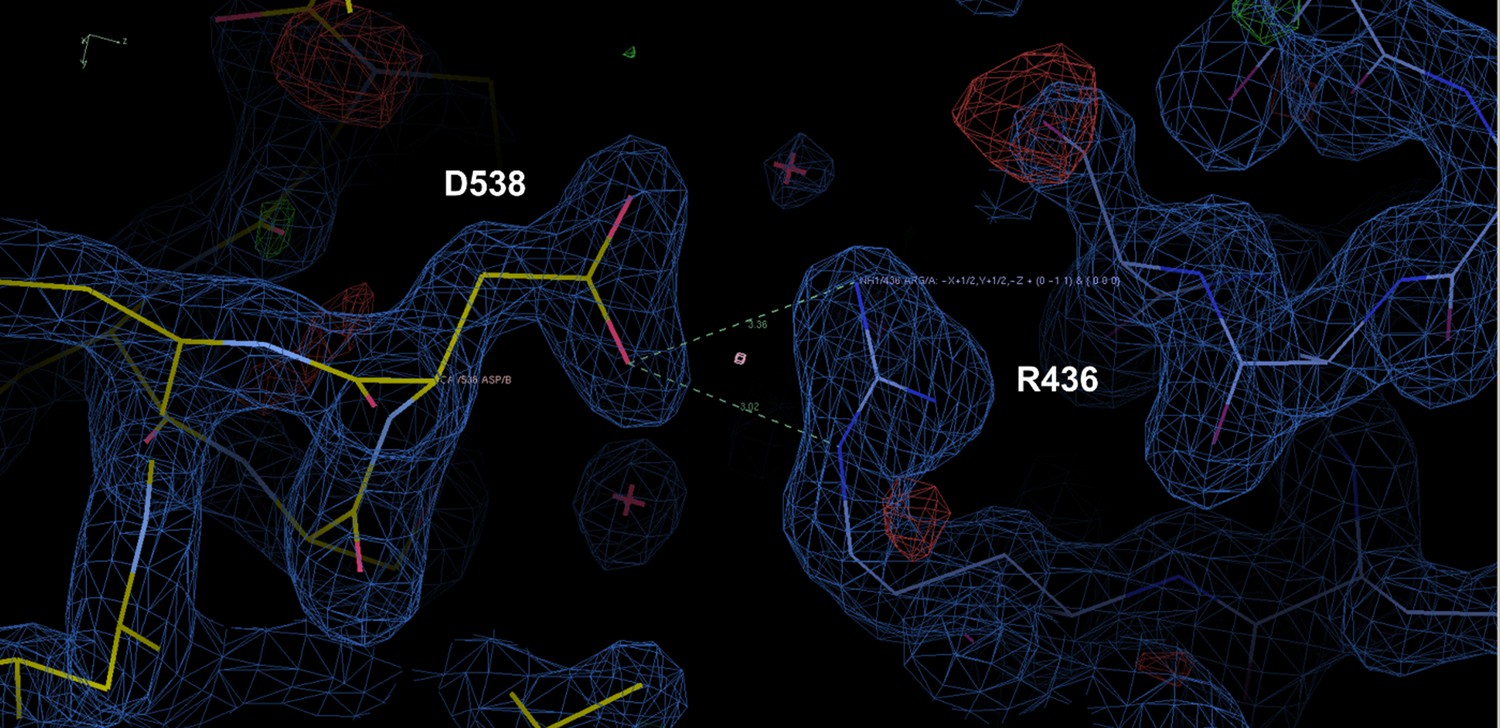
Representative crystal contact formed between D538 and R436 of a symmetry mate that pulls 537 S out of hydrogen bonding distance to E380.
Figure 8—figure supplement 2

Selective estrogen receptor modulators (SERMs) and selective estrogen receptor degraders/downregulators (SERDs) with increased transcriptional antagonistic efficacies show improved helix 12 (H12) packing in the AF-2 cleft.
Average main chain B-factors are shown at each H12 position normalized to average B-factor for each Y537S estrogen receptor alpha LBD structure. Lower B-factor indicates less mobility within the crystal.
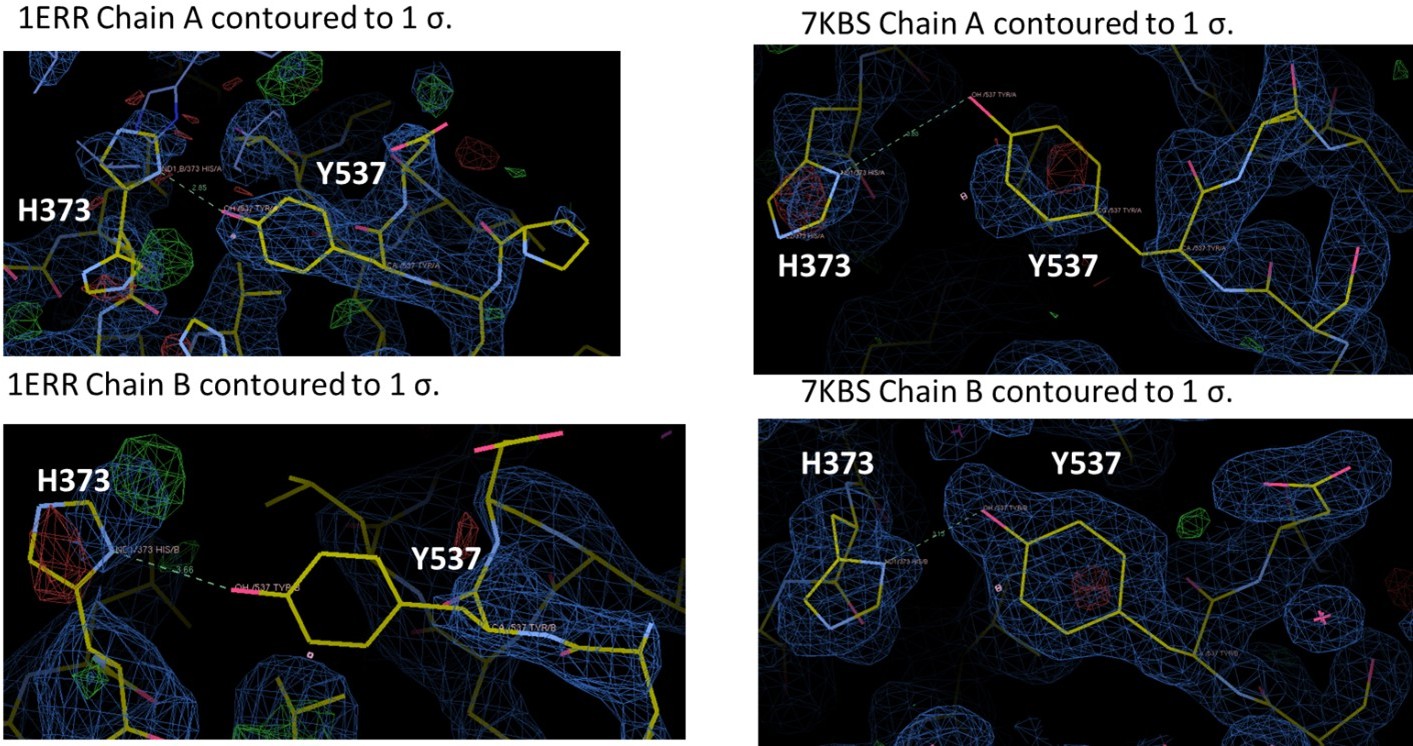
Figure 8—figure supplement 3
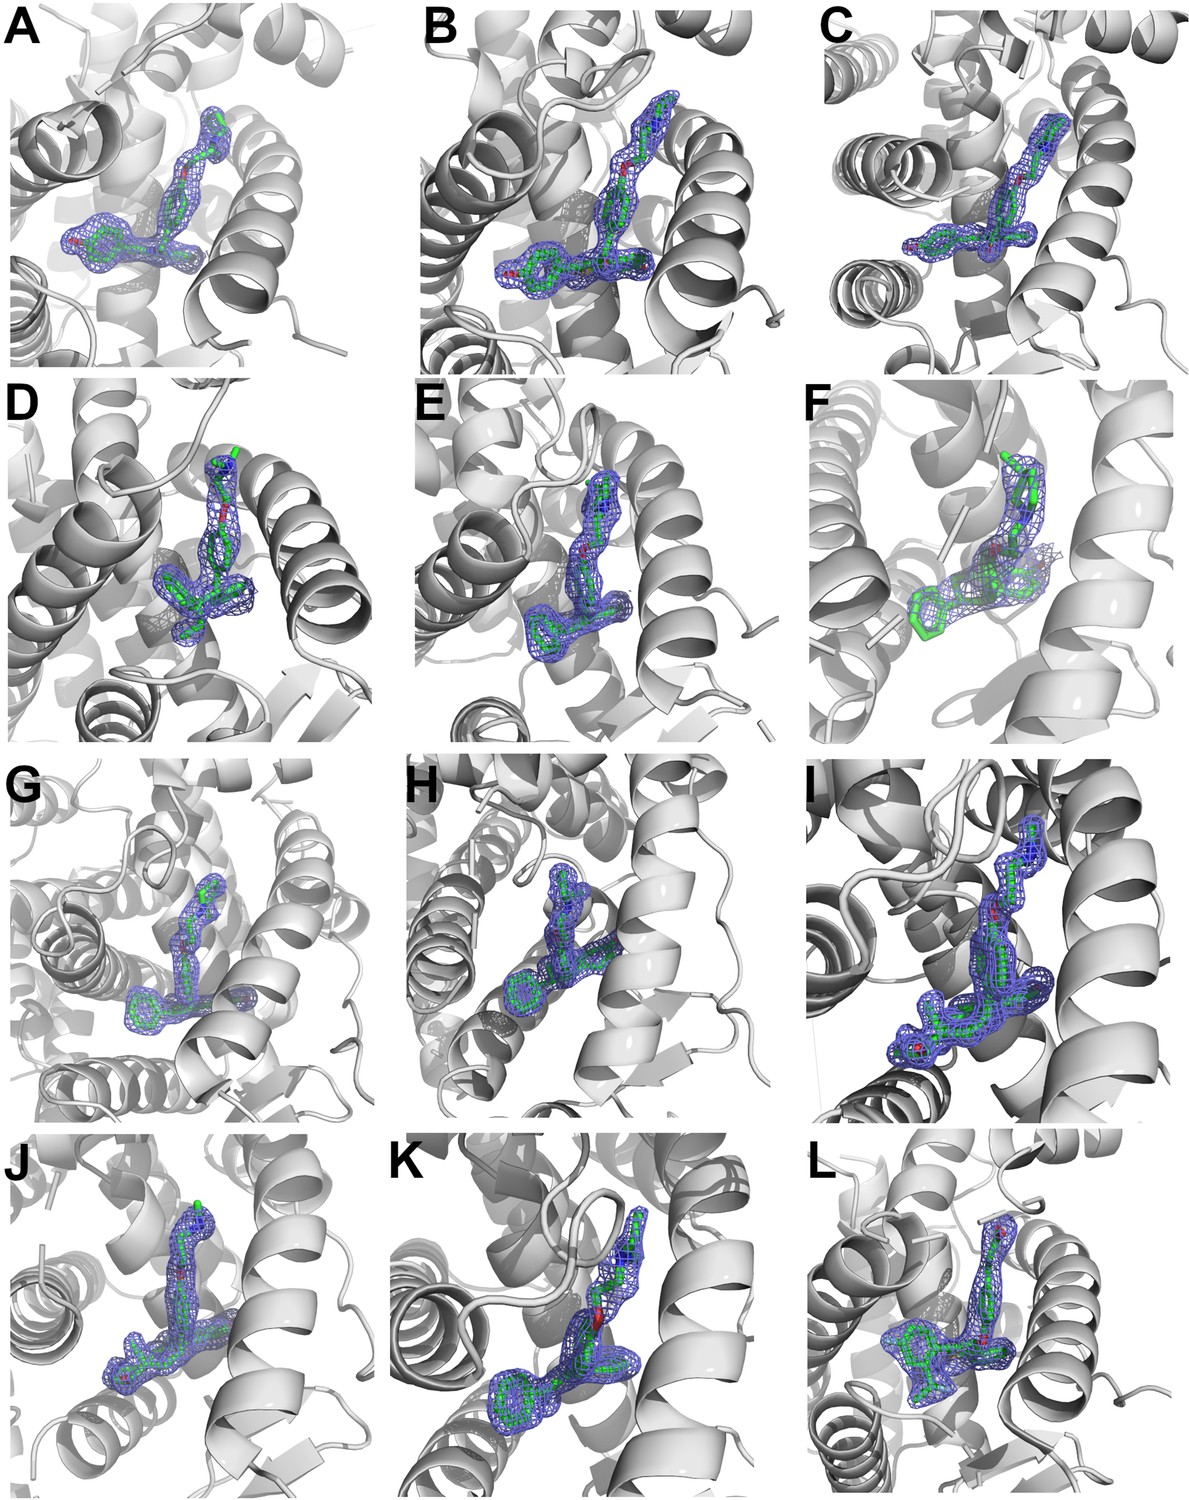
2mFo-DFc difference maps for antiestrogens in complex with WT and Y537S estrogen receptor alpha (ERα) LBD contoured to 1.5σ.
(A) Y537S-BZA. (B) WT-RAL. (C) Y537S-RAL. (D) Y537S-4OHT. (E) WT-LA-Deg. (F) Y537S-LA-Deg. (G) WT-LA-Stab. (H) Y537S-LA-Stab. (I) WT-RU39411. (J) Y537S-RU39411. (K) WT-Clomiphene. (L) Y537S-LSZ102. All ligands are shown as sticks, all maps are shown as blue mesh, and all protein are shown as light grey ribbons.
Figure 9
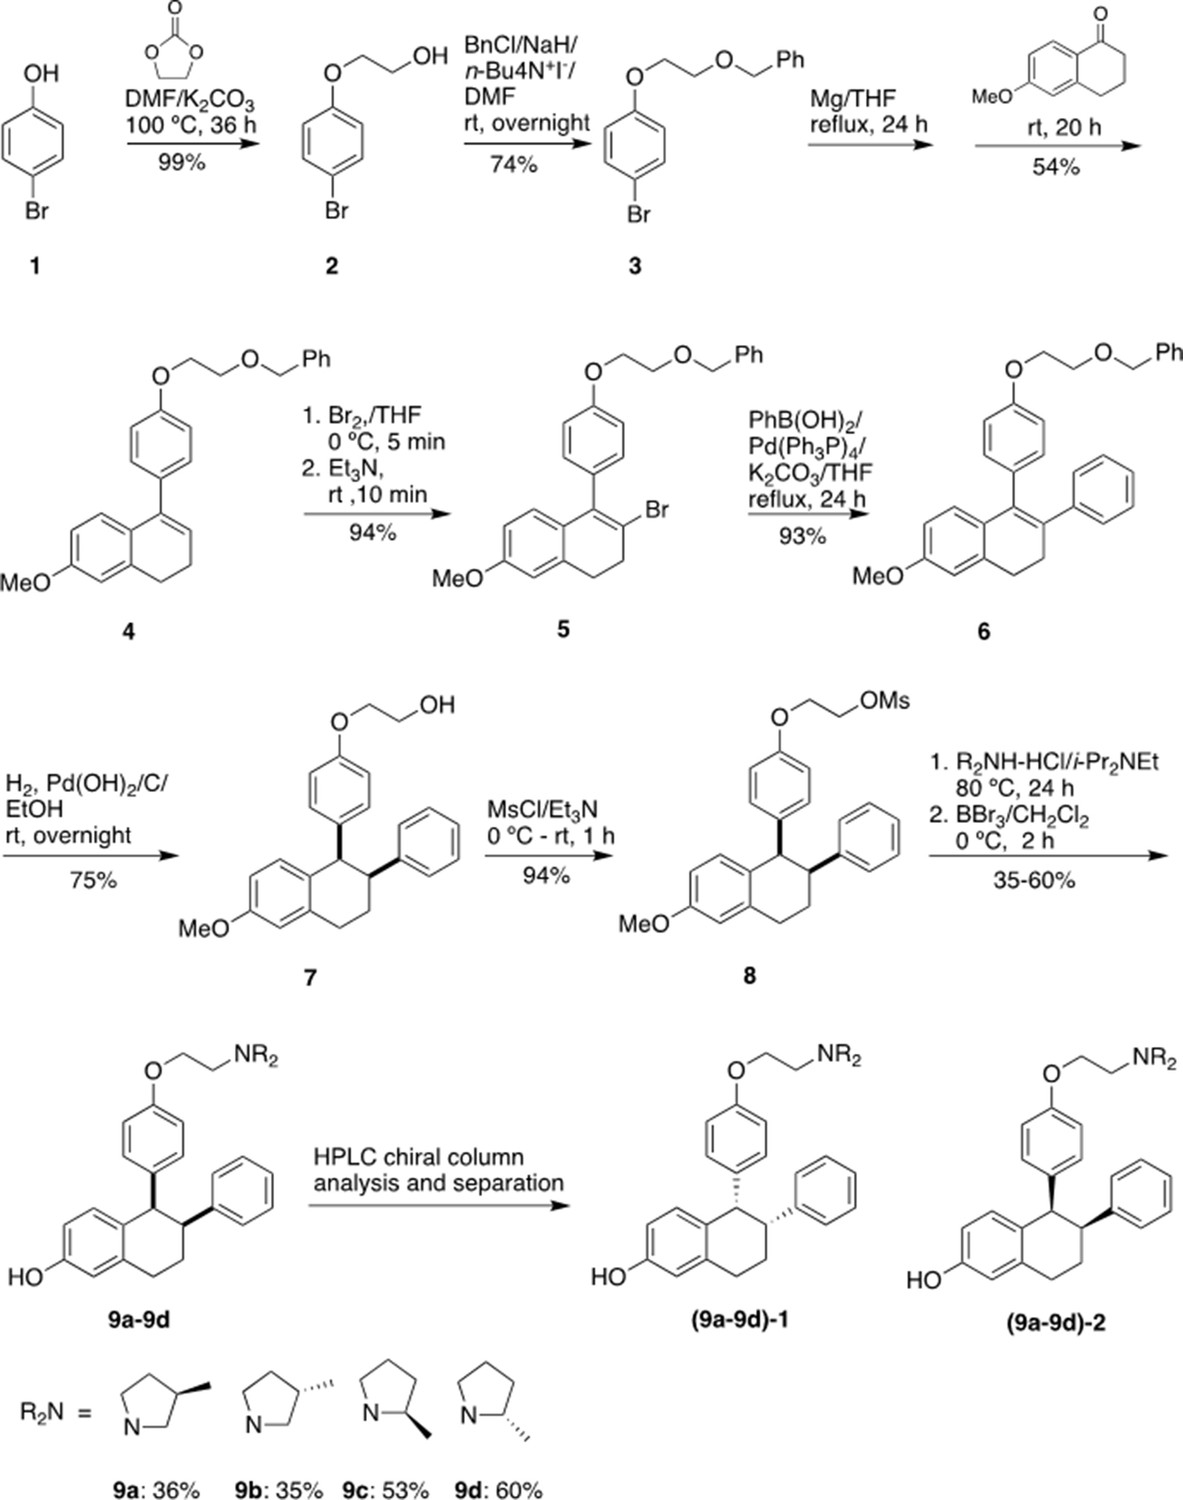
Experimental for the synthesis of lasofoxifene analogues (9a-9d).
Author response image 1
Author response image 2
Additional files
Download links
A two-part list of links to download the article, or parts of the article, in various formats.
Downloads (link to download the article as PDF)
Open citations (links to open the citations from this article in various online reference manager services)
Cite this article (links to download the citations from this article in formats compatible with various reference manager tools)
Stereospecific lasofoxifene derivatives reveal the interplay between estrogen receptor alpha stability and antagonistic activity in ESR1 mutant breast cancer cells
eLife 11:e72512.
https://doi.org/10.7554/eLife.72512


