Synergistic phase separation of two pathways promotes integrin clustering and nascent adhesion formation
- Department of Biophysics, Howard Hughes Medical Institute, The University of Texas Southwestern Medical Center, United States
- Department of Biology, Massachusetts Institute of Technology, United States
Figures
Figure 1 with 6 supplements
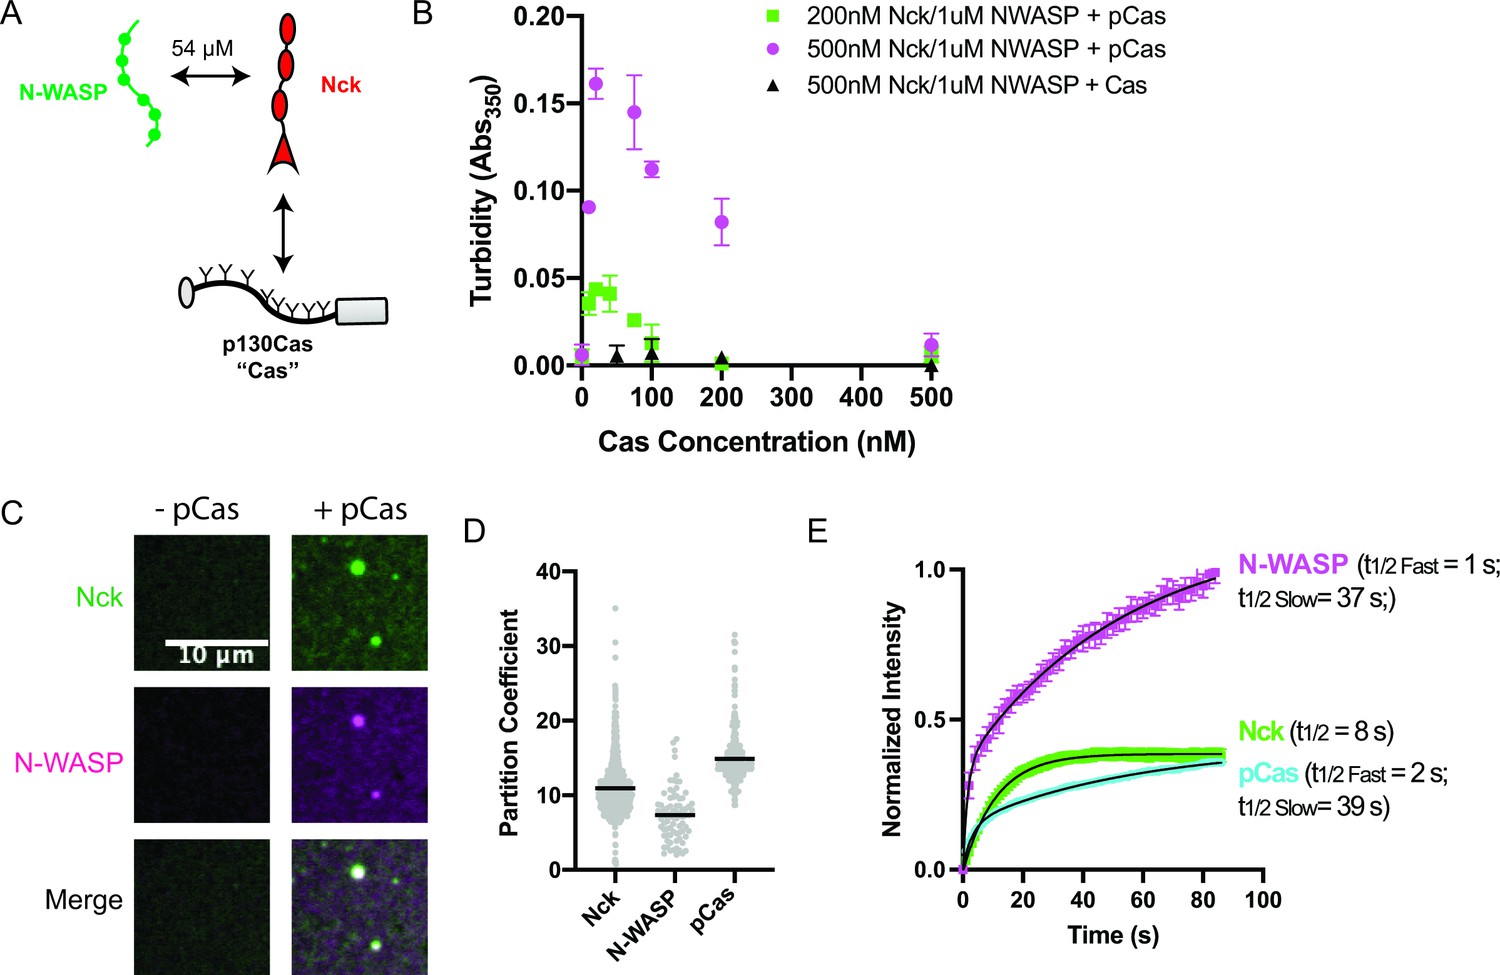
p130Cas, Nck, and N-WASP undergo liquid-liquid phase separation.
(A) Molecular interactions of IAC proteins, KD values indicated where known. Details and references in Supplementary file 1. (B) Solution turbidity measurements. Nck (200 nM, green; or 500 nM, magenta+ black) and N-WASP (1 µM) were combined with increasing concentrations of phosphorylated Cas (pCas, green+ magenta) or unphosphorylated Cas (Cas, black). Each point represents the mean ± SEM of three independent measurements. (C) Spinning disk confocal fluorescence microscopy images of droplets. Nck (1 μM, 15% Alexa568 labeled) and N-WASP (1 μM, 15% Alexa647 labeled) were combined ± pCas (1 μM, unlabeled). (D) Quantification of constituent partitioning into droplets. Each grey point represents an individual measurement, and the mean indicated by black line. Each condition contains at least 75 measurements from two or more independent experiments. (E) Fluorescence Recovery After Photobleaching (FRAP) measurements of droplets. Droplets formed from 1 μM each of Nck (15% Alexa568 labeled), N-WASP (15% Alexa647 labeled) and pCas (5%–647 labeled). Each point represents the mean ± SEM of at least six independent measurements. Recovery curves were fit with a single exponential (Nck) or biexponential (pCas, N-WASP) model and the fits are overlayed on the graph (black line). Detailed fit information in Supplementary file 4. All scale bars = 10 μm.
Figure 1—figure supplement 1
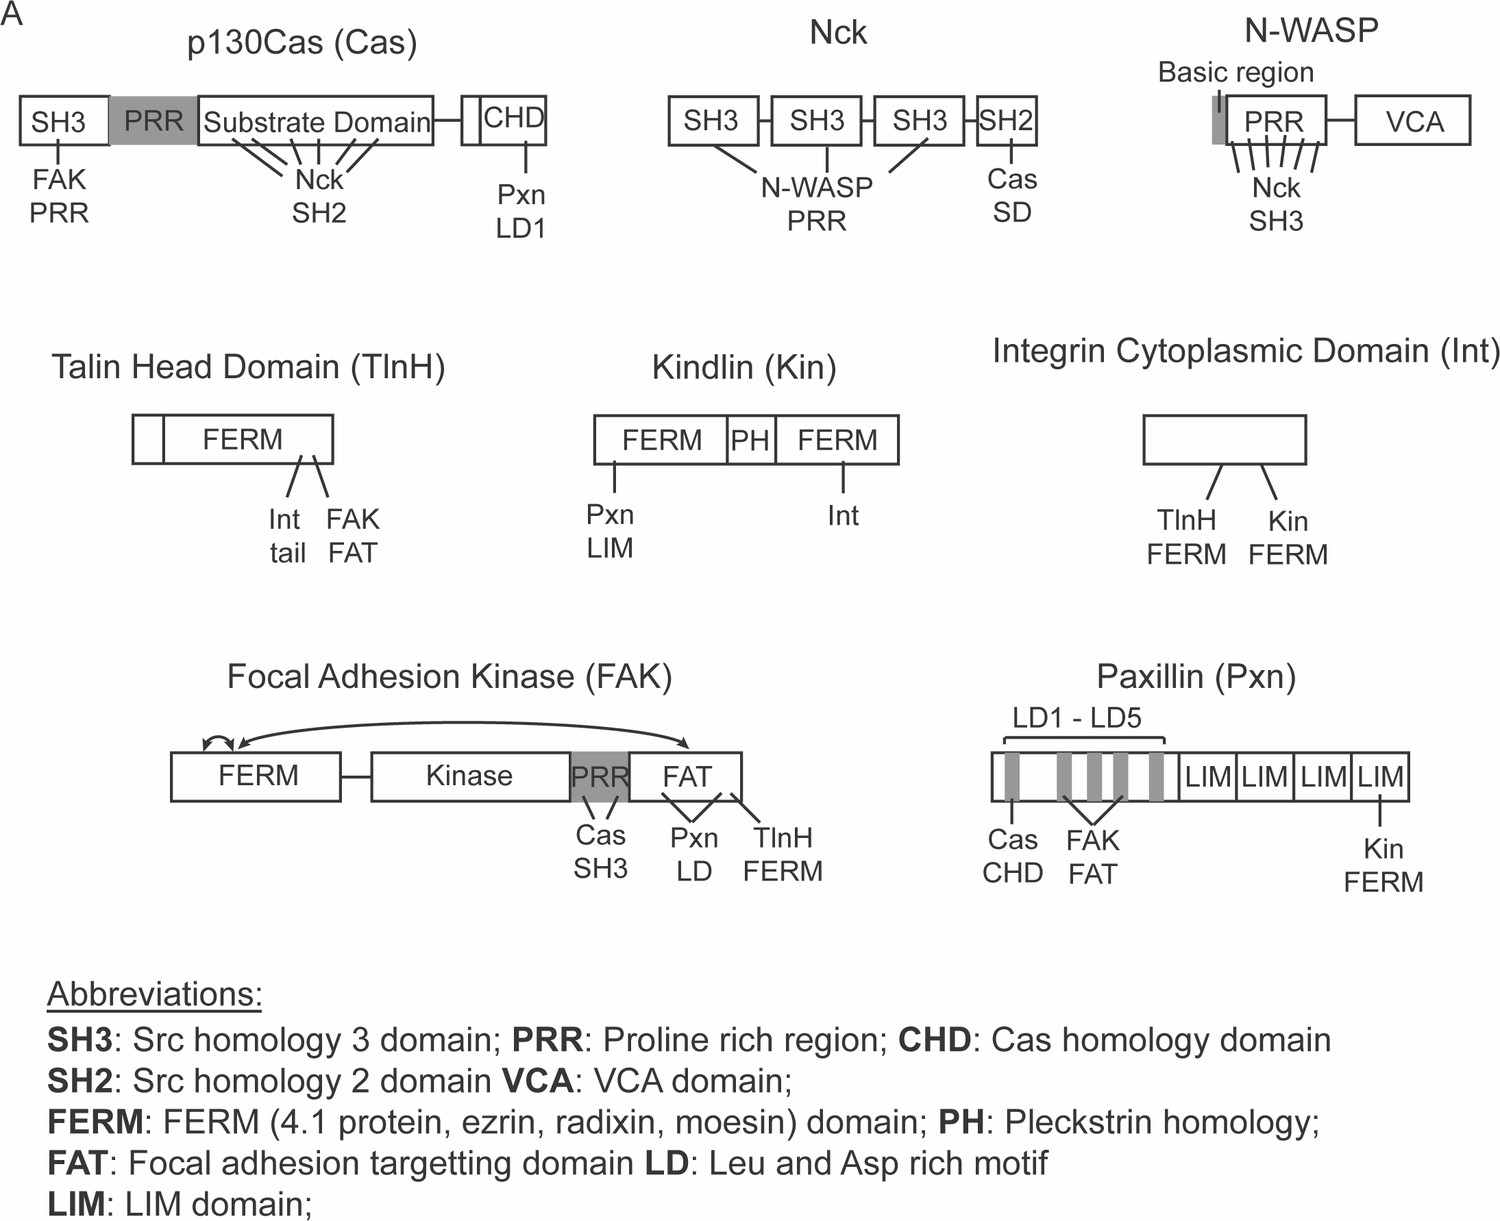
Domain organization of proteins used in this study.
Relevant protein interactions are indicated with lines, number of lines corresponds to number of identified binding sites.
Figure 1—figure supplement 2
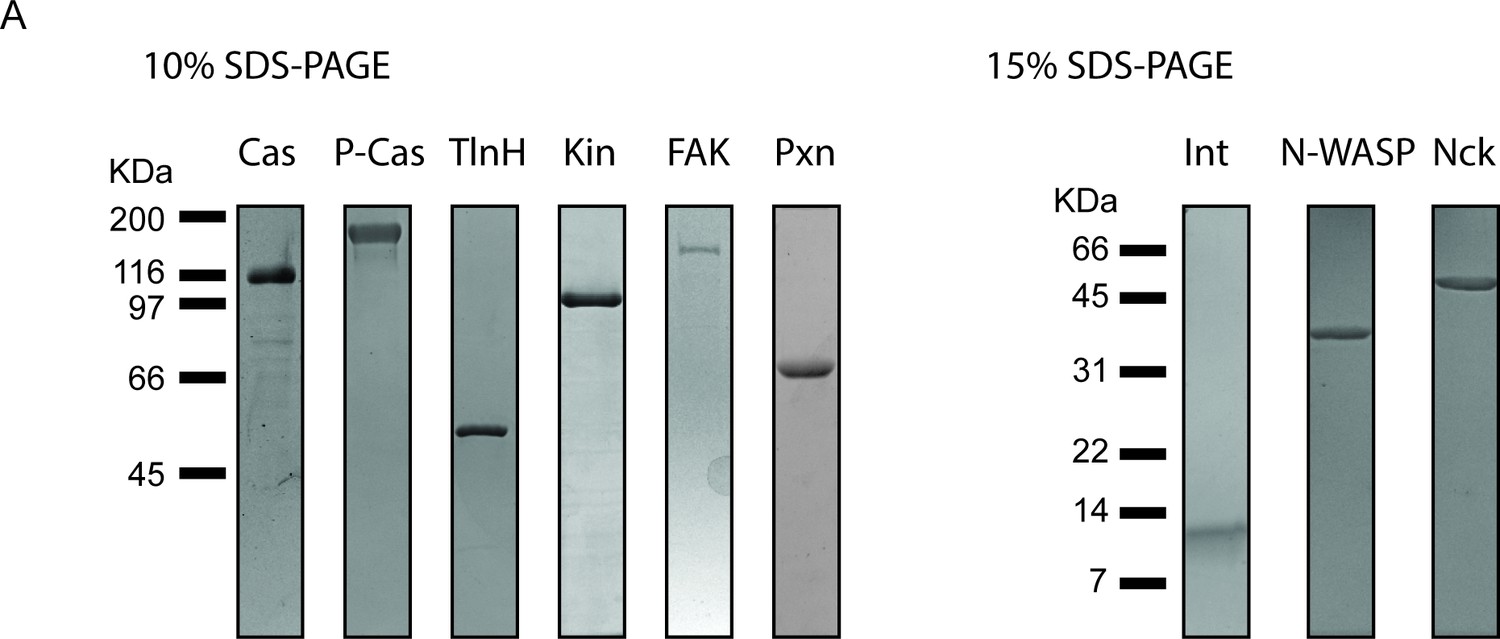
Purification of recombinant integrin adhesion complex proteins.
0.5 μ g of purified protein was run on SDS-PAGE gels and stained with Coomassie Blue. Proteins include unphosphorylated p130Cas (Cas), phosphorylated p130Cas (P-Cas), Talin Head Domain (TlnH), Kindlin (Kin), FAK, Paxillin (Pxn), the cytsoplasmic tail of Integrin (Int), Nck, and N-WASP.
-
Figure 1—figure supplement 2—source data 1
Uncropped gel images and unprocessed.tif files from Figure 1—figure supplement 2.
- https://cdn.elifesciences.org/articles/72588/elife-72588-fig1-figsupp2-data1-v2.zip
Figure 1—figure supplement 3
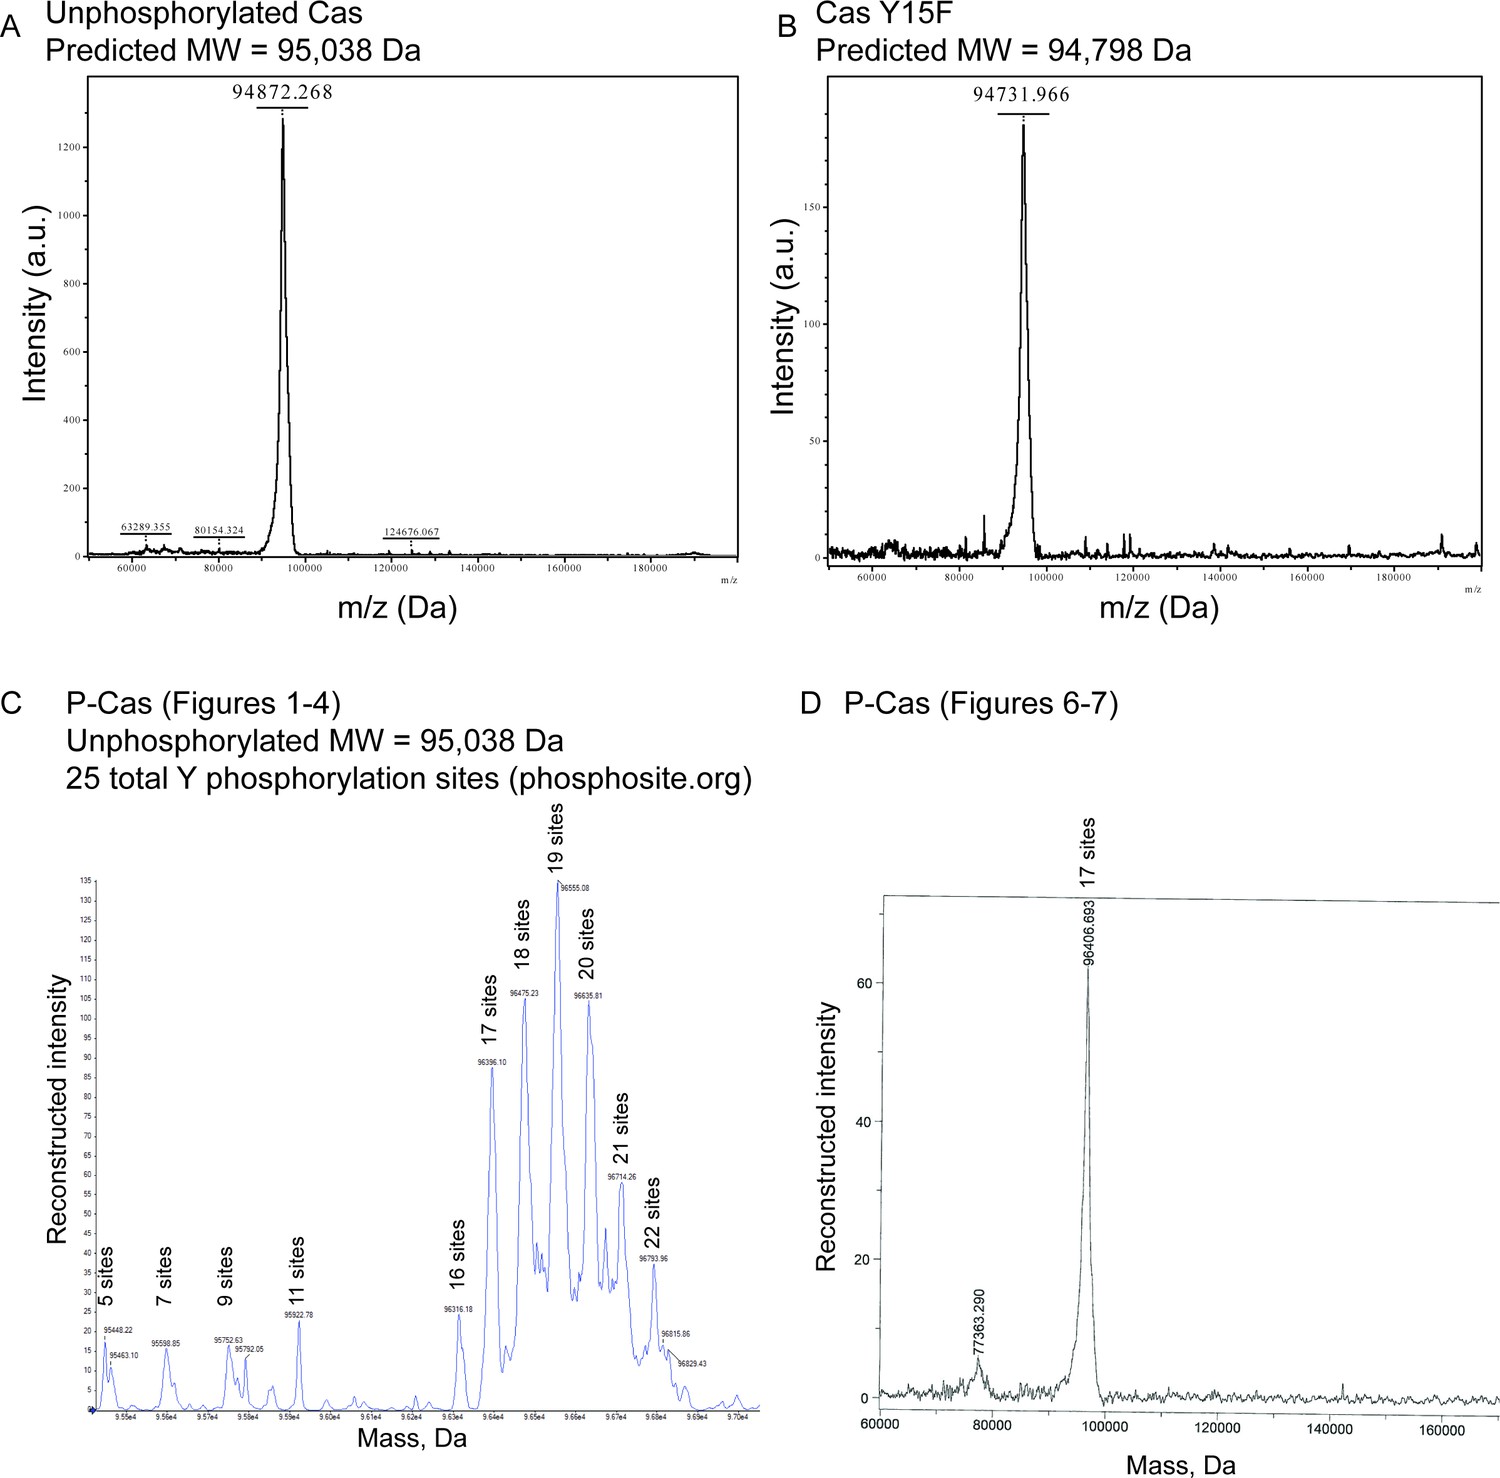
Intact mass spectrometry of p130Cas proteins.
(A) Unphosphorylated wildtype p130Cas (B) Unphosphorylated p130Cas Y15F (C) Phosphorylated p130Cas (P-Cas) preparation used in Figures 1—5. (D) Phosphorylated p130Cas (P-Cas) preparation used in Figures 6–7. The estimated number of phosphorylation sites of each peak is indicated, assuming 79.98 Da per phosphorylation.
Figure 1—figure supplement 4
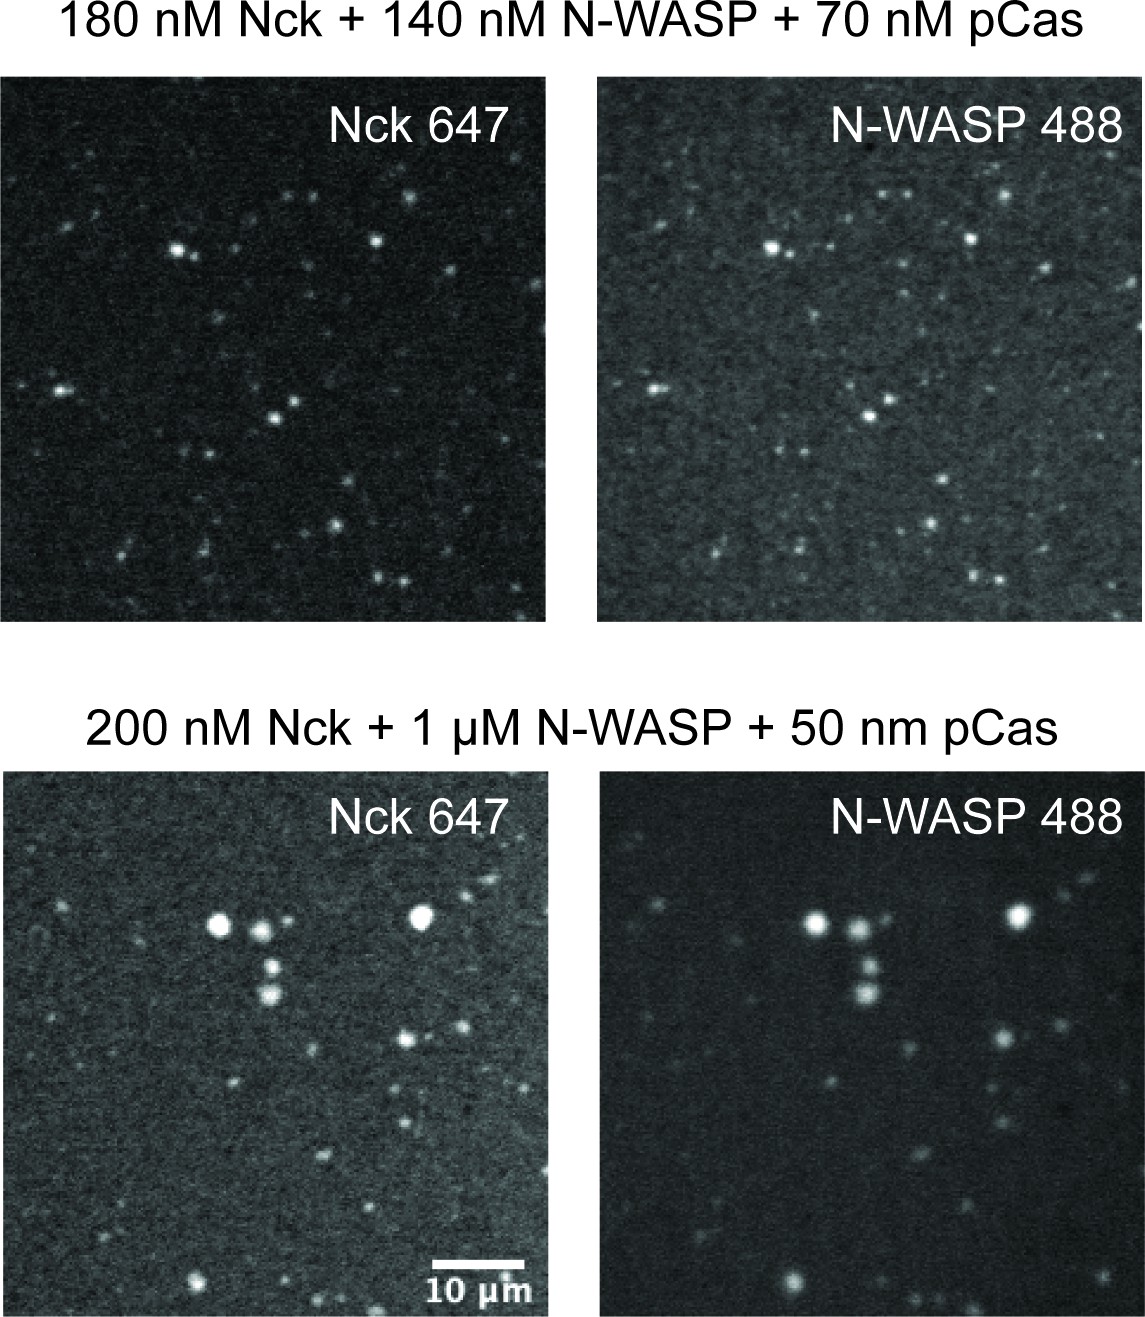
Droplets form with physiological protein concentrations.
Spinning disk fluorescence microscopy images of droplets. Top: 180 nM Nck (15% Alexa647), 140 nM N-WASP (15% Alexa488), and 70 nM phosphorylated p130Cas (pCas). Bottom: 200 nM Nck (15% Alexa647), 1 μ M N-WASP (15% Alexa488), and 50 nM pCas. Scale bar = 10 μ m.
Figure 1—figure supplement 5
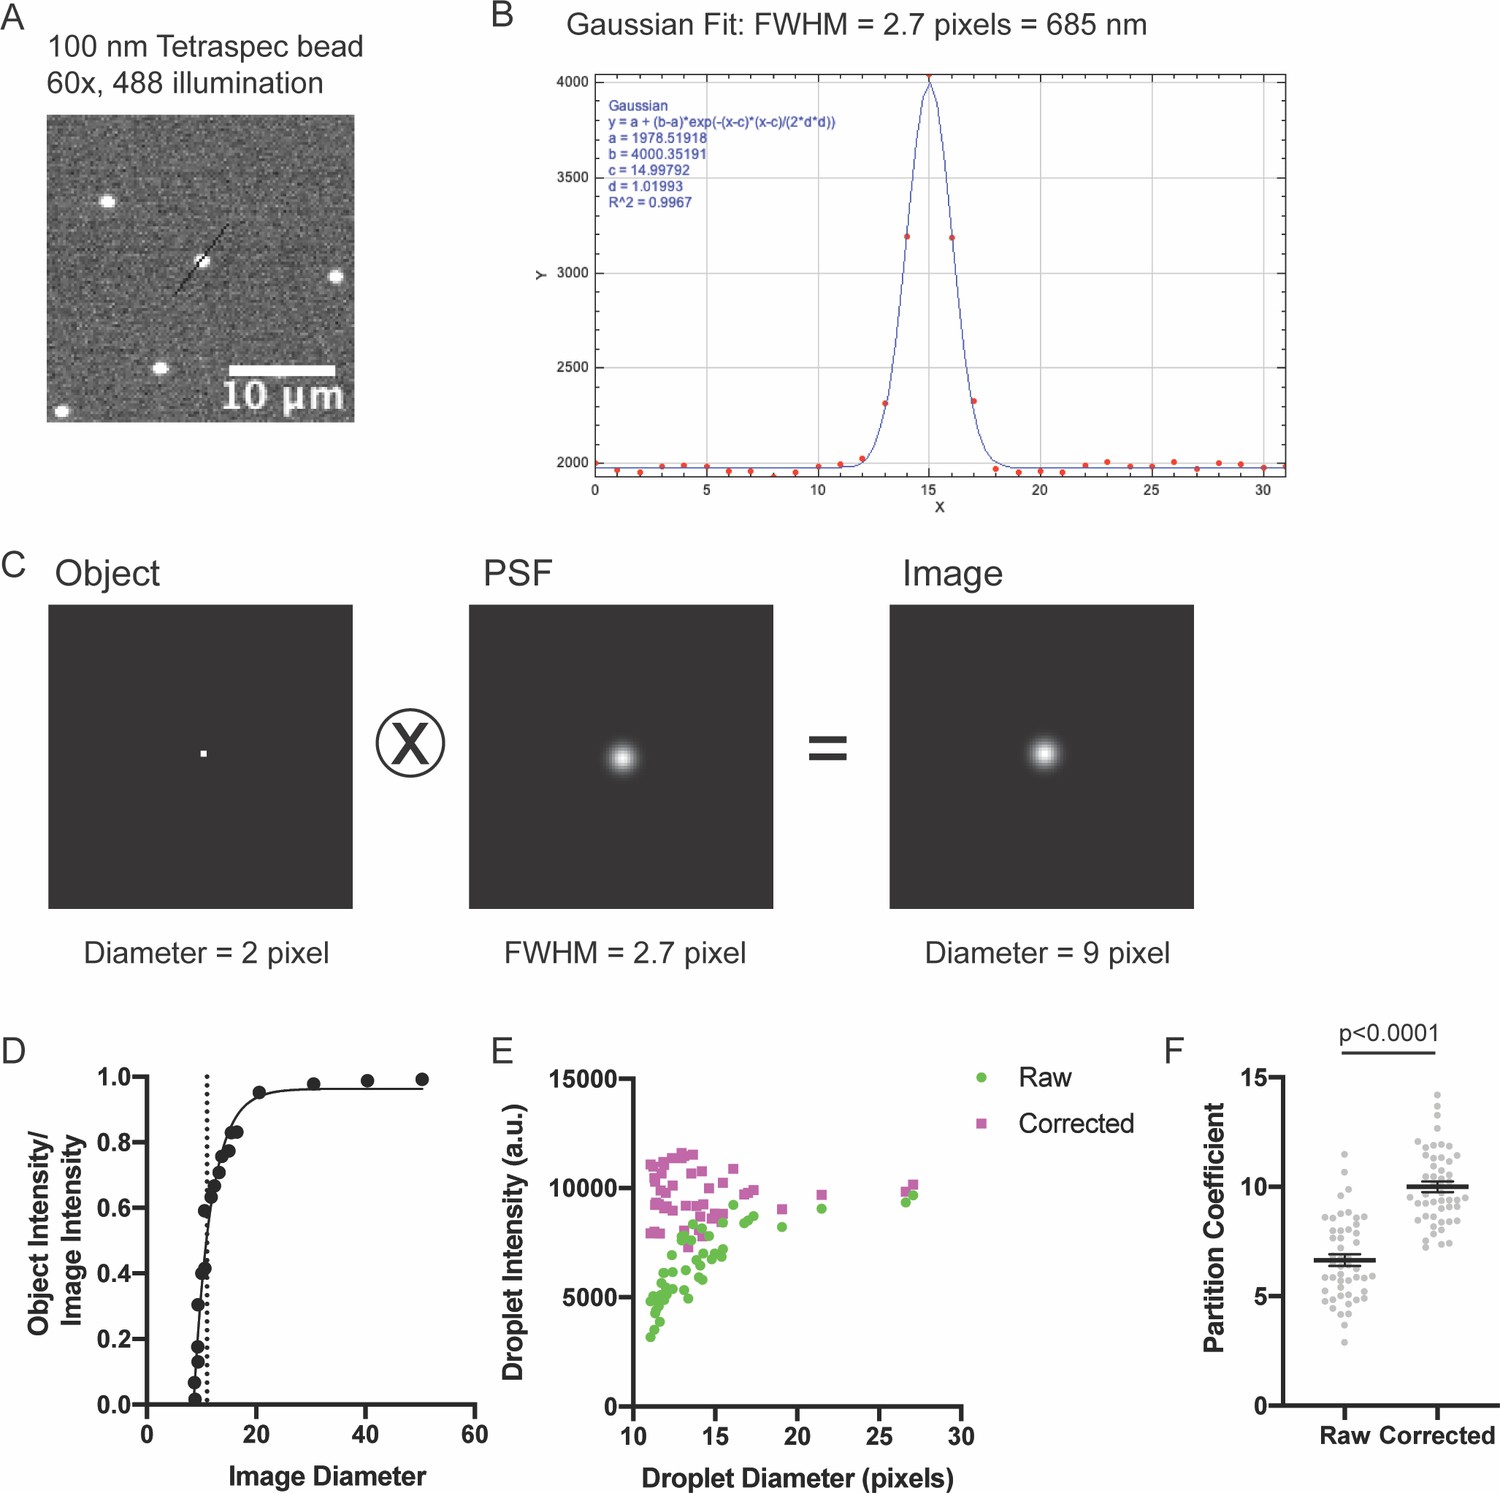
Measuring the point spread function (PSF).
(A) Spinning disk fluorescence microscopy image of 100 nm Tetraspec bead. (B) Linescan of intensity with overlaid Gaussian fit (black line in (A)). (C) Two pixel diameter circle (Object), calculated PSF (PSF), and resulting convolved image (Image). (D) Graph of apparent image diameter versus (Object Intensity/Image Intensity). Dotted line shows diameter cutoff below which we cannot accurately measure object intensities. Small objects ( < 20 pixel diameter) have diluted apparent intensities. (E–F) Comparison of droplet intensity measurements with and without correction. Droplets were formed with 1 μ M each of Nck (15% Alexa488), N-WASP, and pCas.
Figure 1—figure supplement 6
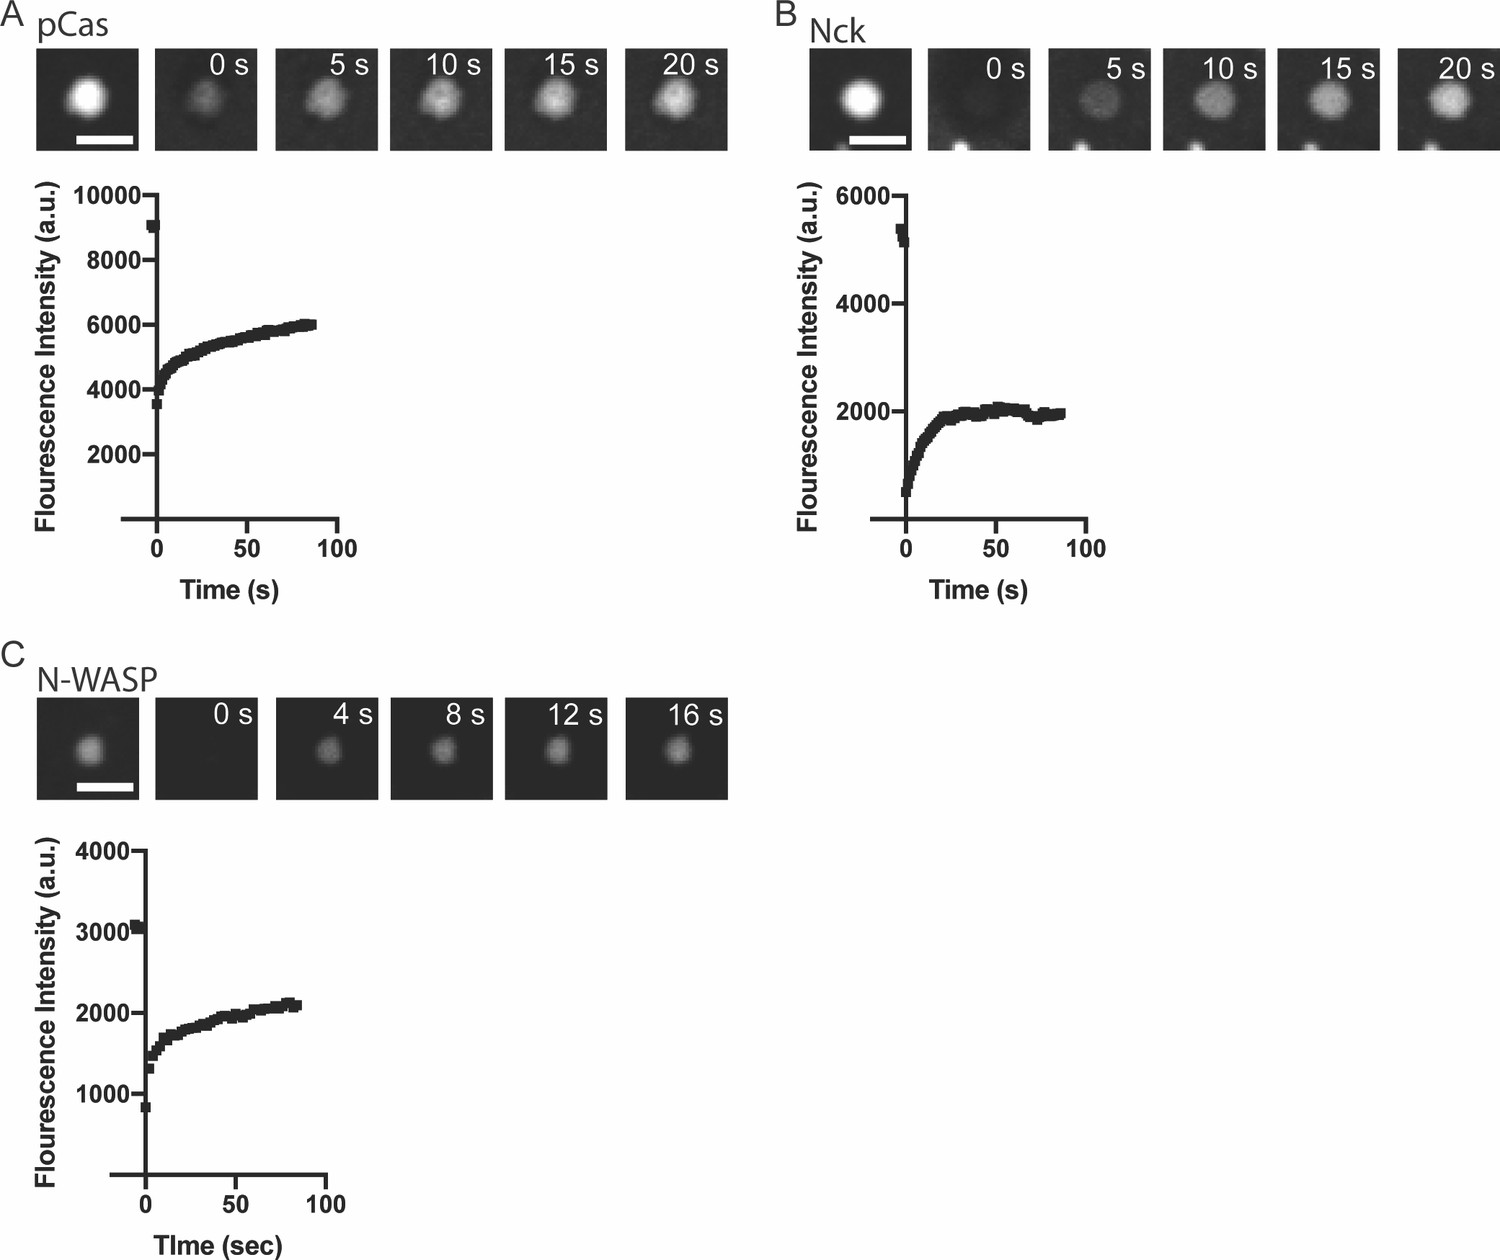
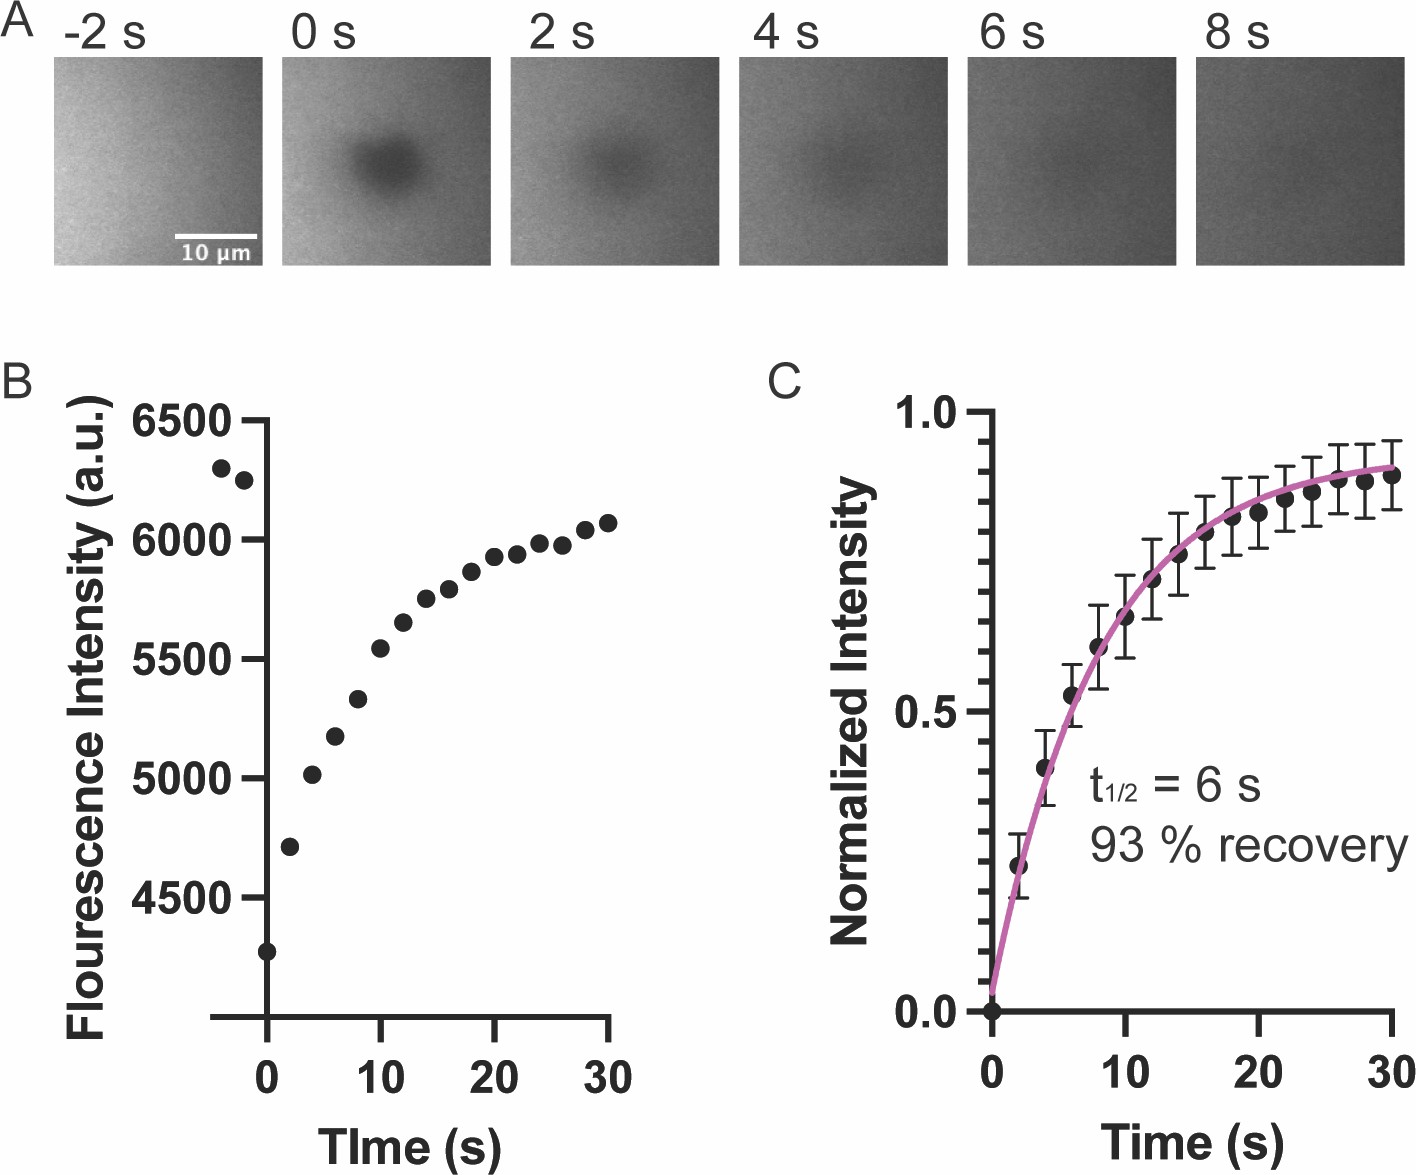
Representative fluorescence recovery after photobleaching (FRAP) data.
(A) TOP: Representative spinning disk fluorescence images of pCas fluorescence recovery after photobleaching (FRAP) experiment. Droplets were formed with 1 μ M pCas (5% Alexa-568), 1 μ M nck and 1 μ M N-WASP, and a single droplet is bleached at t = 0 s. Bottom: Quantification of fluorescence intensity of the bleached droplet over time. (B) TOP: Representative spinning disk fluorescence images of nck FRAP experiment. Droplets were formed with 1 μ M pCas, 1 μ M nck (15% Alexa-488), and 1 μ M N-WASP, and a single droplet is bleached at t = 0 s. Bottom: Quantification of fluorescence intensity of the bleached droplet over time. (C) TOP: Representative spinning disk fluorescence images of N-WASP FRAP experiment. Droplets were formed with 1 μ M pCas, 1 μ M nck, and 1 μ M N-WASP (15% Alexa-647), and a single droplet is bleached at t = 0 s. BOTTOM: Quantification of fluorescence intensity of the bleached droplet over time. All scalebars = 5 μm.
Figure 2 with 3 supplements
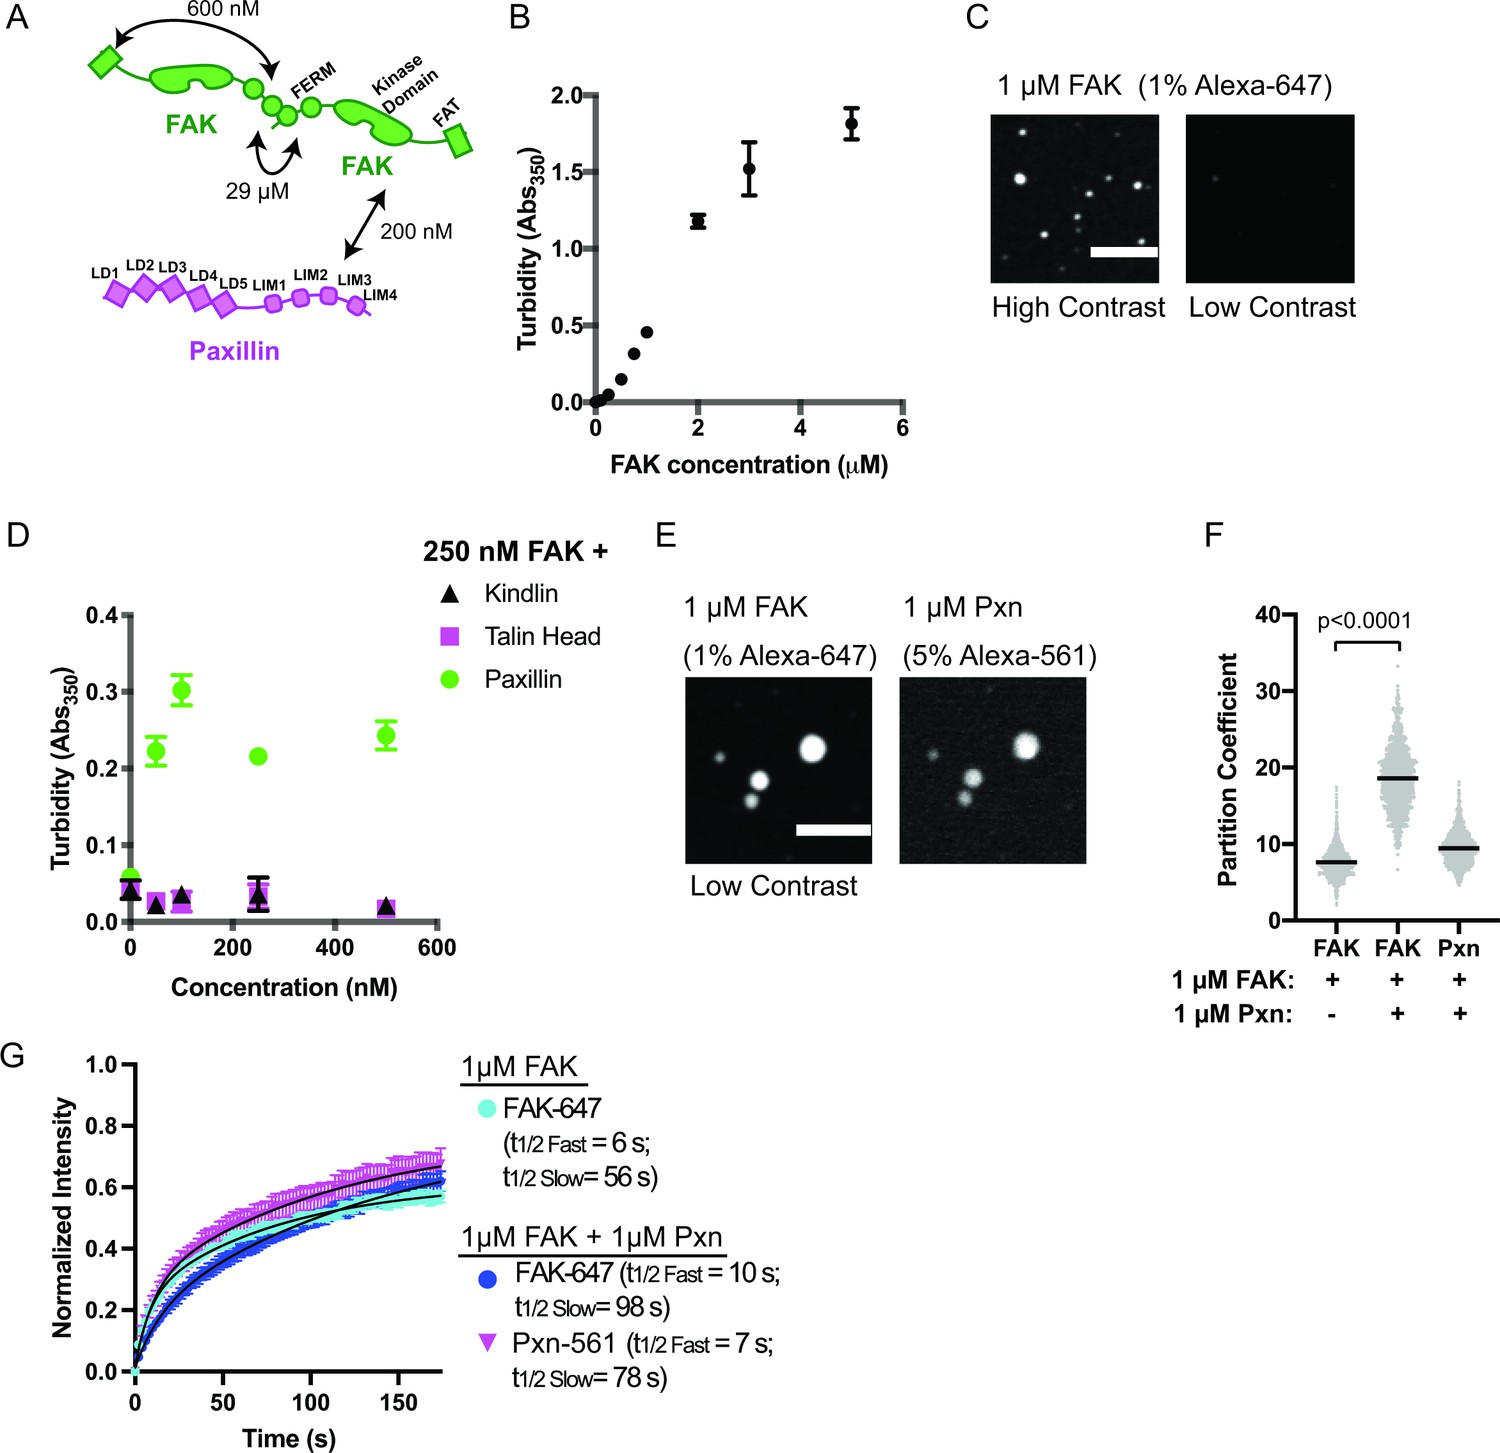
FAK and paxillin undergo liquid-liquid phase separation.
(A) Molecular interactions of IAC proteins, KD values indicated where known. Details and references in Supplementary file 1. (B) Solution turbidity measurements with increasing concentrations of FAK. (C) Spinning disk confocal fluorescence microscopy images of droplets formed from 1 μM FAK (1% Alexa647 labeled). The same image is displayed with two different contrast settings for comparison to panel E. (D) Solution turbidity measurements. 250 nM FAK was combined with increasing concentrations of talinH (magenta), kindlin (black), or paxillin (green). (E) Spinning disk confocal fluorescence microscopy images of droplets formed from 1 μM FAK (1% Alexa647 labeled) and 1 μM FAK paxillin (5% Alexa546 labeled). For comparison, contrast settings of FAK image are identical to those in 2 C, low contrast. (F) Quantification of constituent partitioning into droplets. Each condition contains at least 750 measurements from four or more independent experiments. Significance tested with student’s t-test. (G) Fluorescence Recovery After Photobleaching (FRAP) measurements of droplets. Droplets formed from 1 μM of FAK (1% Alexa647 labeled, cyan) or 1 μM each of FAK (1% Alexa647 labeled, dark blue) and paxillin (5% Alexa546 labeled, magenta). Each point represents the mean ± SEM of at least 15 independent measurements. Recovery curves were fit with a biexponential model and the fits are overlayed on the graph (black line). Detailed fit information in Supplementary file 4. In (B) and (D), each point represents the mean ± SEM of three independent measurements. In (F), each gray point represents an individual measurement, and the mean is indicated by black line. All scale bars = 10 μm.
Figure 2—figure supplement 1
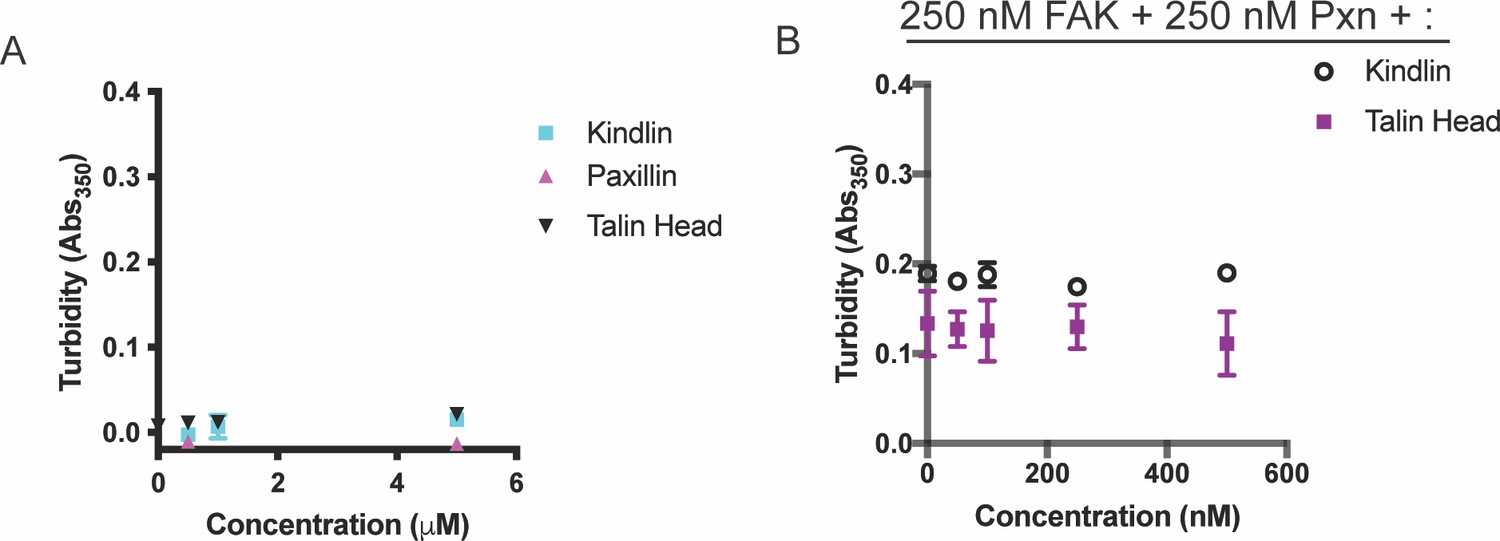
Solution turbidity measurements.
(A) Increasing concentrations of Kindlin, Talin Head or Paxillin were added to solution. (B) 250 nM FAK and 250 nM Paxillin were combined with increasing concentrations of Talin Head or Kindlin. In A-B, each point represents the mean ± SEM of three independent measurements.
Figure 2—figure supplement 2
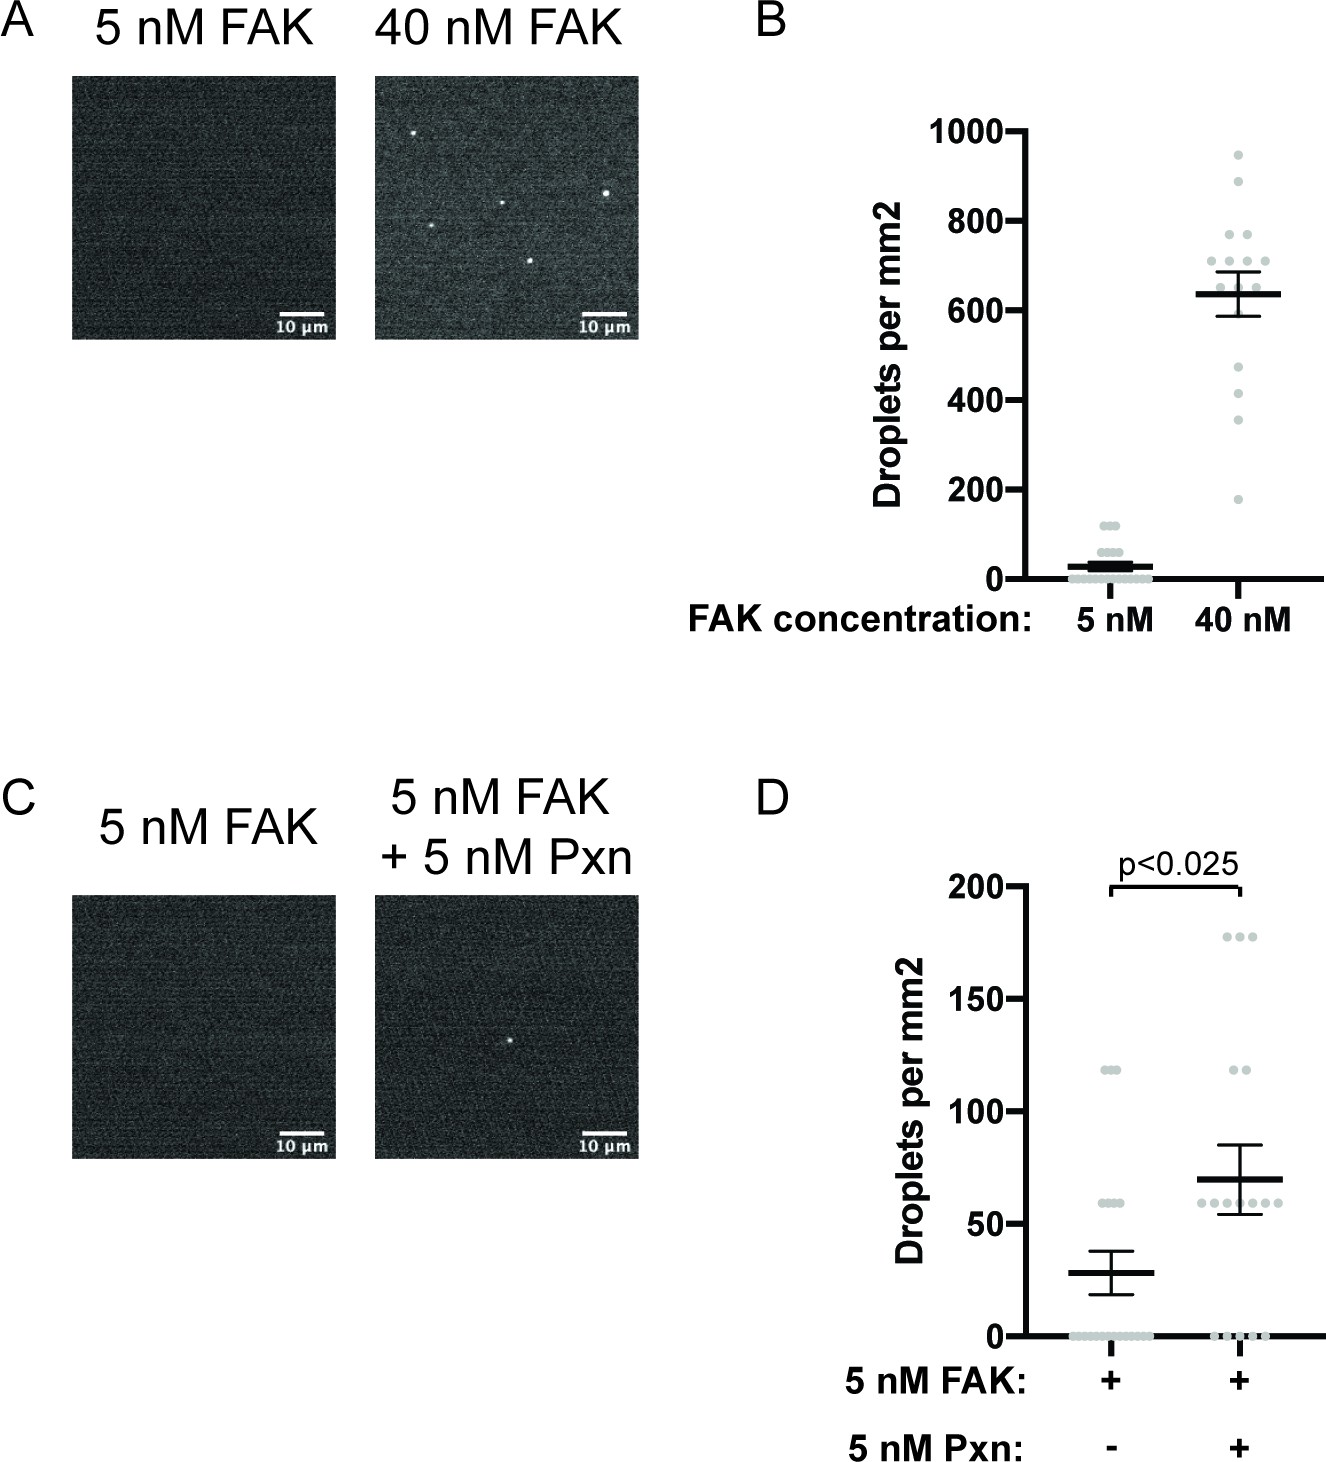
Droplets form with physiological protein concentrations.
(A) Spinning disk fluorescence microscopy images of 5 nM or 40 nM FAK (1% Alexa647). (B) Quantification of number of droplets per mm2. (C) Spinning disk fluorescence microscopy images of 5 nM FAK (1% Alexa647) ± 5 nM paxillin. (D) Quantification of number of droplets per mm2. All images are displayed with matched contrast settings. Scale bar = 10 μ m. In (B) and (D), each gray point represents an individual measurement of a single, randomly selected field of view, and the mean is written and indicated by black line. In (D), significance tested with Student’s t-test.
Figure 2—figure supplement 3
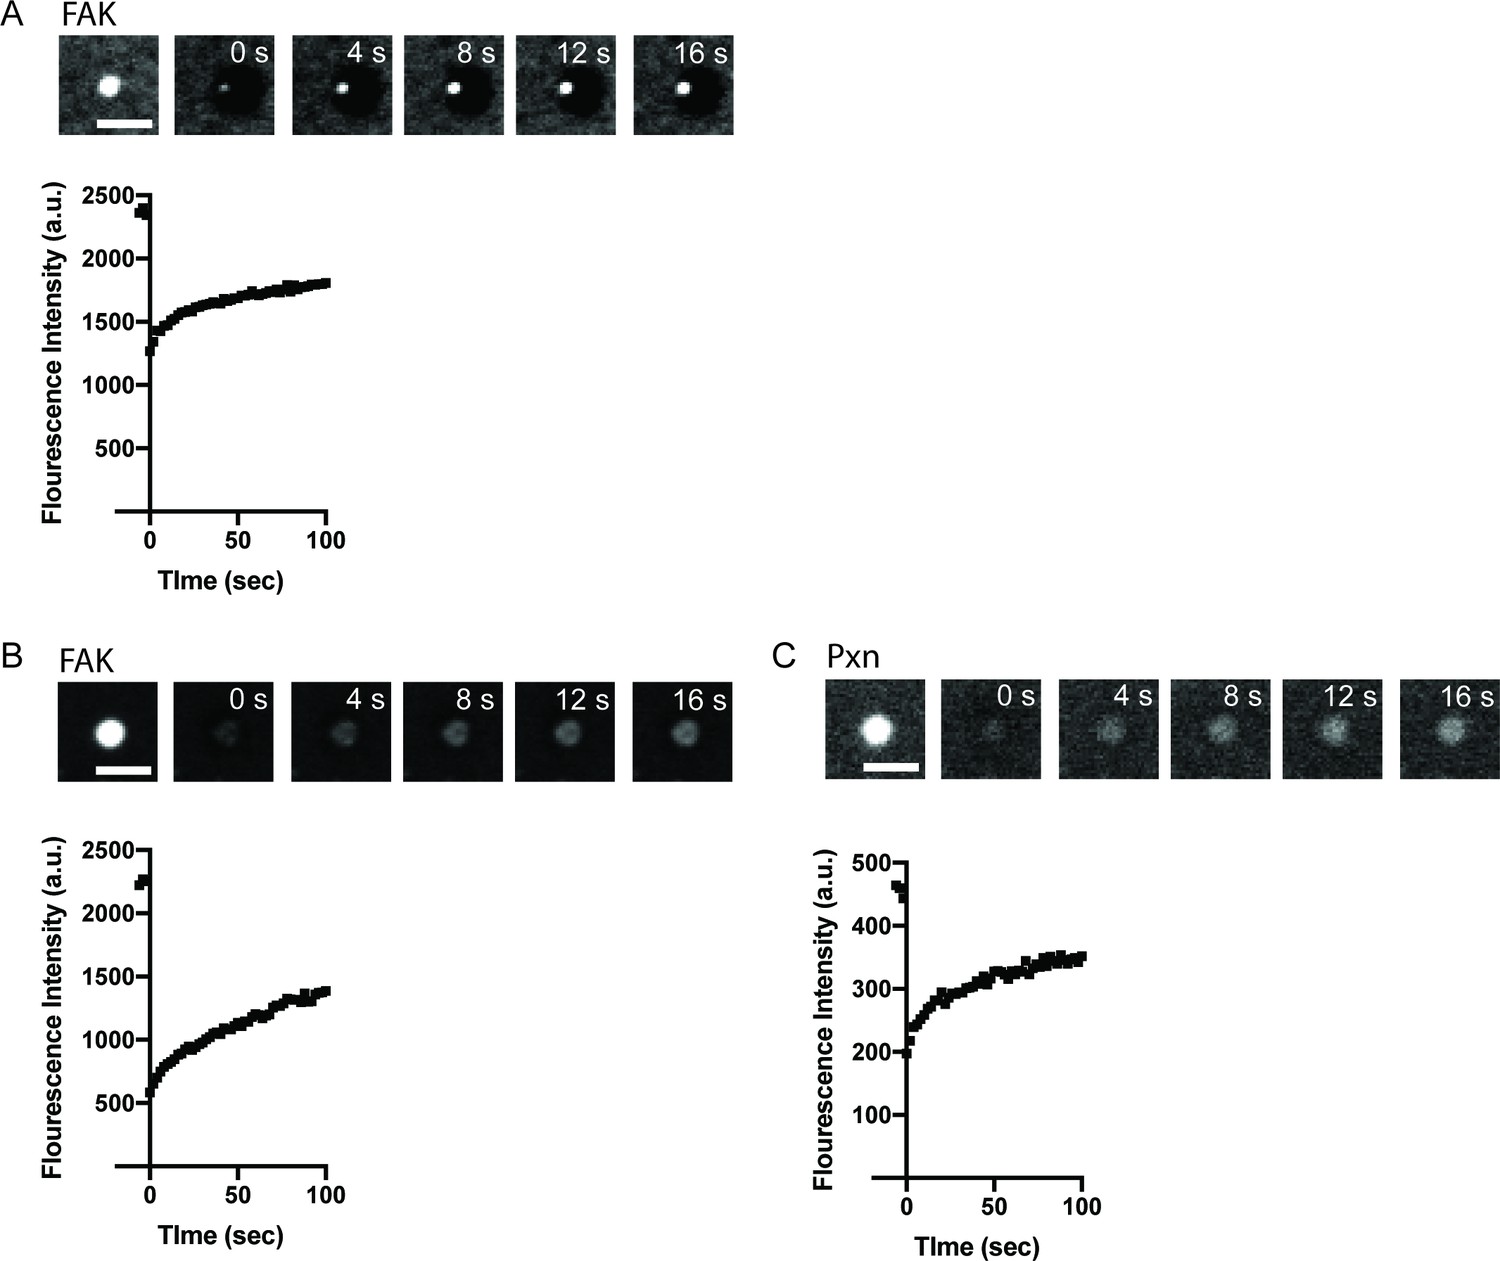
Representative fluorescence recovery after photobleaching (FRAP) data.
(A) Top: Representative spinning disk fluorescence images of FAK fluorescence recovery after photobleaching (FRAP) experiment. Droplets were formed with 1 μ M FAK (1% Alexa-647), and a single droplet is bleached at t = 0 s. Botton: Quantification of fluorescence intensity of the bleached droplet over time. (B) TOP: Representative spinning disk fluorescence images of FAK FRAP experiment. Droplets were formed with 1 μ M FAK (1% Alexa-647) and 1 μ M paxillin, and a single droplet is bleached at t = 0 s. Bottom: Quantification of fluorescence intensity of the bleached droplet over time. (C) TOP: Representative spinning disk fluorescence images of paxillin FRAP experiment. Droplets were formed with 1 μ M FAK and 1 μ M paxillin (5% Alexa-561), and a single droplet is bleached at t = 0 s. Bottom: Quantification of fluorescence intensity of the bleached droplet over time. All scale bars = 5 μm.
Figure 3 with 2 supplements
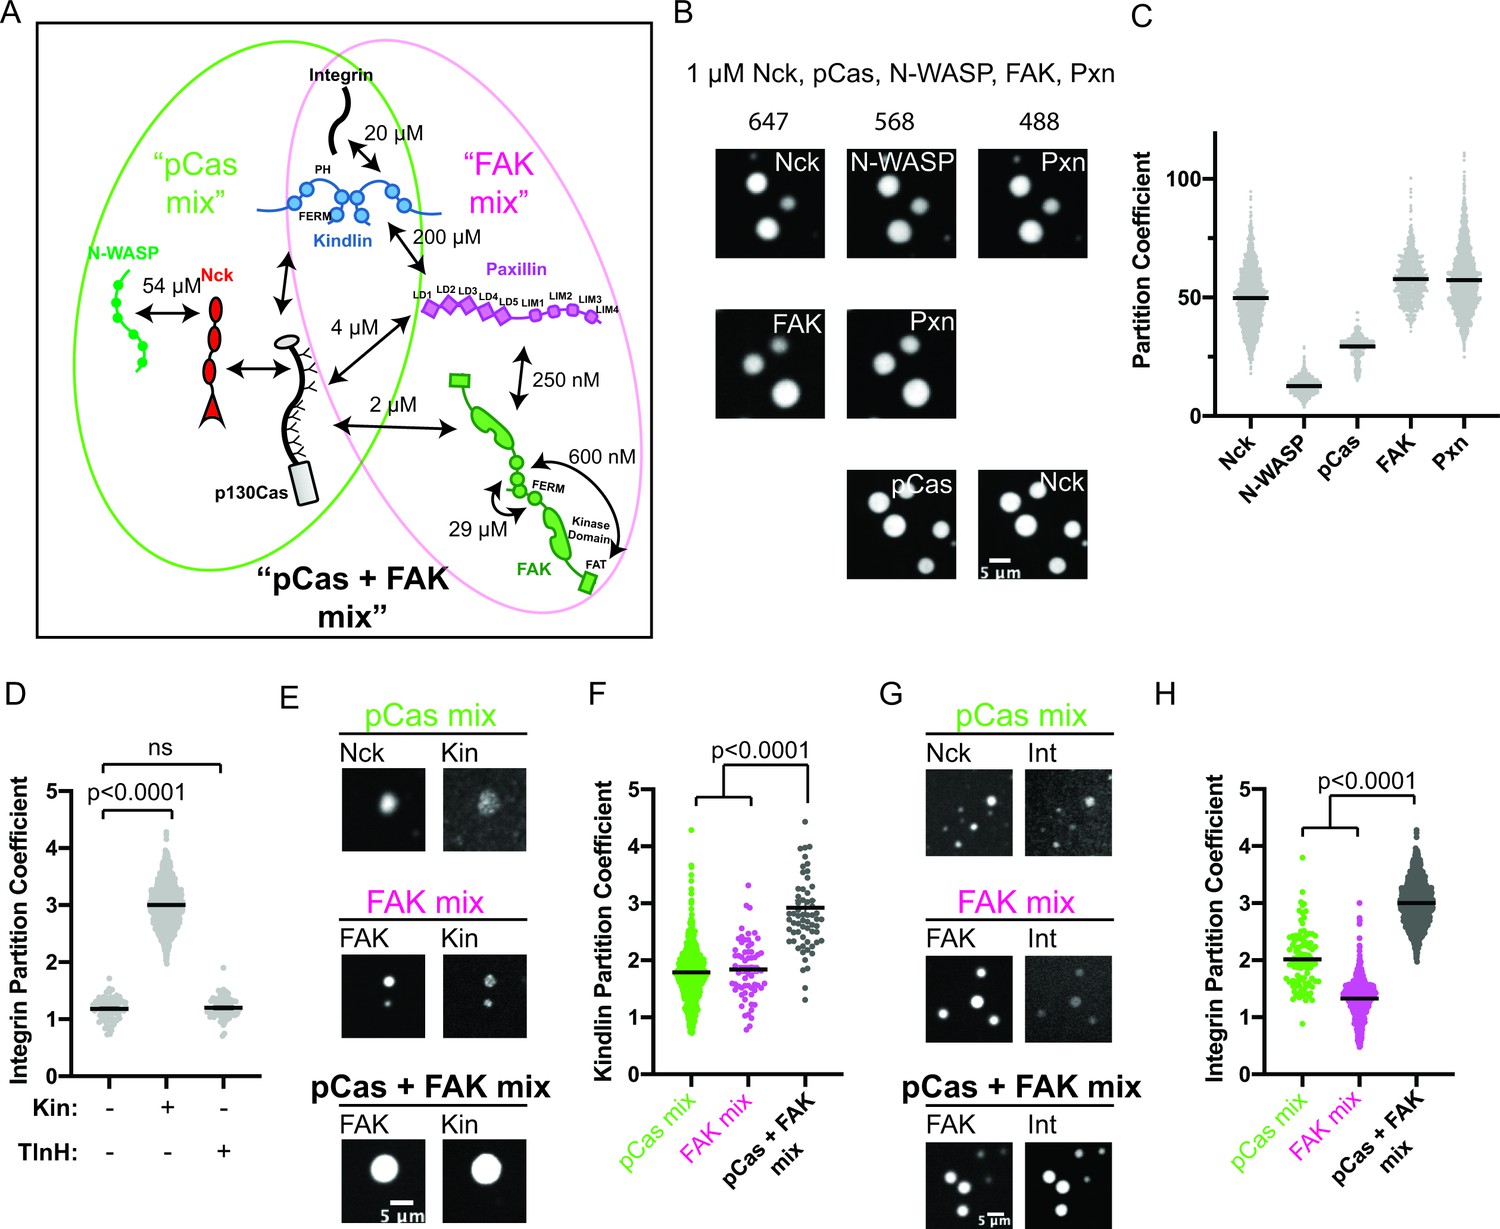
The pCas and FAK pathways phase separate synergistically.
(A) Molecular interactions and known KD values, including between the two pathways. Details and references in Supplementary file 1. (B) Spinning disk confocal fluorescence microscopy images of droplets formed with the pCas + FAK mix. TOP: 1 μM each of Nck (15% alexa647), N-WASP (15% Alexa568), pCas, FAK, paxillin (15% Alexa488); MIDDLE: 1 μM each of Nck, N-WASP, pCas, FAK (1% Alexa647 labeled), paxillin (1% Alexa488 labeled); BOTTOM: 1 μM each of Nck (15% Alexa488 labeled), N-WASP, pCas (1% Alexa647 labeled), FAK, paxillin; (C) Quantification of constituent partitioning into droplets. Each condition contains at least 750 measurements from four or more independent experiments. (D) Quantification of integrin-GFP partitioning into droplets formed with the pCas + FAK mix. 1 μM each of Nck, N-WASP, pCas, FAK, paxillin, and B1 Integrin (15% GFP labeled) with either 1 μM Kin or 1 μM TlnH. Each condition contains at least 70 measurements from two or more independent experiments. (E) Spinning disk confocal fluorescence microscopy images of droplets. Top: droplets formed with the pCas mix (1 μM each of Nck [15% Alexa647 labeled], N-WASP, pCas, and kindlin [5% Alexa568 labeled]). Middle: Droplets formed with the FAK mix (1 μM each of FAK (1% Alexa647 labeled), paxillin, and kindlin (5% Alexa568 labeled)). Bottom: Droplets formed with the pCas + FAK mix (1 μM each of Nck, N-WASP, pCas, FAK (1% Alexa647 labeled), paxillin, and kindlin (5% Alexa568 labeled)). Contrast settings of kindlin images are matched in all images. (F) Quantification of kindlin partitioning. Each condition contains at least 60 measurements from two or more independent experiments. (G) Spinning disk confocal fluorescence microscopy images of droplets. Top: Droplets formed with the pCas mix (1 μM each of Nck [15% Alexa647 labeled], N-WASP, pCas, kindlin, and integrin [15% GFP labeled]). Middle: Droplets formed with the FAK mix (1 μM each of FAK [1% Alexa647 labeled], paxillin, kindlin and integrin [15% GFP labeled]). Bottom: Droplets formed with the pCas + FAK mix (1 μM each of Nck, N-WASP, pCas, FAK [1% Alexa647 labeled], paxillin, kindlin, and integrin [15% GFP labeled]). Contrast settings of integrin images are matched in all images. (H) Quantification of integrin partitioning. Each condition contains at least 70 measurements from two or more independent experiments. In (D), (F) and (H) significance tested by one-way ANOVA followed by a Tukey multiple comparison test. All scale bars = 5 μm.
Figure 3—figure supplement 1
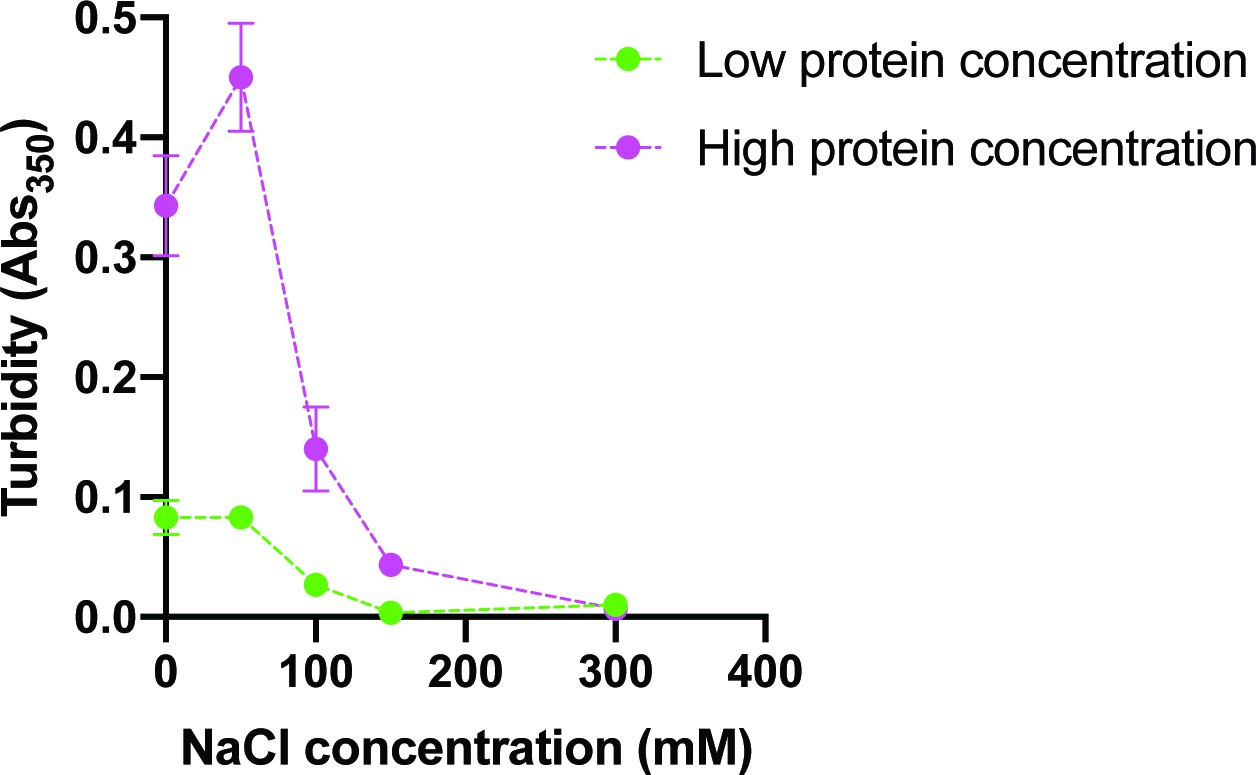
NaCl reduces solution turbidity.
Solution was prepared with cytoplasmic protein concentration (green; 70 n M pCas, 180 nM nck, 140 nM N-WASP, 60 nM paxillin, and 40 nM FAK) or uniform protein concentration (magenta; 250 nM each of pCas, nck, N-WASP, FAK and paxillin) in buffer containing 50 mM Hepes pH 7.3, 0.1% BSA and increasing concentrations (0–300 mM) NaCl. Each point represents the mean ± SEM of three independent measurements.
Figure 3—figure supplement 2
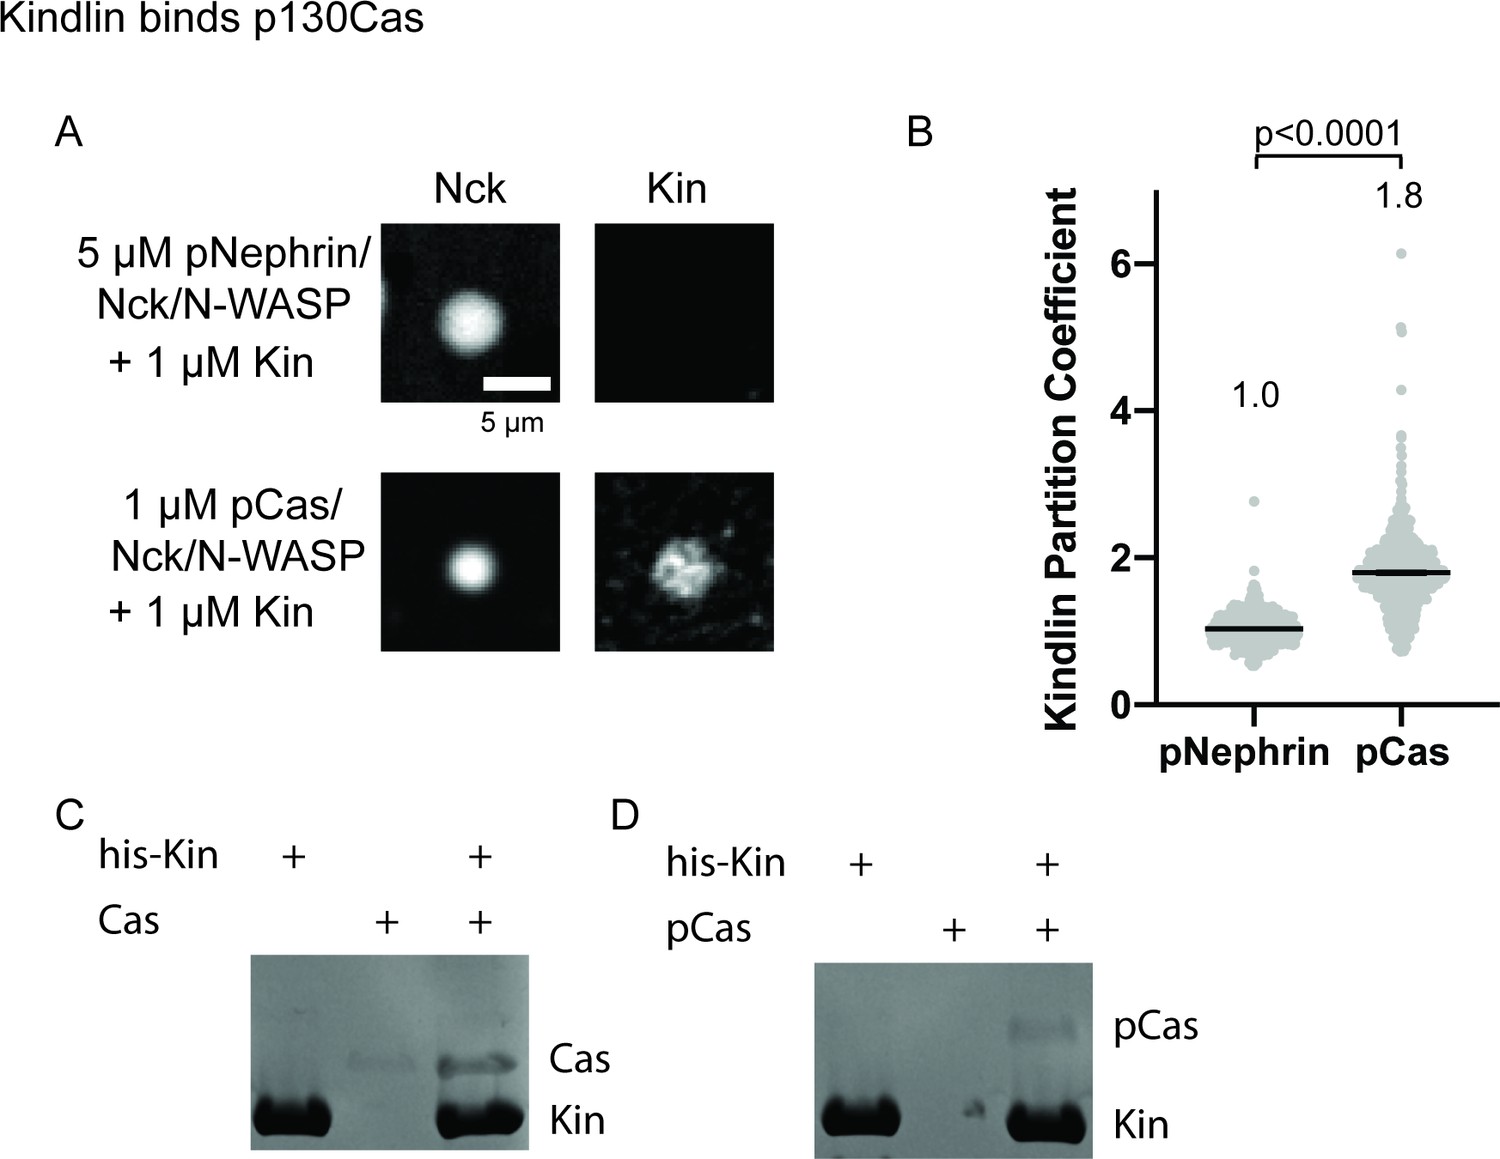
Kindlin interacts with p130Cas.
(A) Spinning disk fluorescence microscopy images of droplets. Top: 5 μ M each of phosphorylated Nephrin, Nck (15% Alexa647), and N-WASP and 1 μ M Kindlin (10% Alexa546). Bottom: 1 μ M each of phosphorylated Cas, Nck (15% Alexa647), N-WASP, and Kindlin (10% Alexa546). Kindlin images displayed with identical contrast settings. Scalebar = 5 μ m. (B) Quantification of Kindlin partitioning in droplets. Each gray point represents an individual measurement, and the mean is written and indicated by black line. Each condition contains at least 500 measurements. Significance tested with Student’s t-test. (C–D) His pull-down samples analyzed on SDS-PAGE gel with Coomassie blue staining.
-
Figure 3—figure supplement 2—source data 1
Uncropped gel images and unprocessed.tif files from Figure 3—figure supplement 2.
- https://cdn.elifesciences.org/articles/72588/elife-72588-fig3-figsupp2-data1-v2.zip
Figure 4 with 2 supplements
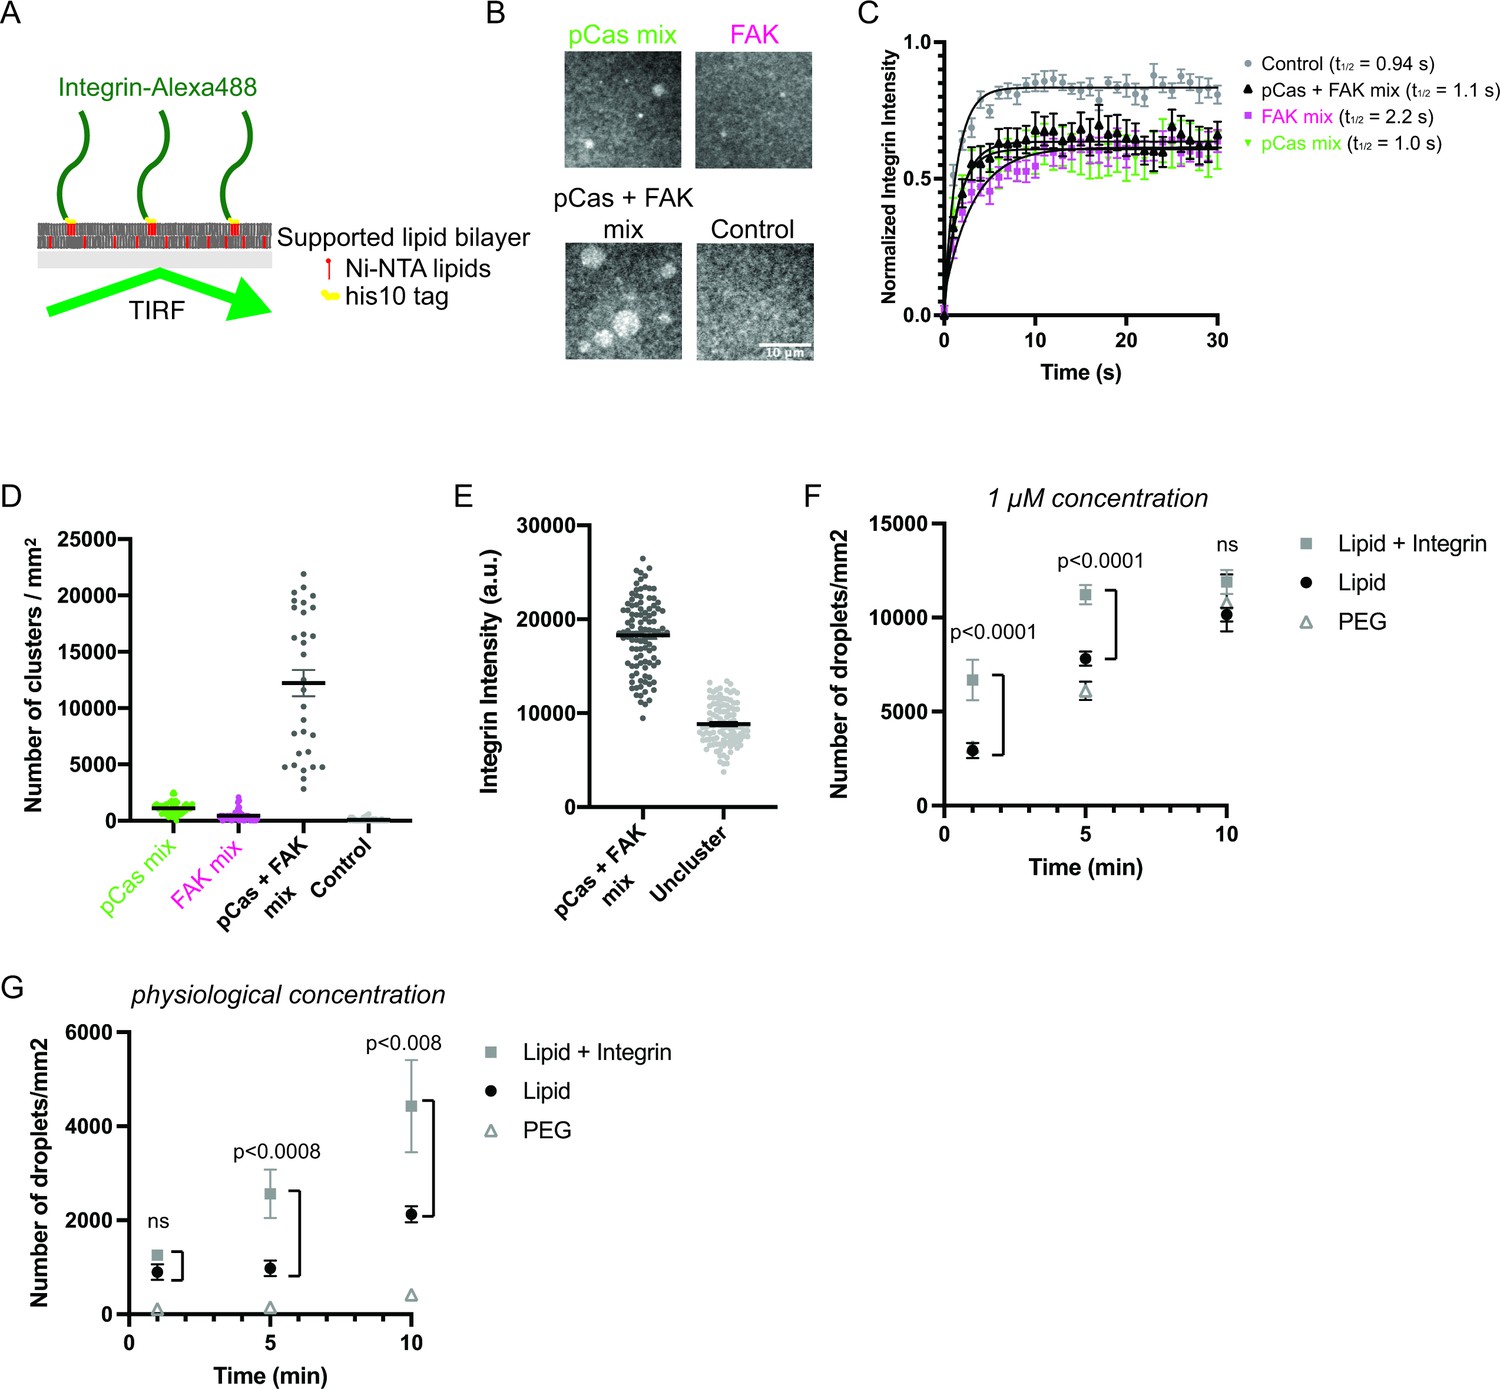
Phase separation is sufficient to reconstitute kindlin-dependent integrin clustering on supported phospholipid bilayers.
(A) Cartoon describing phospholipid bilayer reconstitution. (B) Total Internal Reflection Fluorescence (TIRF) microscopy images. Different combinations of proteins (pCas mix: 1 μM each of Nck, N-WASP, Cas and kindlin; FAK mix: 200 nM FAK, and 1 μM each of paxillin and kindlin; pCas + FAK mix: 200 nM FAK and 1 μ M each of Nck, N-WASP, Cas, paxillin and kindlin; Control: Buffer only) were added to membrane-bound integrin (15% Alexa488 labeled, ~ 1000 molecules/μm2). (C) Fluorescence Recovery After Photobleaching (FRAP) measurements of his-Integrin in clusters. Each point represents the mean ± SEM of at least 12 independent measurements. The t1/2 was calculated from a single exponential fit; fit overlayed on graph (black line). (D) Quantification of integrin clusters. Each gray point represents a single field of view, black lines represent mean ± SEM. (E) Quantification of integrin intensity within clusters formed with the pCas + FAK mix or in the surrounding unclustered regions (‘Uncluster’). Each point represents a single measurement, black lines represent mean ± SEM. Each condition contains at least 150 measurements from two independent experiments. (F, G) Quantification of droplets visible in TIRF field. Experiments were done on PEG-coated glass (PEG), empty phospholipid bilayers (lipids) and phospholipid bilayers containing unlabeled membrane-bound integrin (Lipid+ Integrin). Droplets containing Nck-Alexa647 were visualized with TIRF illumination. 1 μM concentration: 1 μ M pCas, 1 μM Nck (15% Alexa647 labeled), 1 μM N-WASP, 1 μM Kin, 1 μM Paxillin, 200 nM FAK; physiological concentration: 70 n M pCas, 180 nM Nck (15% Alexa647 labeled), 140 nM N-WASP, 60 nM Kin, 60 nM Paxillin, 40 nM FAK. Each point represents the mean ± SEM of at least 17 measurements from three independent experiments. Significance tested by one-way ANOVA followed by a Tukey multiple comparison test. All scale bars = 10 μm.
Figure 4—figure supplement 1
Analysis of phospholipid bilayer fluidity.
(A) Representative images of fluorescence phospholipid bilayers imaged with Total Internal Reflection Fluorescence (TIRF) microscopy during photobleaching analysis. Bilayers containing 97% POPC 2% Ni-NTA, 1% PC-NBD, and 0.1% PEG-PE were imaged with 488 nm TIRF illumination to directly visualize PC-NBD lipids. A 5 μm region was bleached at t = 0 s. Scalebar = 10 μm. (B) Quantification of NDB fluorescence intensity of the bleached region from A. (C) Fluorescence Recovery After Photobleaching (FRAP) measurements of bilayer. Each point represents the mean ± SEM of at seven independent measurements. The t1/2 was calculated from a single exponential fit; fit overlayed on graph (magenta line).
Figure 4—figure supplement 2
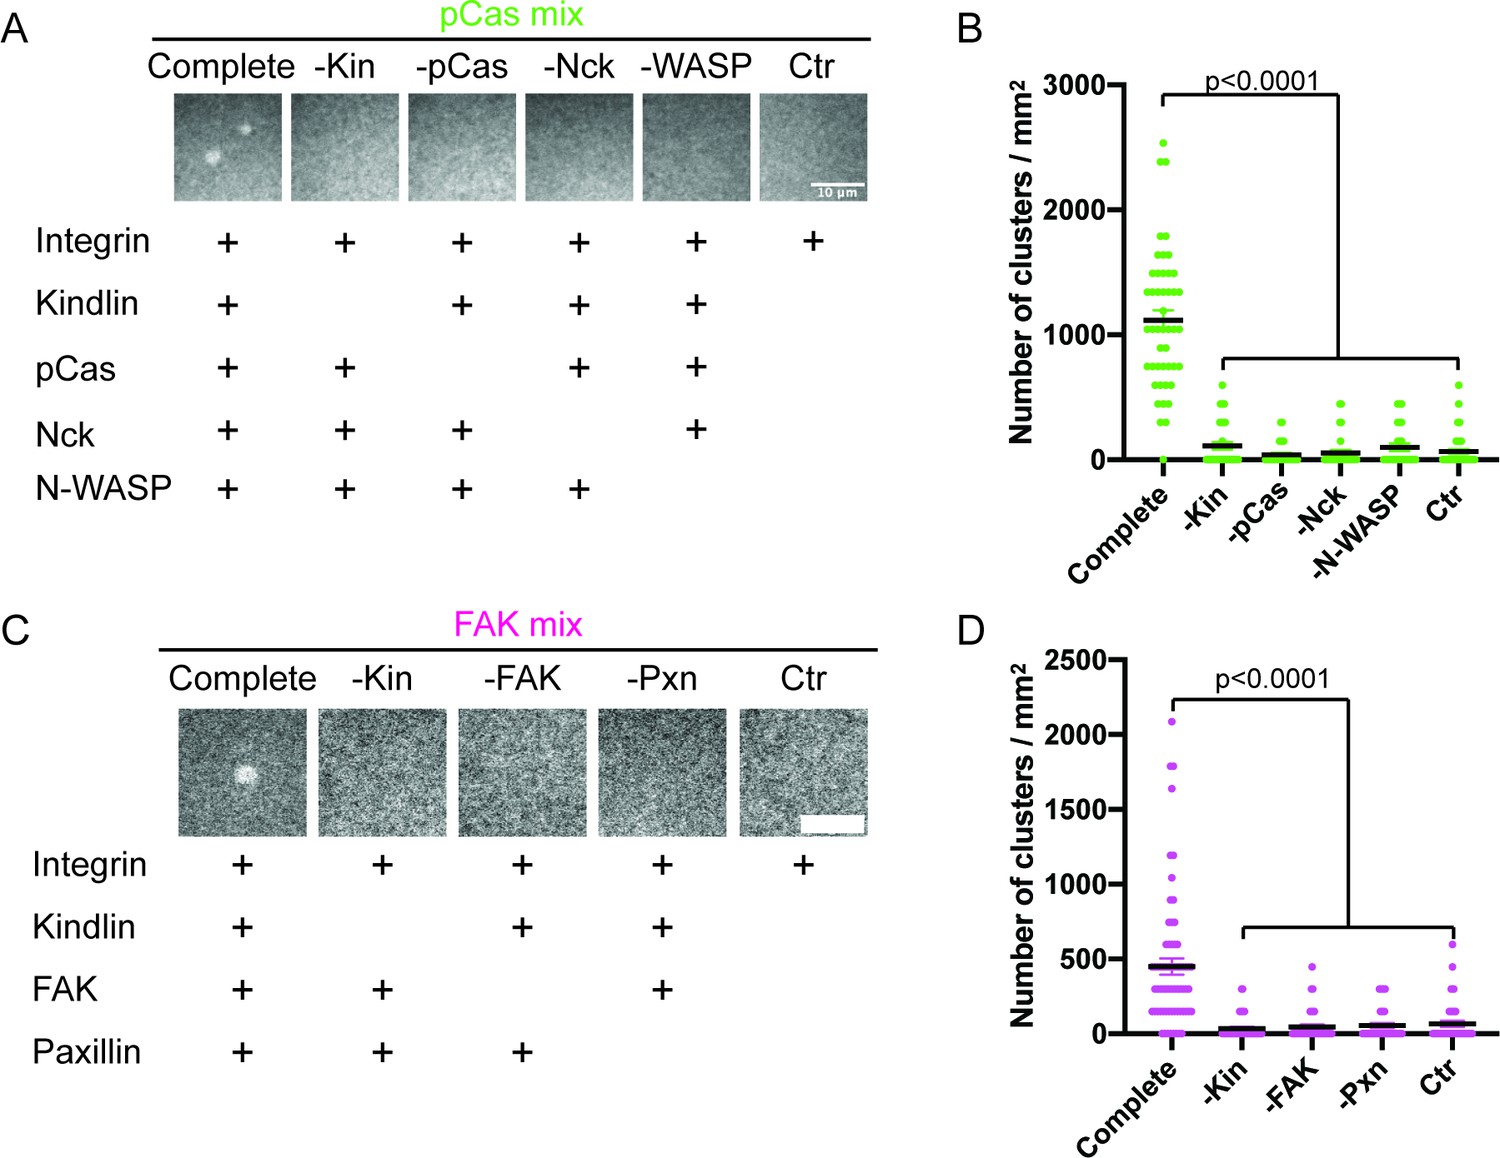
Analysis of proteins required for integrin clustering.
(A, C) Total Internal Reflection Fluorescence (TIRF) microscopy images. 1 μM each of the indicated proteins were added to membrane-bound integrin (15% Alexa488, ~ 1000 molecules/μm2). (B, D) Quantification of integrin clusters. Each point represents a single, randomly selected field of view, black lines represent the mean ± SEM. Significance tested by one-way ANOVA followed by a Tukey multiple comparison test.
Figure 5
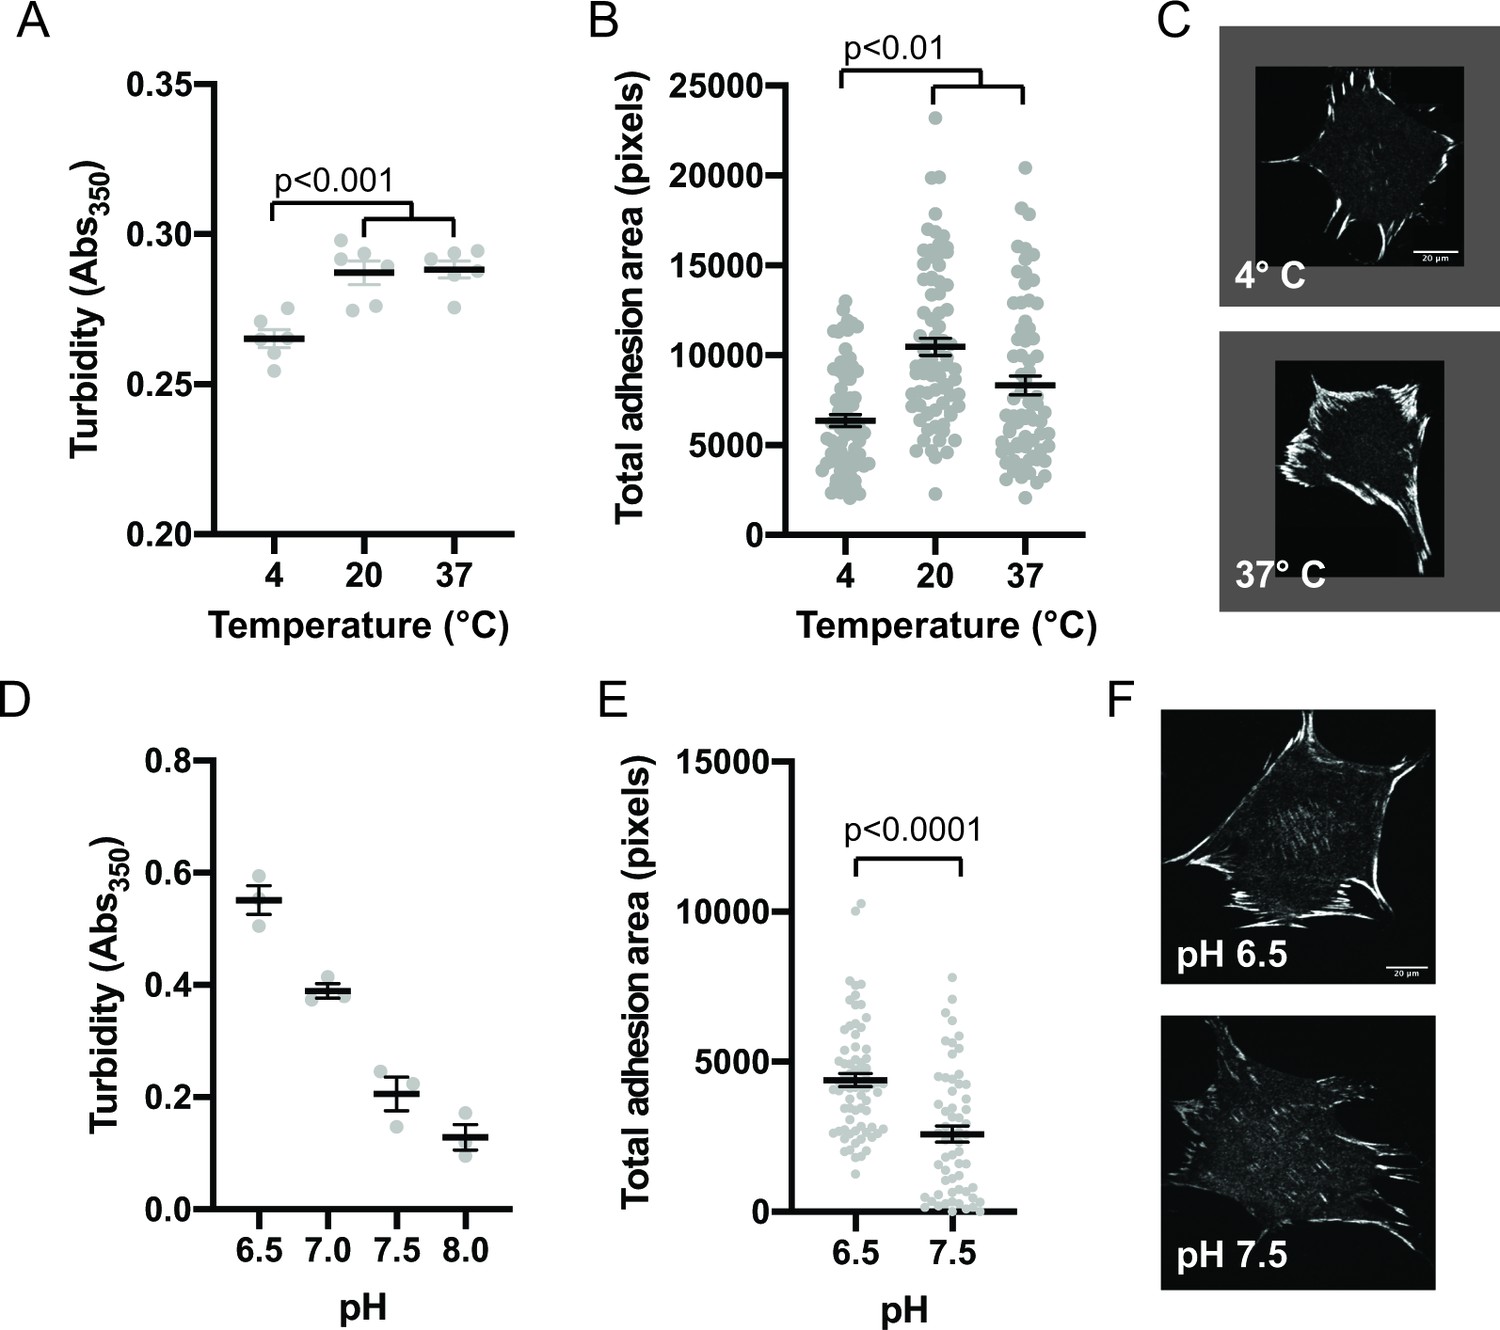
Integrin adhesion complexes are sensitive to solvent perturbations that alter phase separation.
(A) Solution turbidity measurements of solution containing 250 nM each of Nck, N-WASP, pCas, FAK, and Paxillin in buffer containing 50 mM Hepes pH 7.3, 50 mM KCl and 0.1% BSA. Solution incubated at indicated temperatures of 30 min prior to measurements. (B) Total adhesion area per cell quantified from spinning disk images of endogenous paxillin. Cells were incubated at indicated temperatures for 10 min prior to fixation and paxillin immunostaining. (C) Representative spinning disk confocal microscopy images. (D) Turbidity measurements of solution containing 250 nM each of Nck, N-WASP, pCas, FAK, and Paxillin in buffer containing 50 mM KCl, 0.1% BSA and either 50 mM of Hepes or Mes at the indicated pH. (E) Total adhesion area per cell quantified from spinning disk confocal microscopy images of endogenous paxillin. Cells were incubated for 10 min prior to fixation and paxillin immunostaining in buffer containing 10 μ M nigericin, 10 μ M valinomycin, 150 mM NaCl, 50 mM KCl, 1 mM CaCl2, 1 mM MgCl2, 2 mM Glutamax, and either 50 mM Mes pH 6.5 or 50 mM Hepes pH 7.5. Significance tested with unpaired t-test. (F) Representative spinning disk confocal microscopy images. All scale bars = 20 μm.
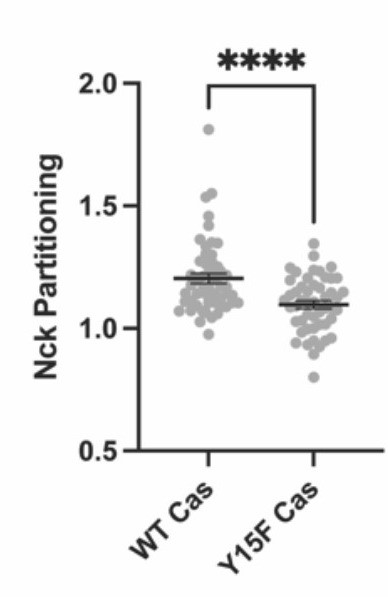
Figure 6 with 3 supplements
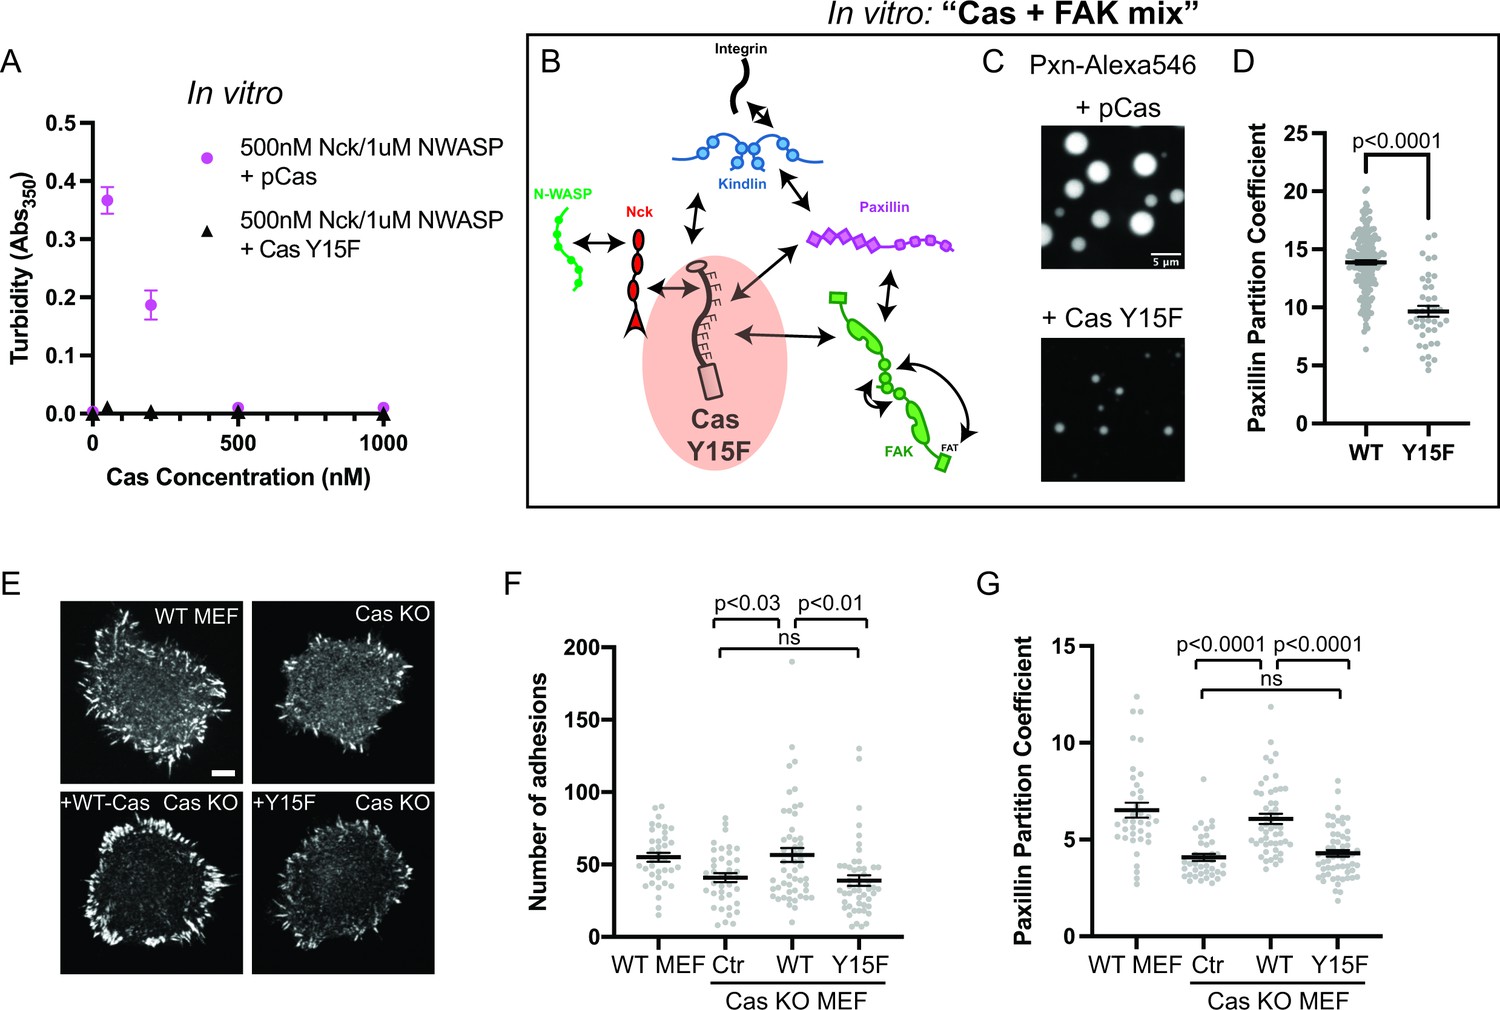
Integrin adhesion complexes are sensitive to genetic perturbations that alter Cas-dependent phase separation.
(A) In vitro solution turbidity measurements. 500 nM Nck and 1 µM N-WASP were combined with increasing concentrations of phosphorylated Cas (pCas, magenta) or Y15F Cas (black). Each point represents the mean ± SEM of three independent measurements. (B) Representation of in vitro experiments in C-D. (C) Spinning disk confocal fluorescence microscopy images of droplets formed with the Cas + FAK mix. TOP: 1 μM each of pCas, Nck, N-WASP, Kin, FAK, and paxillin (15% Alexa546); BOTTOM: 1 μM each of Y15F Cas, Nck, N-WASP, Kin, FAK, and paxillin (15% Alexa546). (D) Quantification of paxillin partitioning into droplets. Each condition contains at least 40 measurements from two independent experiments. (E) Spinning disk fluorescence microscopy images of MEFs with immunostaining for endogenous paxillin. (F) Quantification of number of adhesions. (G) Quantification of paxillin partitioning into adhesions (partition coefficient). Significance tested by one-way ANOVA followed by a Tukey multiple comparison test. In (C) scalebar = 5 μm. In (E) scalebar = 10 μm. Note that the pCas protein used in Figure 6 is a different batch than protein used in Figures 1—5 (See Figure 1—figure supplement 3).
Figure 6—figure supplement 1
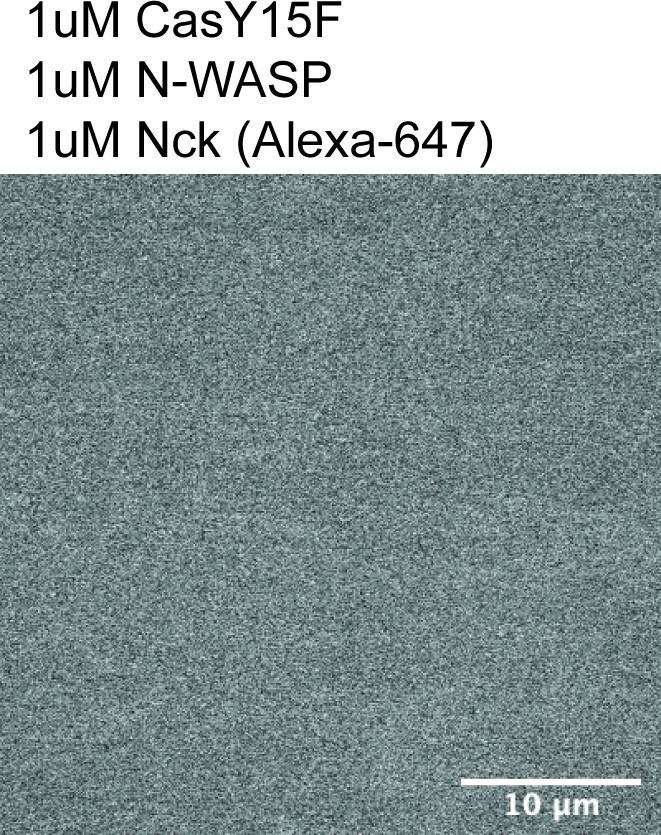
Cas Y15F does not form droplets.
Spinning disk fluorescence microscopy images of solution containing 1 μM Cas Y15F, 1 μM N-WASP and 1 μM Nck (15% Alexa-647). Scale bar = 10 μm.
Figure 6—figure supplement 2
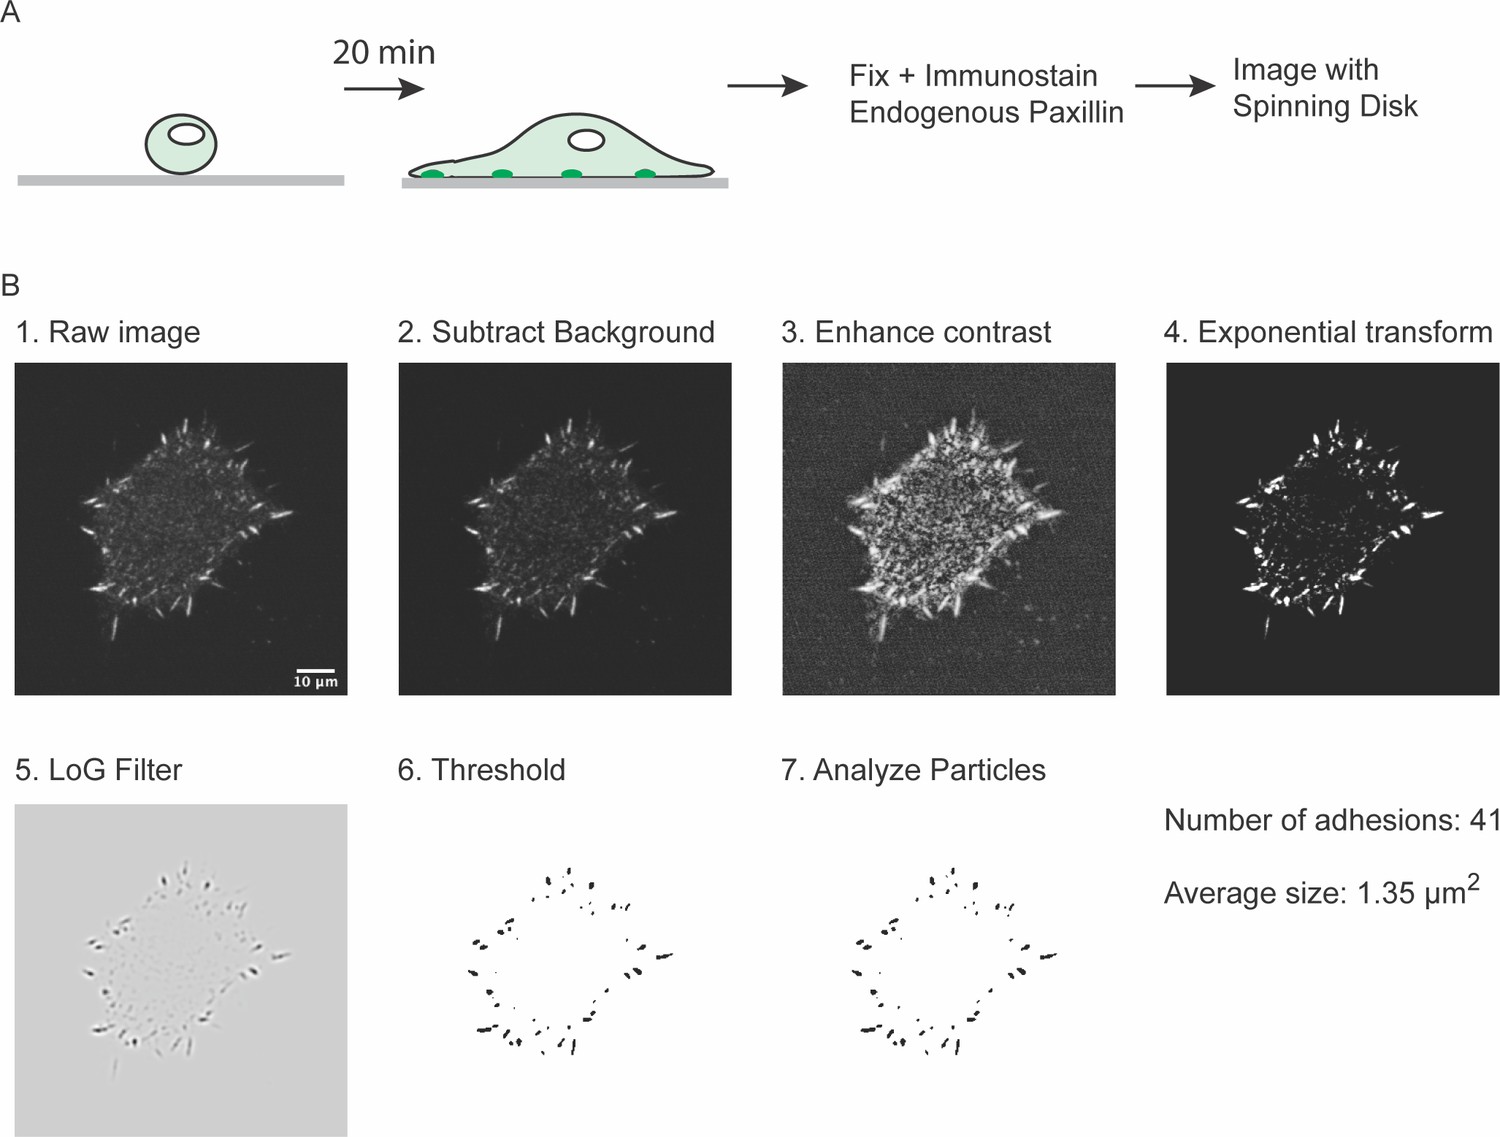
Measuring number of integrin adhesions during cell spreading.
(A) Experimental workflow (B) Example of image analysis workflow. Scale bar = 10 μm.
Figure 6—figure supplement 3
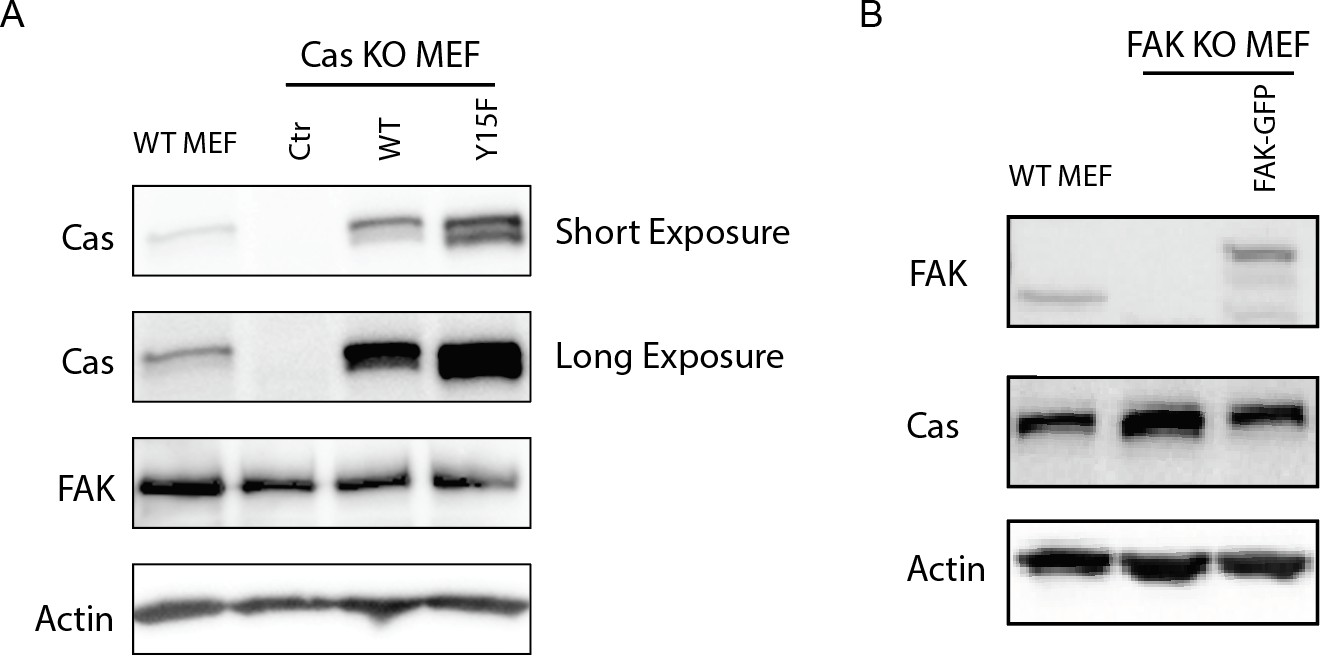
Westernblot analysis of MEF cell lines.
Cell lysates were blotted with antibodies to p130Cas (Cas), FAK, and actin. (A) Cas MEF cell lines were assessed (WT MEF, Cas knockout (KO)+ Control vector, Cas KO+ WT Cas vector, Cas KO+ Y15 F Cas vector). (B) FAK MEF cell lines were assessed (WT MEF, FAK KO, FAK KO+ WT-FAK-GFP).
-
Figure 6—figure supplement 3—source data 1
Uncropped gel images and unprocessed gel.tif files from Figure 6—figure supplement 3.
- https://cdn.elifesciences.org/articles/72588/elife-72588-fig6-figsupp3-data1-v2.zip
Figure 7 with 3 supplements
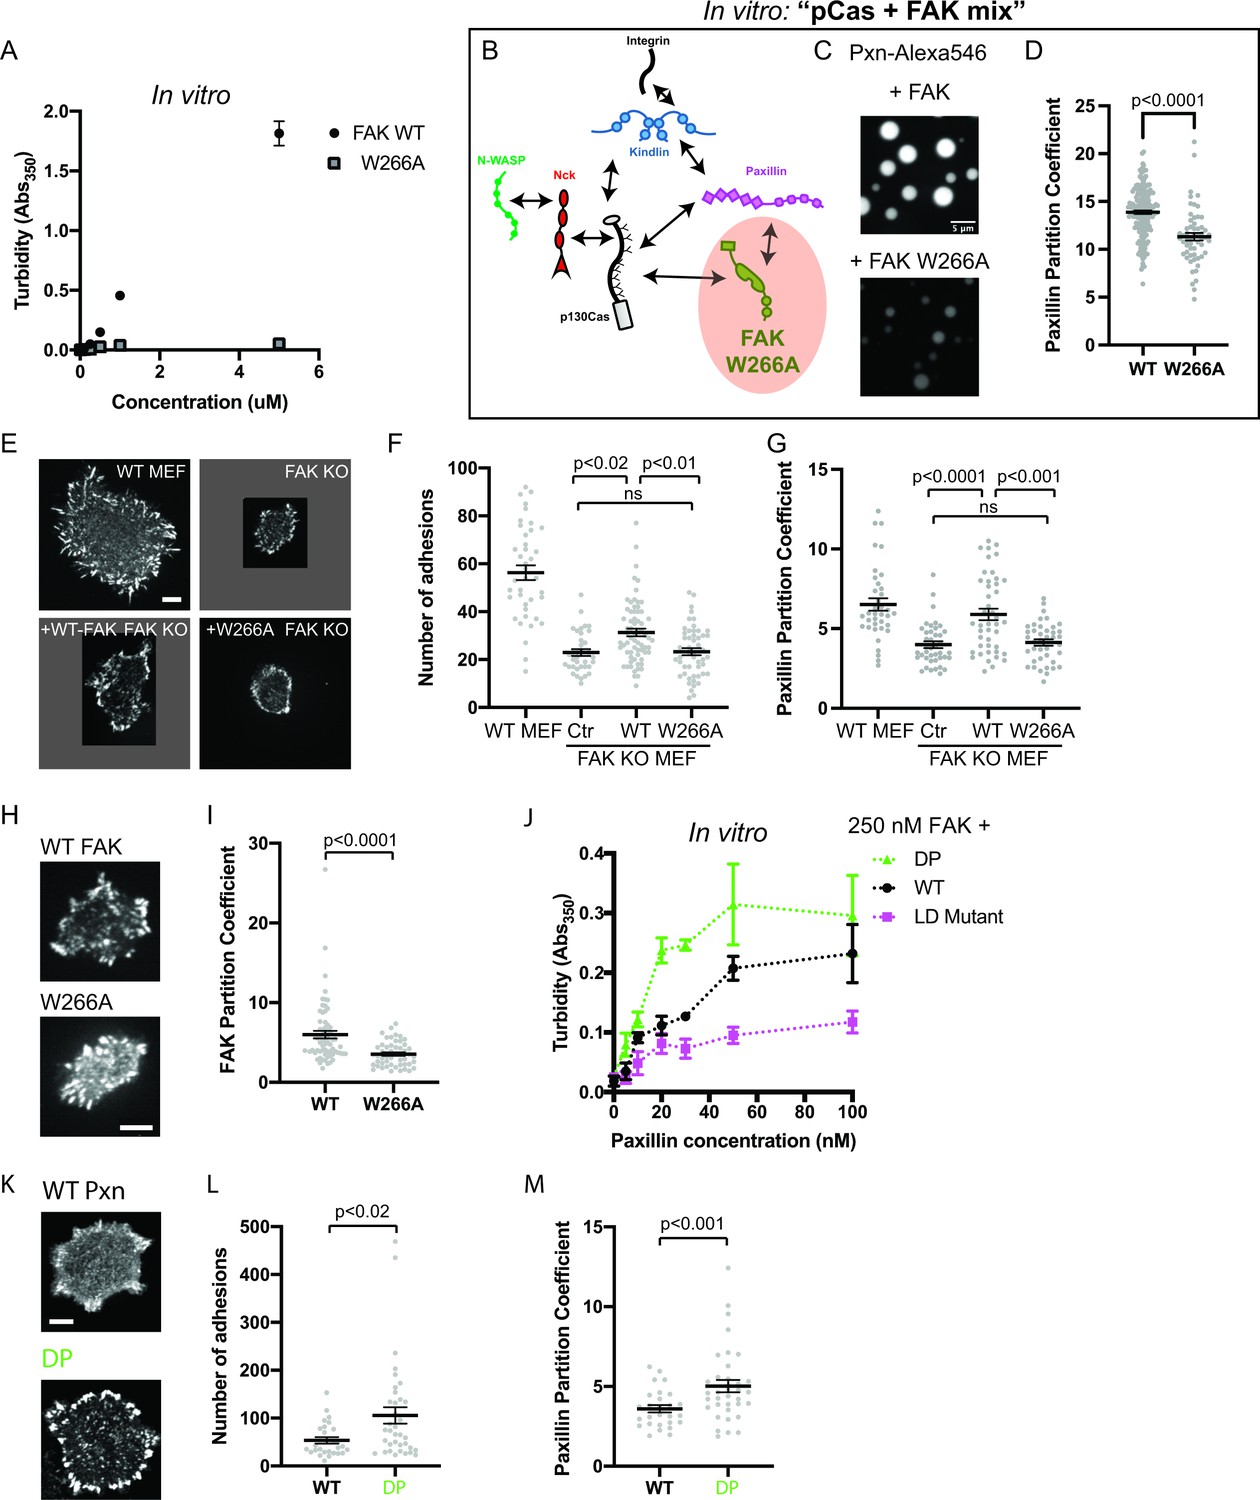
Integrin adhesion complexes are sensitive to genetic perturbations that alter FAK-dependent phase separation.
(A) In vitro solution turbidity measurements with increasing concentrations of recombinant WT FAK or W266A FAK (to inhibit dimerization). WT FAK data is duplicated from Figure 1B for comparison. Each point represents the mean ± SEM of three independent measurements. (B) Representation of in vitro experiments in C-D. (C) Spinning disk confocal fluorescence microscopy images of droplets formed with the pCas+ FAK mix. Top: 1 μM each of pCas, Nck, N-WASP, Kin, FAK, and paxillin (15% Alexa546); Bottom: 1 μM each of pCas, Nck, N-WASP, Kin, FAK W266A, and paxillin (15% Alexa546). (D) Quantification of paxillin partitioning into droplets. Each condition contains at least 40 measurements from two independent experiments. (E) Spinning disk fluorescence microscopy images of MEFs transiently expressing GFP-FAK variants with immunostaining for endogenous paxillin. (F) Quantification of number of adhesions. (G) Quantification of paxillin partitioning into adhesions (partition coefficient). (H) Spinning disk fluorescence microscopy images of MEFs transiently expressing GFP-FAK variants. (I) Quantification of GFP-FAK partitioning into adhesions (partition coefficient). (J) In vitro solution turbidity measurements of paxillin variants. 250 nM recombinant FAK was combined with increasing concentrations of recombinant paxillin variants. (K) Spinning disk confocal fluorescence microscopy images of MEF cells transiently expressing GFP-paxillin variants. (L) Quantification of number of adhesions. (M) Quantification of GFP-paxillin partitioning into adhesions (partition coefficient). In (F), (G), (I), (L) and (M) each grey point represents a measurement from one cell, and the mean ± SEM mean is indicated by black lines. Data from at least 35 cells from two or more independent experiments. In (D), (F) and (G) significance tested by one-way ANOVA followed by a Tukey multiple comparison test. In (I), (L) and (M) significance tested by an unpaired t-test. In (C) scalebar = 5 μm. All other scale bars = 10 μm. Note that the pCas protein used in Figure 7 is a different batch than protein used in Figures 1—5 (See Figure 1—figure supplement 3).
Figure 7—figure supplement 1
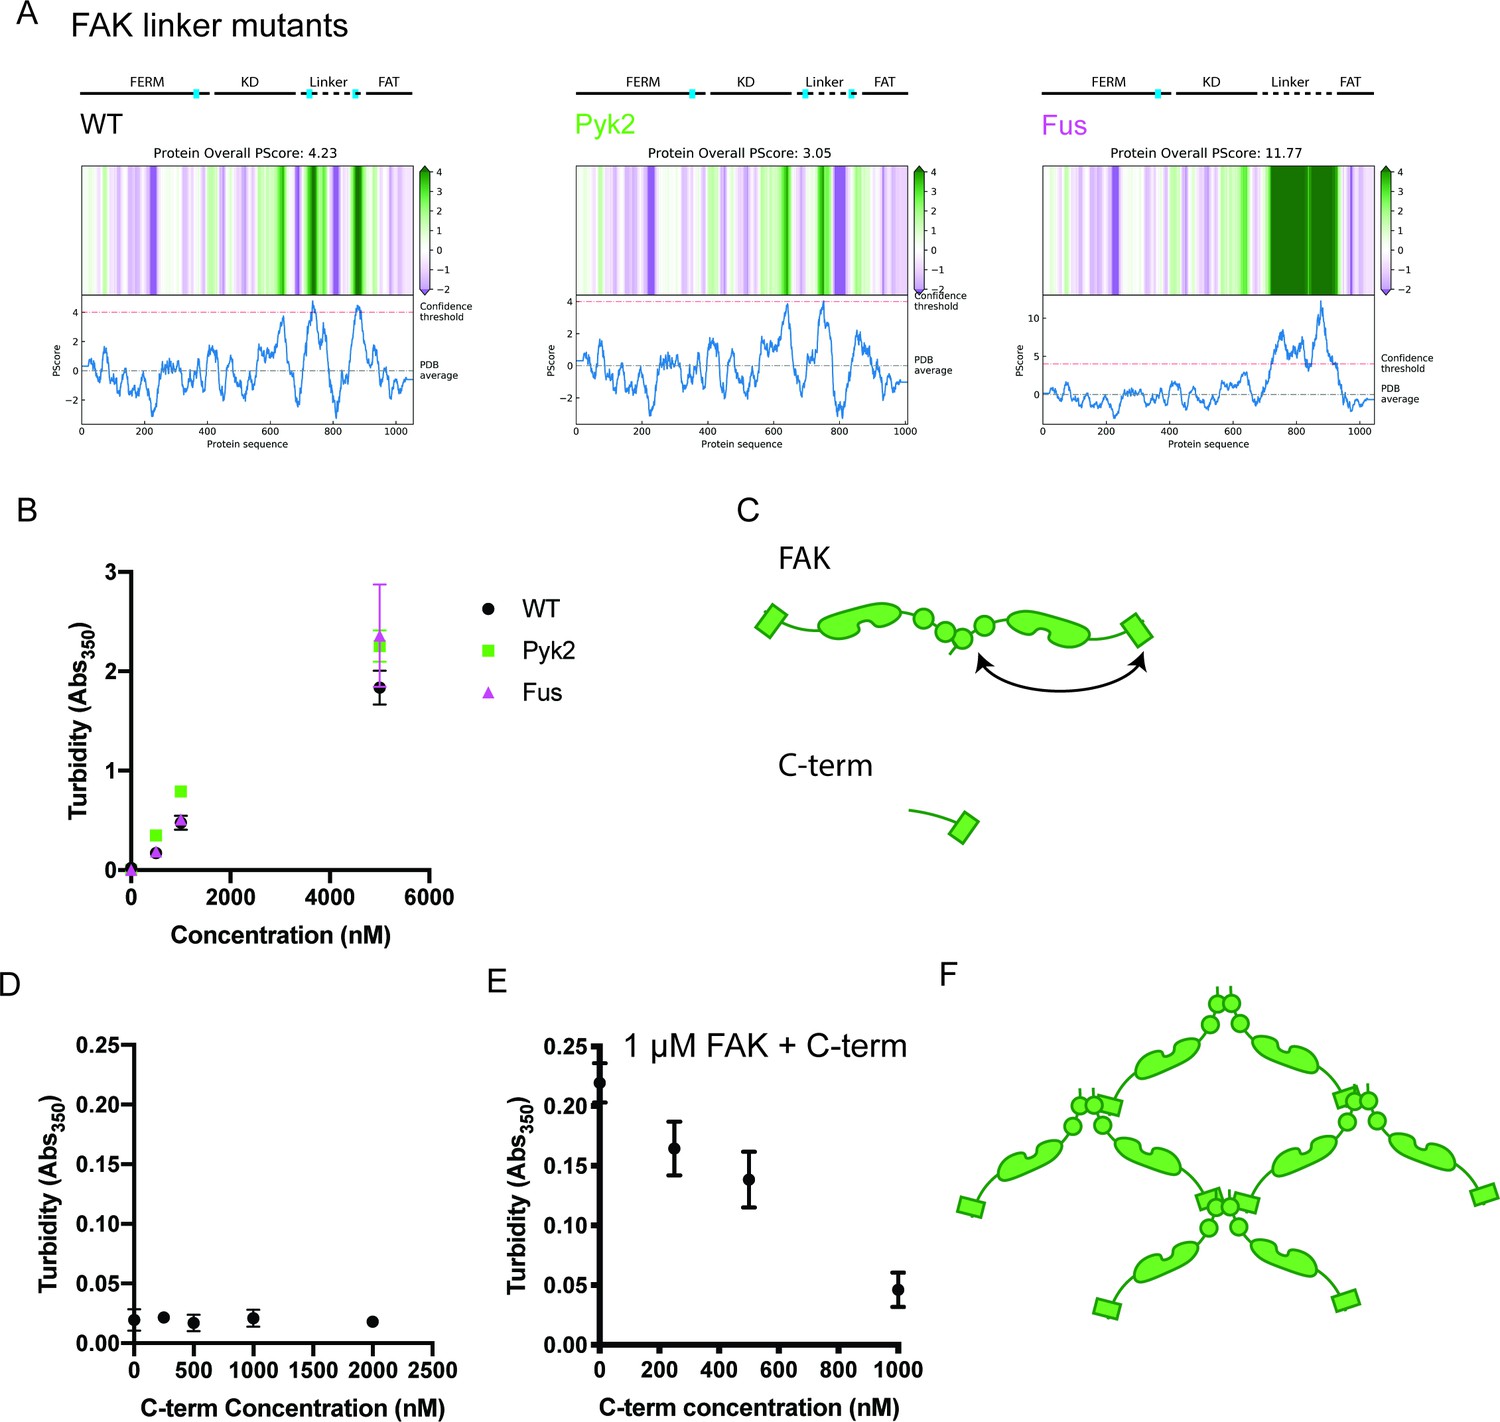
In vitro analysis of FAK phase separation.
(A) Computational analysis of FAK linker mutant phase separation propensity. (B) Solution turbidity measurements with increasing concentrations of FAK linker mutants. WT FAK data is duplicated from Figure 2B. (C) Cartoon schematic of FAK C-terminal truncation (‘C-term’). Full-length FAK with FERM domain and FAT domain annotated is shown for comparison. (D) Solution turbidity measurements with increasing concentrations of FAK C-terminal truncation. (E) Solution turbidity measurements with 1 μ M FAK combined with increasing concentrations of FAK C-terminal truncation. In (B), (D), and (E) each point represents mean ± SEM. (F) Illustration demonstrating how FERM:FERM + FERM:FAT interactions could promote higher order oligomerization.
Figure 7—figure supplement 2
FAK W266A does not form droplets.
Spinning disk fluorescence microscopy images of solution containing 1 μM FAK W266A (1% Alexa-546). Scalebar = 10 μm.
Figure 7—figure supplement 3

Paxillin valence variants.
Cartoon schematic of engineered paxillin valence variants. Paxillin LD mutant has reduced FAK binding, while double paxillin (DP) has increased number of FAK binding sites.
Figure 8 with 2 supplements
Cas and FAK synergistically promote nascent adhesion assembly during cell spreading.
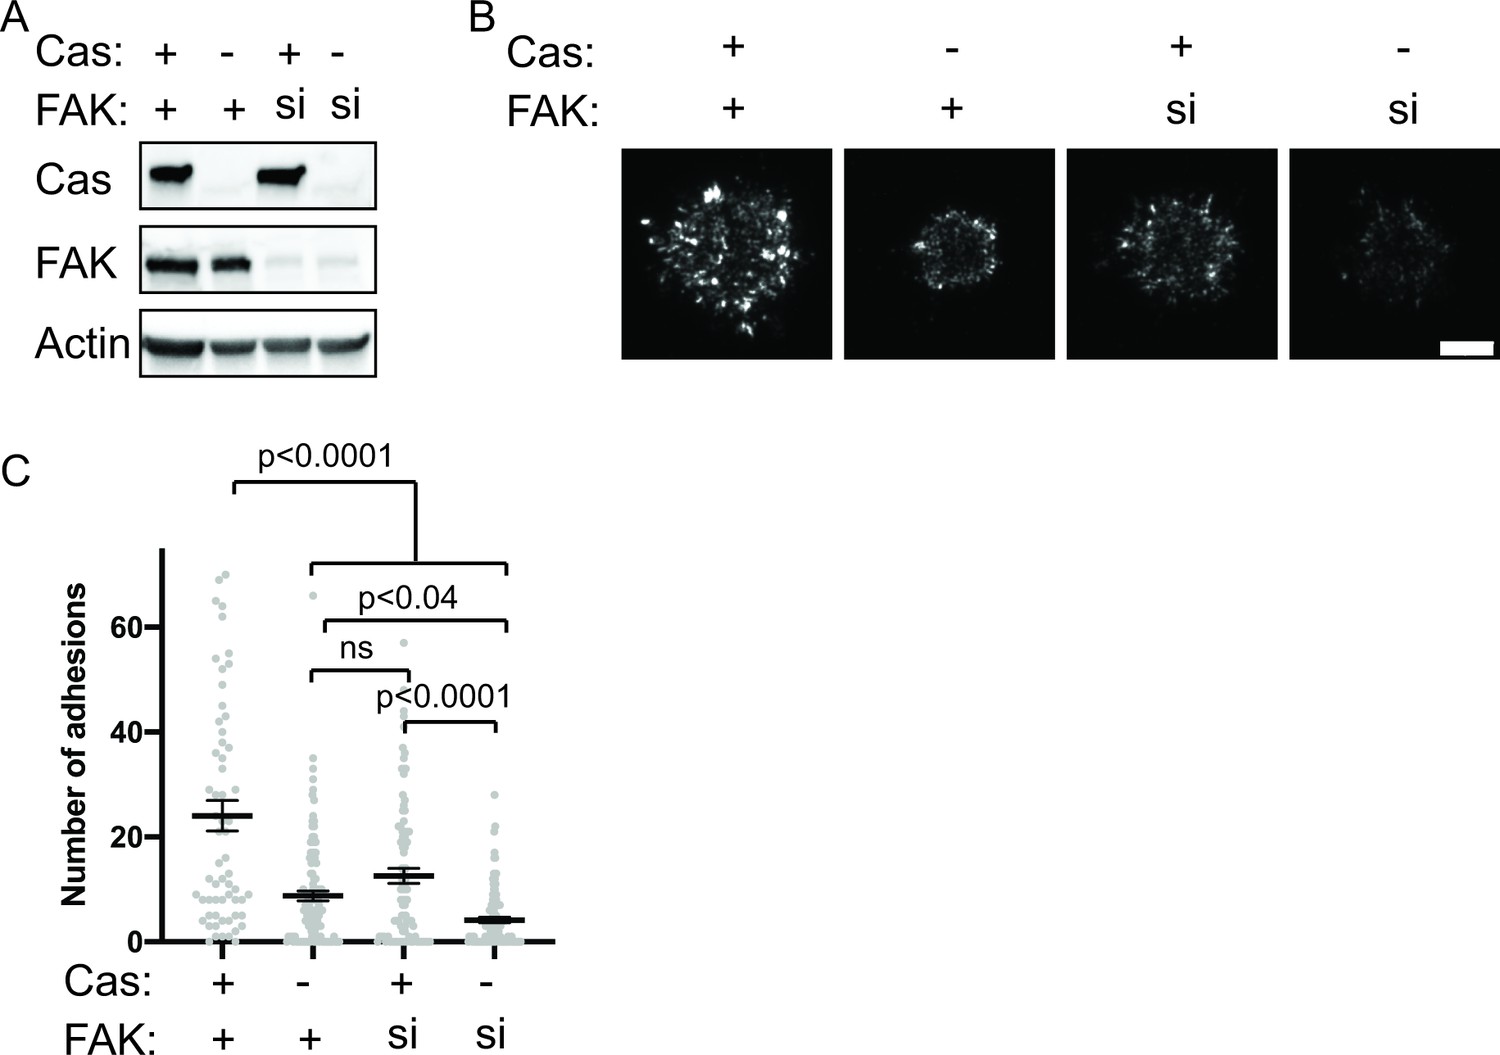
(A) Western blot analysis of FAK knockdown. WT (+) or Cas knockout (-) MEFs were treated with nontargeting (+) or FAK (si) siRNA for 48 hr and lysates were blotted with Cas, FAK or actin antibodies. (B) Total Internal Reflection Fluorescence (TIRF) microscopy images of MEFs fixed after 5 min of spreading with immunostaining for endogenous paxillin. Scalebar = 5 μm. (C) Quantification of number of adhesions. Each grey point represents a measurement from one cell, and the mean ± SEM mean is indicated by black lines. Data from at least 60 cells from two or more independent experiments. Significance tested by one-way ANOVA followed by a Tukey multiple comparison test.
-
Figure 8—source data 1
Uncropped gel images and unprocessed gel.tif files from Figure 8a.
- https://cdn.elifesciences.org/articles/72588/elife-72588-fig8-data1-v2.zip
Figure 8—figure supplement 1
Number of adhesions in FAK knockout cells after 5 min spreading.
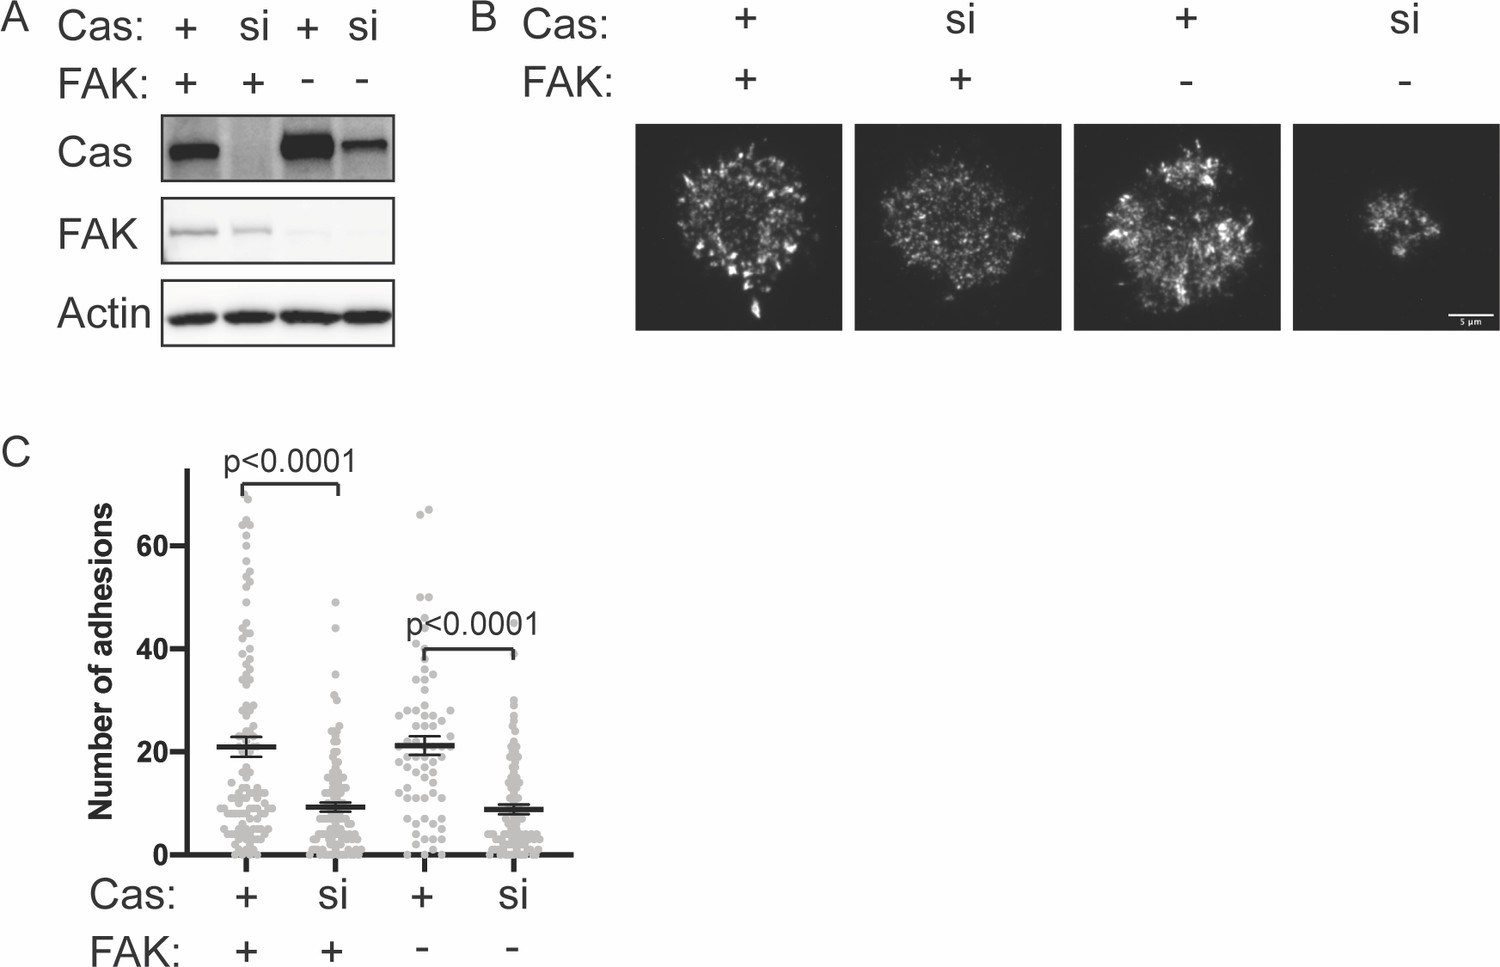
(A) Western blot analysis of Cas knockdown. WT or FAK knockout (KO) MEFs were treated with nontargeting (+) or Cas (si) siRNA for 48 hr and lysates were blotted with Cas, FAK, or actin antibodies. (B) Total Internal Reflection Fluorescence (TIRF) microscopy images of MEFs fixed after 5 min of spreading with immunostaining for endogenous paxillin. Scale bar = 5 μm. (C) Quantification of number of adhesions. Each gray point represents a measurement from one cell, and the mean ± SEM mean is indicated by black lines. Data from at least 45 cells from two or more independent experiments. Significance tested by one-way ANOVA followed by a Tukey multiple comparison test.
-
Figure 8—figure supplement 1—source data 1
Uncropped gel images and unprocessed gel tif files from Figure 8—figure supplement 1.
- https://cdn.elifesciences.org/articles/72588/elife-72588-fig8-figsupp1-data1-v2.zip
Figure 8—figure supplement 2
Number of adhesions in Cas knockout cells after 20 min spreading.
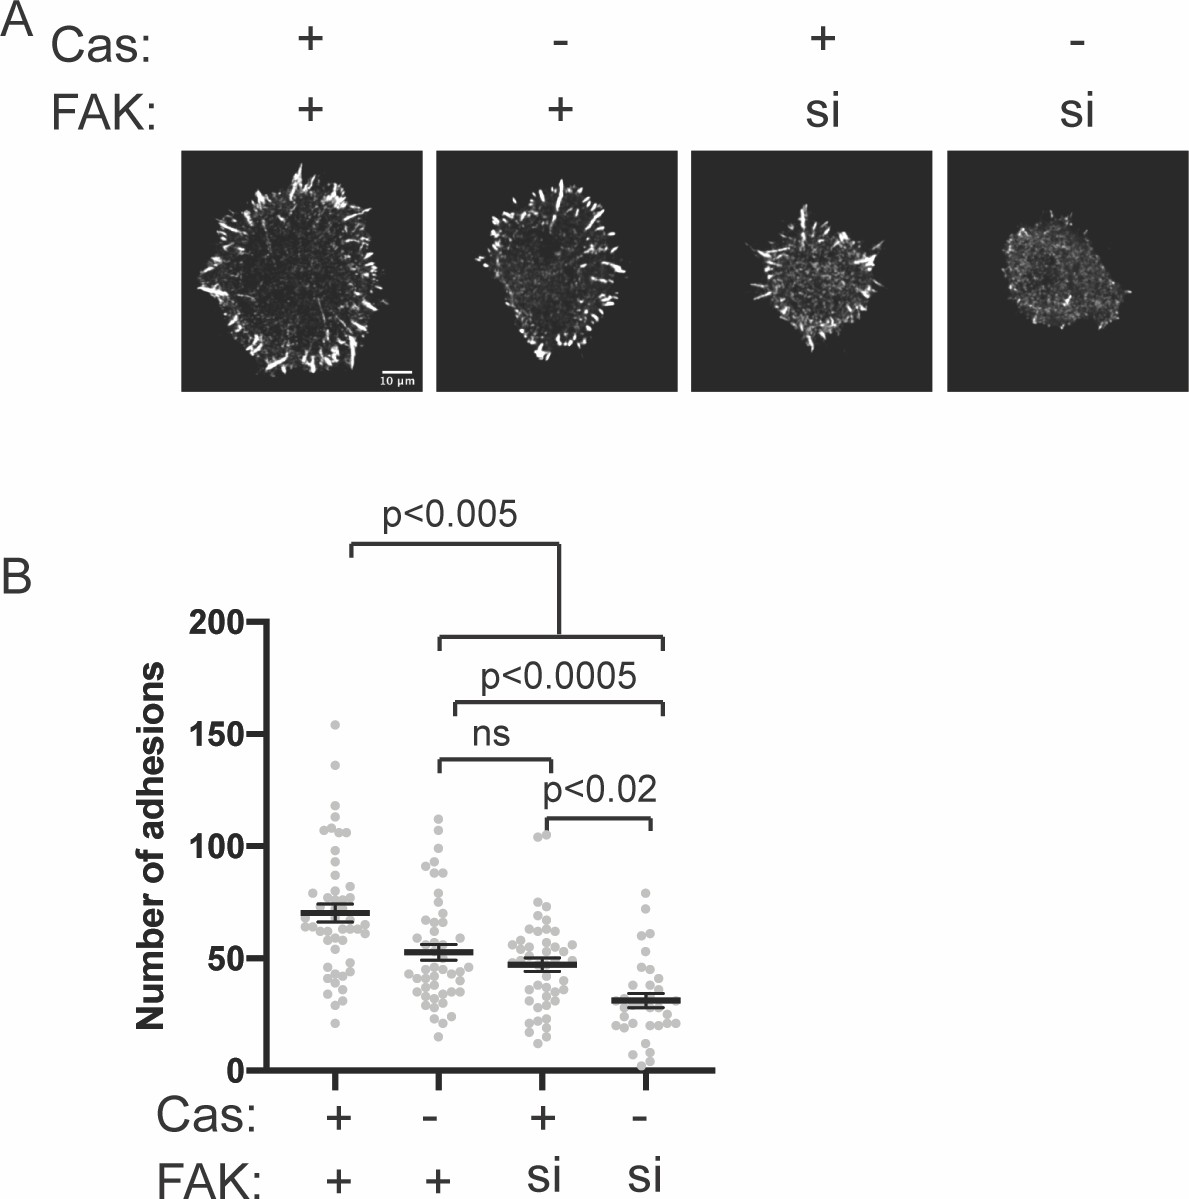
(A) Spinning disk confocal microscopy images of MEFs fixed after 20 min of spreading with immunostaining for endogenous paxillin. Scalebar = 10 μm. (B) Quantification of number of adhesions. Each grey point represents a measurement from one cell, and the mean ± SEM mean is indicated by black lines. Data from at least 30 cells from two or more independent experiments. Significance tested by one-way ANOVA followed by a Tukey multiple comparison test.
Author response image 1

Author response image 2
Author response image 3
Author response image 4
Author response image 5
Author response image 6
Author response image 7
Author response image 8
Author response image 9
Author response image 10
Tables
Key resources table
| Reagent type (species) or resource | Designation | Source or reference | Identifiers | Additional information |
|---|---|---|---|---|
| Strain, strain background (Escherichia coli) | BL21(DE3) Competent E. coli | New England BioLabs | Cat#C2527I | Chemically competent E. coli. |
| Strain, strain background (Escherichia coli) | MAX Efficiency DH10Bac Competent Cells | Thermo Fisher | Cat#10361012 | Chemically competent E. coli. |
| Cell line (Mus musculus) | Ptk2+/+, Trp53-/- MEFs; WT MEFs | ATCC | CRL-2645; RRID: CVCL_8955 | |
| Cell line (Mus musculus) | Ptk2-/-, Trp53-/- MEFs; FAK KO MEFs | ATCC | CRL-2644; RRID:CVCL_8954 | |
| Cell line (Mus musculus) | Bcar1-/- MEFs + Control Vector; Cas KO control MEFs | Meenderink et al., 2010 | N/A | |
| Cell line (Mus musculus) | Bcar1-/- MEFs + CasWT Vector; Cas KO CasWT MEFs | Meenderink et al., 2010 | N/A | |
| cell line (Mus musculus) | Bcar1-/- MEFs + Cas15 F Vector; Cas KO CasY15F MEFs | Meenderink et al., 2010 | N/A | |
| Cell line (Spodoptera frugiperda) | Sf9 Cells | Gibco | Cat#11496015 | |
| Antibody | Mouse monoclonal anti-Paxillin (Clone 349/Paxillin) | BD Biosciences | Cat#610051; RRID: AB_397463 | (1:100) |
| Antibody | Mouse monoclonal anti-FAK (Clone 4.47) | Millipore | Cat#05–537; RRID: AB_2173817 | (1:1000) |
| antibody | Rabbit monoclonal anti-p130 Cas (E1L9H) | Cell Signaling Technology | Cat#13846; RRID: AB_2798328 | (1:1,000) |
| Antibody | Rabbit polyclonal anti-beta Actin | Abcam | Cat#ab8227; RRID: AB_2305186 | (1:5000) |
| Antibody | Goat polyclonal anti-Mouse IgG, Alexa Fluor 568 | Thermo Fisher | Cat#A-11004; RRID: AB_2534072 | (1:250) |
| Antibody | Goat polyclonal anti-Mouse IgG, HRP | Santa Cruz Biotechnology | Cat#sc-2005; RRID: AB_631736 | (1:10,000) |
| Antibody | Goat polyclonal anti-Rabbit IgG, HRP | Santa Cruz Biotechnology | Cat# sc-2030; RRID: AB_631747 | (1:10,000) |
| Sequence-based reagent | ON-TARGETplus Mouse Bcar1 (12927) siRNA - SMARTpool | Horizon Discovery (Dharmacon) | Cat#L-041961-00-0005 | Commercially available |
| Sequence-based reagent | ON-TARGETplus Non-targeting Control Pool | Horizon Discovery (Dharmacon) | Cat#D-001810-10-05 | Commercially available |
| Sequence-based reagent | ON-TARGETplus Mouse Ptk2 siRNA - SMARTpool | Horizon Discovery (Dharmacon) | Cat#L-041099-00-0005 | Commercially available |
| Chemical compound, drug | Alexa Fluor 647 C2 Maleimide | Invitrogen | Cat#A20347 | |
| Chemical compound, drug | Alexa Fluor 488 C5 Maleimide | Invitrogen | Cat#A10254 | |
| Chemical compound, drug | Alexa Fluor 568 C5 Maleimide | Invitrogen | Cat#A20341 | |
| Chemical compound, drug | SNAP-Surface Alexa Fluor 546 | New England BioLabs | Cat#S9132S | |
| Chemical compound, drug | SNAP-Surface Alexa Fluor 488 | New England BioLabs | Cat#S9129S | |
| Chemical compound, drug | Intracellular pH Calibration Buffer Kit (Nigericin/Valinomycin) | Invitrogen | Cat#P35379 | |
| Software, algorithm | MATLAB | Mathworks | ||
| Software, algorithm | FIJI | https://fiji.sc | RRID:SCR_002285 | |
| Other | POPC | Avanti Polar Lipids | Cat# 850457C | |
| Other | PEG5000-PE | Avanti Polar Lipids | Cat# 880230C | |
| Other | DGS-NTA-Ni | Avanti Polar Lipids | Cat# 790404C | |
| Other | NBD PC | Avanti Polar Lipids | Cat# 810130C |
Additional files
-
Supplementary file 1
Curation of published Fluorescence Recovery After Photobleaching (FRAP) measurements of integrin adhesion components.
Proteins used in this study are in bold.~ indicates the percent recovery was estimated from graph.
- https://cdn.elifesciences.org/articles/72588/elife-72588-supp1-v2.docx
-
Supplementary file 2
Curation of published studies characterizing the interactions between proteins used in this study.
Unless the specific domain is indicated in parentheses, studies used full-length protein. Technique abbreviations: ITC: Isothermal Titration Calorimetry; FCS: Fluorescence correlation spectroscopy; Co-IP: Co-immunoprecipitation; SPR: Surface Plasmon Resonance; NMR HSQC: Nuclear Magnetic Resonance Heteronuclear Single Quantum Coherence; AUC: Analytical ultracentrifugation.
- https://cdn.elifesciences.org/articles/72588/elife-72588-supp2-v2.docx
-
Supplementary file 3
Curation of published estimations of cellular concentrations for proteins used in this study.
- https://cdn.elifesciences.org/articles/72588/elife-72588-supp3-v2.docx
-
Supplementary file 4
Fluorescence Recovery After Photobleaching (FRAP) curve exponential fit of data.
Biexponential and single exponential fits were statistically compared with an extra sum-of-squares F Test to determine the best fit. Values of best fit are shown in table. nd = not determined. For several molecules, the percent recovery could not be accurately fit from these data, as the recovery did not sufficiently plateau within the 90 second experiment.
- https://cdn.elifesciences.org/articles/72588/elife-72588-supp4-v2.docx
-
Supplementary file 5
Protein domains of consensus adhesome components (Adhesome components identified in Horton et al., 2015; domains identified using http://pfam.xfam.org).
Proteins with multivalent domains shaded grey. Proteins with intrinsically disordered regions longer than 100 amino acids (IDR >100) also indicated.
- https://cdn.elifesciences.org/articles/72588/elife-72588-supp5-v2.docx
-
Supplementary file 6
Recombinant DNA used in this study.
DNA used for expression in bacteria, SF9 cells (pFastBac vector), or mammalian cells (mEGFP-C1 vector). For bacteria and SF9 cell plasmids, the protein sequence of final protease-cleaved and purified protein is shown. For mammalian expression plasmids, the expressed protein sequence is shown.
- https://cdn.elifesciences.org/articles/72588/elife-72588-supp6-v2.docx
-
Transparent reporting form
- https://cdn.elifesciences.org/articles/72588/elife-72588-transrepform1-v2.pdf
Download links
A two-part list of links to download the article, or parts of the article, in various formats.
Downloads (link to download the article as PDF)
Open citations (links to open the citations from this article in various online reference manager services)
Cite this article (links to download the citations from this article in formats compatible with various reference manager tools)
Synergistic phase separation of two pathways promotes integrin clustering and nascent adhesion formation
eLife 11:e72588.
https://doi.org/10.7554/eLife.72588


