Structural organization and dynamics of FCHo2 docking on membranes
- Institut de Recherche en Infectiologie de Montpellier (IRIM), CNRS UMR 9004, Université de Montpellier, France
- U1067 INSERM, Aix-Marseille Université, France
- Institut d'Électronique et des Systèmes (IES), CNRS UMR 5214, Université de Montpellier, France
- Montpellier Ressources Imagerie, BioCampus Montpellier, CNRS, INSERM, Université de Montpellier, France
- Centre de Biologie Cellulaire de Montpellier (CRBM), CNRS UMR UMR 5237, Université de Montpellier, France
- INSERM UMR1297, Institute of Metabolic and Cardiovascular Diseases (I2MC), University of Toulouse, Paul Sabatier University, France
- Sorbonne Université, INSERM, Institute of Myology, Centre of Research in Myology, UMRS 974, France
Figures
Figure 1 with 6 supplements
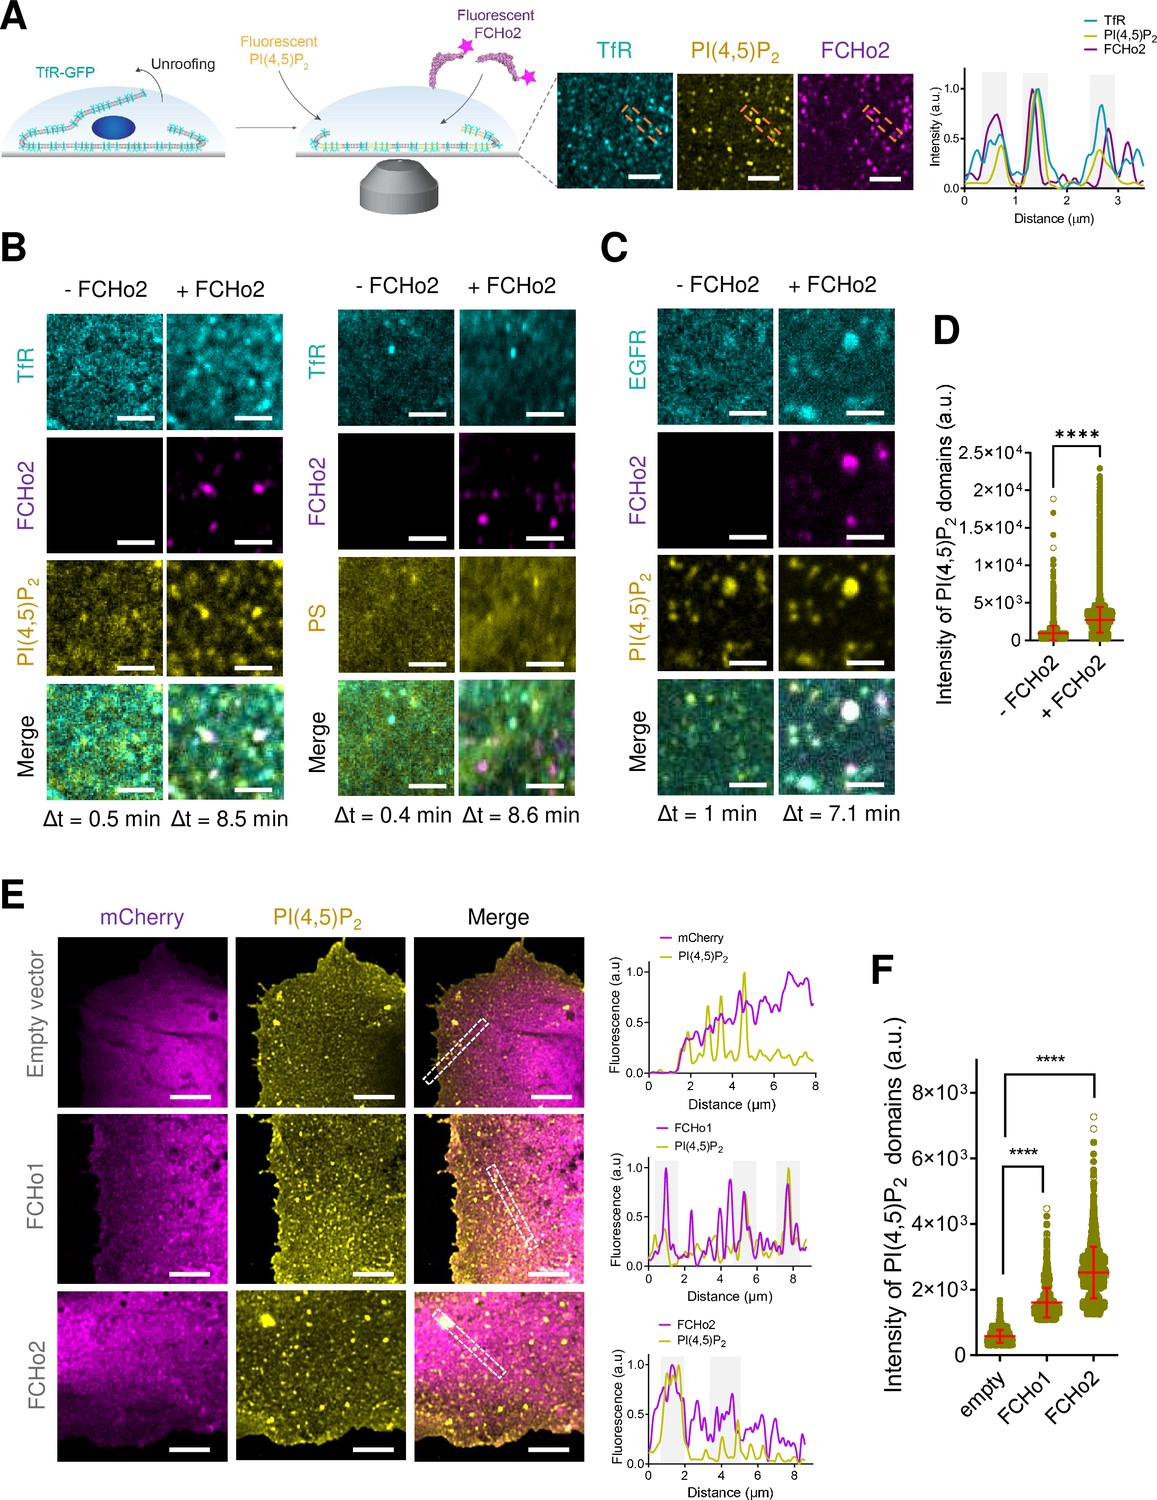
FCHo2 induces PI(4,5)P2 clustering at the boundary of cargo receptors.
(A) Left: cartoon of the experimental setup to monitor the recruitment of FCHo2-Alexa647 on cellular membranes loaded with fluorescent PI(4,5)P2. Right: representative still airyscan images showing the co-localization of TfR-GFP (cyan), PI(4,5)P2 (yellow), and FCHo2 (magenta) on plasma membrane sheets and cross-sectional analysis of FCHo2-positive puncta highlighted by the orange dashed box. Scale bar, 2 µm. (B, C) Representative z-projected time-lapse confocal images of plasma membrane sheets showing the co-localization of PI(4,5)P2 or PS (yellow) and clathrin-regulated cargoes TfR or EGFR (cyan) before (-FCHo2) and after the addition of FCHo2 (+FCHo2, magenta). The projected time interval (Δt) is specified below each image. Scale bar, 2 µm. (D) Distribution of the intensity of PI(4,5)P2 domains before (-FCHo2) and after addition of FCHo2 (+FCHo2) on plasma membrane sheets. Mean ± SD, in red. Welch’s t-test (****p<0.0001). The number of PI(4,5)P2 domains analyzed from three replicates was n = 4397 and n = 33815, respectively, from at least three replicates. (E) Representative airyscan images showing a maximum intensity projection of one stack of the basal plasma membrane of HT1080 cells transiently transfected with either mCherry (empty vector), mCherry-FCHo1, or mCherry-FCHo2 (magenta) and stained for endogenous PI(4,5)P2 (yellow). Cross-sectional analysis of plasma membrane regions highlighted by the white dashed box in the corresponding image. Scale bar, 4 µm. (F) Distribution of the intensity of PI(4,5)P2 domains at the plasma membrane of cells transfected with either mCherry (empty), mCherry-FCHo1 (FCHo1), or mCherry-FCHo2 (FCHo2). Mean ± SD, in red. One-way ANOVA (****p<0.0001). The number of PI(4,5)P2 domains analyzed was n = 1647, n = 2,164, and n = 2608, respectively, from three independent experiments.
-
Figure 1—source data 1
Intensity of PI(4,5)P2 domains.
- https://cdn.elifesciences.org/articles/73156/elife-73156-fig1-data1-v2.xlsx
Figure 1—figure supplement 1
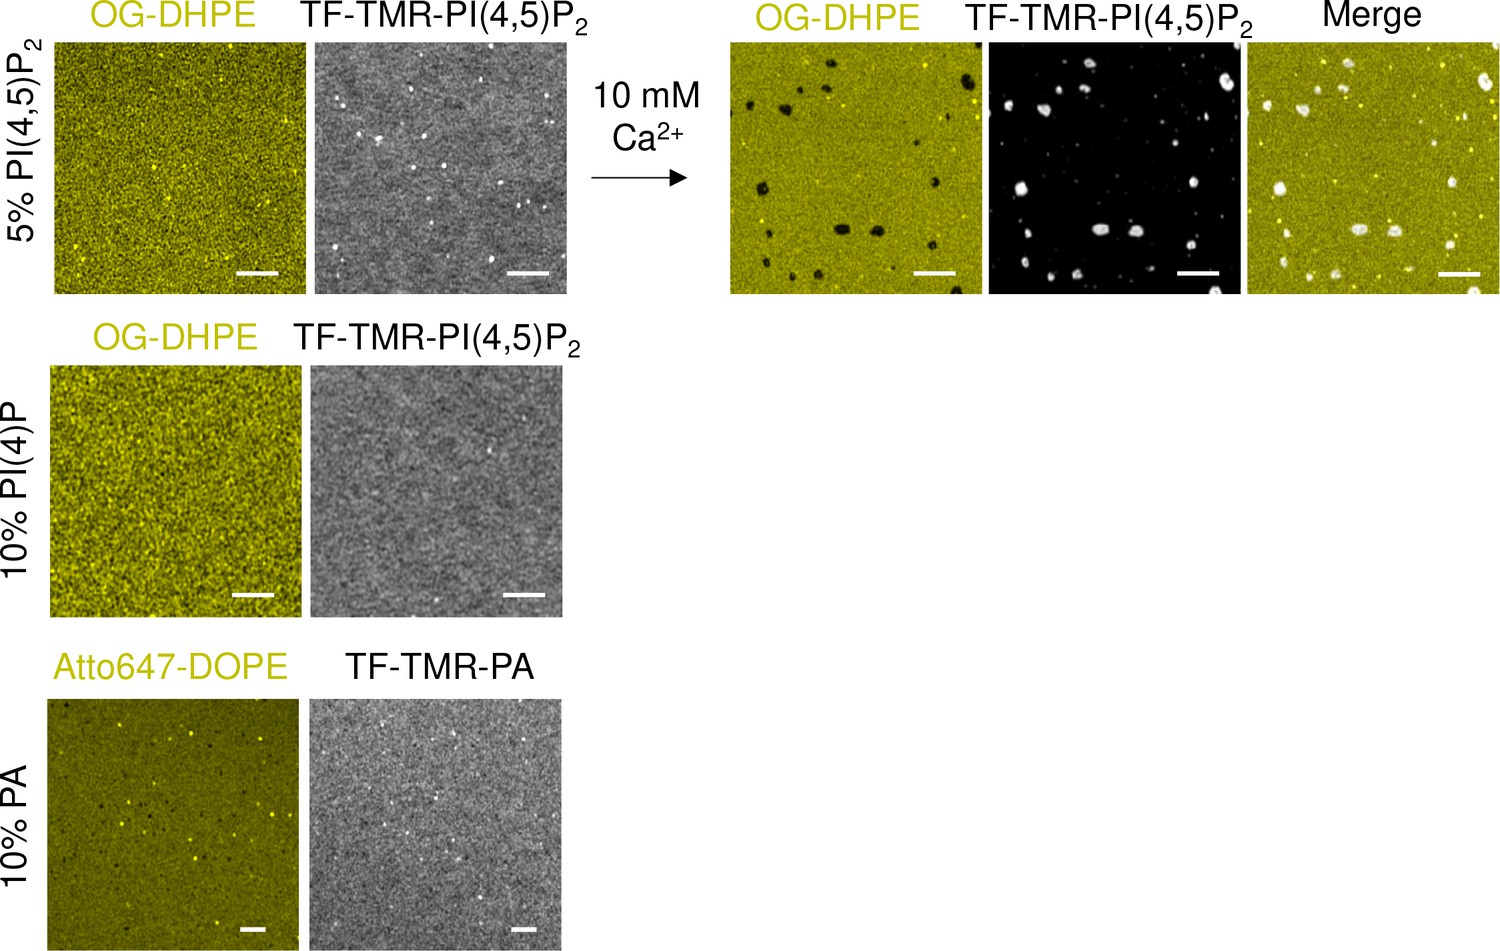
Representative airyscan images showing the lipid organization of different acidic TF-TMR lipid dyes (PI(4,5)P2, PI(4)P, and phosphatidic acid [PA] in gray) on lipid bilayers containing 20% mol of total negative charge relative to a neutral lipid dye (OG-DHPE or Atto647-DOPE).
Lipid dyes were added to a final 0.2% mol at the expenses of the nonlabeled counterpart. Addition of 10 mM of Ca2+ on lipid bilayers made of 5% PI(4,5)P2 and doped with OG-DHPE and TF-TMR-PI(4,5)P2 shows the detection of PI(4,5)P2-enriched domains on this supported lipid bilayers. Scale bar, 2 µm.
Figure 1—figure supplement 2
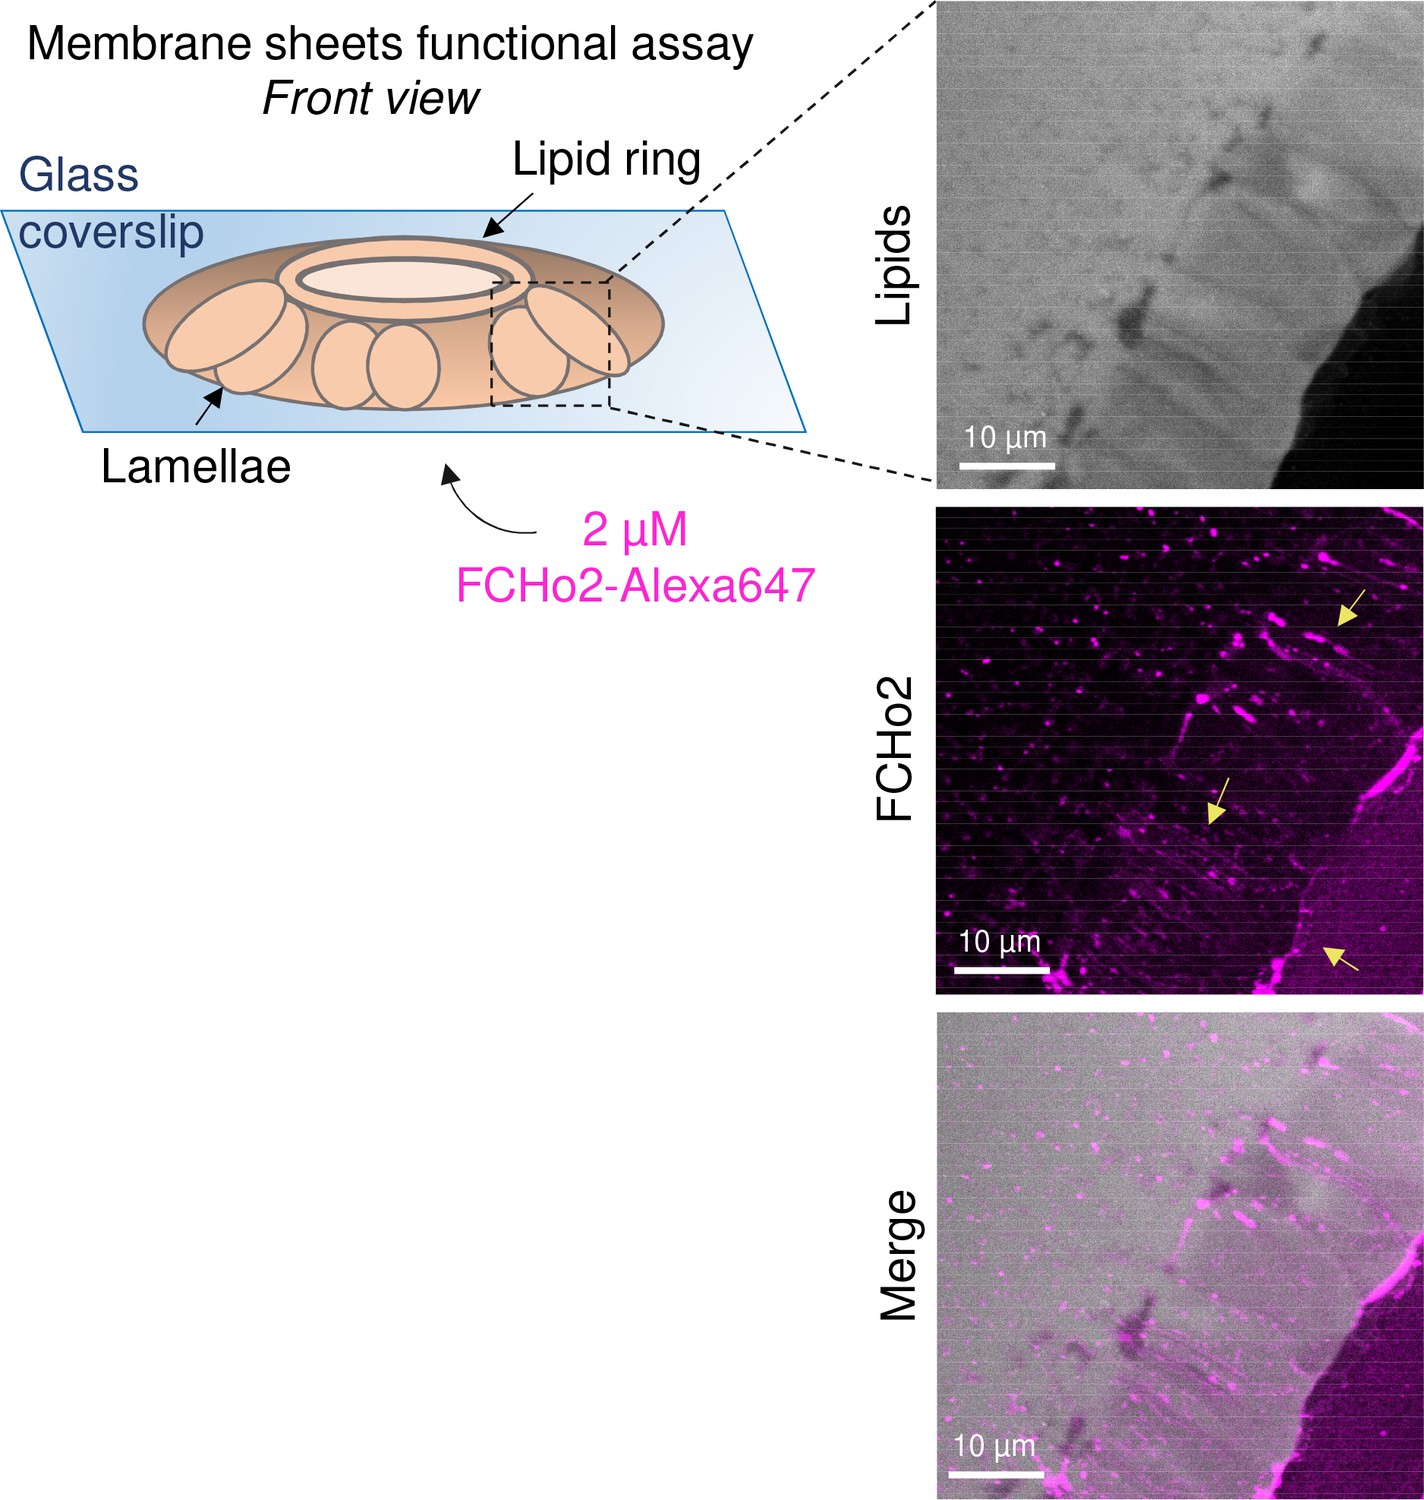
Recombinant FCHo2 forms membrane tubes in vitro.
Left: Schematic representation of the membrane sheets in vitro assay, as detailed by Itoh et al., 2005, to test the functionality of recombinant full-length FCHo2-Alexa647. Membrane sheets were made using brain polar lipid extracts (Avanti). Right: representative still confocal images showing the formation of membrane tubes after addition of 2 μM of FCHo2, as indicated by yellow arrows.
Figure 1—figure supplement 3
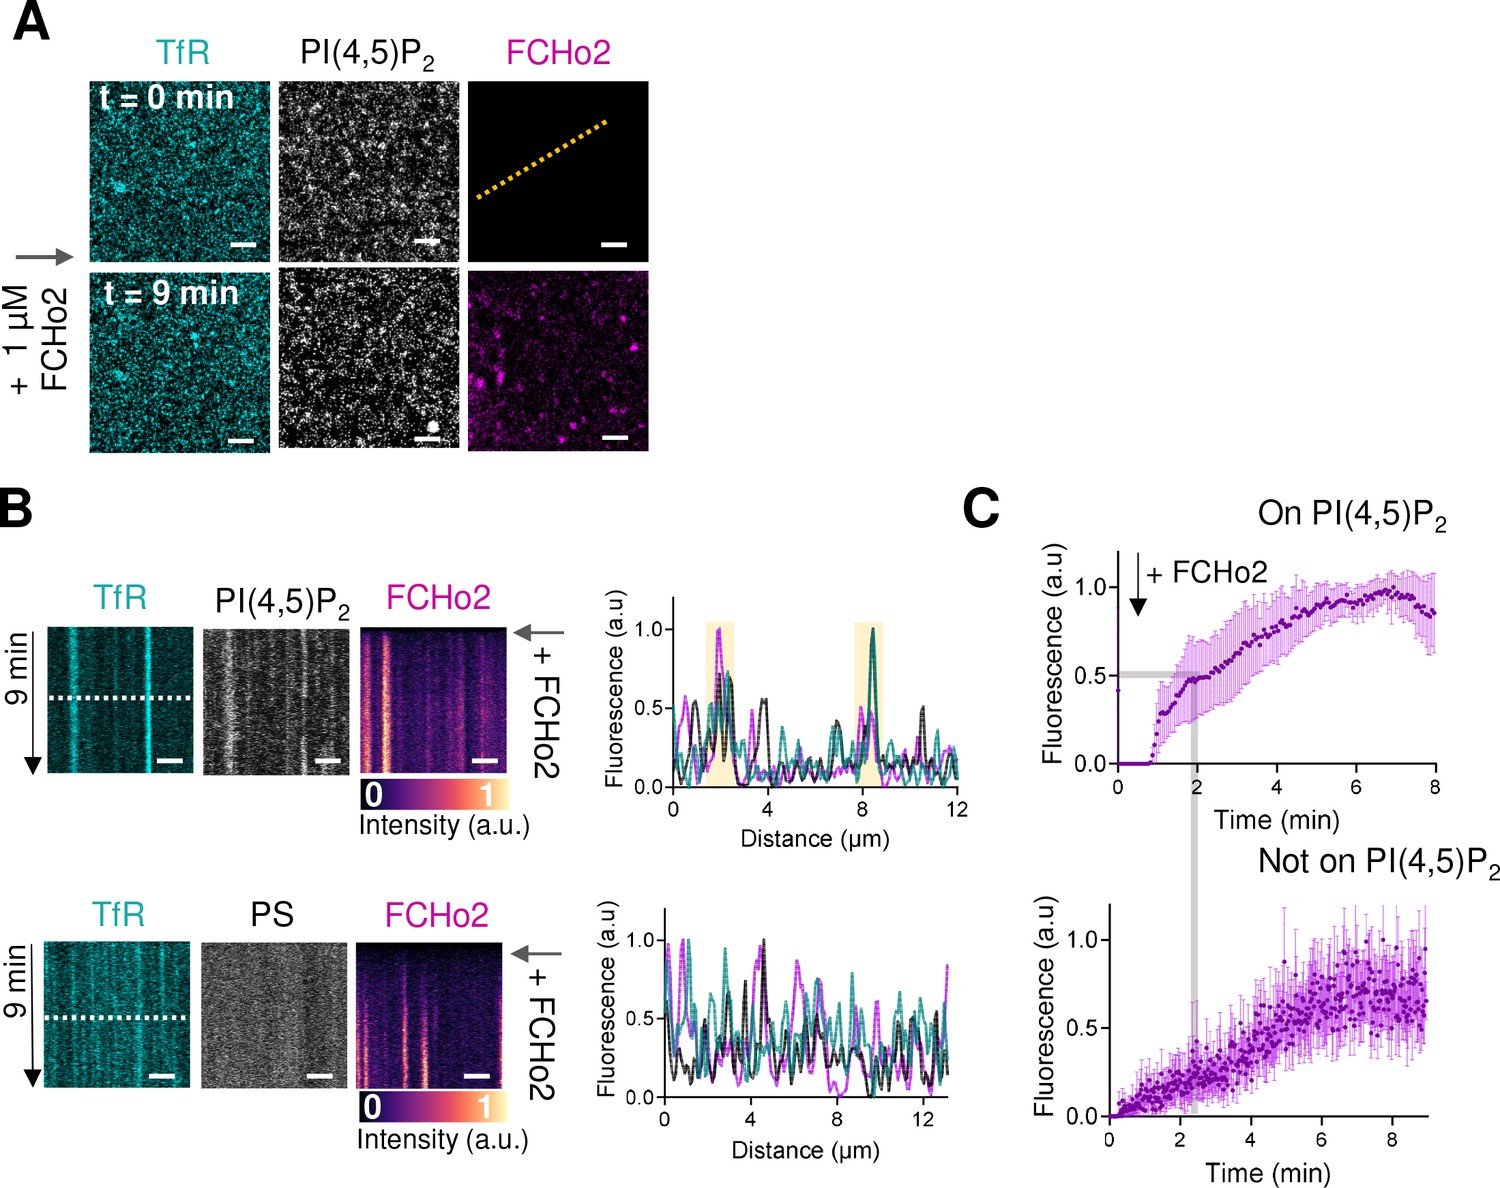
Recruitment dynamics of FCHo2 on plasma membrane sheets.
(A) Representative airyscan time lapse showing the dynamics of PI(4,5)P2 (gray), FCHo2 (magenta), and TfR-GFP (cyan) on plasma membrane sheets. Scale bar, 5 µm. (B) Top: kymograph analysis along the dashed line in (A) on plasma membrane sheets loaded with TF-TMR-PI(4,5)P2 and intensity profile of the TfR (cyan), PI(4,5)P2 (gray), and FCHo2 (magenta) along the dashed line in the kymograph. Time scale is 9 min. Bottom: representative kymograph analysis on plasma membrane sheets loaded with TF-TMR-PS and intensity profile of the TfR (cyan), PS (gray), and FCHo2 (magenta) along the dashed line in the kymograph. Time scale is 9 min. Scale bar, 2 µm. (C) Fluorescence quantification over time of the FCHo2 recruitment (magenta) on PI(4,5)P2-enriched regions (top) and not on PI(4,5)P2 (bottom) on plasma membrane sheets. Each curve represents the mean ± SD of n = 7 recruitment kinetics from experimental replicates.
Figure 1—figure supplement 4
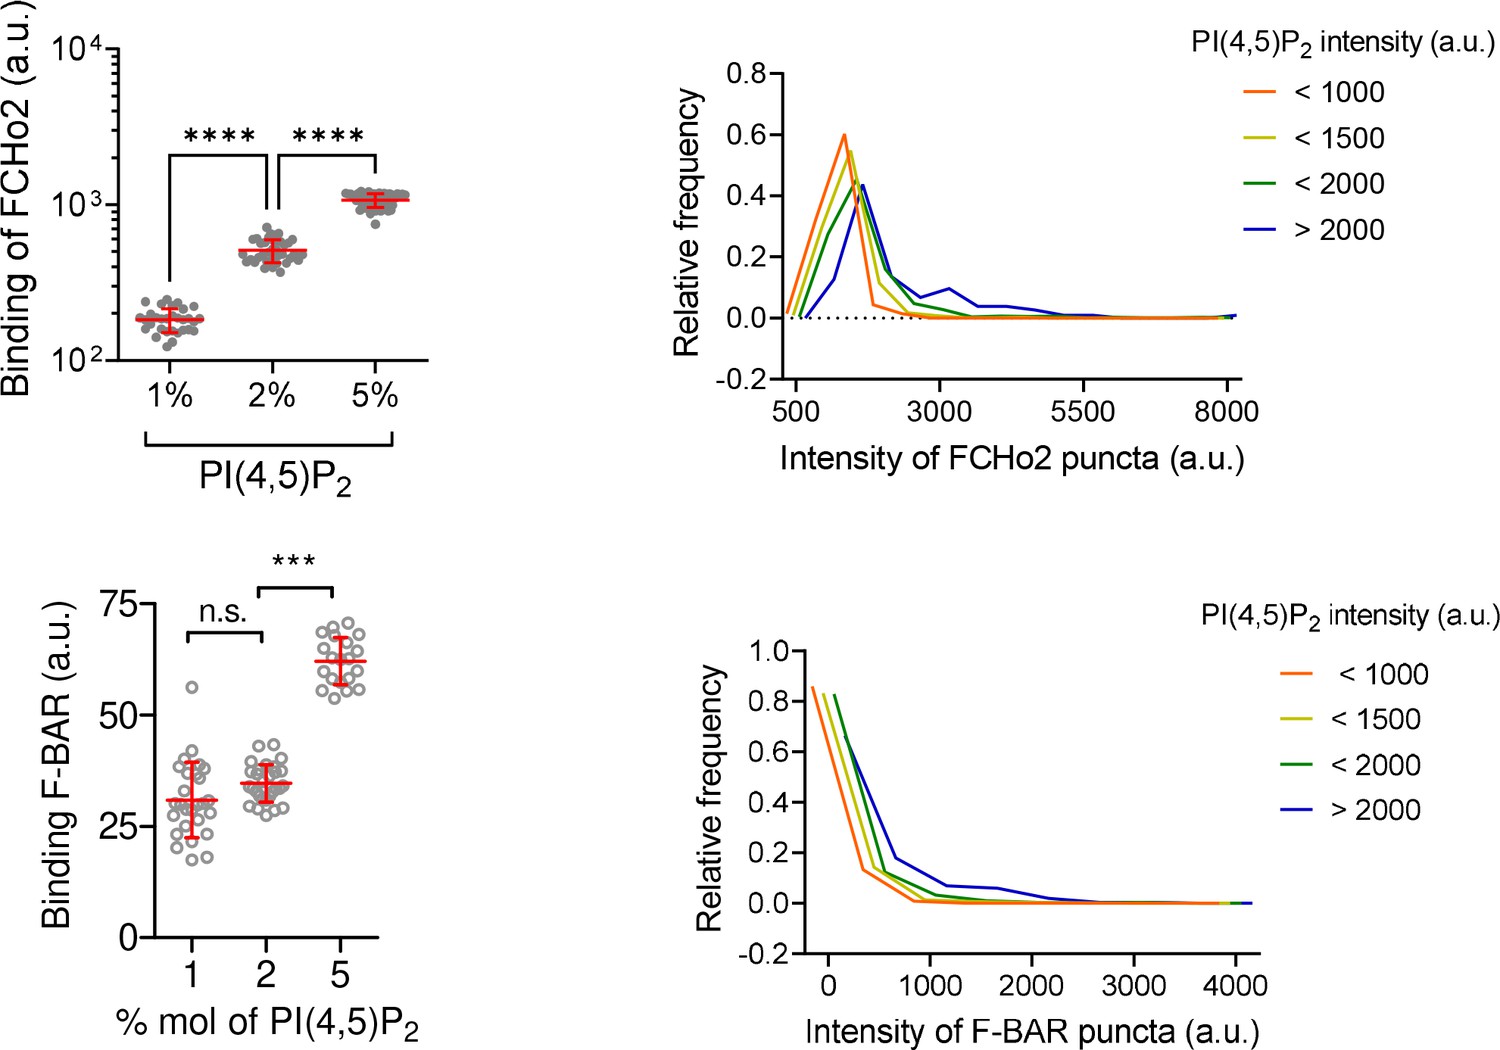
FCHo2 binding on membranes is assisted by PI(4,5)P2.
Left: binding of FCHo2 on lipid membranes containing different % mol of PI(4,5)P2 (20% of total negative charge). Mean ± SD in red. One-way ANOVA (****p<0.0001). The number of regions of interest analyzed from experimental replicates was n = 31, n = 39, and n = 54 for 1%, 2%, and 5% mol of PI(4,5)P2, respectively. Binding of F-BAR on membranes containing different % mol of PI(4,5)P2. Mean ± SD is displayed in red and one-way ANOVA (***p=0.0001). The number of regions of interest analyzed from experimental replicates was n = 27, n = 29, and n = 20 for 1%, 2%, and 5% mol of PI(4,5)P2 respectively. Right: relative frequency distribution of the intensity of FCHo2 and F-BAR puncta relative to the intensity of different PI(4,5)P2 domains populations on 5% mol PI(4,5)P2 membranes. The number of puncta analyzed from experimental replicates was n = 11,448 for FCHo2 and n = 12,828 for F-BAR. a.u., arbitrary units.
-
Figure 1—figure supplement 4—source data 1
Binding and intensity of FCHo2 and F-BAR.
- https://cdn.elifesciences.org/articles/73156/elife-73156-fig1-figsupp4-data1-v2.xlsx
Figure 1—figure supplement 5
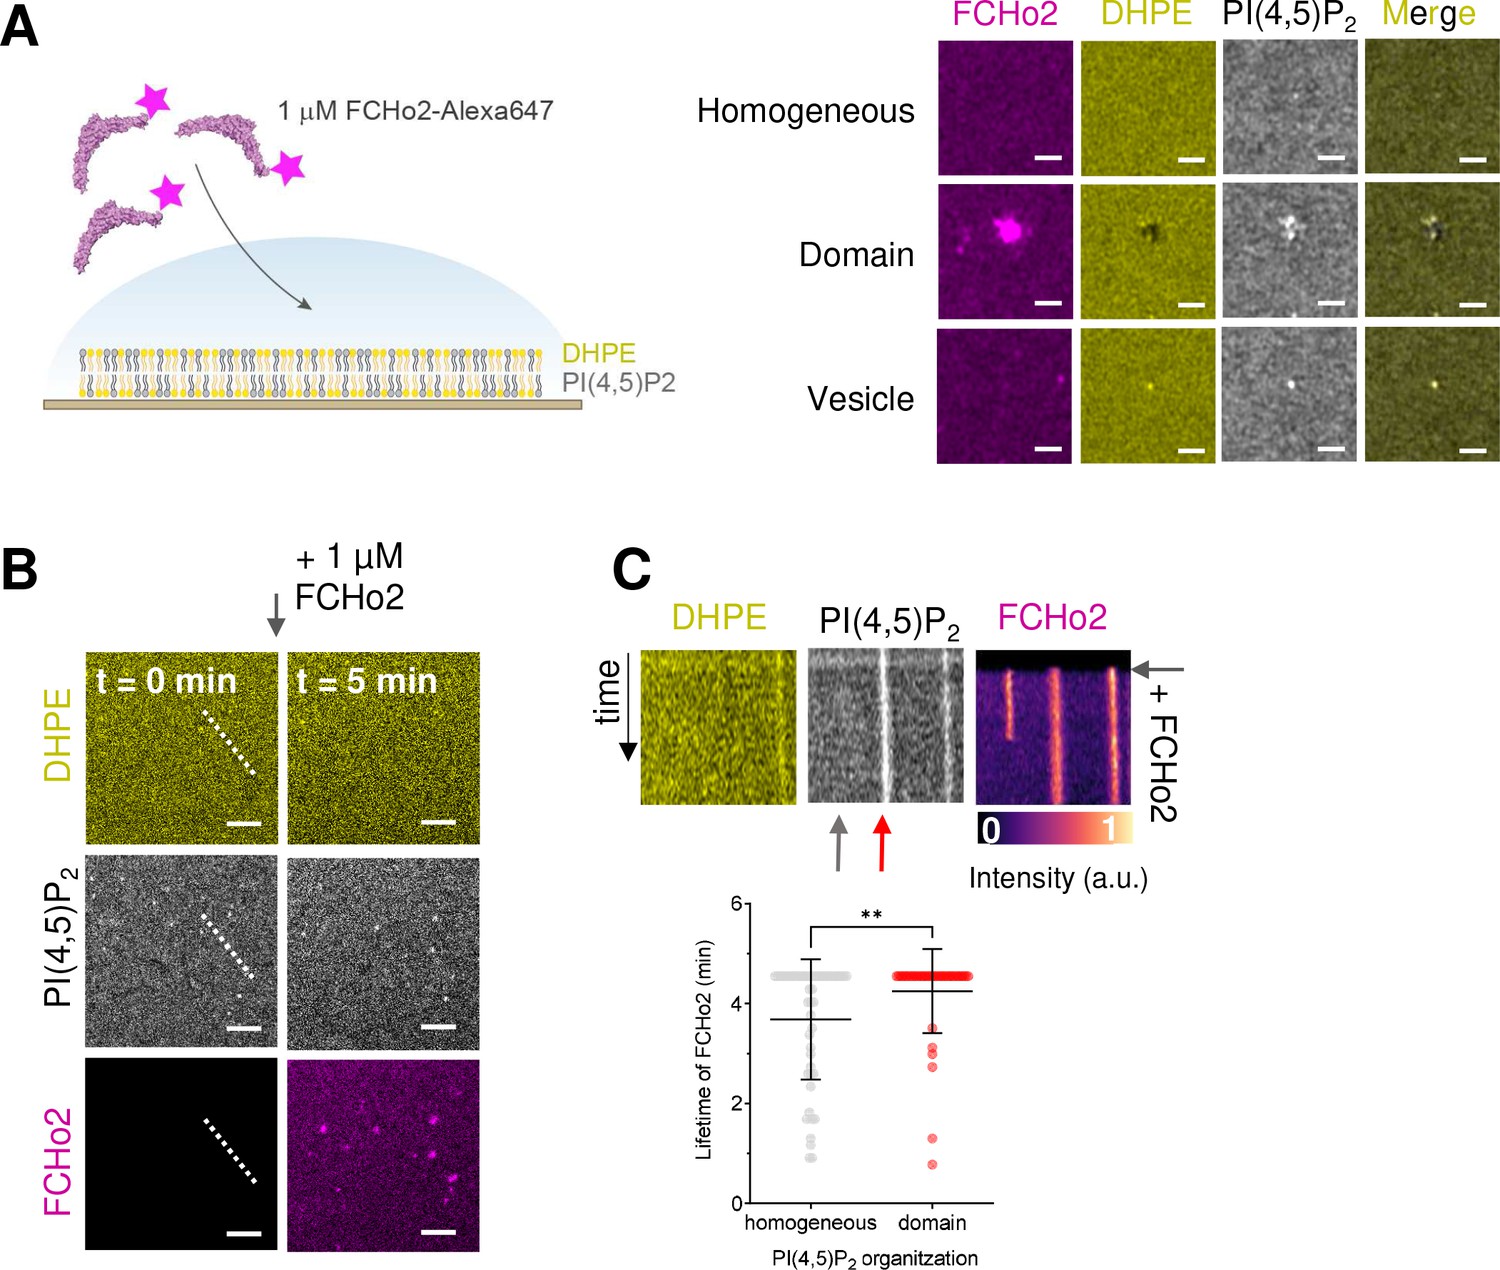
FCHo2 is recruited to PI(4,5)P2-enriched domains.
(A) Left: cartoon of the experimental setup to detect the interaction of FCHo2-A647 with PI(4,5)P2-enriched domains. Right: representative airyscan images showing the lipid organizations that were detected under the experimental conditions: (i) a homogenous PI(4,5)P2 organization, (ii) the formation of lipid domains, and (iii) the presence of adsorbed lipid vesicles. Scale bar, 1 µm. (B) Airyscan time lapse showing the dynamics of FCHo2 (magenta) on 5% of PI(4,5)P2 membranes doped with fluorescent PI(4,5)P2 (gray) and DHPE (yellow). Scale bar, 2 µm. (C) Top: kymograph analysis along the white dashed line in (F). Time scale, 5 min. Scale, 2 µm. Bottom: lifetime of FCHo2 (in min) relative to the PI(4,5)P2 organization: homogeneous (gray) and on domains (red), as highlighted by the arrows in the corresponding kymograph image. Mean ± SD in black. Welch’s t-test (**p=0.0098). The number of FCHo2 puncta analyzed from experimental replicates was n = 50 and n = 43 for a homogeneous and on domains, respectively.
-
Figure 1—figure supplement 5—source data 1
Lifetime of FCHo2.
- https://cdn.elifesciences.org/articles/73156/elife-73156-fig1-figsupp5-data1-v2.xlsx
Figure 1—figure supplement 6
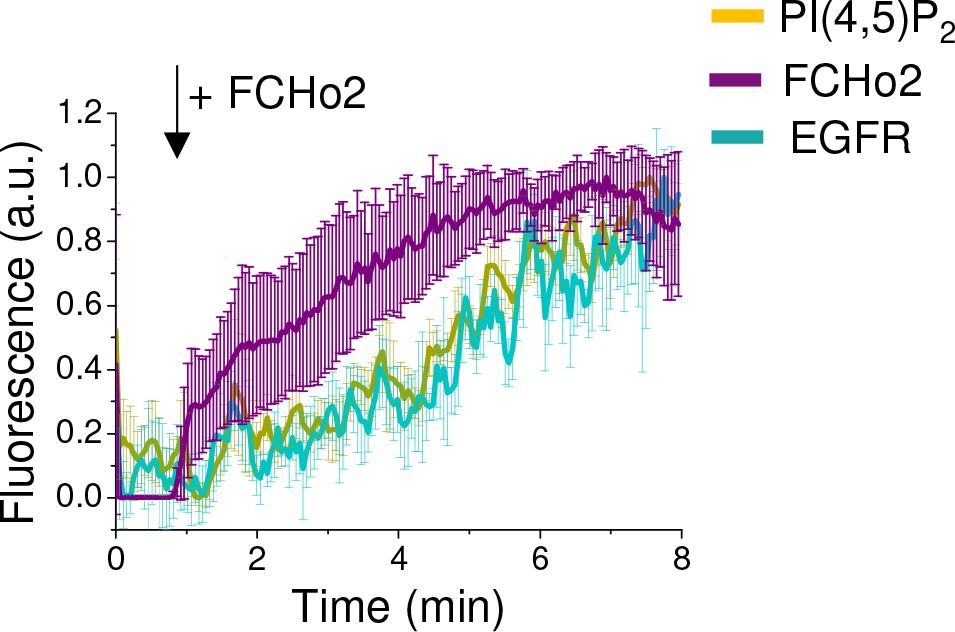
Fluorescence quantification over time of the EGFR (cyan), PI(4,5)P2 (yellow) upon injection of 1 µM of FCHo2-Alexa647 (magenta) on EGFR-positive spots on plasma membrane sheets.
Each curve represents the mean ± SD of n = 9 recruitment kinetics from experimental replicates.
Figure 2 with 1 supplement
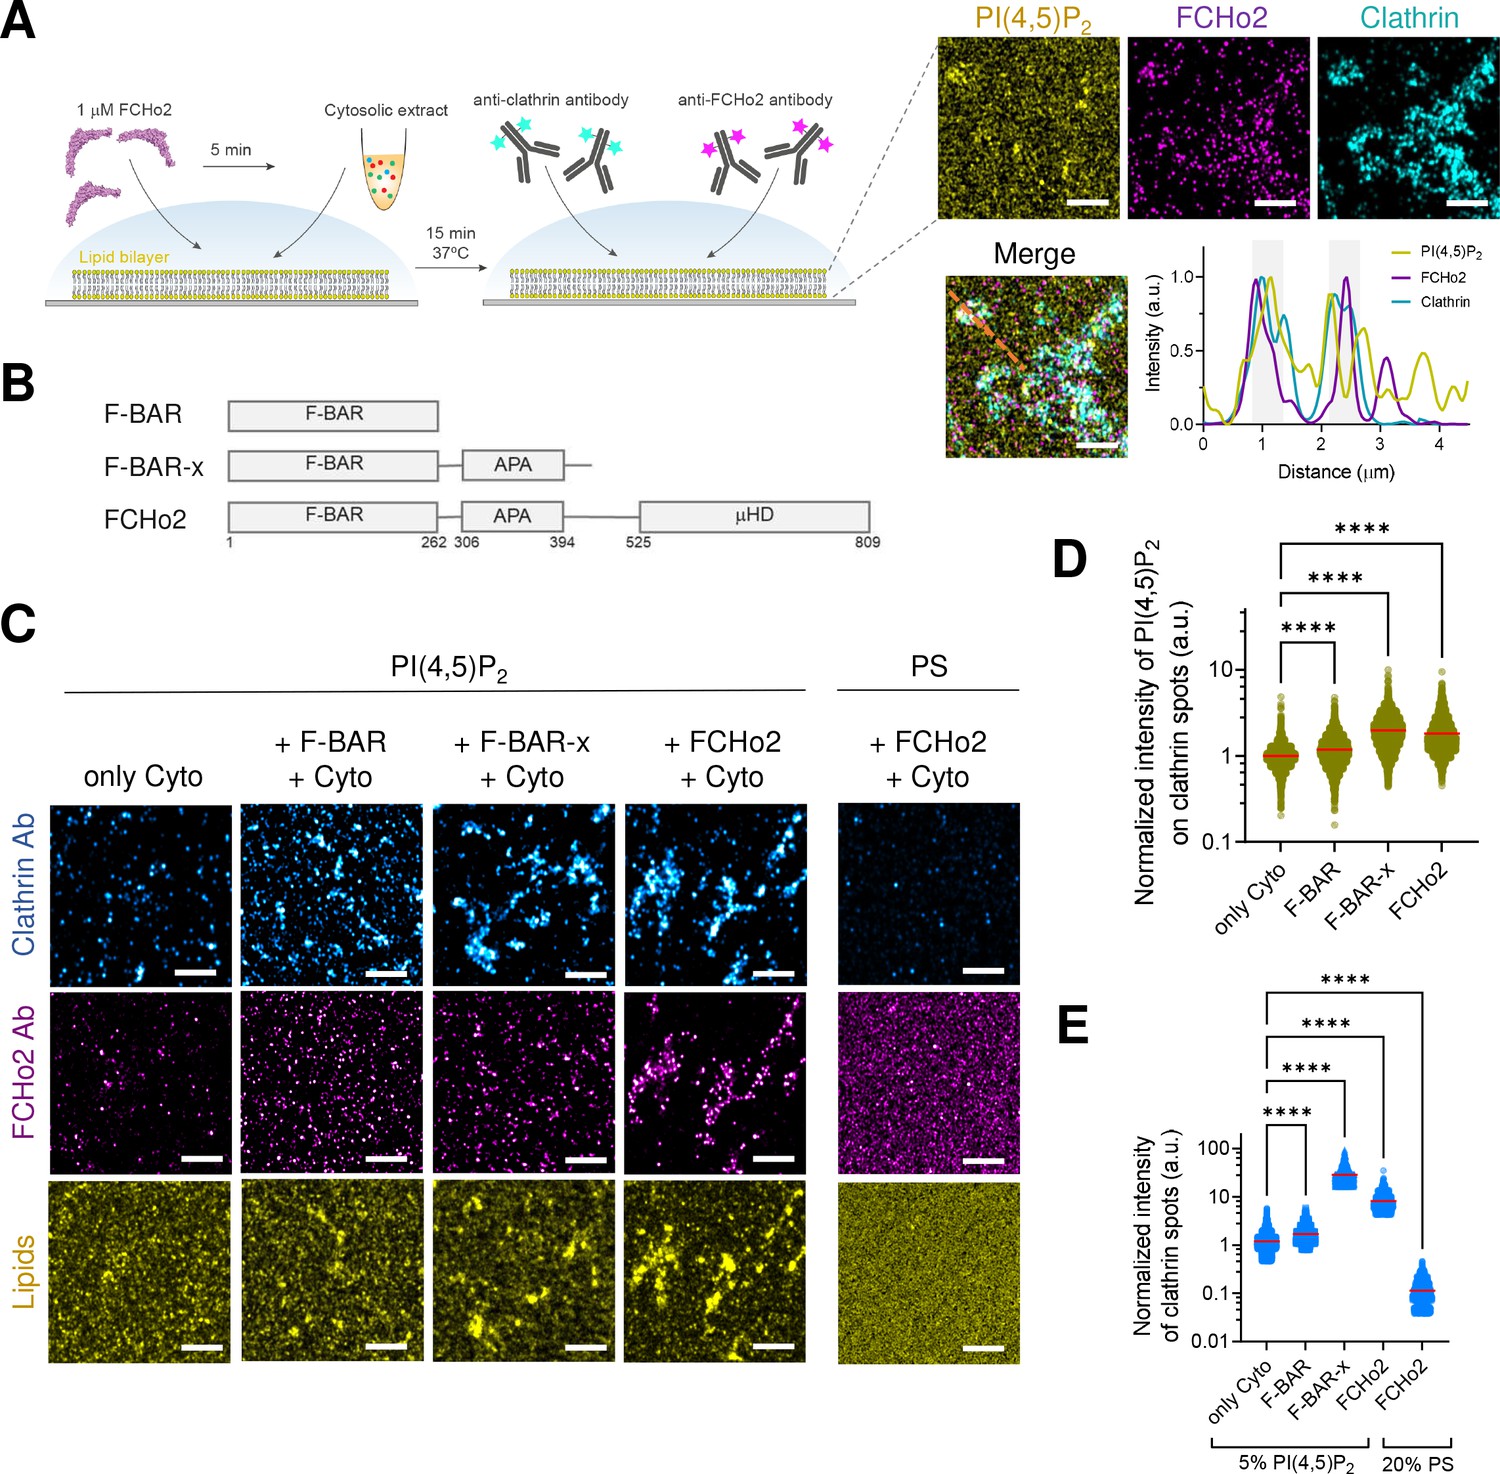
FCHo2 induces PI(4,5)P2 clustering on clathrin-positive puncta.
(A) Left: cartoon of the in vitro clathrin-coat assembly with cytosolic extracts and immunofluorescence assay to detect FCHo2 and clathrin-positive structures on 5% mol PI(4,5)P2-containing supported lipid bilayers. Left: representative still airyscan images on lipid bilayers doped with fluorescent PI(4,5)P2 (yellow) showing the co-localization with FCHo2 (magenta) and clathrin (cyan). Intensity profile along the orange dotted line in the corresponding image. Scale bar, 2 µm. (B) Protein domain mapping of F-BAR domain (residues 1–262), F-BAR-x (residues 1–430), or full-length FCHo2 showing the F-BAR, APA, and C-terminal µ-HD domains. (C) Representative airyscan images of lipid bilayers containing either 5% mol PI(4,5)P2 or 20% PS (yellow) (total negative charge is 20%) that were incubated with recombinant FCHo2 (+FCHo2), F-BAR domain (+F-BAR), or F-BAR-x domain (+F-BAR-x) and 4 mg/ml of cytosolic extracts (+Cyto) or only with the cytosolic extract (only Cyto). Clathrin (blue) and FCHo2 (magenta) were detected by immunofluorescence (antibody, Ab). Scale bar, 2 µm. (D, E) Log10 scale distribution of the normalized intensity of fluorescent PI(4,5)P2 on clathrin-positive structures and normalized intensity of clathrin structures, respectively, in the absence (only Cyto) or presence of either FCHo2, F-BAR, or F-BAR-x combined to cytosolic extracts on PI(4,5)P2 or PS-containing bilayers. Mean, in red. One-way ANOVA (****p<0.0001). The number of clathrin-positive spots analyzed was n = 11,564, n = 9292, n = 4719, n = 2205, and n = 1635, as set in the graph from at least three independent experiments.
-
Figure 2—source data 1
Normalized intensity of PI(4,5)P2 and intensity of clathrin spots.
- https://cdn.elifesciences.org/articles/73156/elife-73156-fig2-data1-v2.xlsx
Figure 2—figure supplement 1
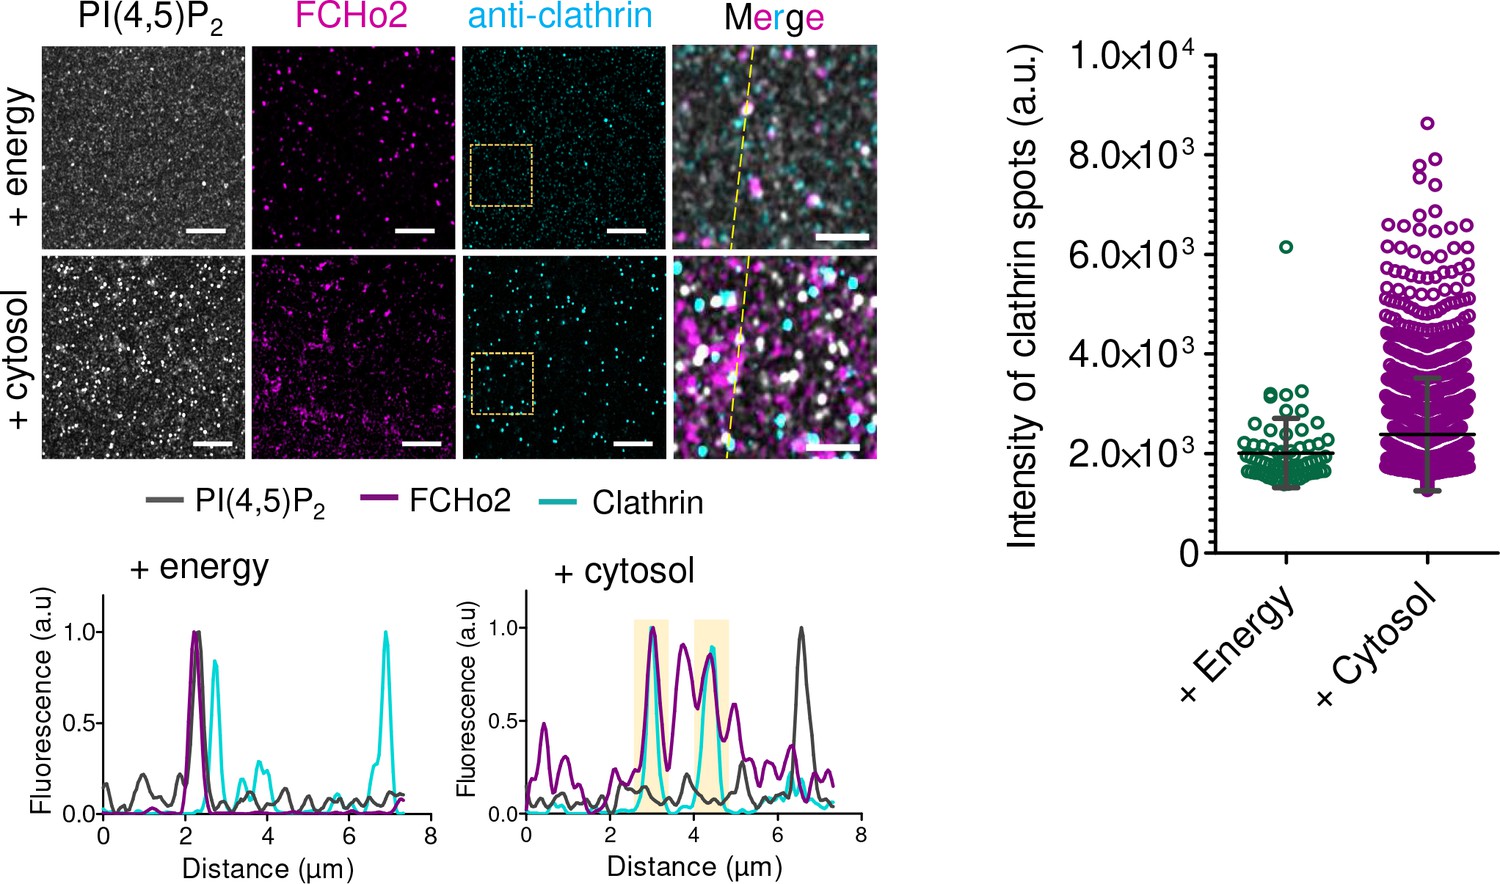
Representative airyscan images of the immunofluorescence assay showing the localization of PI(4,5)P2 (gray), FCHo2 (magenta), and clathrin (cyan, anti-clathrin antibody) on 5% PI(4,5)P2-containing lipid bilayers incubated with ATP and GTPγS (+energy) or with the cytosolic extract and energy mix (+cytosol).
Scale bar, 5 µm.
-
Figure 2—figure supplement 1—source data 1
Intensity of clathrin spots.
- https://cdn.elifesciences.org/articles/73156/elife-73156-fig2-figsupp1-data1-v2.xlsx
Figure 3
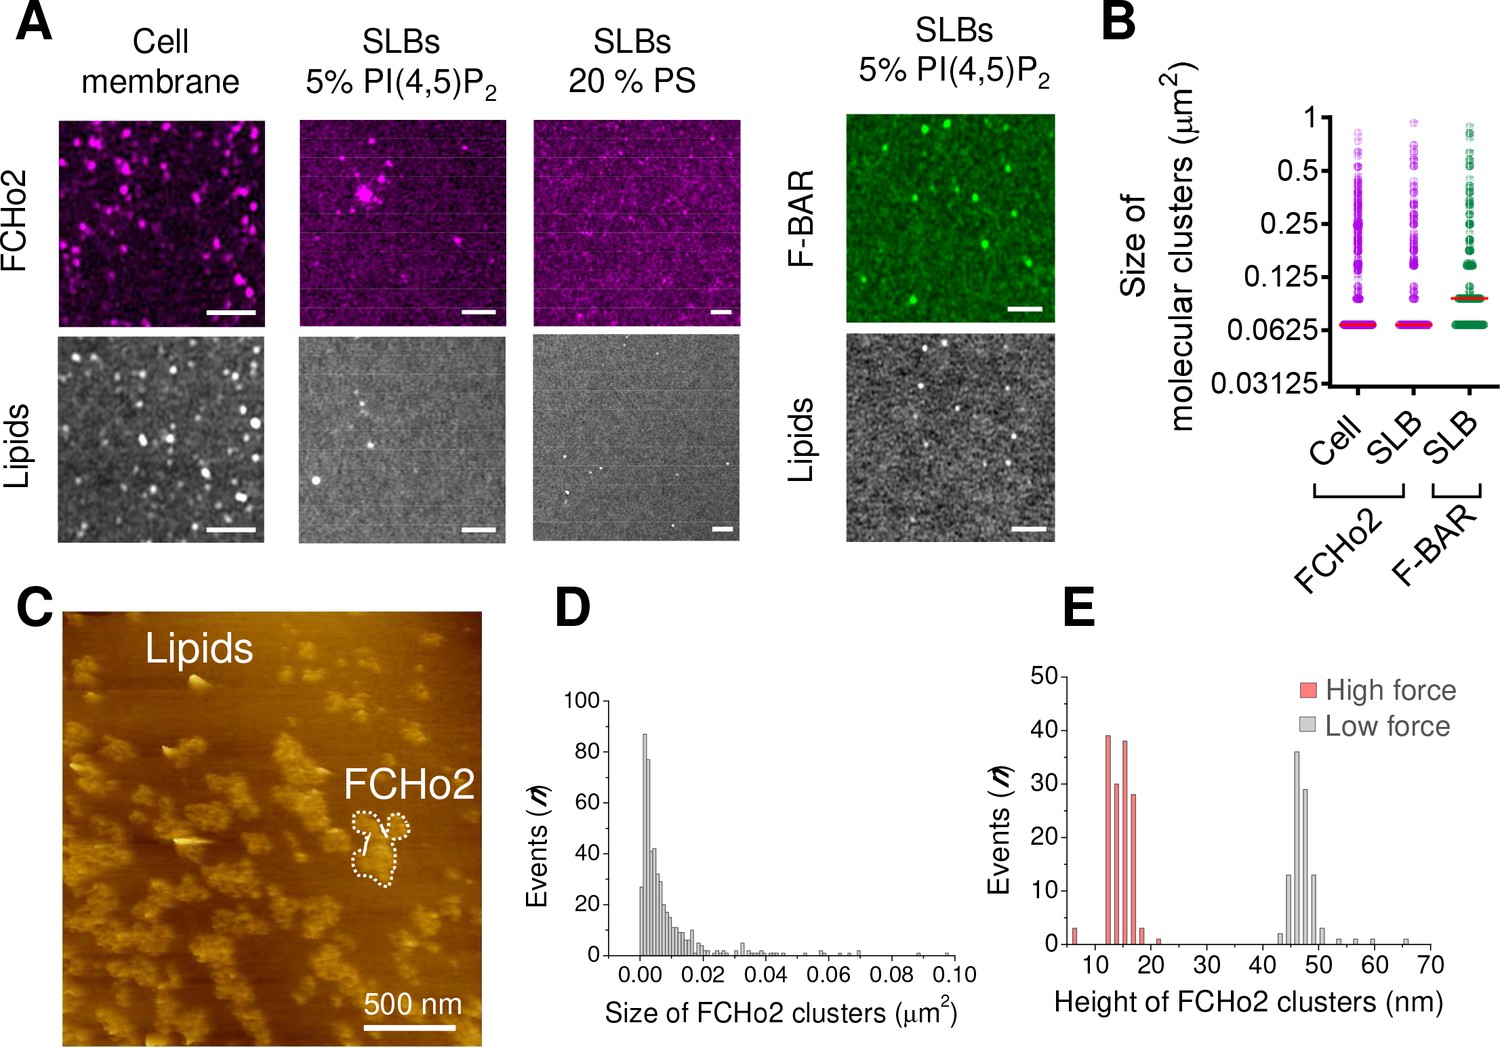
FCHo2 forms molecular clusters on PI(4,5)P2-containing bilayers.
(A) Representative airyscan images of plasma membrane sheets or lipid bilayers doped with either 5% mol PI(4,5)P2 or 20% PS (total negative charge is 20%) and incubated with FCHo2-Alexa647 (magenta) or F-BAR-Alexa647 (green). Scale bar, 2 µm. (B) Size distribution of FCHo2 (magenta) and F-BAR (green) molecular clusters (in µm2) on plasma membrane sheets (cell) or lipid bilayers (SLB) containing 5% mol of PI(4,5)P2. Median value is displayed in red. The number of molecular clusters analyzed was n = 10,793, n = 19,287, and n = 7028, as set in the graph from at least three independent experiments. (C) Representative atomic force microscopy (AFM) image of FCHo2 molecular clusters (white dashed region) on supported lipid bilayers containing 5% mol PI(4,5)P2. (D) Size distribution of FCHo2 molecular clusters (in µm2) obtained from AFM images. (E) Height distribution of FCHo2 molecular clusters (in nm) at low (gray) and high (red) setpoint forces from at least three replicates.
-
Figure 3—source data 1
Size and height of molecular clusters.
- https://cdn.elifesciences.org/articles/73156/elife-73156-fig3-data1-v2.xlsx
Figure 4 with 1 supplement
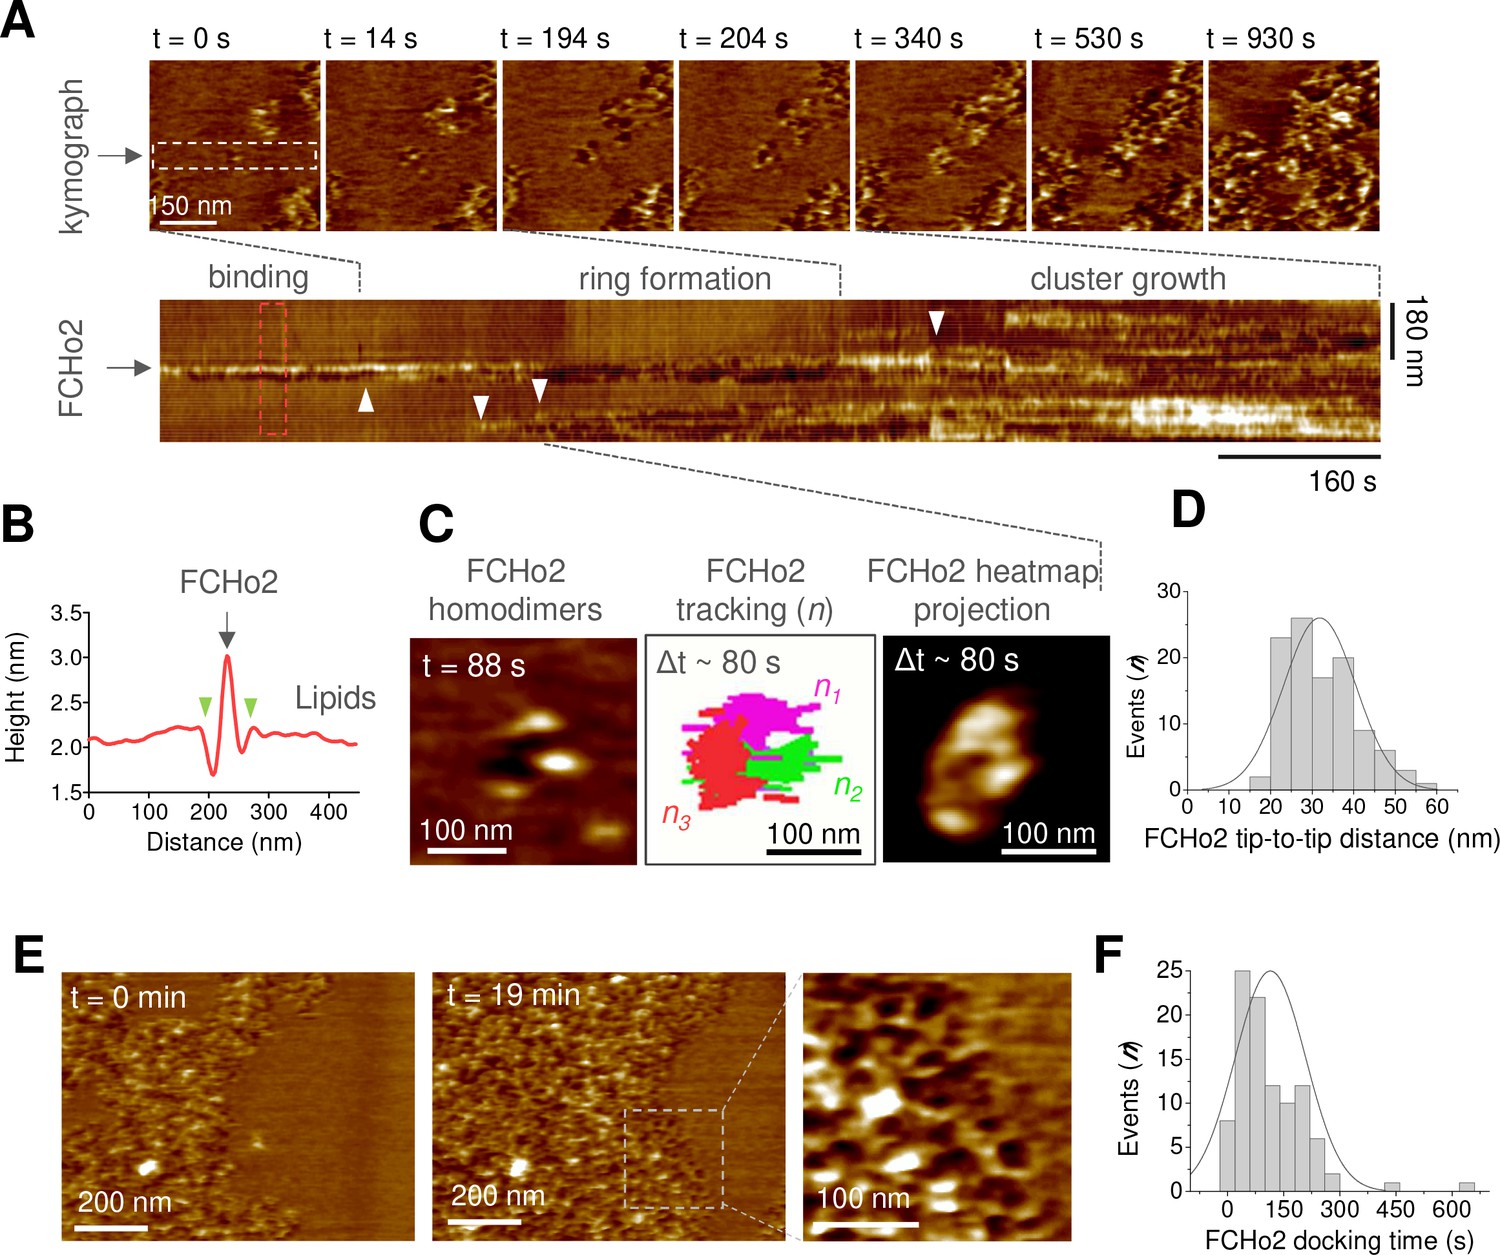
Molecular dynamics of FCHo2 self-assembly on PI(4,5)P2-containing membranes.
(A) High-speed atomic force microscopy (HS-AFM) movie frames of the binding of FCHo2 on 5% mol PI(4,5)P2-containing membranes. Kymograph analysis performed on the white outline to display the representative stages of FCHo2 binding and self-assembly on flat membranes. White arrowheads highlight the docking of new FCHo2 homodimers to the growing molecular cluster. (B) Profile analysis along the red outline in (A). Green arrowheads highlight the membrane invagination upon binding of FCHo2 on lipid membranes. (C) HS-AFM movie snapshot of the FCHo2 ring formation along with a representative tracking of individual homodimers (n = 3) and the heat map projection within a time interval, Δt, of ~80 s. (D) Size distribution (in nm) estimated from individual FCHo2 proteins before the cluster growth (t ≤ 200 s). (E) HS-AFM snapshots (t = 0 min and t = 19 min) illustrating the growth of FCHo2 molecular clusters into ring-like-shaped protein patches. Magnified image corresponds to the dashed outline. (F) Distribution of the docking time (in s) of individual and ring-like FCHo2 assemblies during the cluster growth from at least three replicates.
-
Figure 4—source data 1
FCHo2 distance and docking time.
- https://cdn.elifesciences.org/articles/73156/elife-73156-fig4-data1-v2.xlsx
Figure 4—figure supplement 1
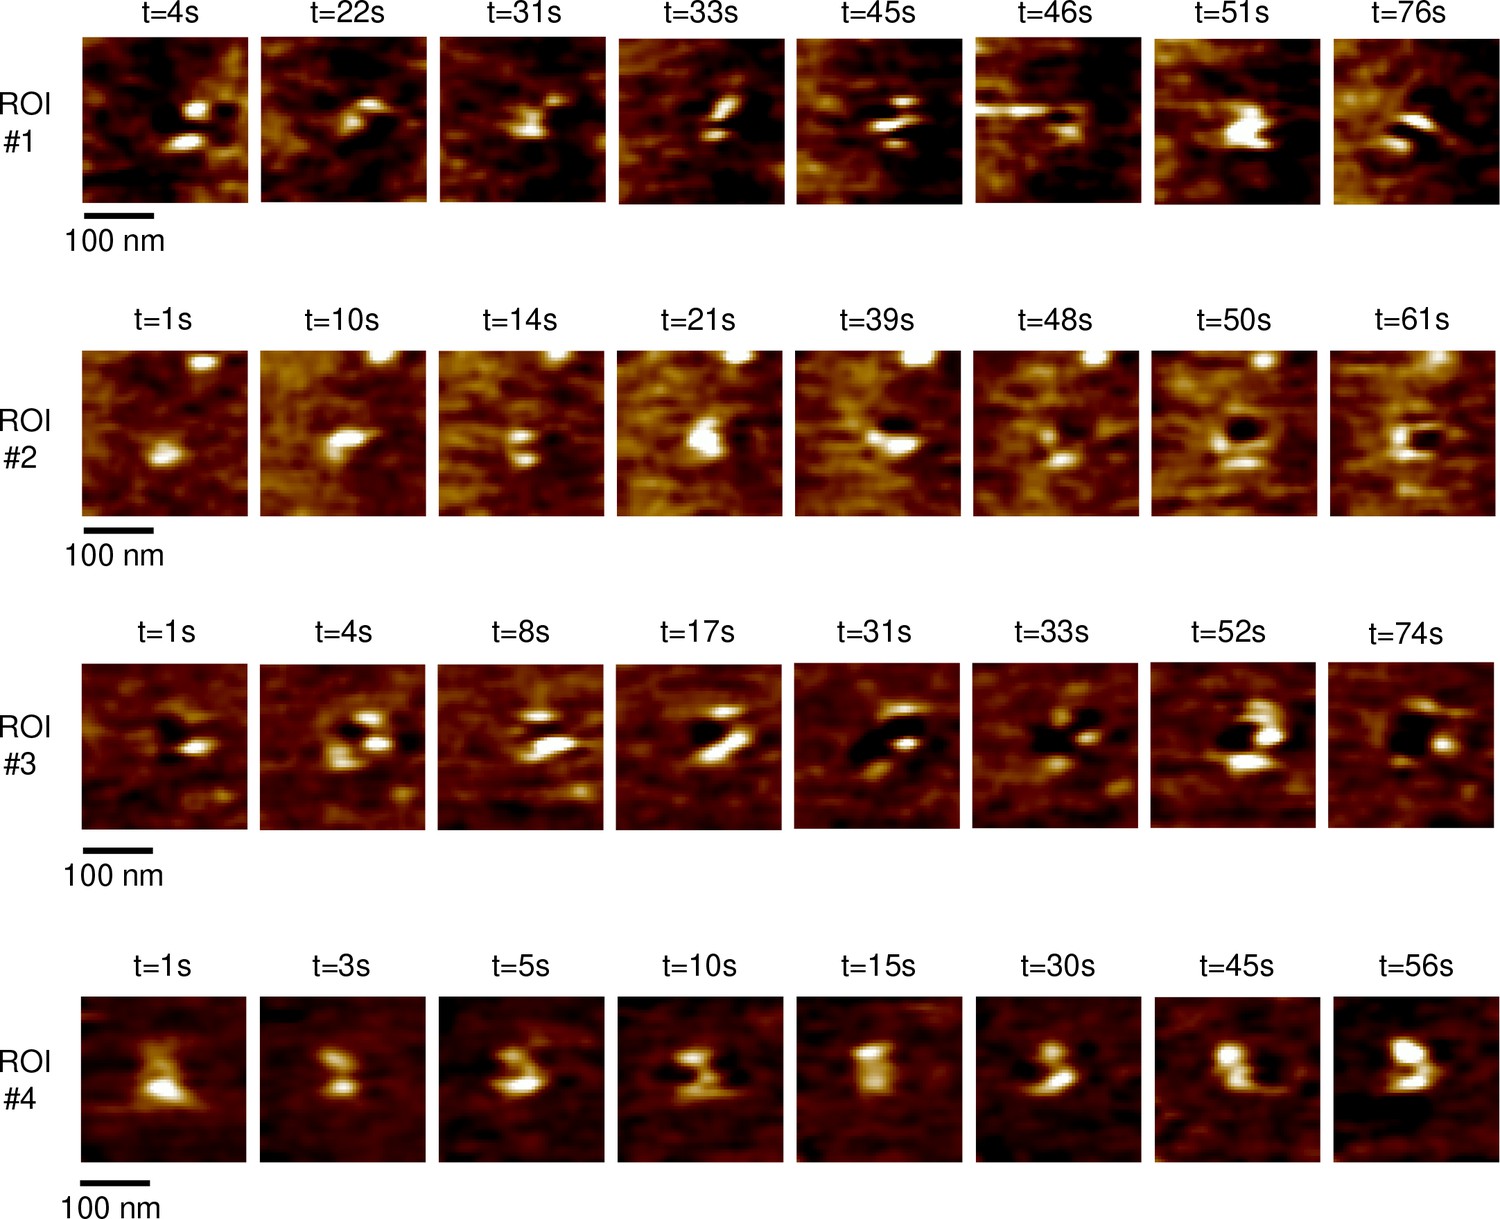
Representative high-speed atomic force microscopy (HS-AFM) frames of FCHo2 assembly on 5% PI(4,5)P2-containing lipid bilayers.
Different regions of interest (ROIs) show the FCHo2 ring formation stage, which took place within a time interval, Δt, of ~80 s.
Figure 5
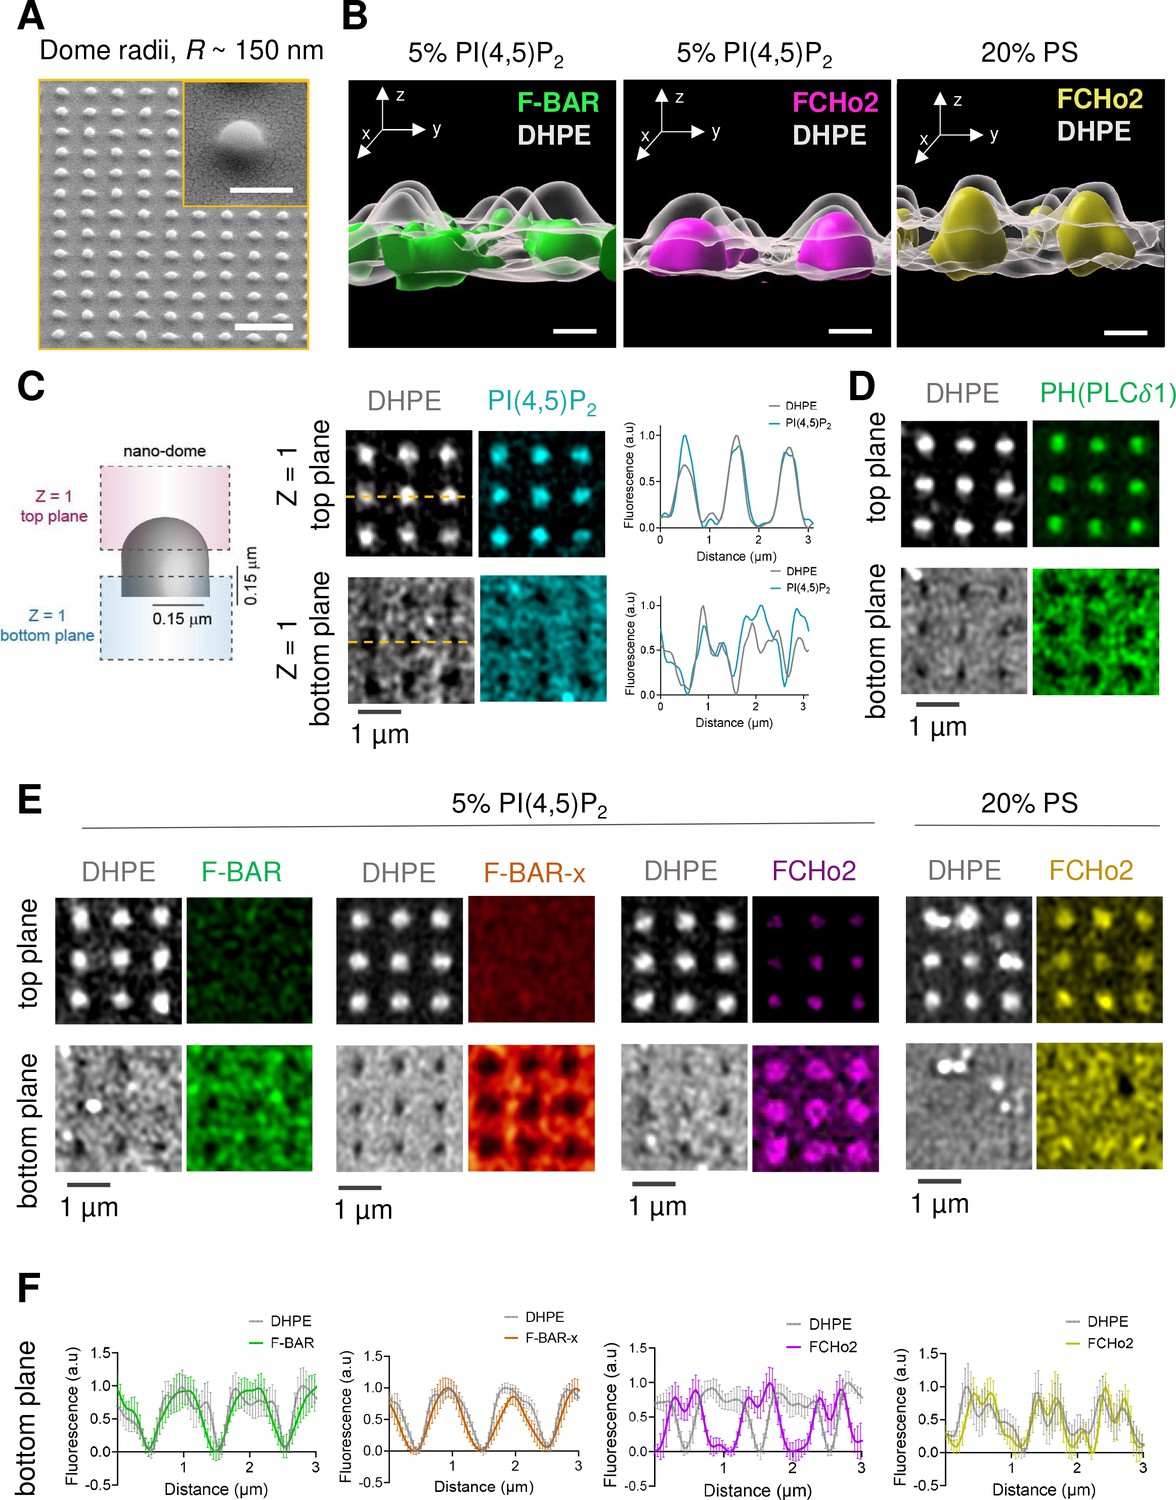
PI(4,5)P2 assists the organization of FCHo2 on curved membranes.
(A) SEM images of SiO2 substrates displaying an array of nano-domes with a radius, R ~ 150 nm generated by soft-NIL. Scale bar, 2 µm. Inset, scale bar is 500 nm. (B) Representative 3D renders of the surface organization of the F-BAR domain (green) and FCHo2 (magenta) on nano-domes functionalized with either 5% mol PI(4,5)P2 or 20% PS-containing membranes (yellow) relative to the DHPE lipid dye signal (gray). Scale bar, 400 nm. (C) Left: schematic representation of the acquisition of a single plane (Z = 1) at the top and bottom of nano-domes to visualize the preferential distribution of proteins. Right: representative airyscan images showing the surface distribution of fluorescent DHPE (gray) and PI(4,5)P2 (cyan) on nano-domes along with a cross section (orange dashed line) of the normalized fluorescence intensity of DHPE (gray) and PI(4,5)P2 (cyan) at the top and bottom of the nano-dome. (D) Representative airyscan images showing the surface distribution of the PH (PLCδ1) domain (green) on nano-domes functionalized with 5% mol of PI(4,5)P2. (E, F) Representative airyscan images (E) and average profile analysis of the normalized fluorescence intensity (F) showing the surface distribution of fluorescent DHPE (gray) and F-BAR (green), F-BAR-x (orange), and FCHo2 (magenta) on PI(4,5)P2-containing membranes and FCHo2 (yellow) on PS-containing membranes at the bottom of nano-domes. Each curve represents the mean ± SD of n = 20 nano-domes from at least three replicates.
Figure 6

Model of FCHo2 docking and self-assembly on membranes.
FCHo2 recruitment of membranes is mediated by PI(4,5)P2. Increase in the local PI(4,5)P2 concentration enhances the spatial accumulation of FCHo2 through multivalent interactions between the positively charged surface of the F-BAR domain and polybasic region with PI(4,5)P2 molecules. Binding of FCHo2 on cellular membranes is convoyed by PI(4,5)P2 clustering formation at the boundary of clathrin-regulated cargo receptors and the self-assembly of FCHo2 into a ring-like-shaped protein complex. As a result of this singular organization, the local accumulation of PI(4,5)P2 and APA/μHD of FCHo2 is likely to facilitate the formation of an interacting network with downstream partners, such as Eps15 and AP2 (Ma et al., 2016; Henne et al., 2007), ultimately leading to the assembly of clathrin structures on a PI(4,5)P2-rich interface that could be amplified by phosphoinositides metabolizing enzymes (Posor et al., 2015). In the absence of endocytic partners, FCHo2 rings grow into sub-micrometric molecular clusters, leading to membrane bending and the partitioning on curved membranes.
Additional files
Download links
A two-part list of links to download the article, or parts of the article, in various formats.
Downloads (link to download the article as PDF)
Open citations (links to open the citations from this article in various online reference manager services)
Cite this article (links to download the citations from this article in formats compatible with various reference manager tools)
Structural organization and dynamics of FCHo2 docking on membranes
eLife 11:e73156.
https://doi.org/10.7554/eLife.73156


