µ-Theraphotoxin Pn3a inhibition of CaV3.3 channels reveals a novel isoform-selective drug binding site
- Illawarra Health and Medical Research Institute, University of Wollongong, Australia
- School of Science, RMIT University, Australia
Figures
Figure 1
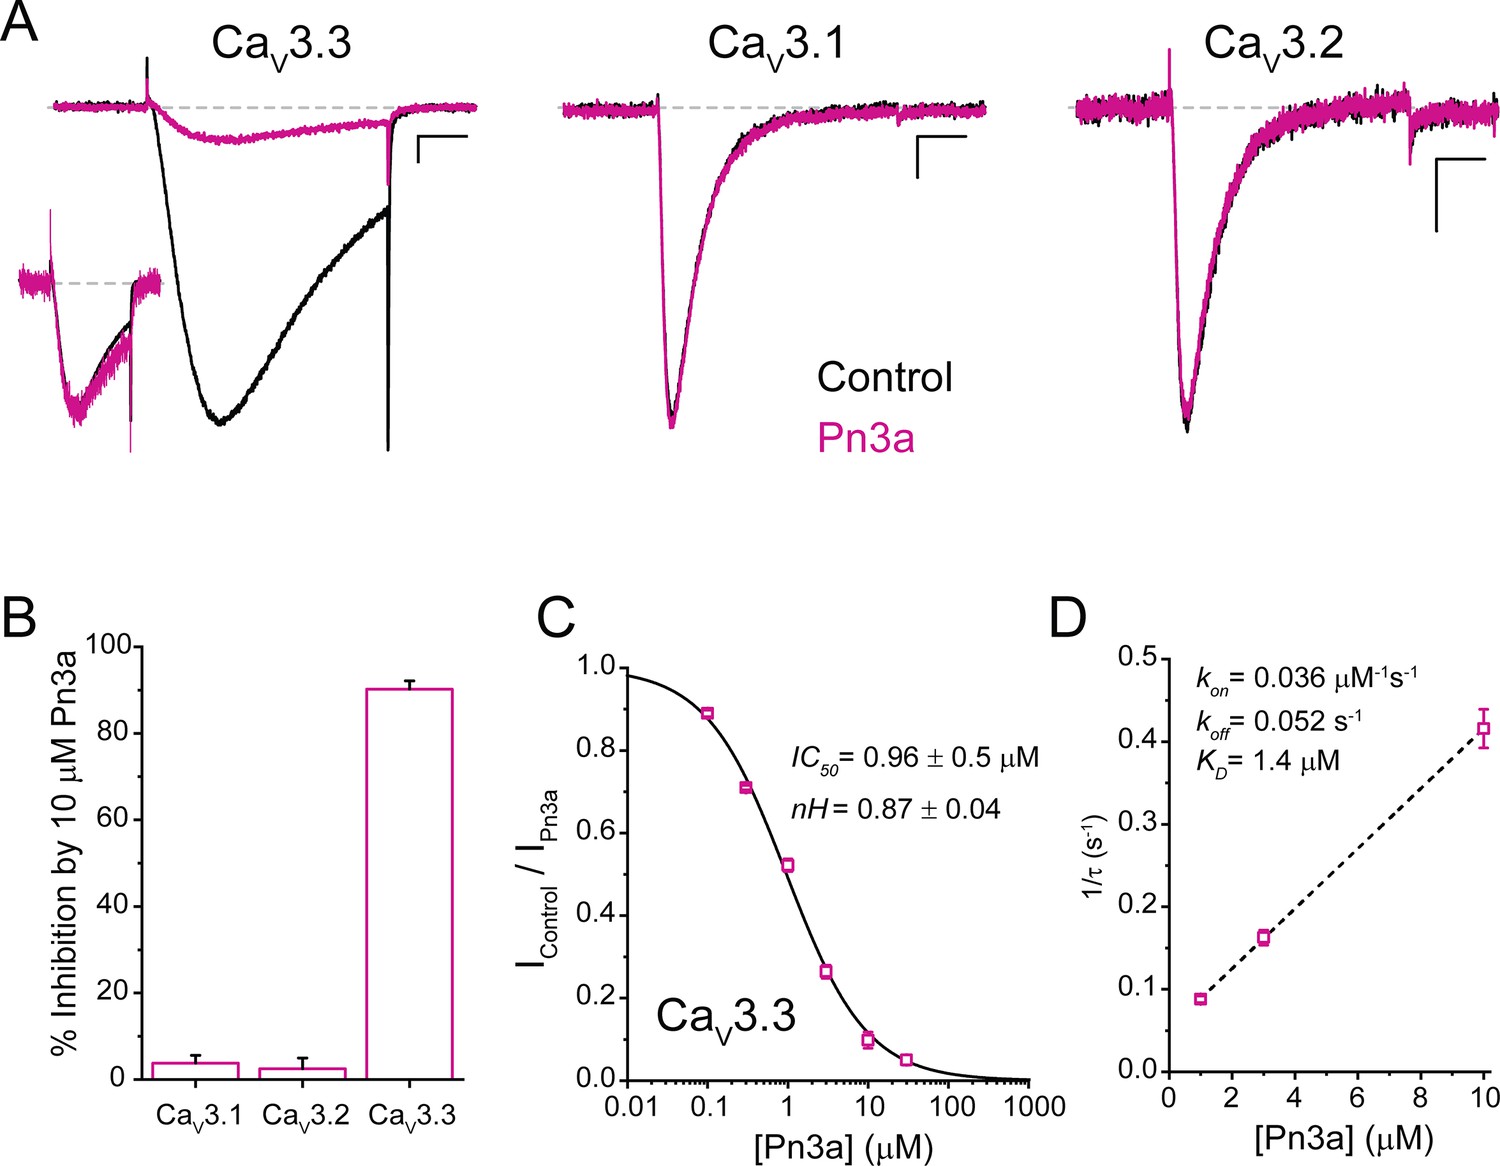
Pn3a preferentially inhibits human CaV3.3-mediated Ca2+ currents.
(A) CaV3.3 (left), CaV3.1 (middle), and CaV3.2 (right) currents elicited by 100 ms step depolarization to −20 mV (Vh −90 mV, 0.2 Hz) in the absence (control, black) and presence of 3 µM Pn3a (pink). Scale bars: 0.2 nA, 20 ms. The inset shows scaled CaV3.3 currents in control and in the presence of Pn3a with similar kinetics. (B) Bar graph summarizing % inhibition by 10 µM Pn3a of the three CaV3 isoforms. (C) Concentration-response curve for Pn3a inhibition of CaV3.3 currents. (D) Kinetics of Pn3a inhibition of CaV3.3. Kobs was determined at three concentrations and fit with a linear equation where Kobs = kon ∙ [Pn3a]+koff. Data shown as mean ± SEM (n=5).
-
Figure 1—source data 1
Pn3a inhibition of T-type calcium channels.
- https://cdn.elifesciences.org/articles/74040/elife-74040-fig1-data1-v2.xlsx
Figure 2 with 1 supplement
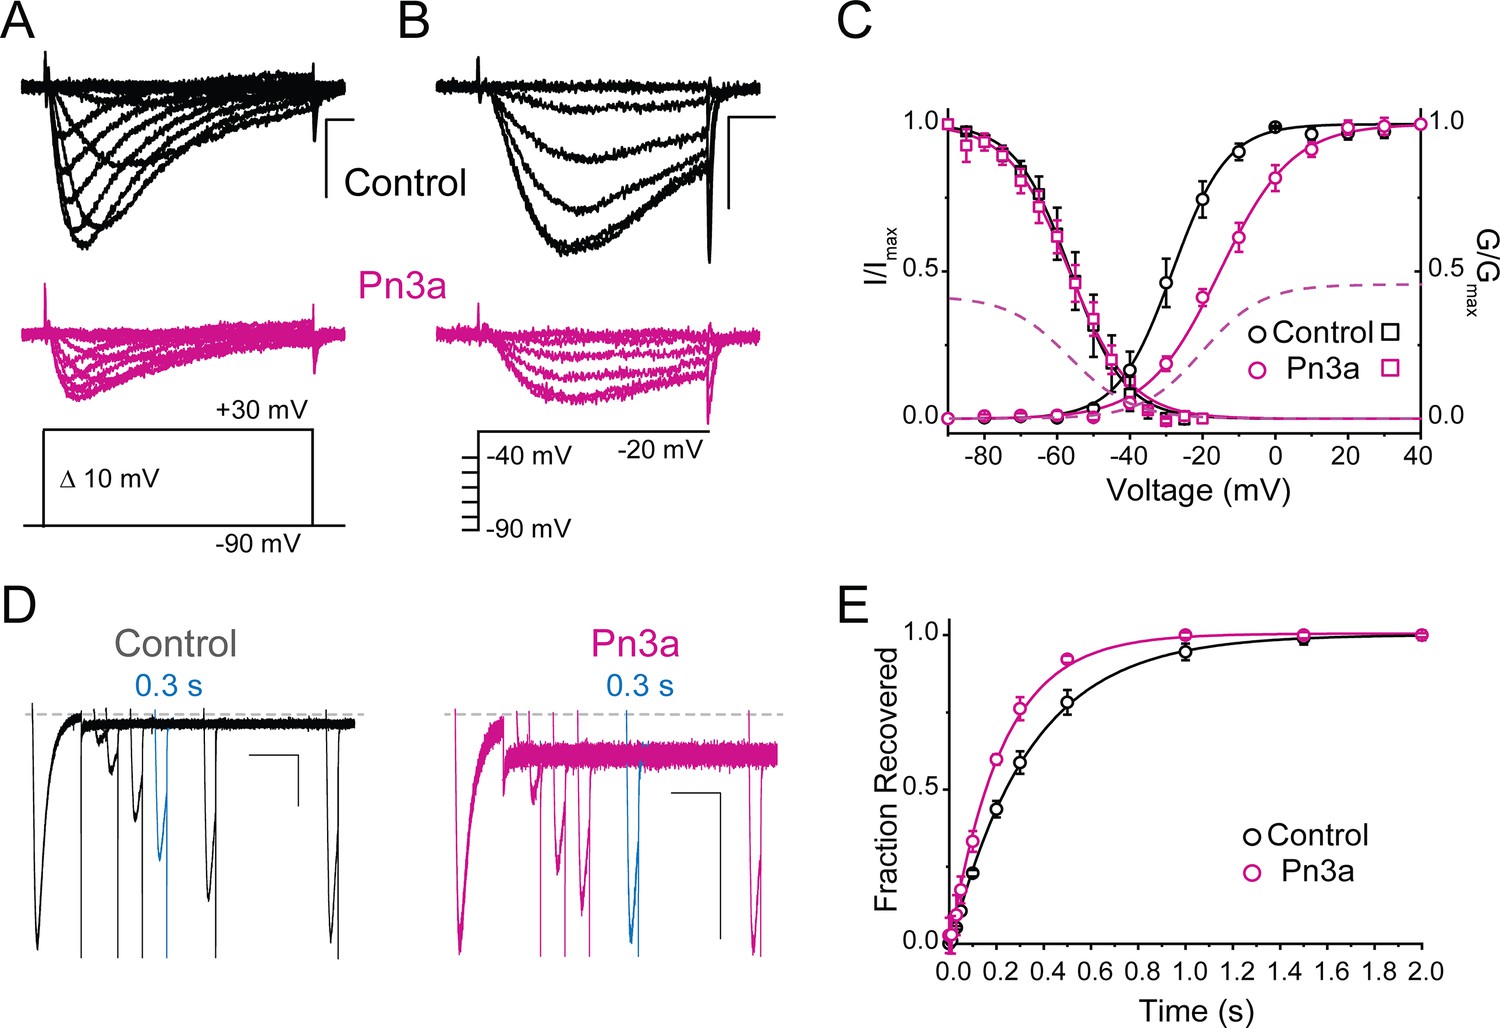
Pn3a produces a depolarizing shift in the voltage dependence of activation and speeds up recovery from inactivation of CaV3.3.
(A–C) Effect of Pn3a on the voltage dependence of CaV3.3. Representative currents from (A) activation or (B) steady-state inactivation protocols, in the absence (top: control, black) and presence of 3 µM Pn3a (middle: Pn3a, pink) using the standard protocols (bottom). Scale bars: 0.5 nA, 10 ms. (C) Activation (circles) and steady-state inactivation (squares) relationships for CaV3.3 in the absence (black) and presence of 3 µM Pn3a (pink). Dashed lines represent non-normalized activation and inactivation curves of Pn3a. (D) Representative recovery from inactivation currents in control (left) and presence of 3 µM Pn3a (right) (trace shown in blue highlights the current recovered after 0.3 s). Scale bars: 0.2 nA, 200 ms. (E) Recovery from inactivation in the absence (black) and presence of 3 µM Pn3a (pink). Data shown as mean ± SEM (n=5).
-
Figure 2—source data 1
Pn3a voltage effects o activation, steady-state inactivation, and recovery from inactivation.
- https://cdn.elifesciences.org/articles/74040/elife-74040-fig2-data1-v2.xlsx
Figure 2—figure supplement 1
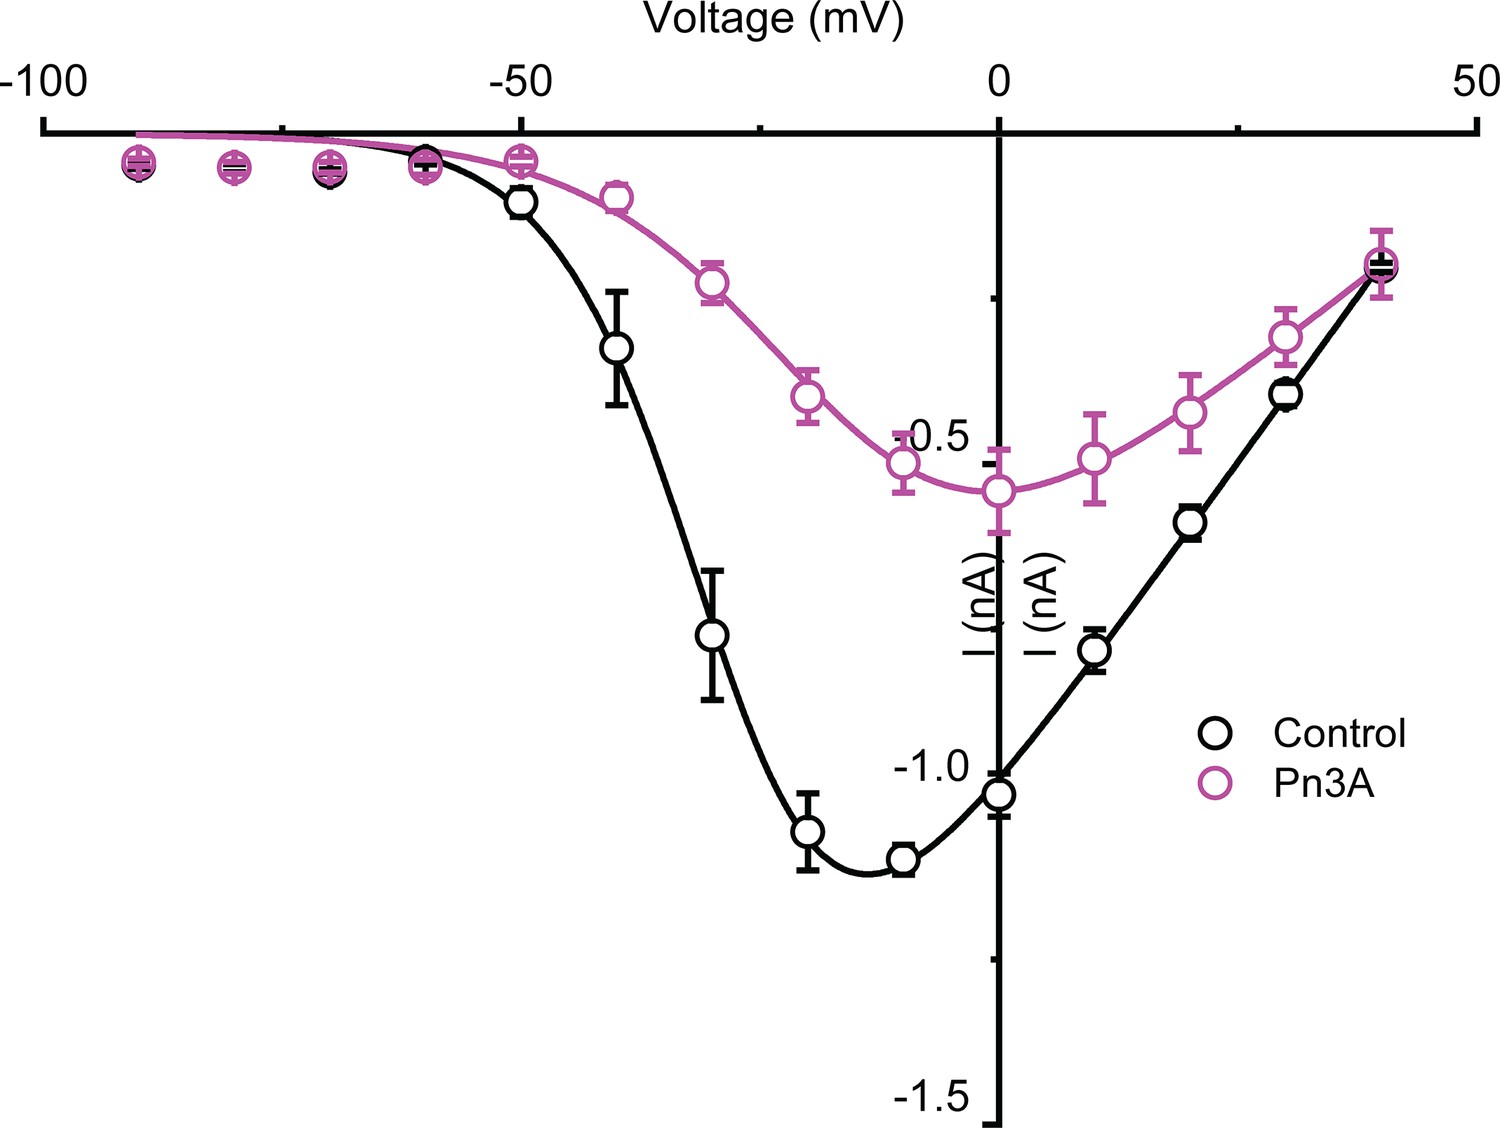
Current-voltage relation of control (black) and 3 µM Pn3a (pink) inhibition of human CaV3.3.
Figure 3 with 1 supplement
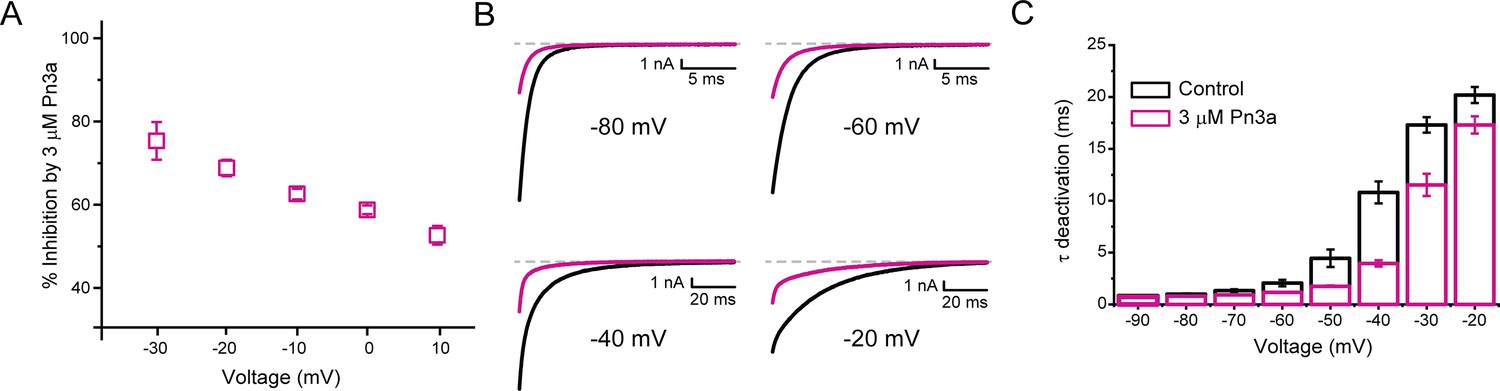
Pn3a inhibition of CaV3.3 is stronger at hyperpolarized potentials and speeds up channel deactivation.
(A) Voltage dependence of Pn3a inhibition of CaV3.3-mediated Ca2+ currents. (B) Representative CaV3.3 tail currents at different voltages in the absence (black) and presence (pink) of 3 µM Pn3a. (C) Summary of the time constant (τ) of CaV3.3 deactivation upon return to the holding potential (−90 mV) plotted against the activating (pre-pulse) potential in the absence (control, black) and the presence of Pn3a (3 µM, pink). Data shown as mean ± SEM (n=5).
-
Figure 3—source data 1
Voltage dependence of Pn3a inhibition.
- https://cdn.elifesciences.org/articles/74040/elife-74040-fig3-data1-v2.xlsx
Figure 3—figure supplement 1
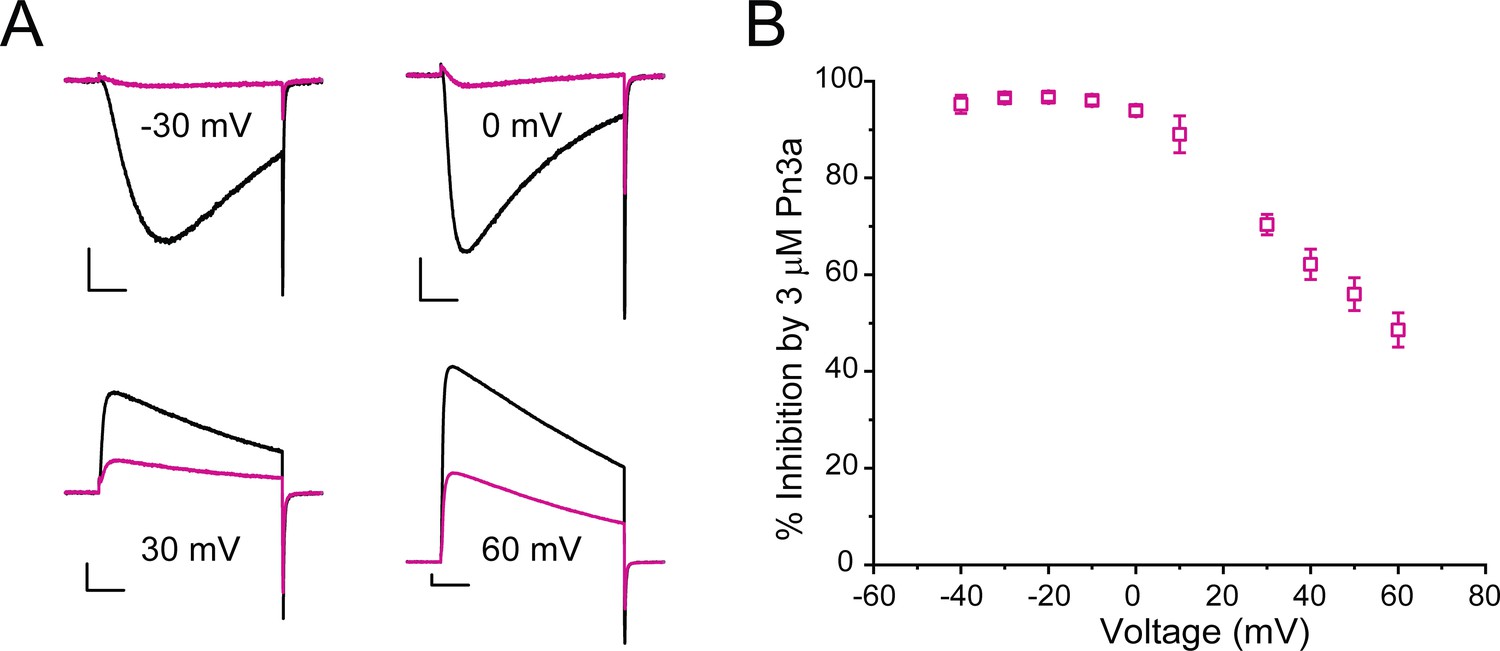
Voltage dependence of Pn3a inhibition of human CaV3.3 when Na+ is the charge carrier.
(A) Representative traces showing the inhibition by 3 µM Pn3a of inward and outward INa through CaV3.3 at −30, 0, 30, and 60 mV. Scale bars: 1 nA, 20 ms. (B) Graph showing % inhibition of INa by 3 µM Pn3a from −40 to +60 mV.
Figure 4
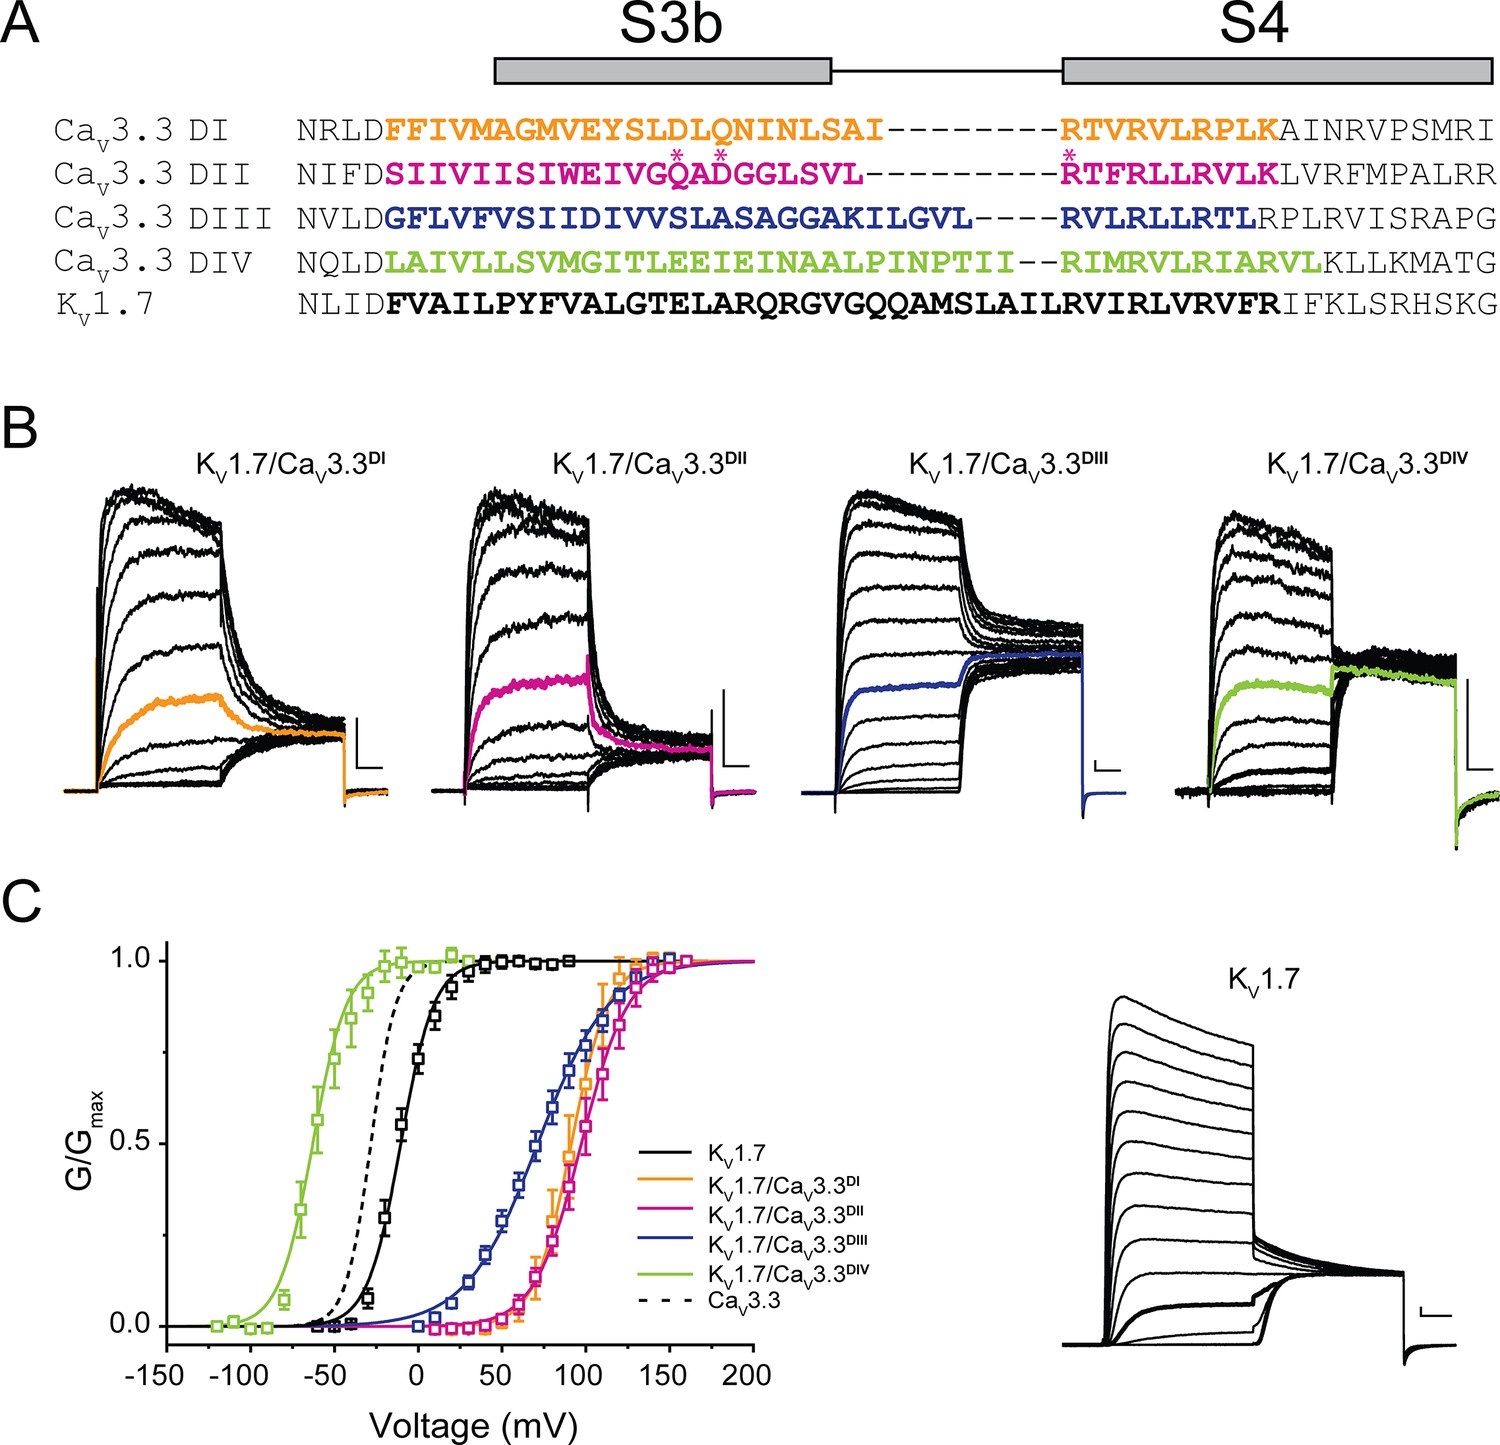
Chimeric constructs of the KV1.7 channel with the CaV3.3 voltage sensor paddles.
(A) Sequence alignment between paddle regions of CaV3.3 and KV1.7. The coloured bolded sequences from CaV3.3 DI (yellow), CaV3.3 DII (pink), CaV3.3 DIII (blue), and CaV3.3 DIV (green) were grafted onto KV1.7 (black). (B) Representative current traces in response to 50 ms long I-V protocols used to evaluate the voltage dependence of activation of all constructs (Vh = −80 mV). KV1.7/CaV3.3DI (0–160 mV), KV1.7/CaV3.3DII (0–160 mV), KV1.7/CaV3.3DIII (0–160 mV) and KV1.7/CaV3.3DIV (−120 to 30 mV). The traces highlighted in colour correspond to currents near half-activation potential (V0.5). (C) Activation curves for all chimeras: KV1.7/CaV3.3DI (yellow), KV1.7/CaV3.3DII (pink), KV1.7/CaV3.3DIII (blue), and KV1.7/CaV3.3DIV (green) and the parental channel KV1.7 (black). The dotted line corresponds to CaV3.3 activation for reference. The inset contains representative KV1.7 currents (−60 to 90 mV). All scale bars: 1 nA, 10 ms.
Figure 5 with 1 supplement
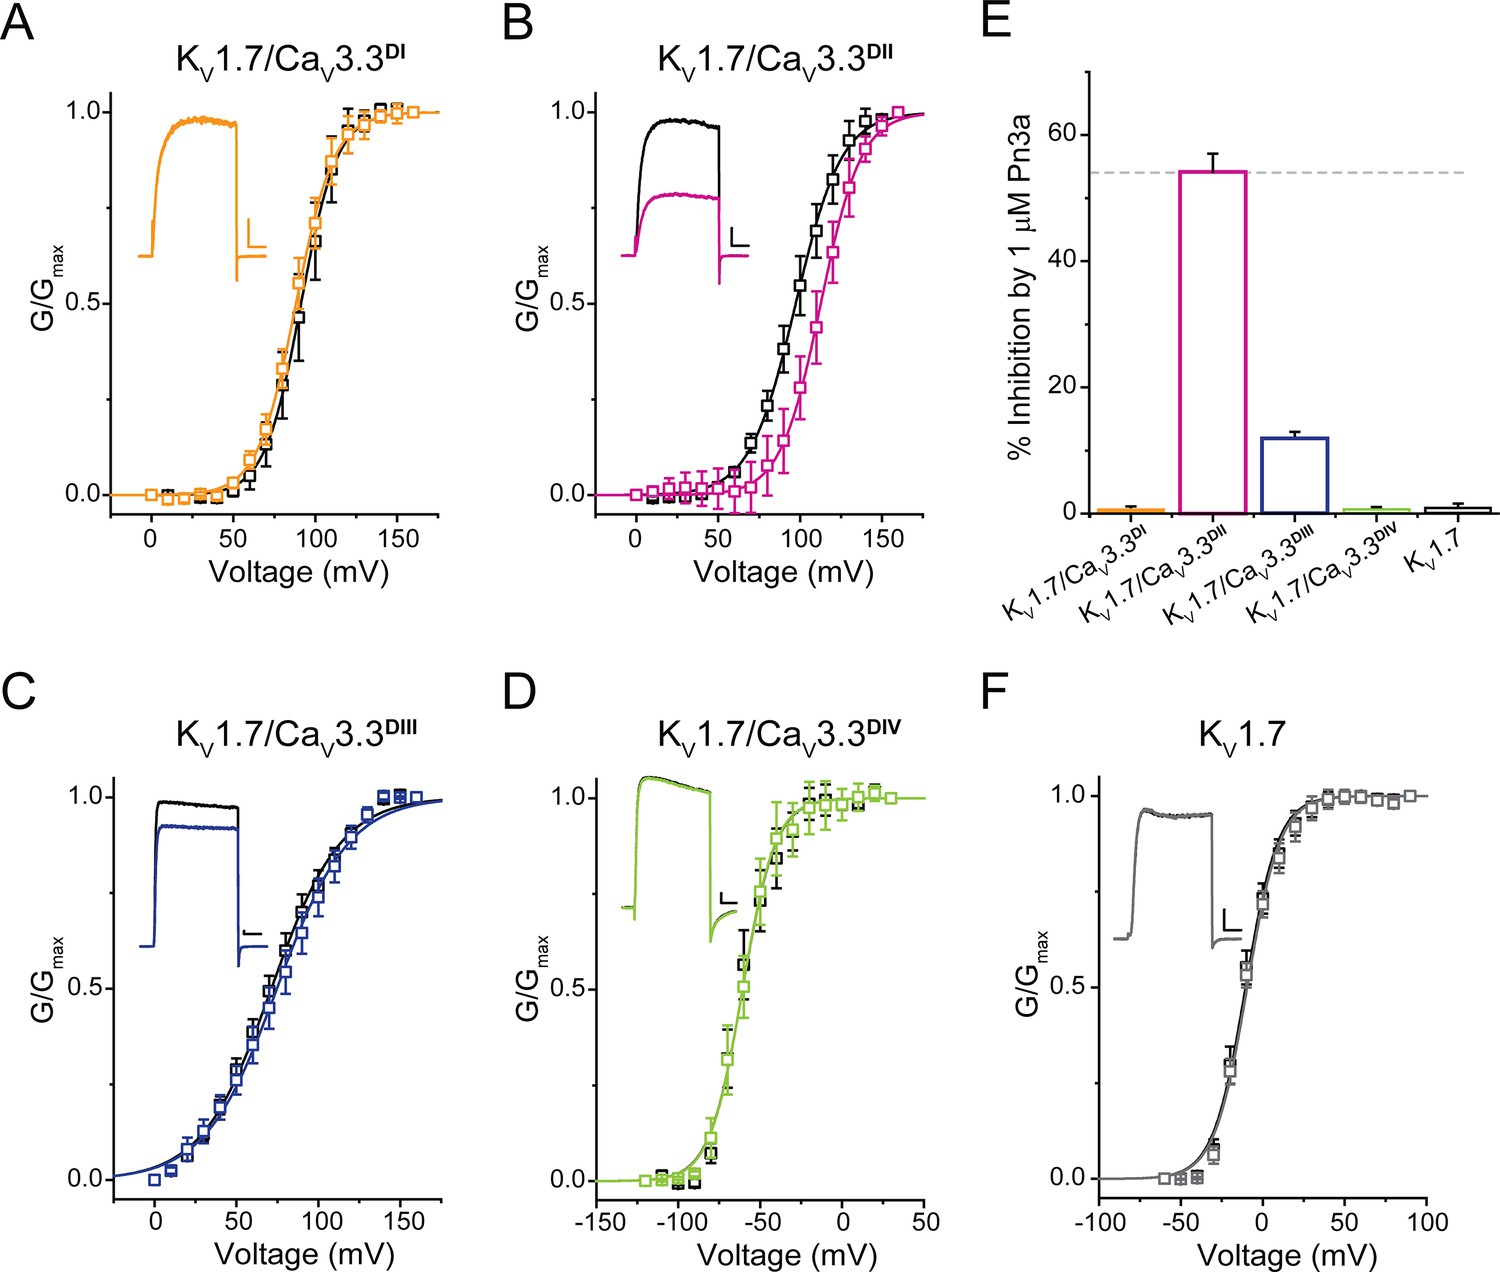
Pn3a shifts the activation of KV1.7/CaV3.3DII chimeric channels.
G/Gmax-V relationships and representative currents obtained in the absence (control, black) and presence of 1 µM Pn3a (pink) for (A) KV1.7/CaV3.3DI (90 mV), (B) KV1.7/CaV3.3DII (100 mV), (C) KV1.7/CaV3.3DIII (70 mV), and (D) KV1.7/CaV3.3DIV (−60 mV). (E) Bar graph showing percent inhibition by 1 µM Pn3a of KV1.7/CaV3.3DI-IV chimeras and KV1.7 wt. (F) KV1.7 G/Gmax-V relationship and current traces obtained in the absence (control) and presence of Pn3a (–10 mV). All scale bars: 1 nA, 10 ms.
-
Figure 5—source data 1
Voltage dependence of Pn3a inhibition of Kv1.7/Cav3.3 Chimera.
- https://cdn.elifesciences.org/articles/74040/elife-74040-fig5-data1-v2.xlsx
Figure 5—figure supplement 1
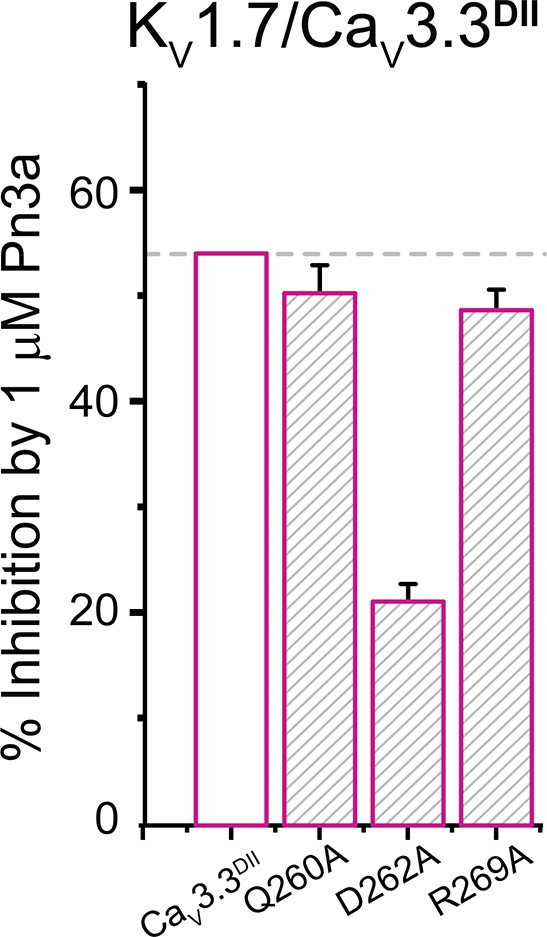
Bar graph showing percent inhibition by 1 µM Pn3a of KV1.7/CaV3.3DII chimera and mutants KV1.7/CaV3.3DII-Q260A, KV1.7/CaV3.3DII-D262A, and KV1.7/CaV3.3DII-R269A (corresponding to CaV3.3 −Q687A, −D689A, and −R696A, respectively).
Figure 6 with 3 supplements
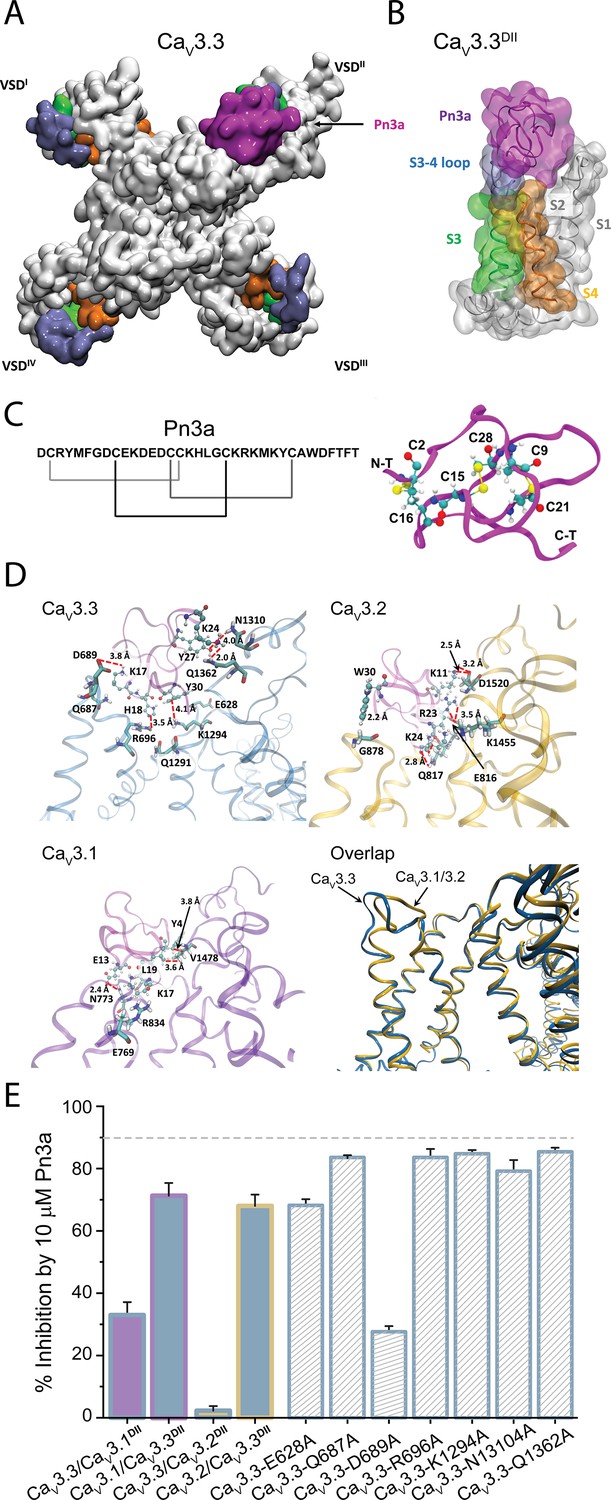
Pn3a and CaV3.3 interactions and subtype specificity.
(A) Top view of Pn3a (magenta) binding to CaV3.3DII. The S3 (lime), S3-4 loop (ice blue), and S4 (pink) are highlighted. (B) Side view of the binding conformation of Pn3a to CaV3.3DII. (C) Left: Pn3a amino acid sequence and disulfide connectivity. Right: 3D structure of Pn3a (PDB ID: 5T4R Deuis et al., 2017) showing cysteine residues in CPK linked by salt bridges (yellow). (D) Pairwise amino acid interactions between Pn3a (magenta) with the extracellular loop of CaV3.3DII (top left, blue), CaV3.2DII (top right, yellow), and CaV3.1DII (bottom left, purple). Overlap of the Pn3a-bound ribbon structures of all CaV3 highlighting differences in extracellular S3-S4 loops between CaV3.3 and the other two CaV3 isoforms (bottom right). S1, S1-2 loop, and S2 were removed for clarity. (E) Bar graph showing percent inhibition by 10 µM Pn3a of CaV3DII domain-swapped CaV3 constructs and point mutants.
-
Figure 6—source data 1
Pn3a docking coordinates for T-type calcium channels.
- https://cdn.elifesciences.org/articles/74040/elife-74040-fig6-data1-v2.zip
Figure 6—figure supplement 1
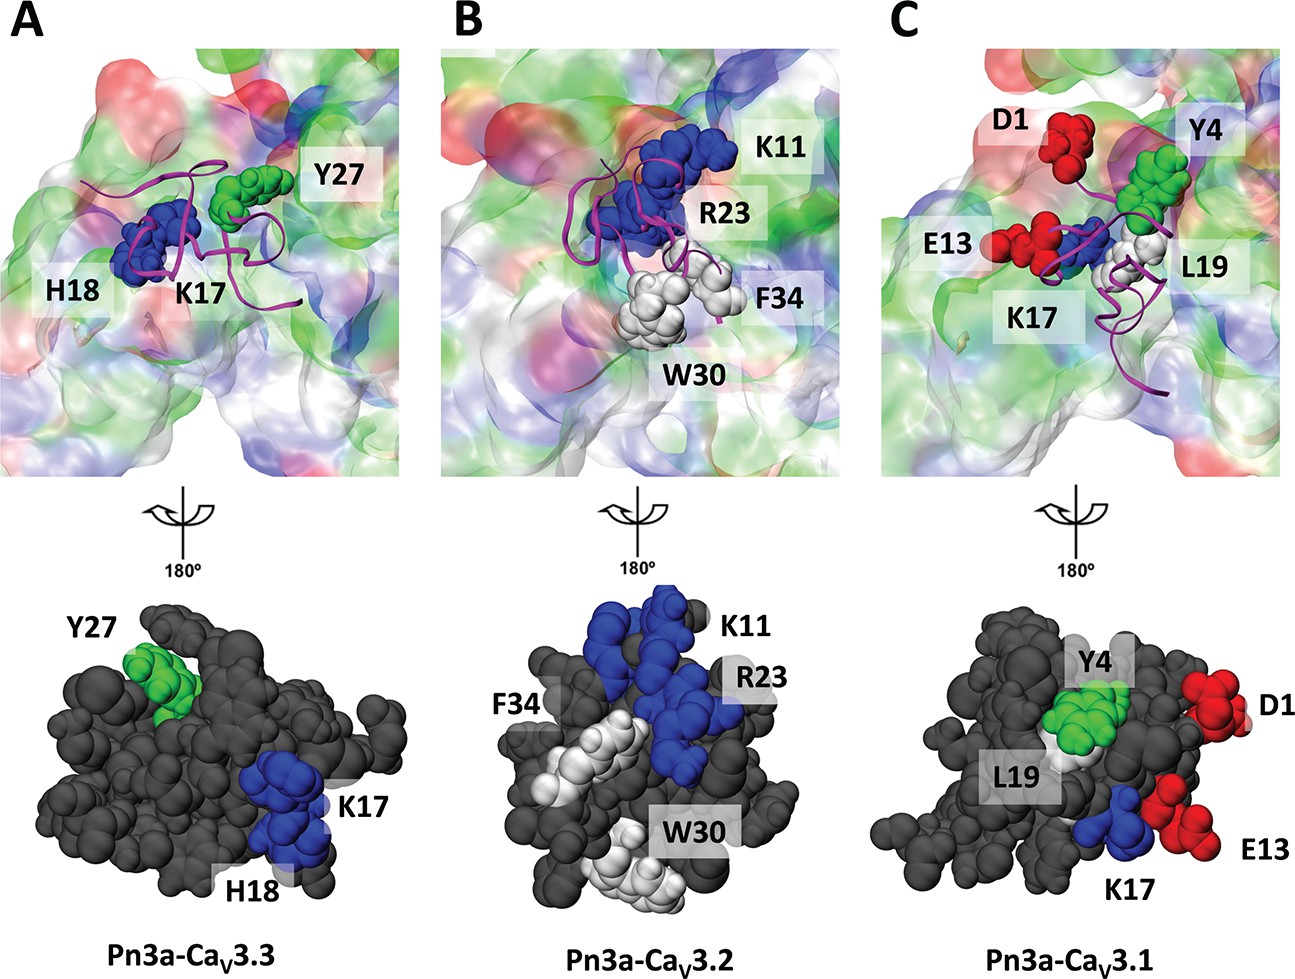
The binding conformation of Pn3a at voltage-sensing domain (VSD)-II of T-type calcium channels.
The interactive residues of the spider toxin contacting with corresponding residues of the VSDII of CaV3.3 (A), CaV3.2 (B), and CaV3.1 (C), respectively. For clarity, the binding domain of CaV3 channel shown in transparent colour was removed after rotating the binding conformation around the y-axis by 180° (in the bottom). The colouring method in visual molecular dynamics (VMD) was adopted for the residues and surfaces, demonstrating non-polar (white), basic (blue), acidic (red), and polar (green) residues.
Figure 6—figure supplement 2
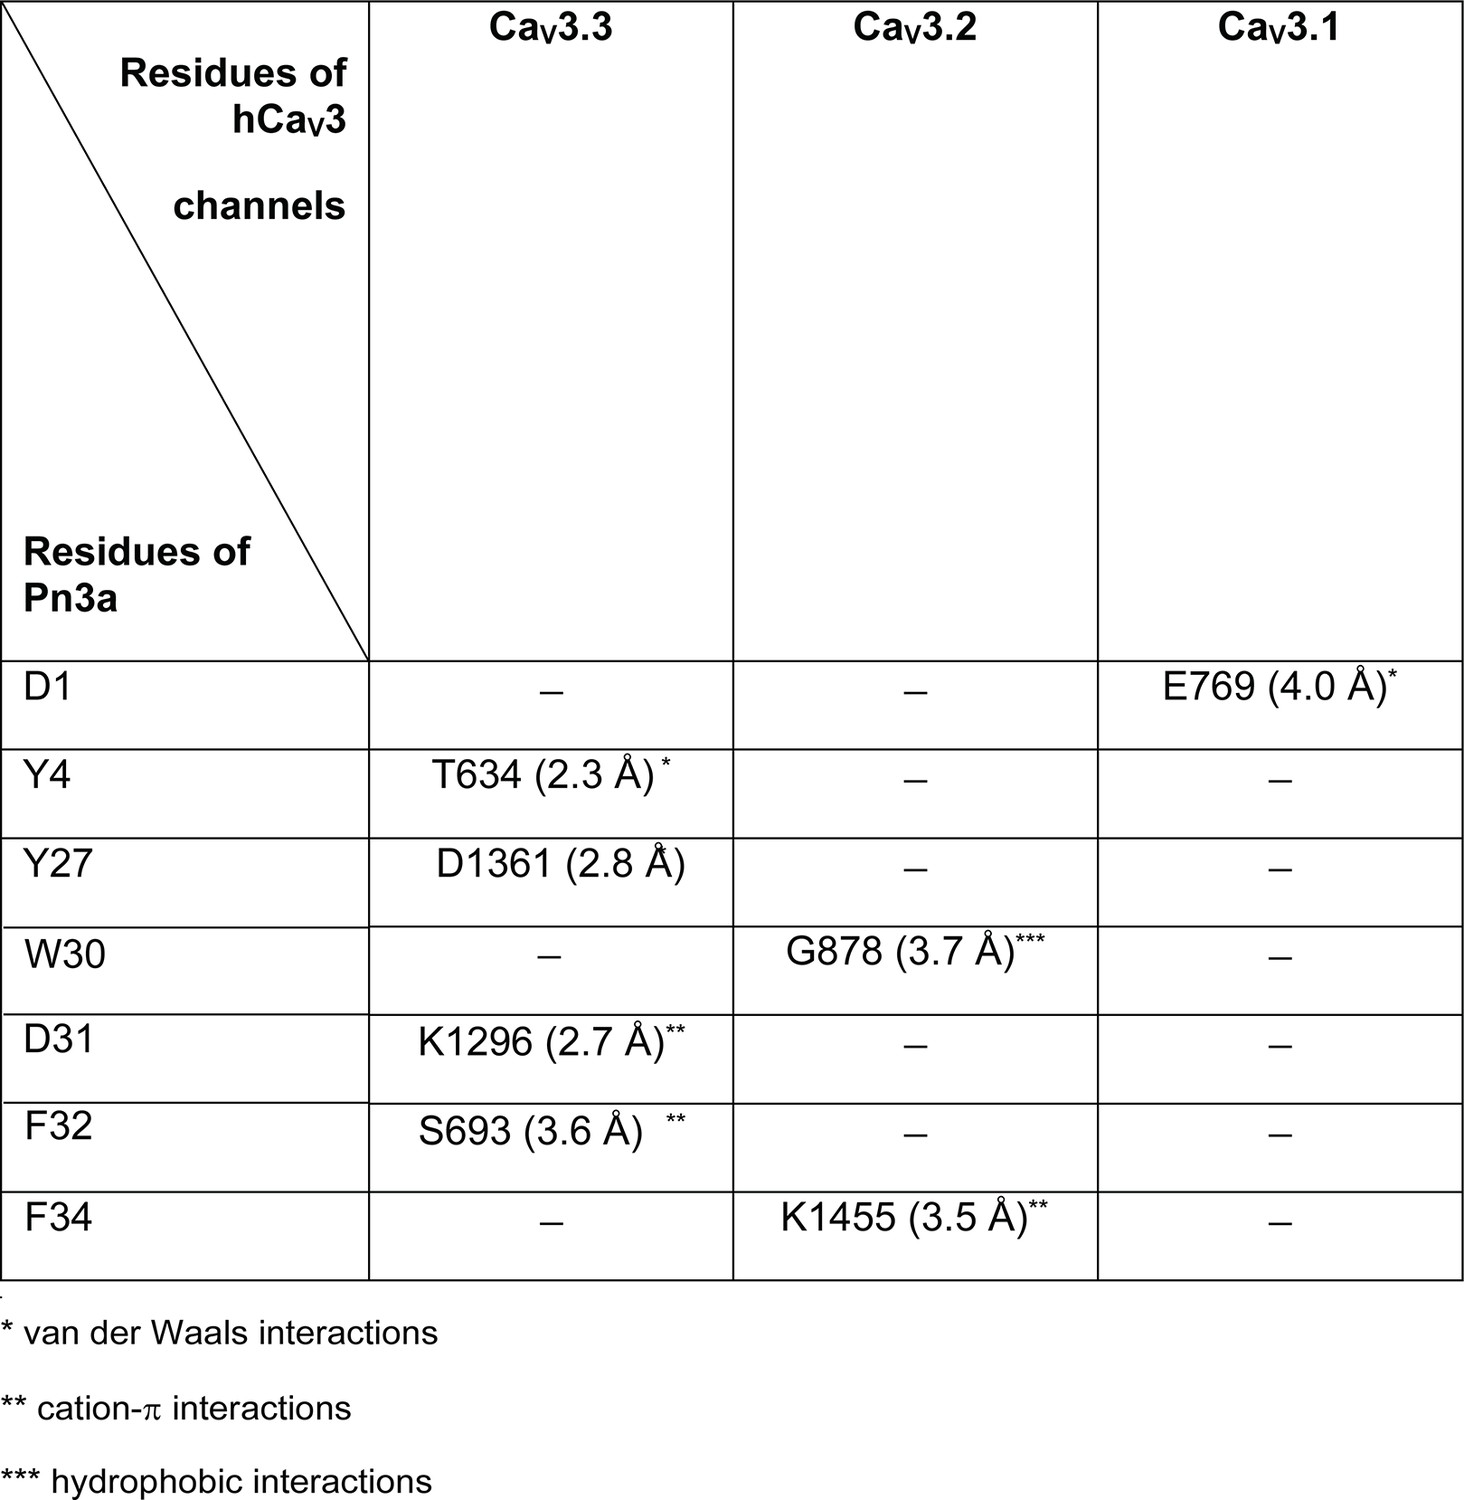
Minor interactions between the residues of Pn3a and the corresponding residues on hCaV3 channels.
Figure 6—figure supplement 3
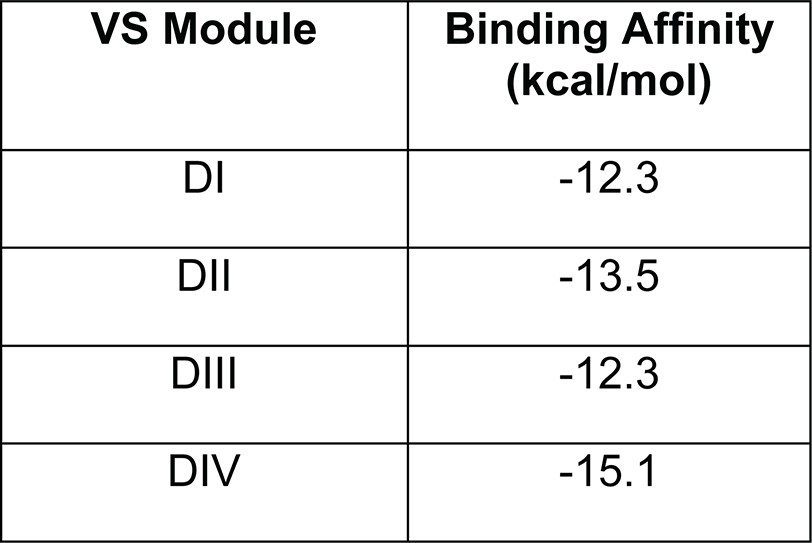
Predicted binding affinity values for Pn3a binding to the DI, DII, DIII, and DIV domains of the voltage sensor (VS) modules on hCaV3.3 calculated using Autodock Vina.
Tables
Table 1
Activation and inactivation values of CaV3.3 and Kv1.7-CaV3.3DI-IV chimers in the absence (control) and presence of Pn3a (3 µM for CaV3.3; 1 µM for KV1.7-CaV3.3D1-IV chimeras).
| Control Pn3a | |||
|---|---|---|---|
| hCaV3.3 | V0.5 activation | −28.3±0.4 mV (5) | −15.3±0.4 mV (5) * |
| ka Slope factor | 7.5±0.3 (5) | 10.0±0.3 (5) * | |
| V0.5 SSI | −56.3±0.3 mV (5) | −56.6±0.4 mV (5) | |
| ka Slope factor | 7.5±0.2 (5) | 8.4±0.4 (5) | |
| τ Recovery | 0.34±0.01ms (5) | 0.22±0.01 (5) * | |
| KV1.7 | V0.5 activation | −10.5±0.6 mV (7) | - |
| ka Slope factor | 9.9±0.5 (7) | - | |
| KV1.7-CaV3.3DI | V0.5 activation | 91.3±0.4 mV (5) | 88.2±0.3 mV (5) |
| ka Slope factor | 1.0±0.3 (5) | 11.8±0.2 (5) | |
| KV1.7CaV3.3DII | V0.5 activation | 97.3±0.4 mV (9) | 112.6±0.4 mV (7) * |
| ka Slope factor | 14.1±0.3 (9) | 12.3±0.4 (7) * | |
| KV1.7-CaV3.3DIII | V0.5 activation | 71.3±0.8 mV (7) | 74.7±0.9 mV (5) |
| ka Slope factor | 21.1±0.7 (7) | 22.0±0.8 (5) | |
| KV1.7-CaV3.3DIV | V0.5 activation | −60.8±0.8 mV (5) | −60.8±0.4 mV (5) |
| ka Slope factor | 10.1±0.7 (5) | 10.0±0.4 (5) | |
-
*
Significant determined from paired t-test with significance threshold set to p<0.05.
Additional files
Download links
A two-part list of links to download the article, or parts of the article, in various formats.
Downloads (link to download the article as PDF)
Open citations (links to open the citations from this article in various online reference manager services)
Cite this article (links to download the citations from this article in formats compatible with various reference manager tools)
µ-Theraphotoxin Pn3a inhibition of CaV3.3 channels reveals a novel isoform-selective drug binding site
eLife 11:e74040.
https://doi.org/10.7554/eLife.74040


