Eco1-dependent cohesin acetylation anchors chromatin loops and cohesion to define functional meiotic chromosome domains
- The Wellcome Centre for Cell Biology, Institute of Cell Biology, School of Biological Sciences, Michael Swann Building, Max Born Crescent, United Kingdom
Figures
Figure 1 with 3 supplements
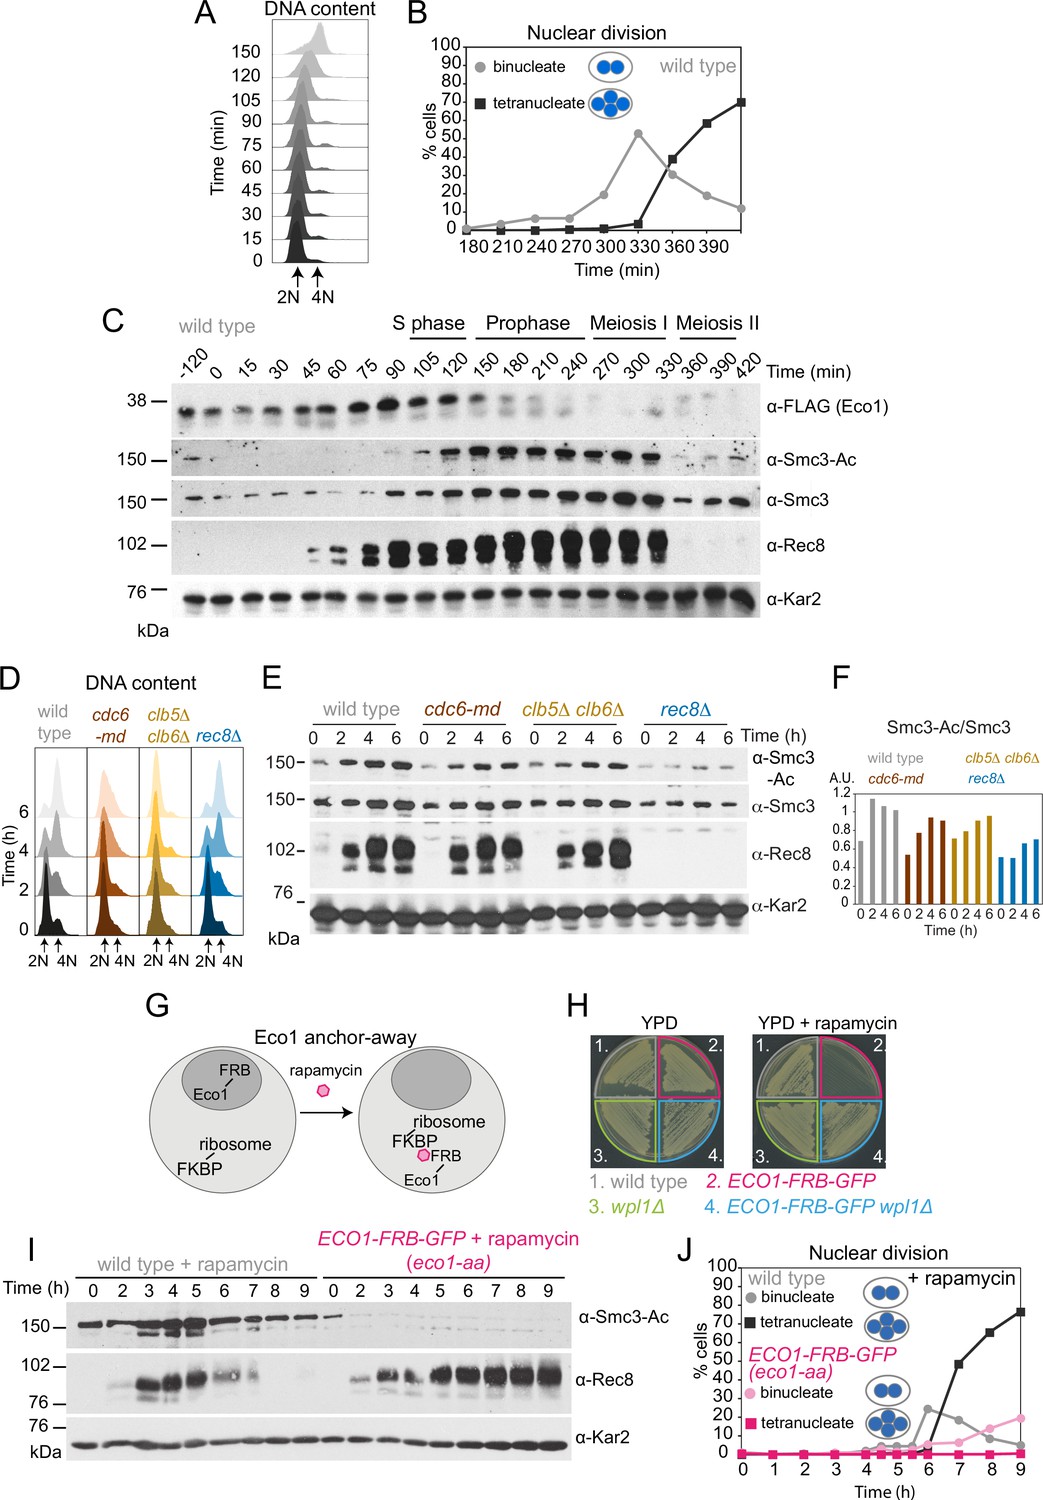
Eco1-dependent acetylation of Smc3-K112,113 occurs in meiotic S phase, independently of DNA replication.
(A–C) Smc3-Ac is deposited in S phase, following Eco1 production. Wild type (strain AM21574) carrying ECO1-6HIS-3FLAG and pCUP1-IME1 pCUP1-IME4 was released from a pre-meiotic S phase block 120 min after sporulation induction by addition of 25 μM CuSO4. (A) S phase completion (4N) was monitored by flow cytometry. (B) The percentages of bi- and tetranucleate cells were scored at the indicated timepoints to monitor meiosis I and II nuclear division, respectively (n = 200 cells per timepoint). (C) Western immunoblot shows the total cellular levels of Eco1-6HIS-3FLAG (α-FLAG), Smc3-Ac (α-Smc3-K112,113-Ac), Smc3 (α-Smc3), and Rec8 (α-Rec8) with Kar2 as a loading control (α-Kar2). (D, E) Bulk DNA replication is not essential for Smc3-Ac. Wild-type (AM11633), cdc6-md (AM28842), clb5Δ clb6Δ (AM28841), and rec8Δ (AM28843) cells carrying ndt80Δ were induced to sporulate and allowed to arrest in prophase I. (D) Flow cytometry shows DNA content. (E) Western immunoblot shows total cellular levels of Smc3-Ac (α-Smc3-K112,113-Ac), Smc3 (α-Smc3), Rec8 (α-Rec8), and Kar2 loading control (α-Kar2). (F) Quantification of Smc3-Ac normalized to Smc3 protein levels (A.U. = arbitrary units). (G) Schematic of the anchor-away system used to deplete Eco1 from the nucleus (eco1-aa). (H) The lethality of Eco1 anchor-away is rescued by deletion of WPL1. Haploid wild-type (AM13762), ECO1-FRB-GFP (AM22004), wpl1Δ (AM22440), and ECO1-FRB-GFP wpl1Δ (AM22981) strains of the anchor-away background (RPL13A-FKBP12, fpr1Δ, tor1-1) were plated on YPD or YPD + 1 μM rapamycin. (I, J) Eco1 is essential for meiotic progression. Anchoring-away Eco1-FRB-GFP reduces acetylation of Smc3-K112,K113, impairs cleavage of Rec8, and reduces nuclear divisions. Anchor-away wild-type (AM25532) and ECO1-FRB-GFP (AM22034) cells were induced to sporulate in the presence of 1 μM rapamycin. (I) Western immunoblot of whole-cell extracts showing Smc3-Ac (α-Smc3-K112,K113-Ac), Rec8 (α-Rec8), and Kar2 loading control (α-Kar2). (J) The percentages of bi- and tetranucleate cells were scored after DAPI staining at the indicated timepoints (n = 200 cells/timepoint).
-
Figure 1—source data 1
Source images for the blot in Figure 1C.
- https://cdn.elifesciences.org/articles/74447/elife-74447-fig1-data1-v2.zip
-
Figure 1—source data 2
Source images for the blot in Figure 1C.
- https://cdn.elifesciences.org/articles/74447/elife-74447-fig1-data2-v2.zip
-
Figure 1—source data 3
Source images for the blot in Figure 1C.
- https://cdn.elifesciences.org/articles/74447/elife-74447-fig1-data3-v2.zip
-
Figure 1—source data 4
Source images for the blot in Figure 1C.
- https://cdn.elifesciences.org/articles/74447/elife-74447-fig1-data4-v2.zip
-
Figure 1—source data 5
Source images for the blot in Figure 1C.
- https://cdn.elifesciences.org/articles/74447/elife-74447-fig1-data5-v2.zip
-
Figure 1—source data 6
Source images for the blot in Figure 1E.
- https://cdn.elifesciences.org/articles/74447/elife-74447-fig1-data6-v2.zip
-
Figure 1—source data 7
Source images for the blot in Figure 1E.
- https://cdn.elifesciences.org/articles/74447/elife-74447-fig1-data7-v2.zip
-
Figure 1—source data 8
Source images for the blot in Figure 1E.
- https://cdn.elifesciences.org/articles/74447/elife-74447-fig1-data8-v2.zip
-
Figure 1—source data 9
Source images for the blot in Figure 1E.
- https://cdn.elifesciences.org/articles/74447/elife-74447-fig1-data9-v2.zip
-
Figure 1—source data 10
Source images for the blot in Figure 1I.
- https://cdn.elifesciences.org/articles/74447/elife-74447-fig1-data10-v2.zip
-
Figure 1—source data 11
Source images for the blot in Figure 1I.
- https://cdn.elifesciences.org/articles/74447/elife-74447-fig1-data11-v2.zip
-
Figure 1—source data 12
Source images for the blot in Figure 1I.
- https://cdn.elifesciences.org/articles/74447/elife-74447-fig1-data12-v2.zip
Figure 1—figure supplement 1
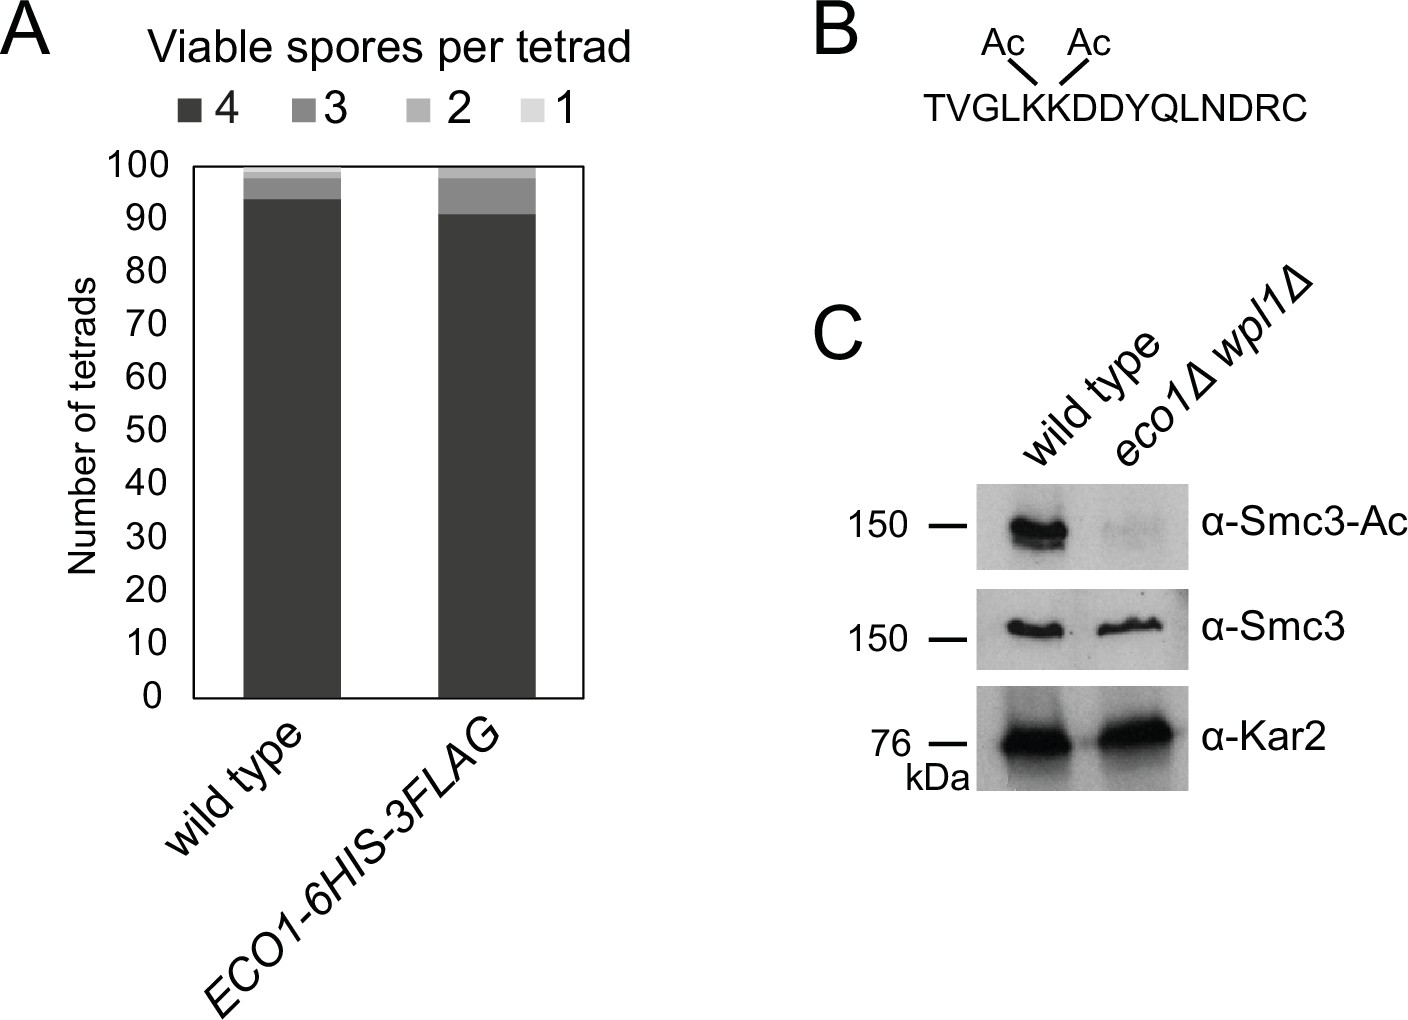
Tools to analyze Eco1-dependent Smc3 acetylation in meiosis.
(A) Eco1-6HIS-3FLAG is functional in meiosis. Spore viability of wild-type (AM1835) and ECO1-6HIS-3FLAG (AM25844) strains. (B, C) An antibody to specifically recognize acetylated Smc3-K112,K113 in budding yeast. (B) Sequence of the peptide used as an immunogen for α-Smc3-Ac antibody generation. (C) Western immunoblot showing specificity of α-Smc3-Ac. Exponentially growing wild-type (AM1176) and eco1Δ wpl1Δ (AM5433) cells were collected and total protein extracts analyzed by immunoblotting with α-Smc3-Ac, α-Smc3, and α-Kar2 antibodies.
-
Figure 1—figure supplement 1—source data 1
Source images for the blot in Figure 1—figure supplement 1C.
- https://cdn.elifesciences.org/articles/74447/elife-74447-fig1-figsupp1-data1-v2.zip
-
Figure 1—figure supplement 1—source data 2
Source images for the blot in Figure 1—figure supplement 1C.
- https://cdn.elifesciences.org/articles/74447/elife-74447-fig1-figsupp1-data2-v2.zip
-
Figure 1—figure supplement 1—source data 3
Source images for the blot in Figure 1—figure supplement 1C.
- https://cdn.elifesciences.org/articles/74447/elife-74447-fig1-figsupp1-data3-v2.zip
Figure 1—figure supplement 2
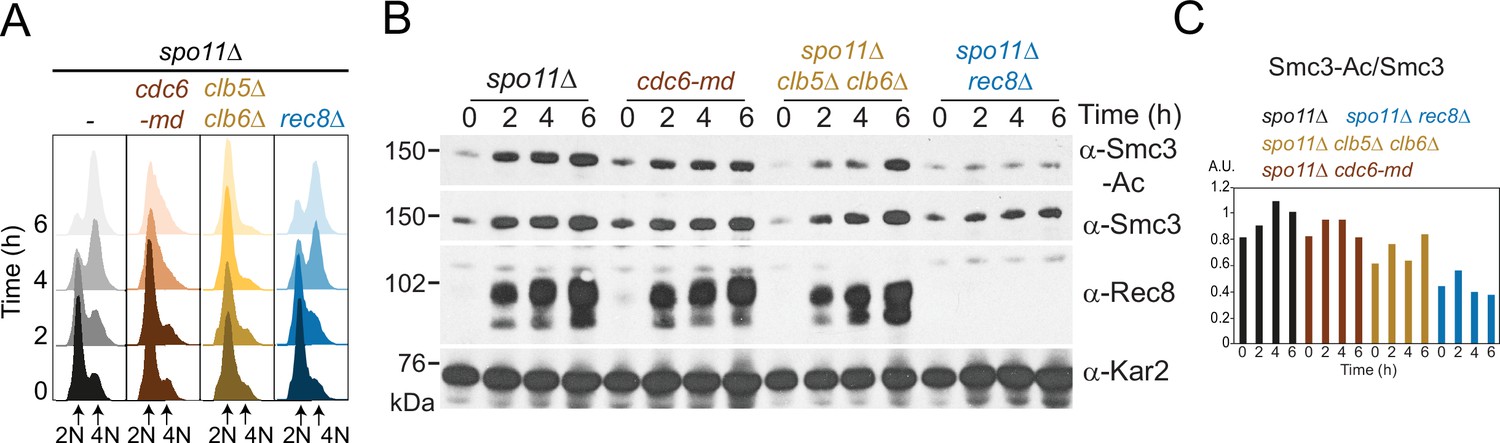
Smc3-Ac does not require meiotic recombination.
Smc3-K112,113 acetylation on unreplicated chromosomes is not a consequence of double-strand break formation during meiotic recombination or meiotic replication. spo11Δ (AM28949), spo11Δ cdc6-md (AM28948), spo11Δ clb5Δ clb6Δ (AM28947), and spo11Δ rec8Δ (AM28950) cells carrying ndt80Δ were analyzed as in Figure 1D–F. Flow cytometry profiles (A) and Western immunoblots (B) against Smc3-Ac (α-Smc3-K112,113-Ac), Smc3 (α-Smc3), Rec8 (α-Rec8), and Kar2 loading control (α-Kar2) are shown. (C) Quantification of Smc3-Ac normalized to Smc3 protein levels (A.U. = arbitrary units).
-
Figure 1—figure supplement 2—source data 1
Source images for the blot in Figure 1—figure supplement 1B.
- https://cdn.elifesciences.org/articles/74447/elife-74447-fig1-figsupp2-data1-v2.zip
-
Figure 1—figure supplement 2—source data 2
Source images for the blot in Figure 1—figure supplement 1B.
- https://cdn.elifesciences.org/articles/74447/elife-74447-fig1-figsupp2-data2-v2.zip
-
Figure 1—figure supplement 2—source data 3
Source images for the blot in Figure 1—figure supplement 1B.
- https://cdn.elifesciences.org/articles/74447/elife-74447-fig1-figsupp2-data3-v2.zip
-
Figure 1—figure supplement 2—source data 4
Source images for the blot in Figure 1—figure supplement 1B.
- https://cdn.elifesciences.org/articles/74447/elife-74447-fig1-figsupp2-data4-v2.zip
Figure 1—figure supplement 3
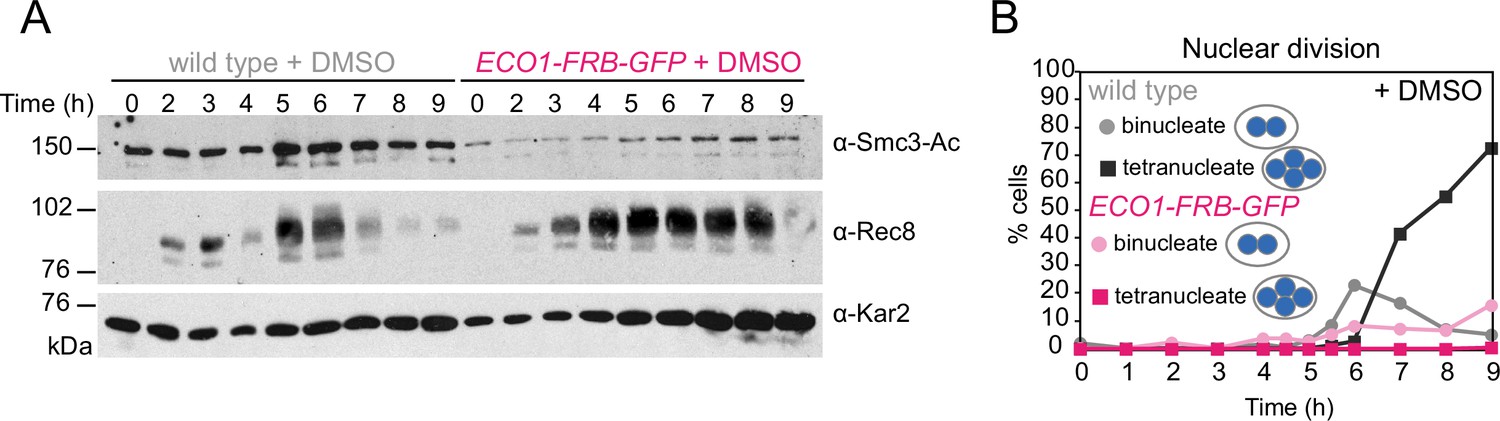
Eco1-FRB-GFP is nonfunctional in meiosis even in the absence of rapamycin.
Anchor-away wild-type (AM25532) and eco1-aa (AM22034) cells were induced to sporulate as in Figure 1I and J, except that dimethyl sulfoxide (DMSO) was added rather than rapamycin. (A) Western immunoblot of whole-cell extracts showing Smc3-Ac (α-Smc3-K112,113-Ac), Rec8 (α-Rec8), and Kar2 loading control (α-Kar2). (B) The percentages of bi- and tetranucleate cells were scored after DAPI staining at the indicated timepoints (n = 200 cells/timepoint).
-
Figure 1—figure supplement 3—source data 1
Source images for the blot in Figure 1—figure supplement 1A.
- https://cdn.elifesciences.org/articles/74447/elife-74447-fig1-figsupp3-data1-v2.zip
-
Figure 1—figure supplement 3—source data 2
Source images for the blot in Figure 1—figure supplement 1A.
- https://cdn.elifesciences.org/articles/74447/elife-74447-fig1-figsupp3-data2-v2.zip
-
Figure 1—figure supplement 3—source data 3
Source images for the blot in Figure 1—figure supplement 1A.
- https://cdn.elifesciences.org/articles/74447/elife-74447-fig1-figsupp3-data3-v2.zip
Figure 2 with 2 supplements
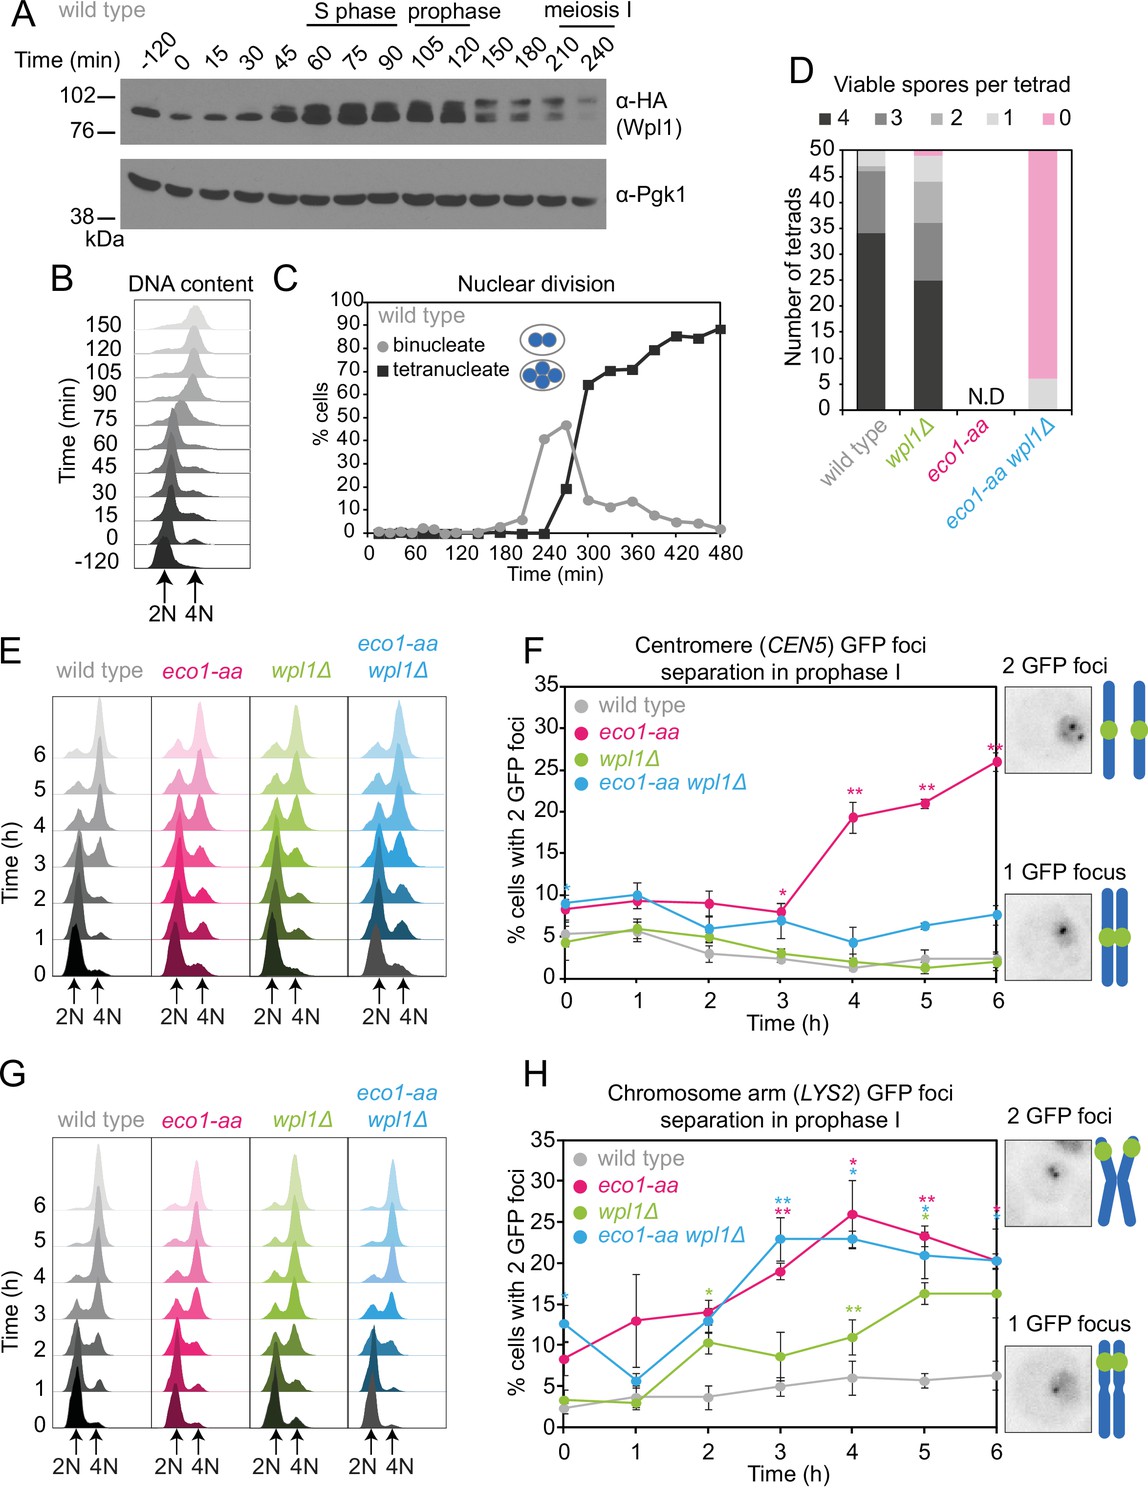
Counteracting Wpl1 is not the only essential role of Eco1 in meiosis.
(A–C) Wpl1 is most abundant during meiotic S phase and prophase. Wild type (AM20916) carrying WPL1-6HA and pCUP1-IME1 pCUP1-IME4 was induced to undergo synchronous meiotic S phase as described in Figure 1A. (A) Western immunoblot shows total protein levels of Wpl1-6HA (α-HA) with Pgk1 loading control (α-Pgk1). (B) Flow cytometry profiles and (C) nuclear division (n = 200 cells per timepoint) show the timing of bulk DNA replication and chromosome segregation, respectively. (D) Eco1 is essential for meiosis, even in the absence of Wpl1. Spore viability of wild-type (AM24170), wpl1Δ (AM24265), eco1-aa (AM24171), and eco1-aa wpl1Δ (AM24289) strains, sporulated in the presence of 1 μM rapamycin. N.D. = not done since it was not possible to find 50 tetrads in eco1-aa cells to measure spore viability. (E, F) Establishment of centromeric cohesion requires Eco1-dependent antagonism of Wpl1. Wild-type (AM27183), wpl1Δ (AM27186), eco1-aa (AM27185), and eco1-aa wpl1Δ (AM27184) anchor-away strains carrying heterozygous CEN5-GFP and ndt80Δ were induced to sporulate in 1 μM rapamycin, and the percentage of cells with two visible GFP foci was scored at the indicated timepoints (F). Meiotic progression was monitored as DNA content (E). (G, H) Chromosomal arm cohesion requires Eco1, even in the absence of Wpl1. Wild-type (AM27253), wpl1Δ (AM27256), eco1-aa (AM27255), and eco1-aa wpl1Δ (AM27254) anchor-away strains carrying heterozygous LYS2-GFP and ndt80Δ were treated and analyzed as described in (E) and (F). In (F, H), an average of three biological replicates is shown; 100 cells were scored for each timepoint in each experiment. Error bars show standard error; *p<0.05, **p<0.01, paired Student’s t-test when compared to wild type.
-
Figure 2—source data 1
Source images for the blot in Figure 2A.
- https://cdn.elifesciences.org/articles/74447/elife-74447-fig2-data1-v2.zip
-
Figure 2—source data 2
Source images for the blot in Figure 2A.
- https://cdn.elifesciences.org/articles/74447/elife-74447-fig2-data2-v2.zip
Figure 2—figure supplement 1
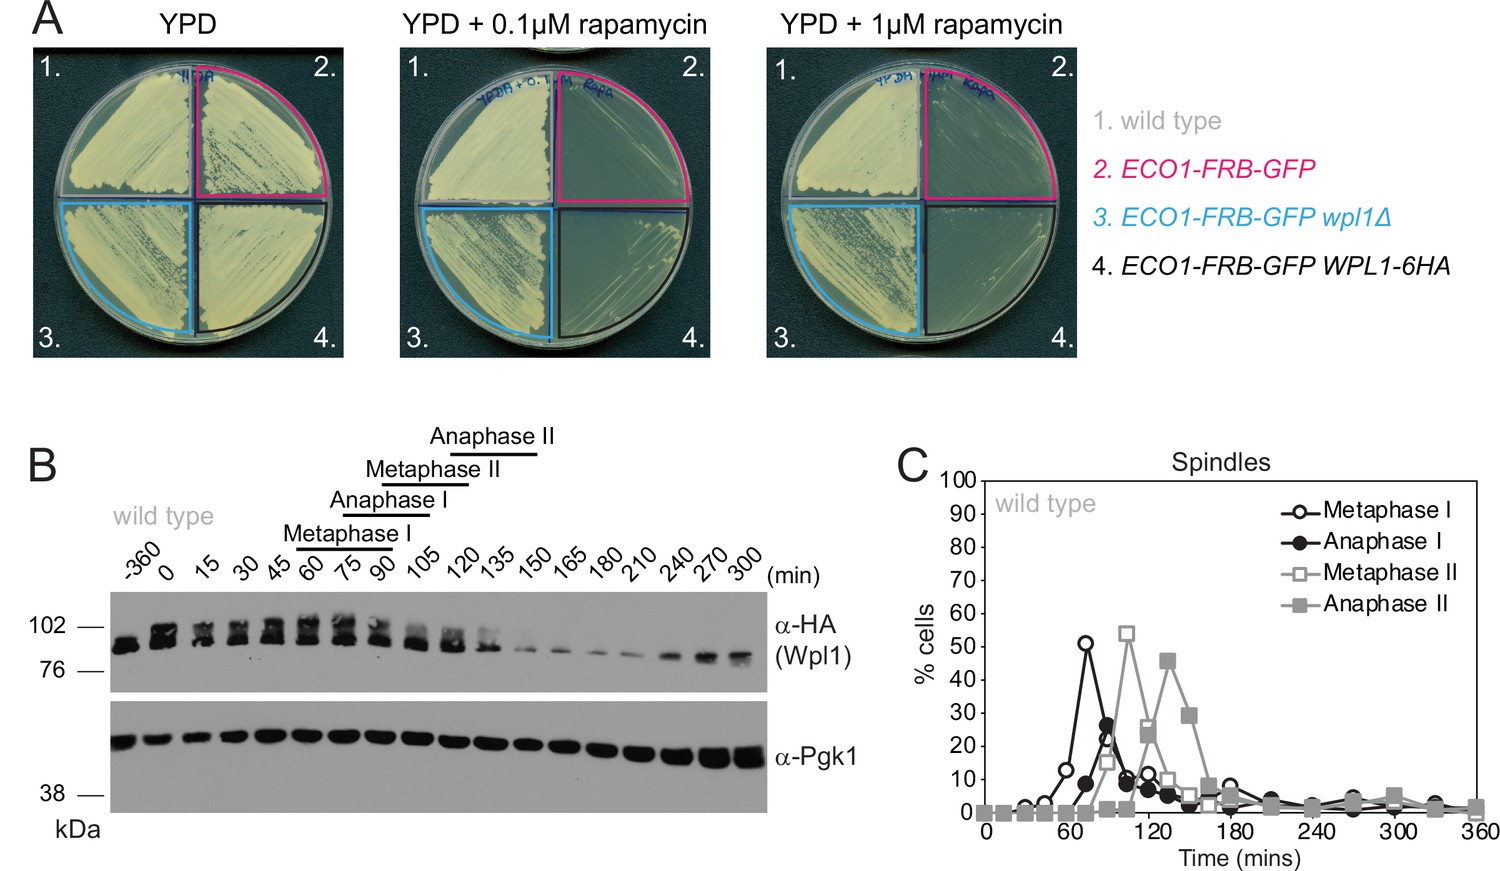
Wpl1-6HA is functional and expressed in meiosis.
(A) Diploid anchor-away wild-type (AM23130), eco1-aa (AM22998), eco1-aa wpl1Δ (AM23415), and eco1-aa WPL1-6HA (AM23161) strains were patched onto either YPD, YPD + 0.1 μM rapamycin, or YPD + 1 μM rapamycin agar plates and incubated at 30°C for 48 hr. (B, C) Cells carrying WPL1-6HA and the pGAL-NDT80 block/release genetic background (strain AM20953) were induced to sporulate. After 6 hr, 1 μM β-estradiol was added to induce NDT80 expression and release cells from prophase arrest. (B) Western immunoblot showing Wpl1-6HA (α-HA) and Pgk1 loading control (α-Pgk1). (C) Meiotic progression was monitored by scoring spindle morphology after α-tubulin immunofluorescence (n = 200 per timepoint).
-
Figure 2—figure supplement 1—source data 1
Source images for the blot in Figure 2—figure supplement 2B.
- https://cdn.elifesciences.org/articles/74447/elife-74447-fig2-figsupp1-data1-v2.zip
-
Figure 2—figure supplement 1—source data 2
Source images for the blot in Figure 2—figure supplement 2B.
- https://cdn.elifesciences.org/articles/74447/elife-74447-fig2-figsupp1-data2-v2.zip
Figure 2—figure supplement 2
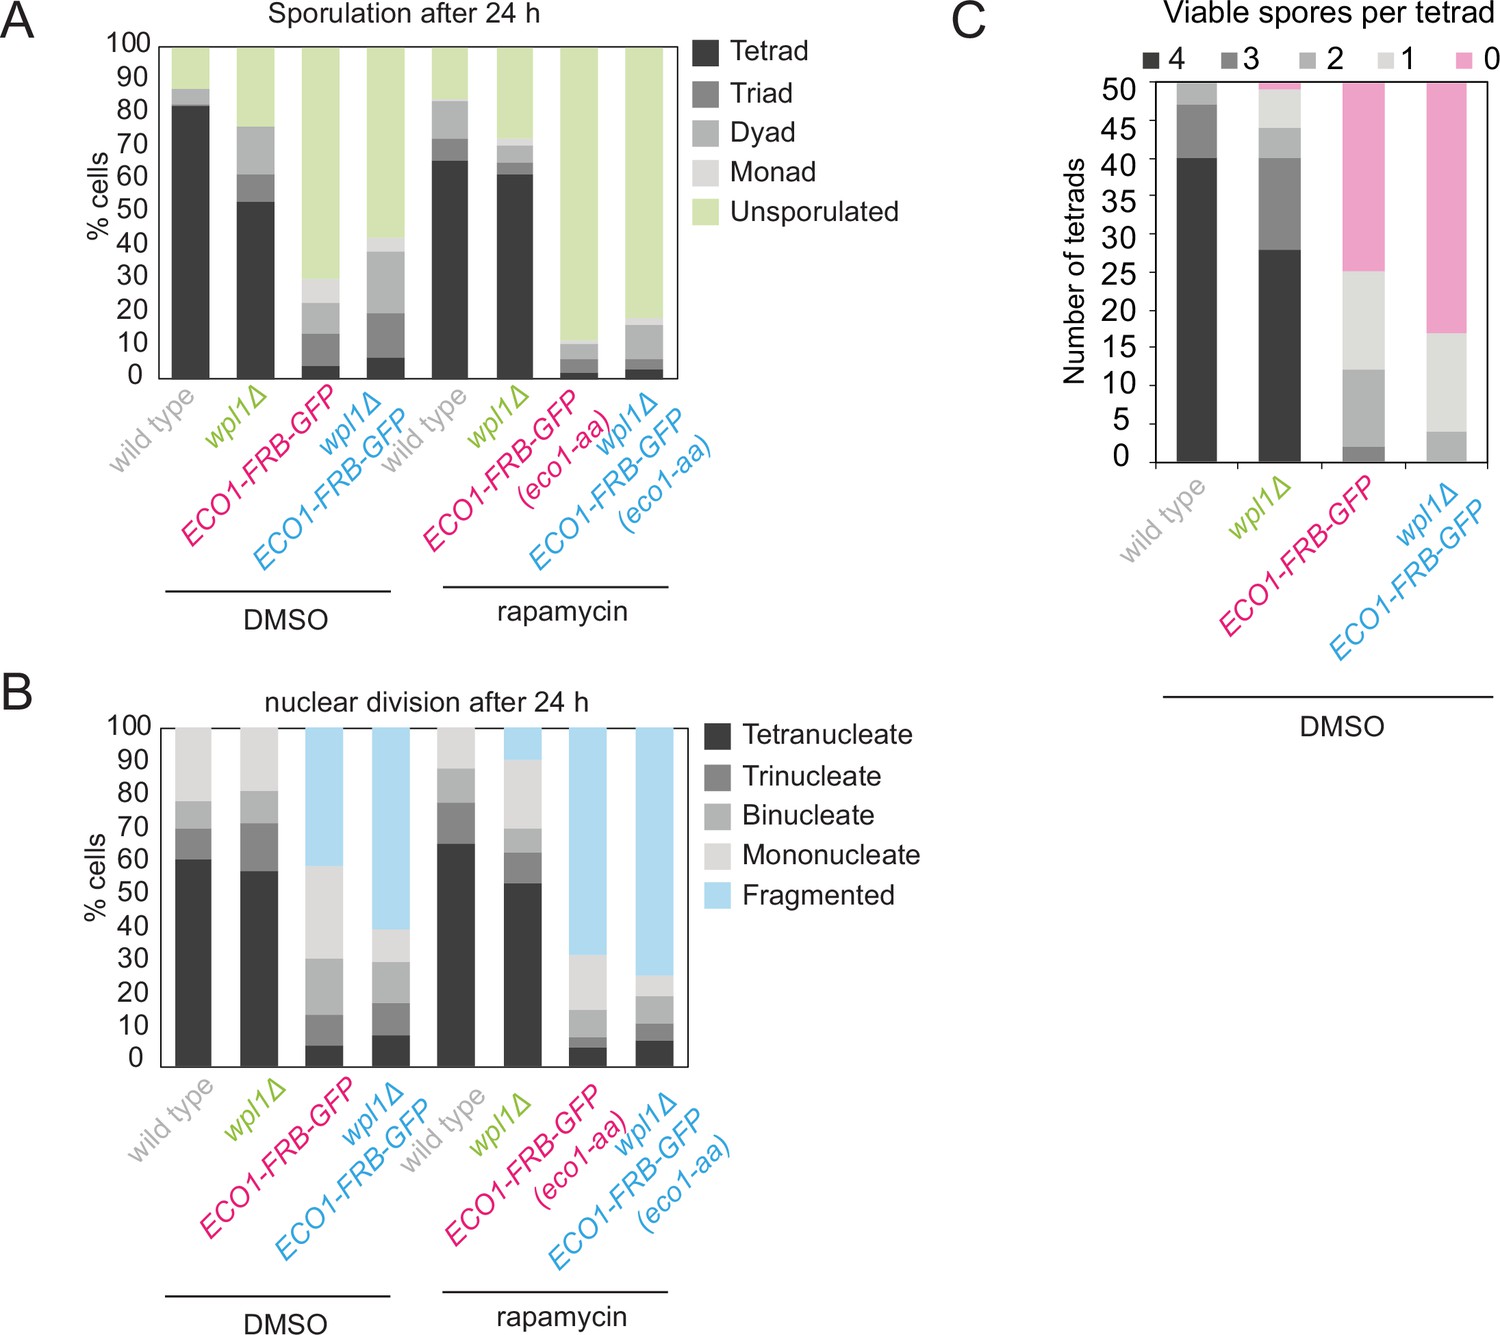
Eco1 is required for meiosis even in the absence of Wpl1.
Wild-type, eco1-aa, wpl1Δ, and eco1-aa wpl1Δ cells as in Figure 2D were sporulated in the presence of rapamycin or dimethyl sulfoxide (DMSO). (A) Sporulation efficiency was determined after 24 hr (n = 200). (B) The number and morphology of nuclei was scored (n = 200). (C) Spore viability was determined as described in Figure 2D, except that cells were sporulated in the presence of DMSO rather than rapamycin.
Figure 3 with 1 supplement
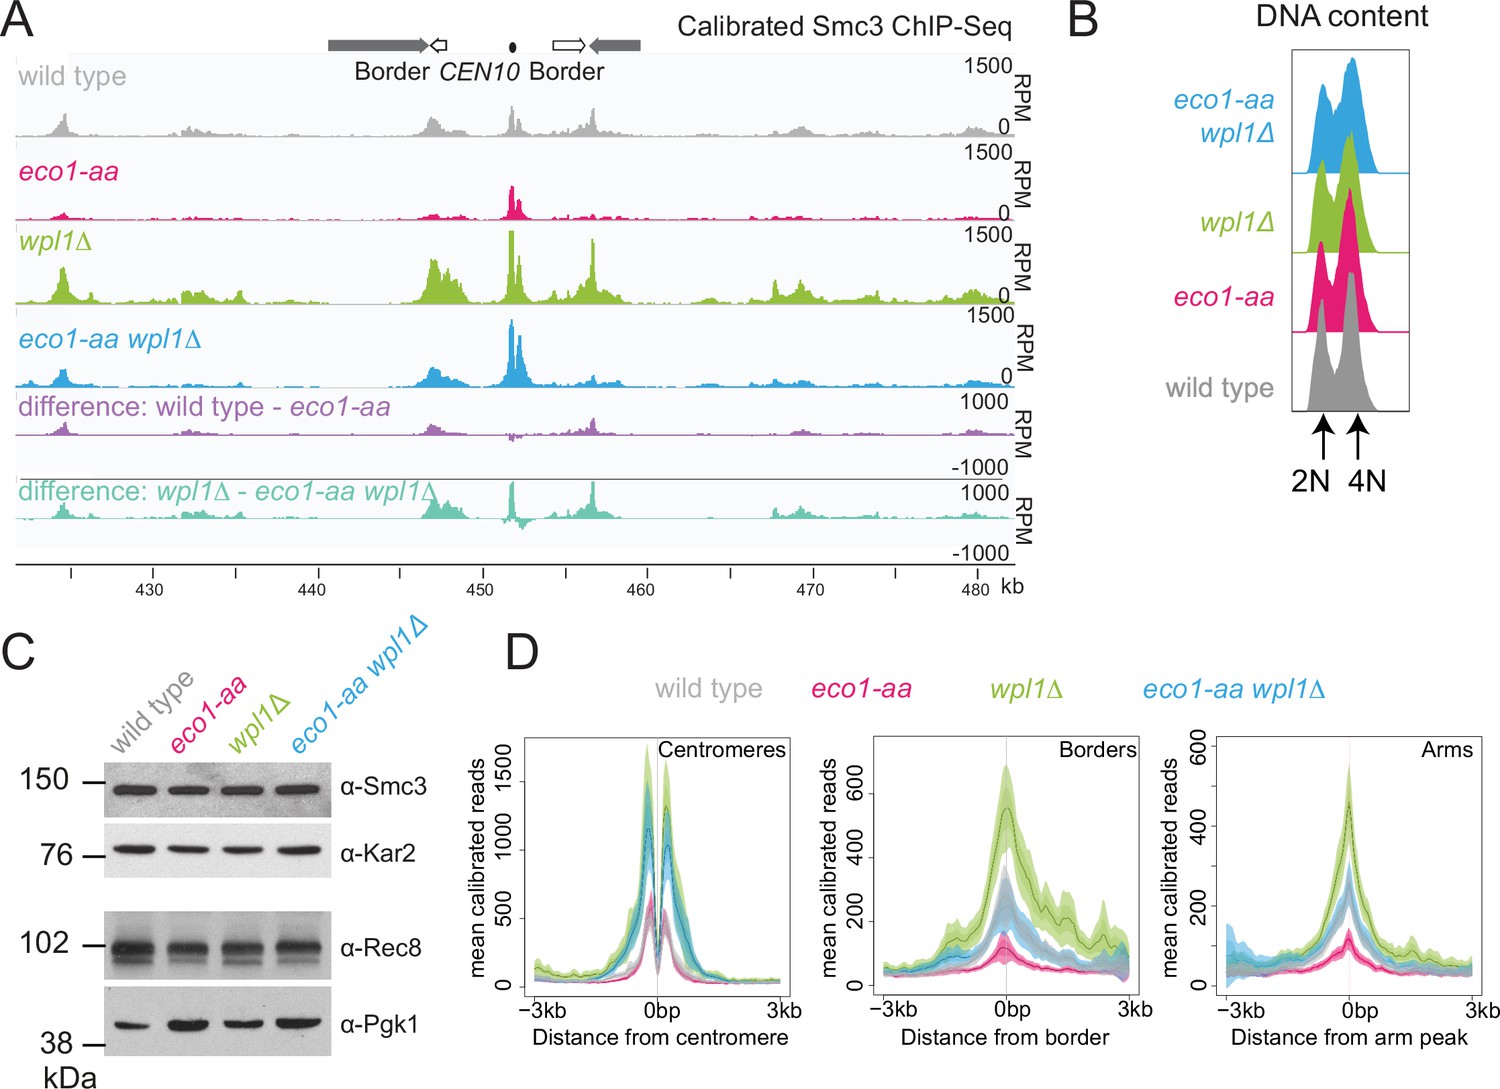
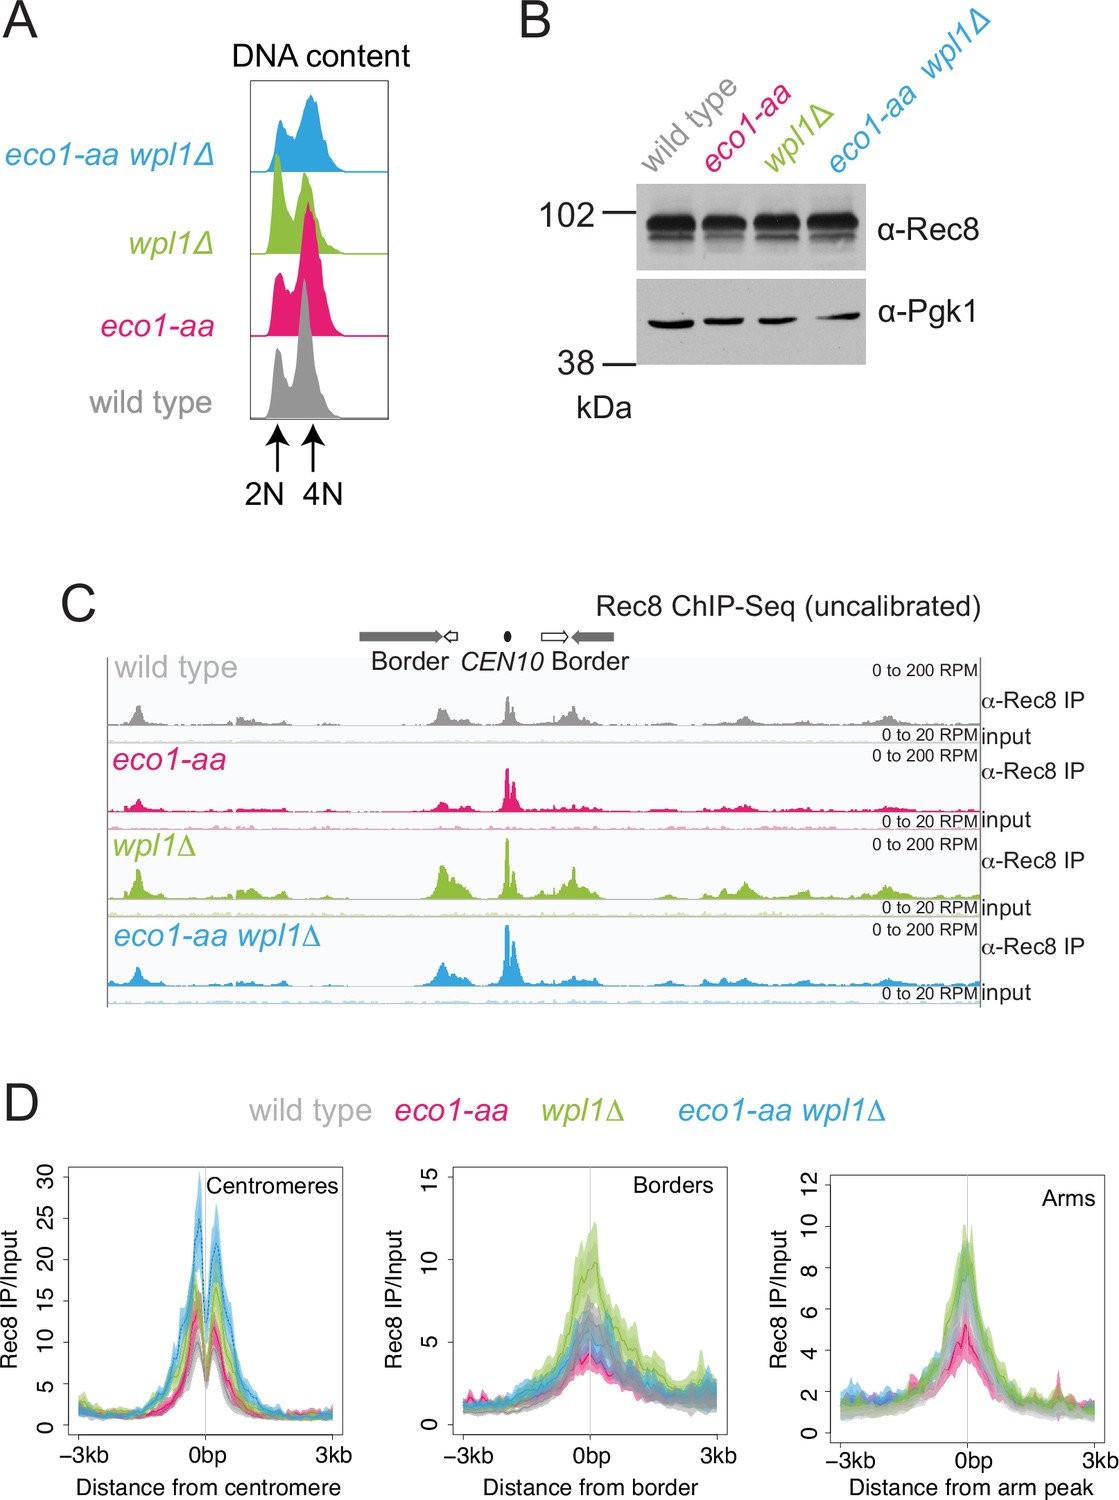
Eco1 restricts Wpl1-dependent removal of chromosomal cohesin during meiotic prophase and retains cohesin at pericentromere borders.
Wpl1 globally reduces chromosomal cohesin levels, while Eco1 is required for normal cohesin levels on chromosome arms. Wild-type (AM28719), eco1-aa (AM28720), wpl1Δ (AM29750), and wpl1Δ eco1-aa (AM29781) anchor-away strains carrying ndt80Δ were harvested 6 hr after induction of sporulation. (A) Calibrated Smc3 ChIP-seq for a representative region surrounding CEN10. (B) Flow cytometry profiles show similar DNA content at harvesting in all cultures. (C) Western immunoblot with loading controls (α-Kar2 and α-Pgk1) shows comparable Smc3 (α-Smc3) and Rec8 (α-Rec8) levels in all cultures at the time of harvesting. (D) Mean calibrated ChIP-seq reads (line), standard error (dark shading), and 95% confidence interval (light shading) at all 16 centromeres, 32 borders, and 32 representative arm peaks.
-
Figure 3—source data 1
Source images for the blot in Figure 3C.
- https://cdn.elifesciences.org/articles/74447/elife-74447-fig3-data1-v2.zip
-
Figure 3—source data 2
Source images for the blot in Figure 3C.
- https://cdn.elifesciences.org/articles/74447/elife-74447-fig3-data2-v2.zip
-
Figure 3—source data 3
Source images for the blot in Figure 3C.
- https://cdn.elifesciences.org/articles/74447/elife-74447-fig3-data3-v2.zip
Figure 3—figure supplement 1
Eco1 retains Rec8 at pericentromere borders and antagonizes Wpl1-dependent Rec8 removal during meiotic prophase.
Rec8 ChIP-seq was performed in prophase I using the strains as described in Figure 3. (A) Flow cytometry profiles show similar DNA content at harvesting in all cultures (B) Western immunoblot with Pgk1 loading control (α-Pgk1) shows comparable Rec8 (α-Rec8) levels in all cultures at the time of harvesting. (C) Rec8 ChIP-seq for a representative region surrounding CEN10. (D) Mean ChIP-seq reads (line), standard error (dark shading), and 95% confidence interval (light shading) at all 16 centromeres, 32 borders, or 32 representative arm sites.
-
Figure 3—figure supplement 1—source data 1
Source images for the blot in Figure 3—figure supplement 1B.
- https://cdn.elifesciences.org/articles/74447/elife-74447-fig3-figsupp1-data1-v2.zip
-
Figure 3—figure supplement 1—source data 2
Source images for the blot in Figure 3—figure supplement 1B.
- https://cdn.elifesciences.org/articles/74447/elife-74447-fig3-figsupp1-data2-v2.zip
Figure 4
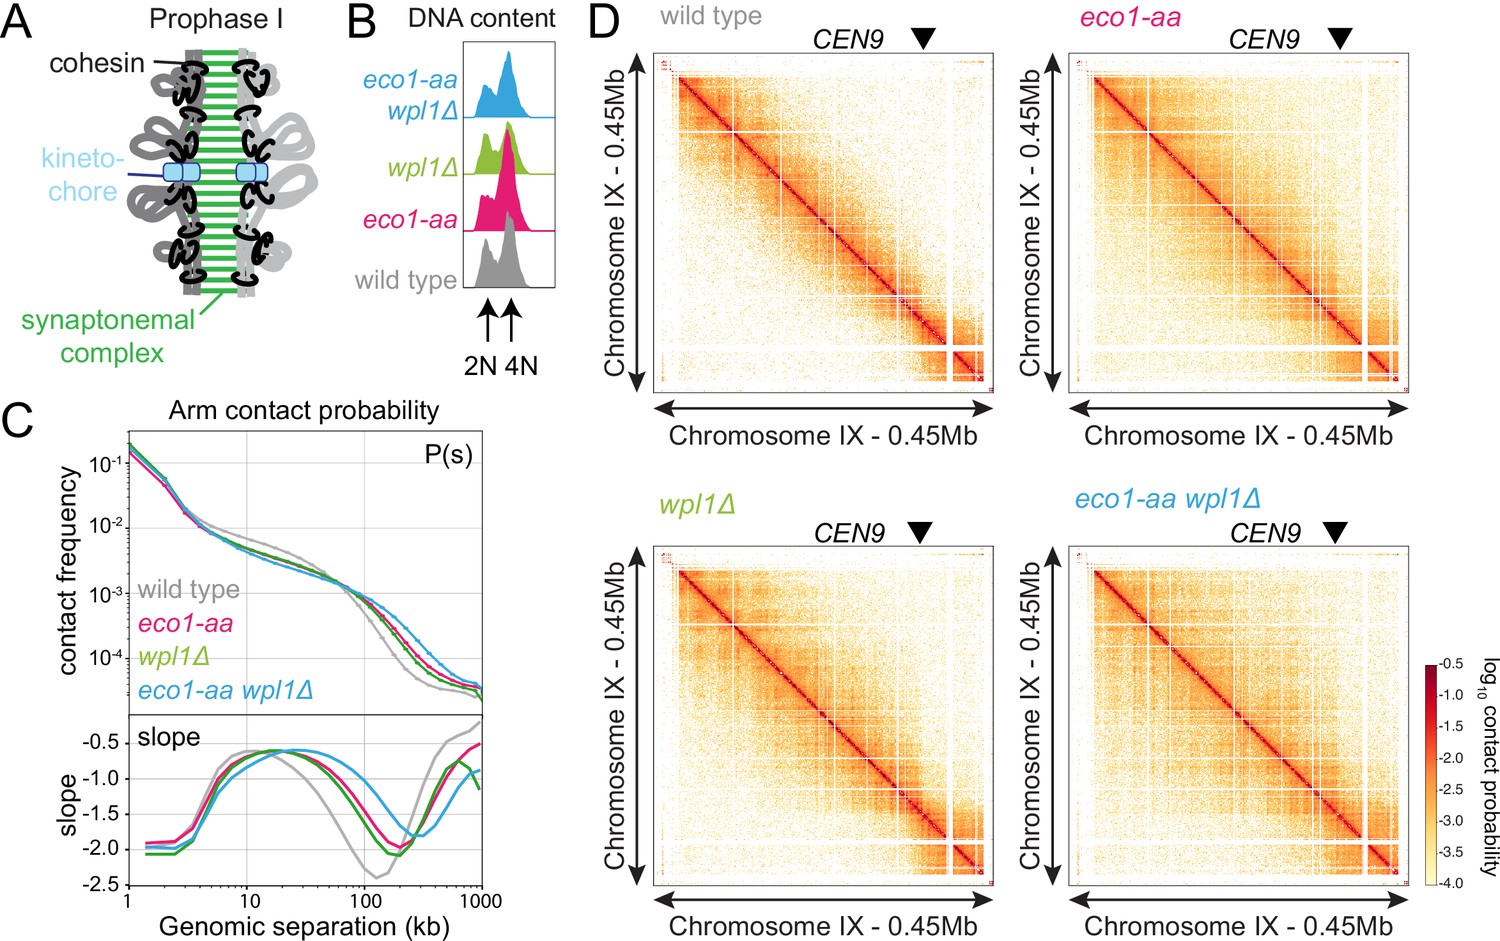
Eco1 restricts long-range chromatin interactions.
Hi-C analysis of chromosome conformation in meiotic prophase of wild-type (AM28719), eco1-aa (AM28720), wpl1Δ (AM29750), and eco1-aa wpl1Δ (AM29781) cells carrying ndt80Δ. Strains were harvested 6 hr after induction of sporulation. (A) Schematic representation of homologous chromosomes emanating from a proteinaceous axis and depicting intra- and inter-sister chromatid cohesin in meiotic prophase. (B) Flow cytometry confirms similar staging in all strains. (C) Contact probability versus genomic distance (P(s)) for the indicated strains, excluding contacts across centromeres (1 kb bin; log10 scale). The derivative of the P(s) curve (slope) plotted against genomic distance is shown below. (D) Contact maps (1 kb bin) show individual chromosome IX for the indicated genotypes. The arrowhead indicates the position of the centromere (CEN9).
Figure 5
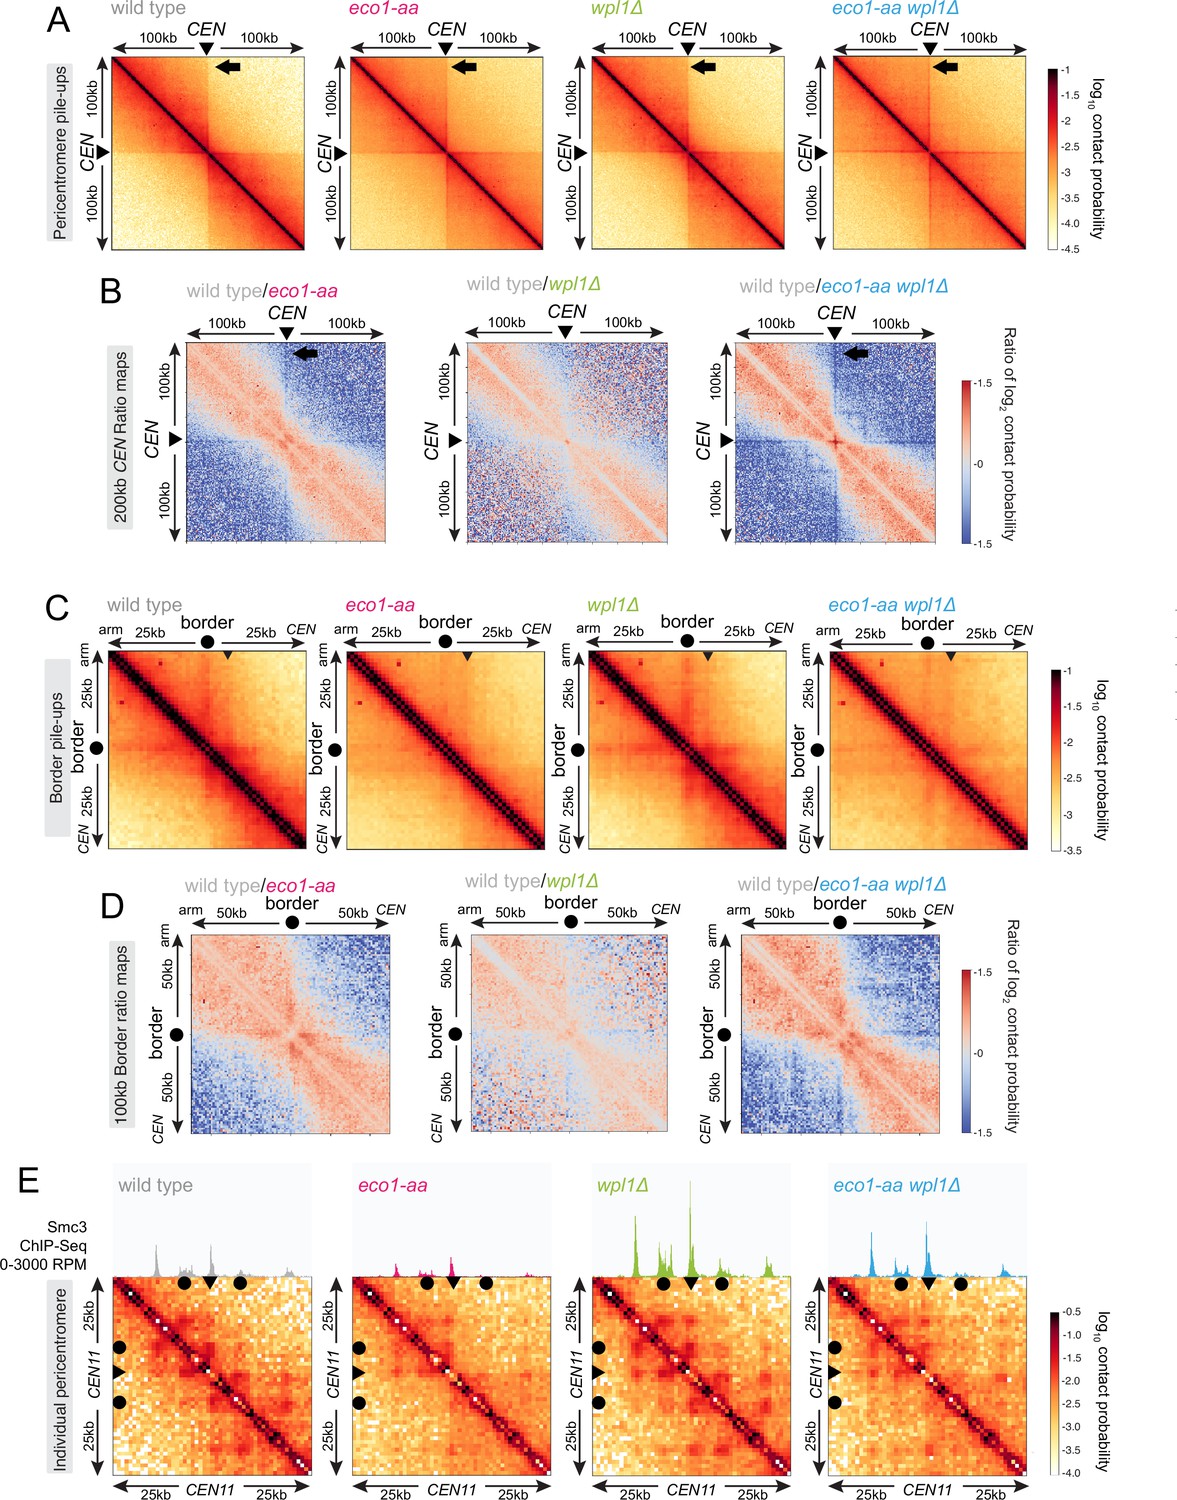
Eco1 establishes chromatin boundaries at pericentromere borders.
Hi-C analysis of pericentromeric chromatin conformation in meiotic prophase of wild-type (AM28719), eco1-aa (AM28720), wpl1Δ (AM29750), and eco1-aa wpl1Δ (AM29781) cells. (A) Pileups (1 kb bin) of cis contacts in the 200 kb surrounding all 16 centromeres (mirrored). The arrow marks aggregate contacts between the centromeres and the region ~100 kb away on the arm of the same chromosome. (B) Log2 ratio plots of centromere pileups for pairwise comparisons of eco1-aa, wpl1Δ, and eco1-aa wpl1Δ with the wild type for the 200 kb region flanking the centromeres. (C) Pileups (1 kb bin) of cis contacts in the 50 kb flanking all 32 borders. Pileups are oriented so that chromosomal arm and centromere flanks are at the upper left and lower right, respectively. Arrowhead indicates position of collated centromere-originating stripe. (D) Log2 ratio plots of border pileups for pairwise comparisons of eco1-aa, wpl1Δ, and eco1-aa wpl1Δ with the wild type for the 100 kb region flanking the borders. (E) Contact maps (1 kb bin) of the pericentromeric region of chromosome XI (50 kb flanking CEN11). Calibrated Smc3 ChIP-seq signal for the appropriate genotype (from Figure 3) is shown above. Arrowheads mark the position of centromeres, filled circles mark the borders.
Figure 6 with 1 supplement

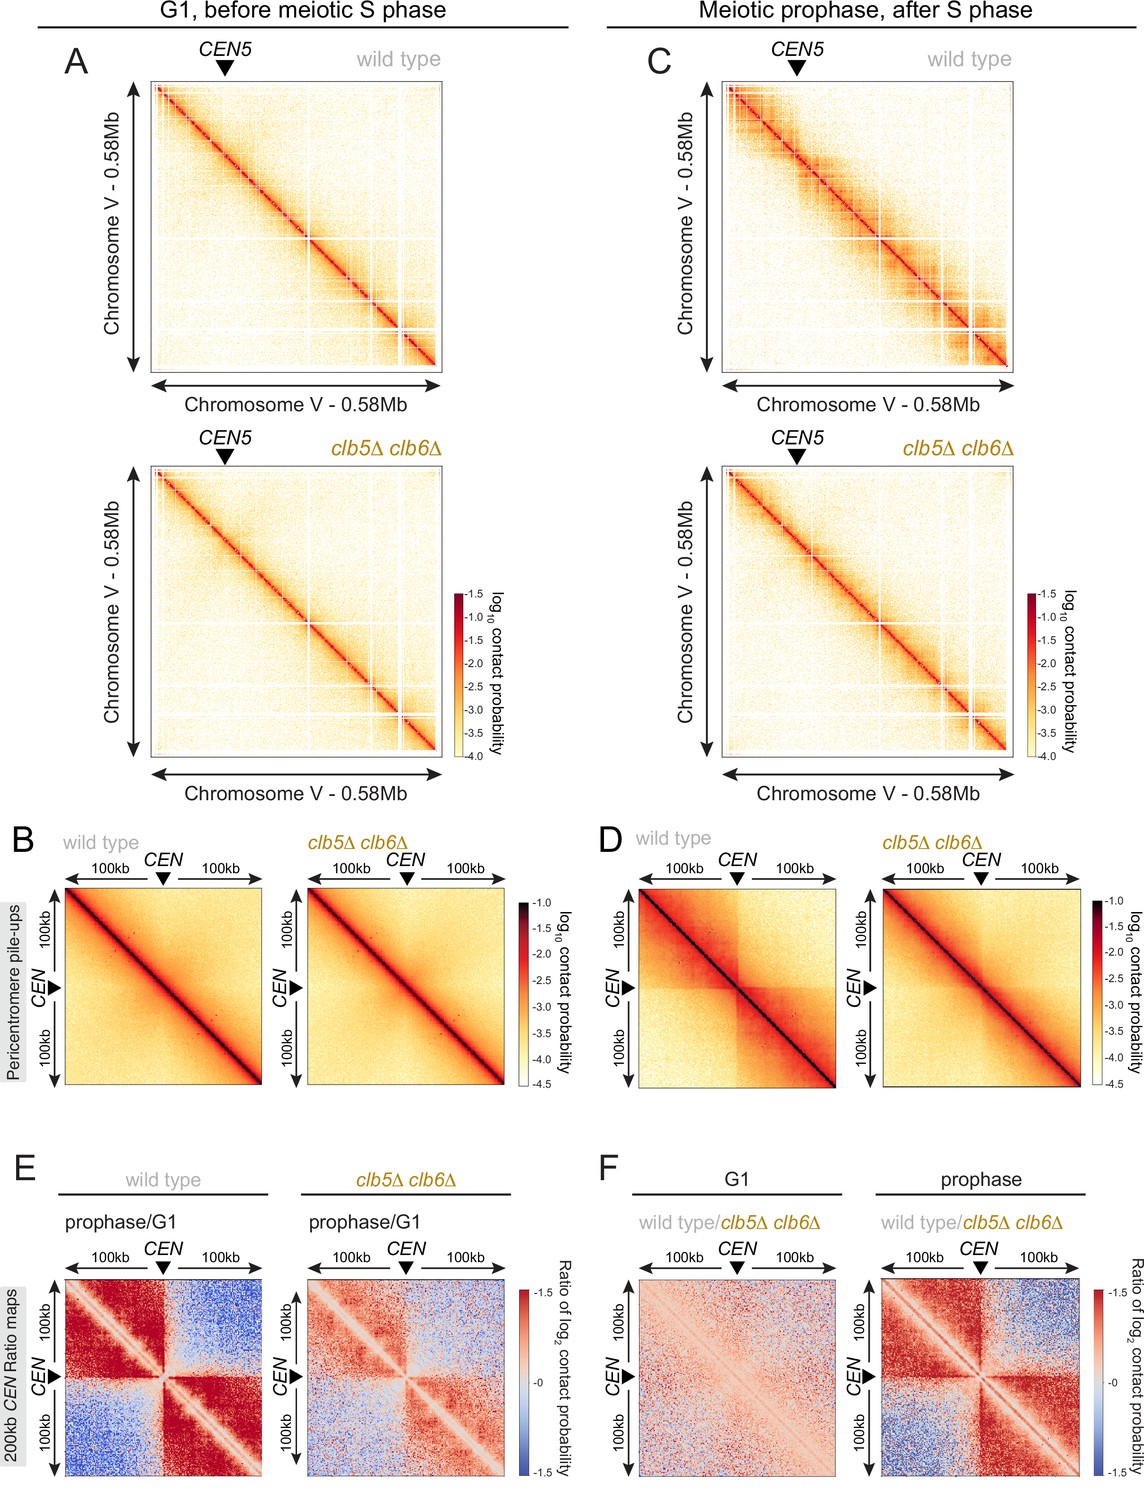
Boundaries are established at pericentromere borders independently of replication.
Hi-C analysis of chromosome conformation in meiotic G1 and prophase and its dependence on DNA replication. (A–D) Hi-C analysis of chromosome conformation in meiotic G1 (before S phase). Wild-type (AM12145) and clb5Δ clb6Δ (AM26046) cells carrying pCUP1-IME1 and pCUP1-IME4 were harvested 2 hr after induction of sporulation with no addition of CuSO4. (A) Flow cytometry profiles show that DNA remains unreplicated, confirming G1 arrest. (B) Contact probability versus genomic distance (P(s)), excluding contacts that occur across centromeres (1 kb bin; log10 scale). The derivative of the P(s) curve (slope) plotted against genomic distance is shown below. (C) Contact maps (1 kb bin) of the pericentromeric region of the representative chromosome IX (50 kb surrounding CEN9). The arrowhead indicates the position of the centromere (CEN9), circles the position of pericentromere borders. (D) Pileups (1 kb bin) of cis contacts in the 50 kb flanking all 32 borders. Pileups are oriented so that chromosomal arm and centromere flanks are at the upper left and lower right, respectively. (E–H) Hi-C analysis of chromosome conformation in meiotic prophase in the absence of DNA replication. Wild-type (AM11633) and clb5Δ clb6Δ (AM28841) cells carrying ndt80Δ were analyzed as described in Figure 4. (E) Flow cytometry profiles confirm that clb5Δ clb6Δ fail to undergo meiotic DNA replication. (F) Contact probability versus genomic distance (P(s)), excluding contacts that occur across centromeres (1 kb bin; log10 scale). The derivative of the P(s) curve (slope) plotted against genomic distance is shown below. (G) Contact maps (1 kb bin) of the pericentromeric region of the representative chromosome IX (50 kb surrounding CEN9). The arrowhead indicates the position of the centromere (CEN9), circles represent the pericentromere borders. (H) Pileups (1 kb bin) of cis contacts in the 50 kb flanking all 32 borders. Pileups are oriented so that chromosomal arm and centromere flanks are at the upper left and lower right, respectively. (I) Changes in chromatin conformation at pericentromere borders between meiotic G1 and prophase. Log2 ratio plots of border pileups in (D) and (H) for wild type and clb5Δ clb6Δ are shown. (J) Log2 ratio plots of border pileups in (D) and (H) provide a comparison of border strength in wild type and clb5Δ clb6Δ in meiotic G1 (left) and prophase (right).
Figure 6—figure supplement 1
S phase CDKs promote loop extrusion and centromere insulation.
Hi-C analysis of chromosome conformation of wild-type and clb5Δ clb6Δ cells in meiotic G1 (A, B) and prophase (C, D) as shown in Figure 6. (A, C) Contact maps (1 kb bin) show individual chromosome V for the indicated genotypes. The arrowhead indicates the position of the centromere (CEN5). (B, D) Pileups (1 kb bin) of cis contacts in the 200 kb surrounding all 16 centromeres (mirrored). (E) Changes in centromere-proximal chromatin conformation between meiotic G1 and prophase for wild-type and clb5Δ clb6Δ cells. Log2 ratio plots of centromere pileups for the 200 kb region flanking the centromeres. (F) Log2 ratio plots of centromere pileups in (B, D) to compare wildtype and clb5Δ clb6Δ in meiotic G1 (left) and prophase (right).
Figure 7 with 2 supplements
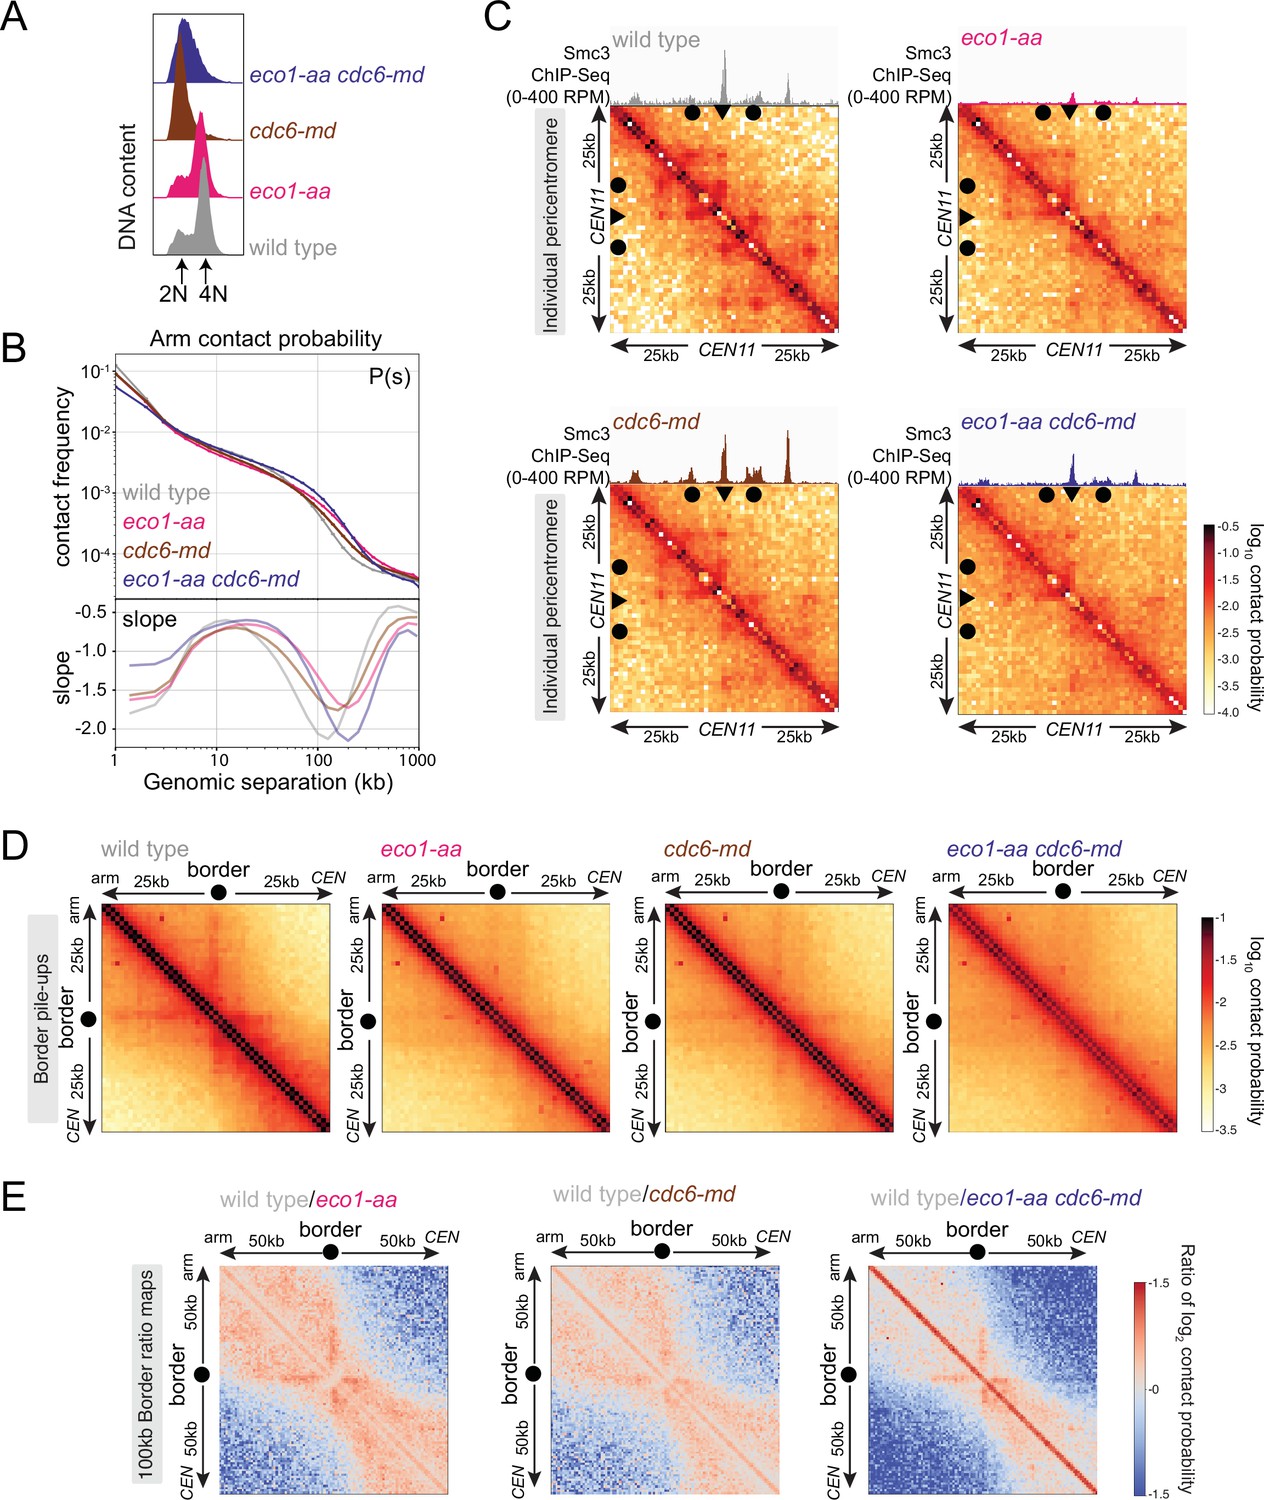
Eco1 establishes boundaries on unreplicated chromosomes.
Hi-C analysis of chromosome conformation in meiotic prophase in the absence of DNA replication and/or Eco1. Wild-type (AM28719), eco1-aa (AM28720), cdc6-md (AM31003), and eco1-aa cdc6-md (AM30991) cells carrying ndt80Δ were analyzed as described in Figure 4. (A) Flow cytometry profiles confirm that cdc6-md and eco1-aa cdc6-md cells fail to undergo meiotic DNA replication while wild type and eco1-aa arrest with 4N DNA content. (B) Contact probability versus genomic distance (P(s)), excluding contacts that occur across centromeres (1 kb bin; log10 scale). The derivative of the P(s) curve (slope) plotted against genomic distance is shown below. (C) Contact maps (1 kb bin) of the pericentromeric region of chromosome XI (50 kb flanking CEN11). Arrowheads mark the position of centromeres, filled circles mark the borders. (D) Pileups (1 kb bin) of cis contacts in the 50 kb surrounding all 32 borders. Pileups are oriented so that chromosomal arm and centromere flanks are at the upper left and lower right, respectively. (E) Log2 ratio plots of border pileups for pairwise comparisons of eco1-aa, cdc6-md, and eco1-aa cdc6-md with the wild type for the 100 kb region flanking the borders.
Figure 7—figure supplement 1
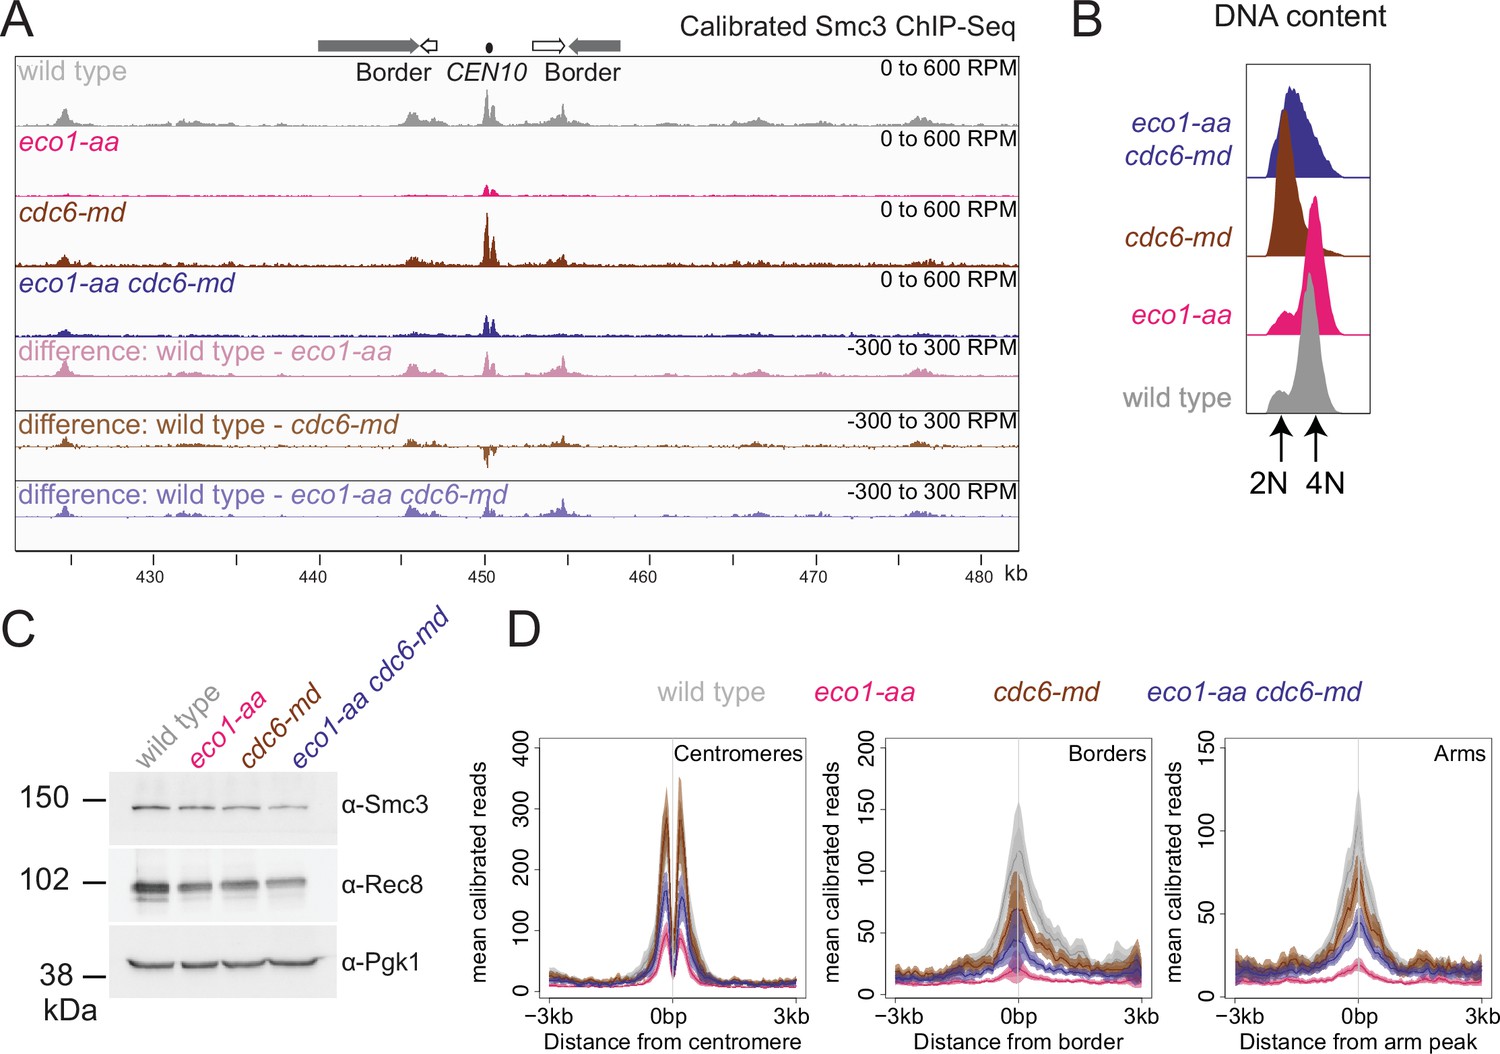
Cohesin distribution is altered in unreplicated cells.
Cohesin is reduced at borders and shows a more diffuse distribution in cdc6-md cells. Calibrated Smc3 ChIP-seq was performed in prophase I using the strains described in Figure 7. (A) Calibrated Smc3 ChIP-seq for the region surrounding CEN10. (B) Flow cytometry profiles show that cdc6-md and eco1-aa cdc6-md cells remain unreplicated and confirm post-replication arrest for wild-type and eco1-aa cells. (C) Western immunoblot with Pgk1 loading control (α-Pgk1) shows cellular levels of Smc3 (α-Smc3) and Rec8 (α-Rec8) at the time of harvesting. (D) Mean calibrated ChIP-seq reads (line), standard error (dark shading), and 95% confidence interval (light shading) at all 16 centromeres, 32 borders, or 32 arm sites.
-
Figure 7—figure supplement 1—source data 1
Source images for the blot in Figure 7—figure supplement 1C.
- https://cdn.elifesciences.org/articles/74447/elife-74447-fig7-figsupp1-data1-v2.zip
-
Figure 7—figure supplement 1—source data 2
Source images for the blot in Figure 7—figure supplement 1C.
- https://cdn.elifesciences.org/articles/74447/elife-74447-fig7-figsupp1-data2-v2.zip
-
Figure 7—figure supplement 1—source data 3
Source images for the blot in Figure 7—figure supplement 1C.
- https://cdn.elifesciences.org/articles/74447/elife-74447-fig7-figsupp1-data3-v2.zip
Figure 7—figure supplement 2
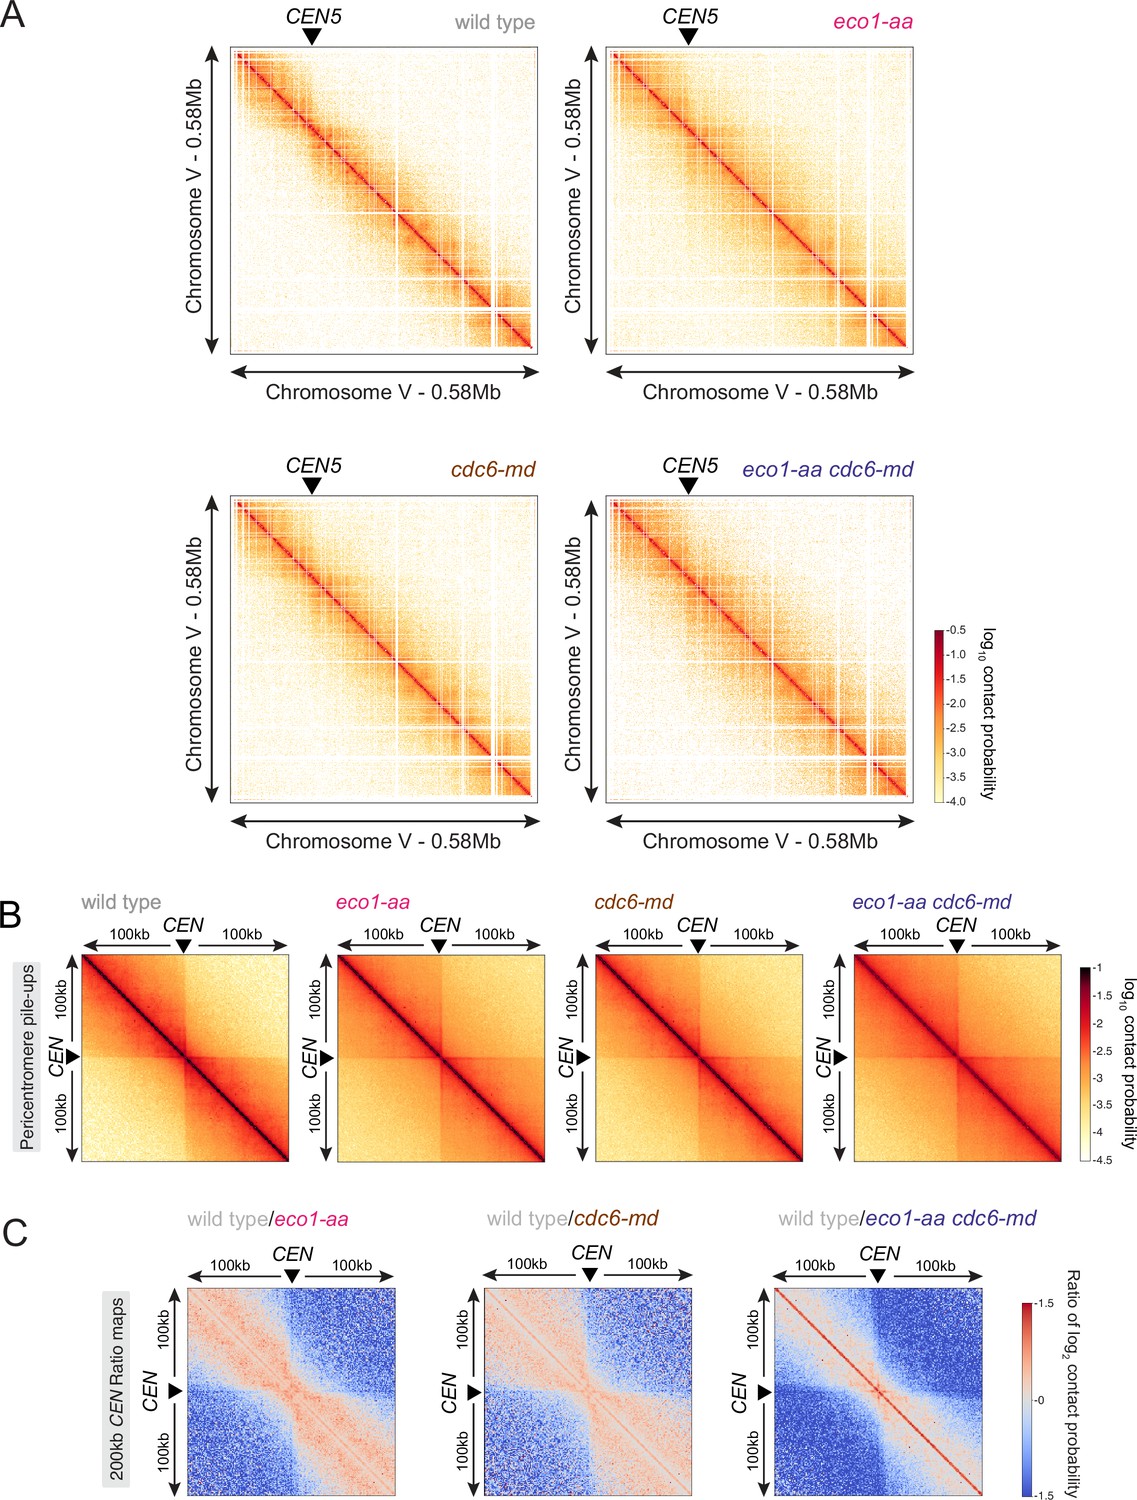
Eco1 and replication have an additive effect on restricting chromatin long-distance interactions.
(A) Contact maps (1 kb bin) of representative chromosome V in prophase I for the Hi-C shown in Figure 7. The arrowhead indicates the position of the centromere (CEN5). (B) Pileups (1 kb bin) of cis contacts in the 200 kb surrounding all 16 centromeres (mirrored). (C) Log2 ratio plots of centromere pileups showing pairwise comparisons of each of eco1-aa, cdc6-md, and eco1-aa cdc6-md with the wild type for the 200 kb region surrounding the centromeres.
Figure 8 with 2 supplements
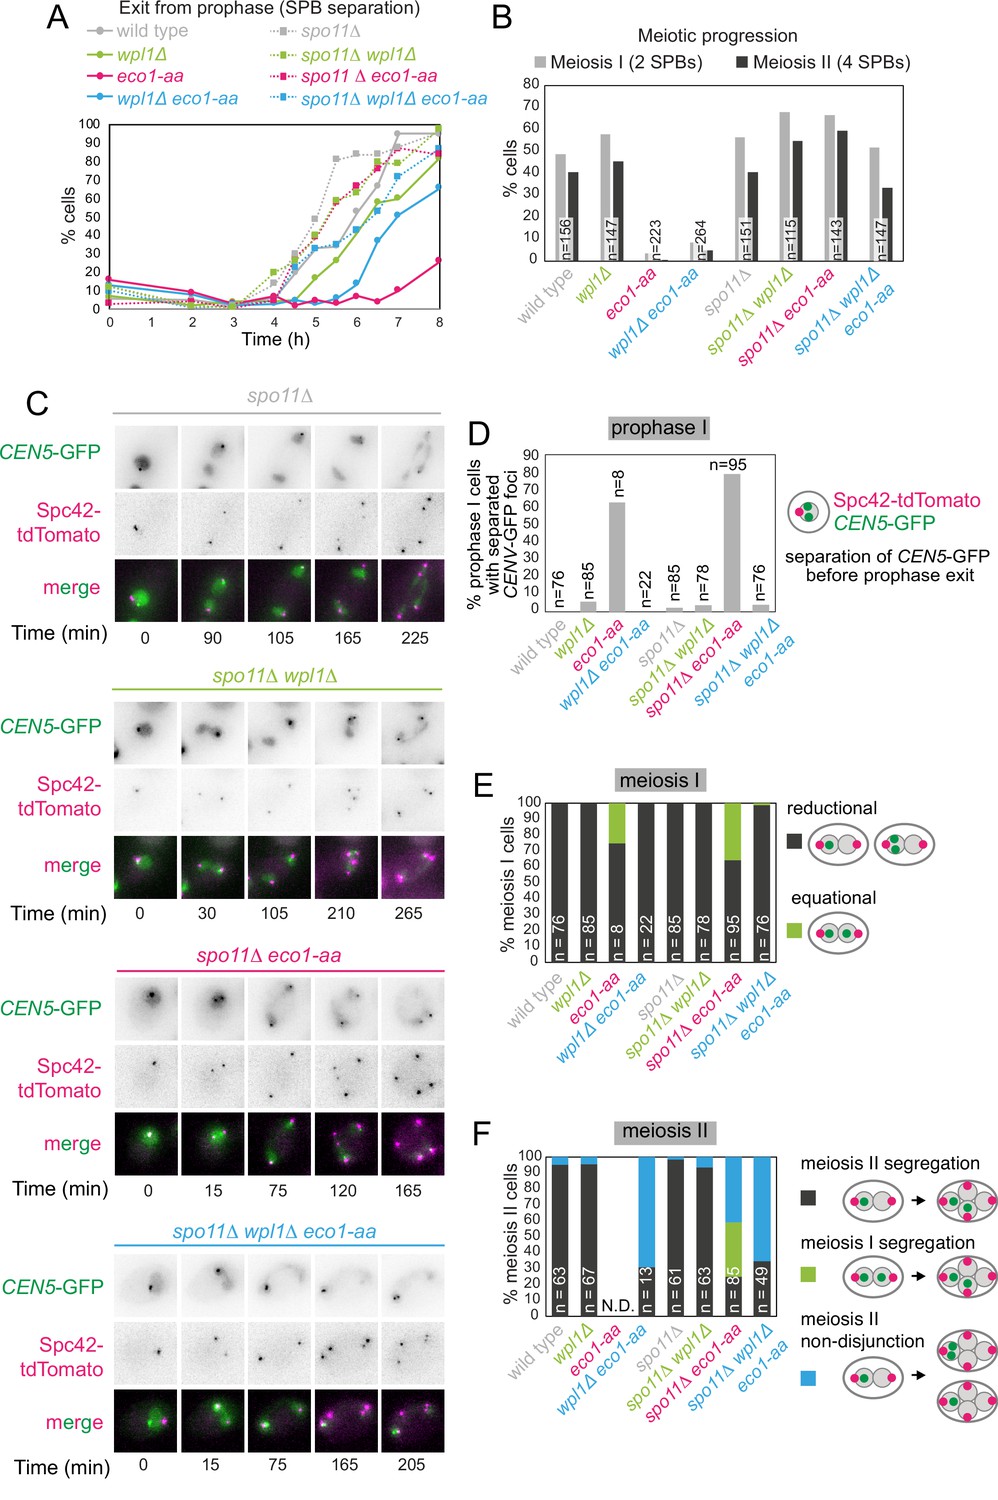
Critical Wpl1-dependent and independent roles of Eco1 in chromosome segregation during both meiosis I and II.
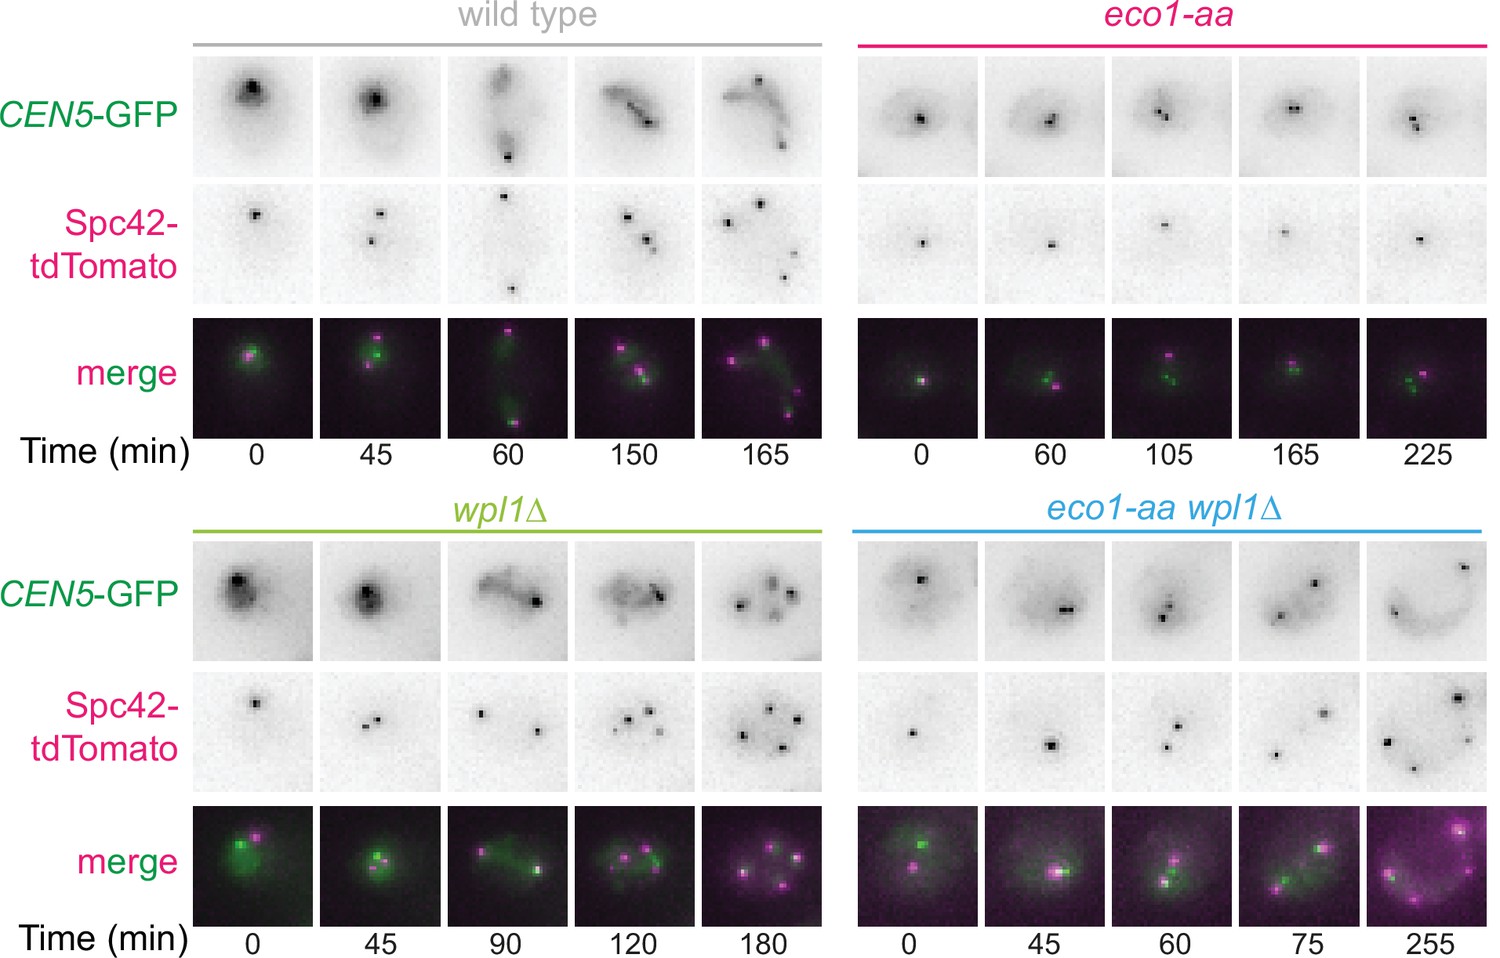
(A) Meiotic double-strand break formation arrests eco1-aa cells in meiotic prophase. Wild-type (AM24167), wpl1Δ (AM24168), eco1-aa (AM24184), eco1-aa wpl1Δ (AM24169), spo11Δ (AM27670) spo11Δ wpl1Δ (AM27673), spo11Δ eco1-aa (AM27672), and spo11Δ eco1-aa wpl1Δ (AM27671) anchor-away strains carrying heterozygous SPC42-tdTOMATO and CENV-GFP were induced to sporulate. The percentage of cells with more than one Spc42-tdTomato focus was determined from cell populations fixed at the indicated timepoints after resuspension in SPO medium containing rapamycin. At least 100 cells were scored per timepoint. (B–F) Live-cell imaging of strains as in (A) sporulated in the presence of rapamycin. Every cell that had one Spc42-tdTomato focus at the start of the movie was scored for the duration of the movie. A small number of mitotic/dead cells (<1% for each strain) were excluded from the analysis. (B) Deletion of SPO11 restores meiotic progression to eco1-aa cells. The percentage of cells that displayed two (meiosis I) or four (meiosis II) Spc42-tdTomato foci for each strain is shown. (C) Representative images of spo11Δ background cells undergoing the meiotic divisions. (D) Percentage of cells with one Spc42-tdTomato focus (prophase I) where two GFP foci were visible. Only cells that progressed to anaphase I were scored in this analysis. (E) Eco1 counteracts Wpl1 to allow the establishment of sister kinetochore mono-orientation. Segregation of CEN5-GFP foci to the same (reductional; dark gray) or opposite (equational; green) poles was scored in meiosis I (as two Spc42-tdTomato foci separate; binucleate cells). (F) Eco1 is required for pericentromeric cohesion, even in the absence of Wpl1. Segregation of CEN5-GFP foci to opposite (dark gray) or the same pole(s) (blue) was scored in meiosis II (as four Spc42-tdTomato foci separate; tetranucleate cells). Cells that had already segregated their sister CEN5-GFPs in meiosis I (GFP foci in two nuclei at the binucleate stage) were scored as a separate category (green).
Figure 8—figure supplement 1
Sister kinetochore mono-orientation and pericentromeric cohesion defects in eco1-aa cells are not a consequence of SPO11 deletion.
Representative images of wild-type (AM24167), wpl1Δ (AM24168), eco1-aa (AM24184), and eco1-aa wpl1Δ (AM24169) anchor-away cells carrying heterozygous CEN5-GFP and SPC42-tdTomato. Cells were imaged in the presence of rapamycin together with spo11Δ background strains in the experiment shown in Figure 8B–F.
Figure 8—figure supplement 2
Sister kinetochore mono-orientation and pericentromeric cohesion defects in eco1-aa cells are not caused by mislocalization of cohesin protector proteins Spo13 or Sgo1.
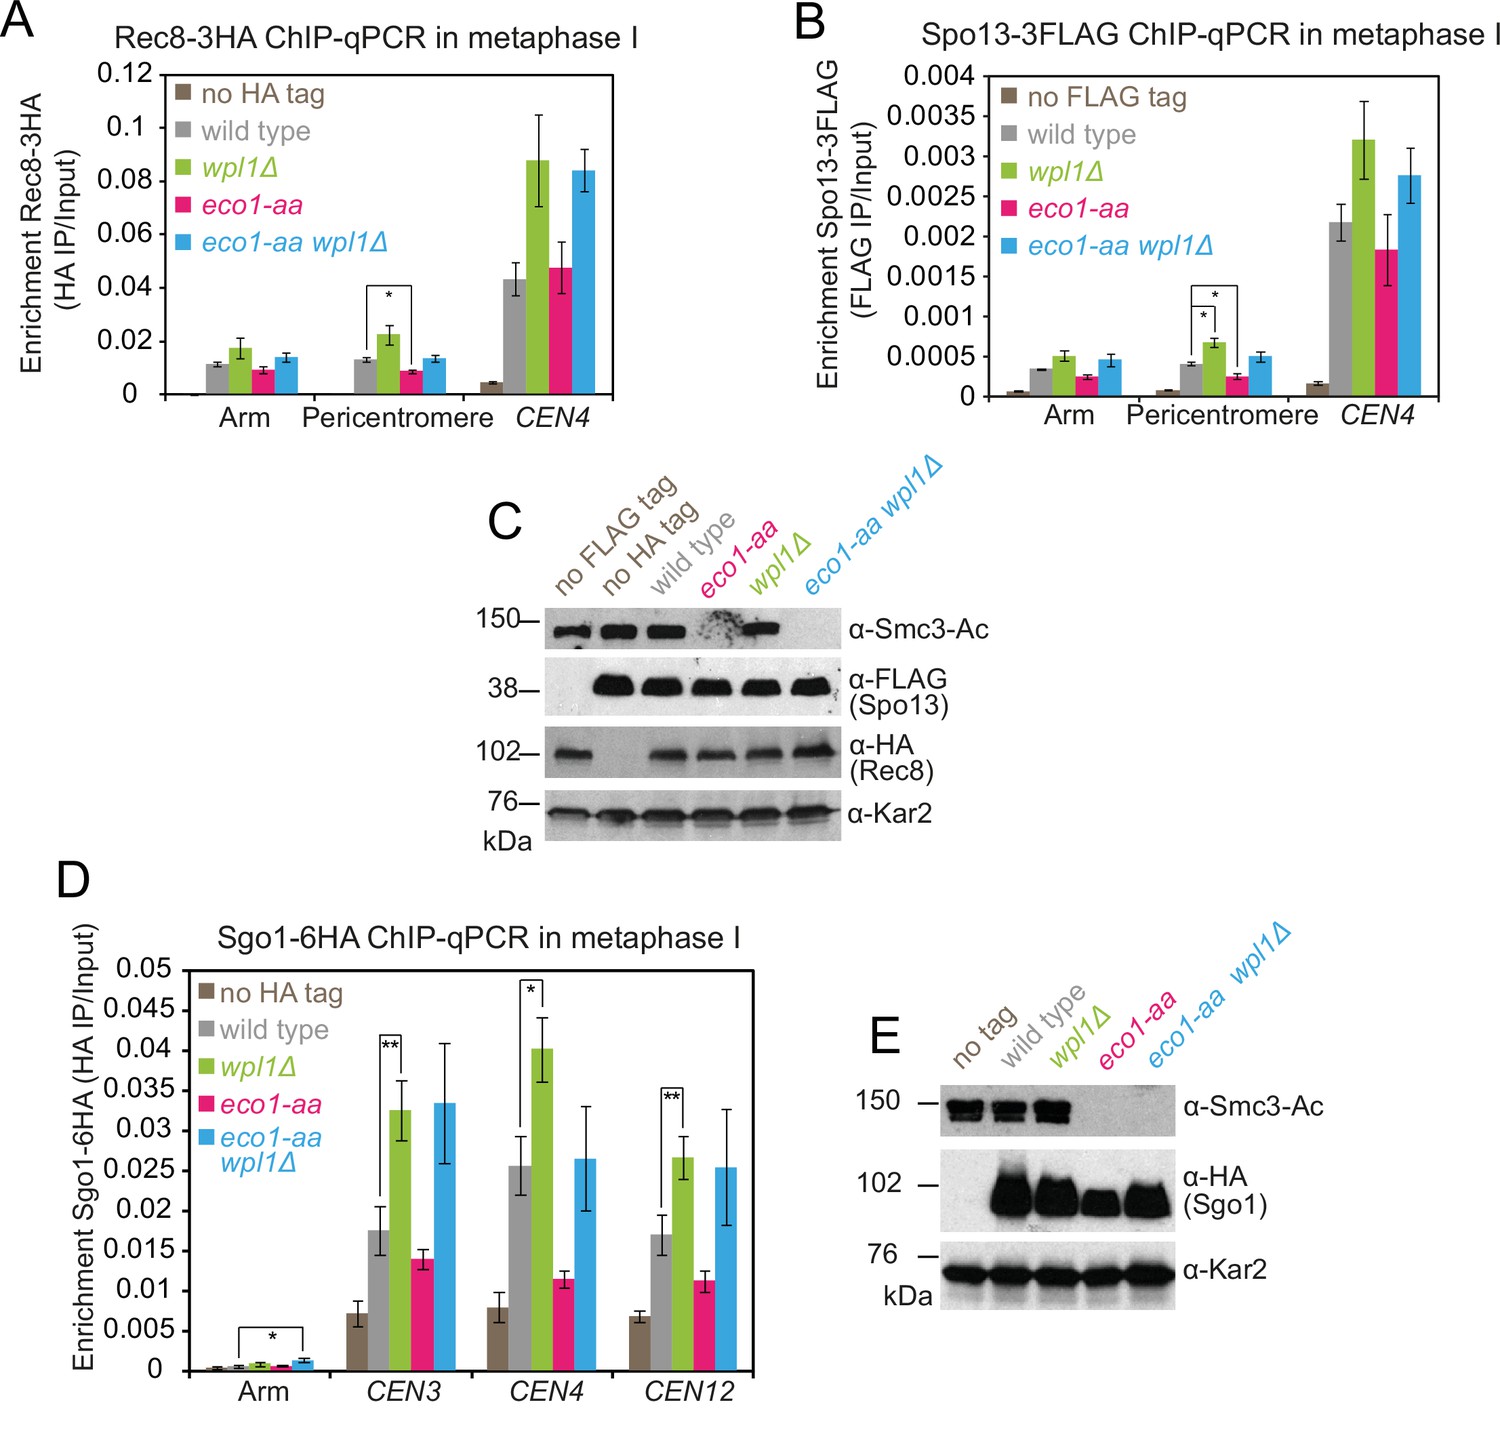
(A–C) Cohesin protector Spo13 localization follows the profile of Rec8 in metaphase I eco1-aa and wpl1Δ single and double mutant cells. Diploid strains wpl1Δ (AM24263), eco1-aa (AM24262), and wpl1Δ eco1-aa (AM24261) carrying RPL13A-FKBP12, fpr1Δ, tor1-1, pCLB2-CDC20, REC8-3HA, and SPO13-3FLAG and wild-type anchor-away diploid strains carrying either REC8-3HA (AM24236) or SPO13-3FLAG (AM24235) were induced to sporulate in 1 μM rapamycin and harvested after 6 hr. (A, B) Chromatin-bound Rec8 and Spo13 are increased in wpl1Δ and eco1-aa wpl1Δ mutants. Mean α-HA (A; Rec8-3HA) or α-FLAG (B, Spo13-3FLAG) ChIP-qPCR for the indicated sites is shown from four repeats with error bars representing standard error. *p<0.05, paired Student’s t-test. (C) Western immunoblot using α-Smc3-K112,113-Ac, α-FLAG, α-HA, and α-Kar2 (loading control) confirming similar total levels of Rec8 and Spo13 in the expected strains. (D, E) Failure to localize pericentromeric Sgo1 cannot explain the segregation defect of wpl1Δ eco1-aa cells. Wild-type (AM24054), wpl1Δ (AM25103), eco1-aa (AM25104), and eco1-aa wpl1Δ (AM25102) strains carrying RPL13A-FKBP12, fpr1Δ, tor1-1, pCLB2-CDC20, SGO1-6HA, as well as a no tag strain (AM23700) without SGO1-6HA, were induced to sporulate in 1 μM rapamycin and harvested after 6 hr (metaphase I). (D) Mean α-HA ChIP-qPCR (Sgo1-6HA) is shown for four replicates at the indicated sites with error bars showing standard error. **p<0.01, *p<0.05, paired Student’s t-test. (E) Western immunoblot probed with α-Smc3-K112,113-Ac, α-HA (Sgo1-6HA), and α-Kar2 (loading control). Note that Sgo1 migration was reproducibly increased in eco1-aa cells, which is likely a result of reduced phosphorylation caused by impaired progression into metaphase I.
-
Figure 8—figure supplement 2—source data 1
Source images for the blot in Figure 8—figure supplement 2C.
- https://cdn.elifesciences.org/articles/74447/elife-74447-fig8-figsupp2-data1-v2.zip
-
Figure 8—figure supplement 2—source data 2
Source images for the blot in Figure 8—figure supplement 2C.
- https://cdn.elifesciences.org/articles/74447/elife-74447-fig8-figsupp2-data2-v2.zip
-
Figure 8—figure supplement 2—source data 3
Source images for the blot in Figure 8—figure supplement 2C.
- https://cdn.elifesciences.org/articles/74447/elife-74447-fig8-figsupp2-data3-v2.zip
-
Figure 8—figure supplement 2—source data 4
Source images for the blot in Figure 8—figure supplement 2C.
- https://cdn.elifesciences.org/articles/74447/elife-74447-fig8-figsupp2-data4-v2.zip
-
Figure 8—figure supplement 2—source data 5
Source images for the blot in Figure 8—figure supplement 2E.
- https://cdn.elifesciences.org/articles/74447/elife-74447-fig8-figsupp2-data5-v2.zip
-
Figure 8—figure supplement 2—source data 6
Source images for the blot in Figure 8—figure supplement 2E.
- https://cdn.elifesciences.org/articles/74447/elife-74447-fig8-figsupp2-data6-v2.zip
-
Figure 8—figure supplement 2—source data 7
Source images for the blot in Figure 8—figure supplement 2E.
- https://cdn.elifesciences.org/articles/74447/elife-74447-fig8-figsupp2-data7-v2.zip
Figure 9 with 3 supplements

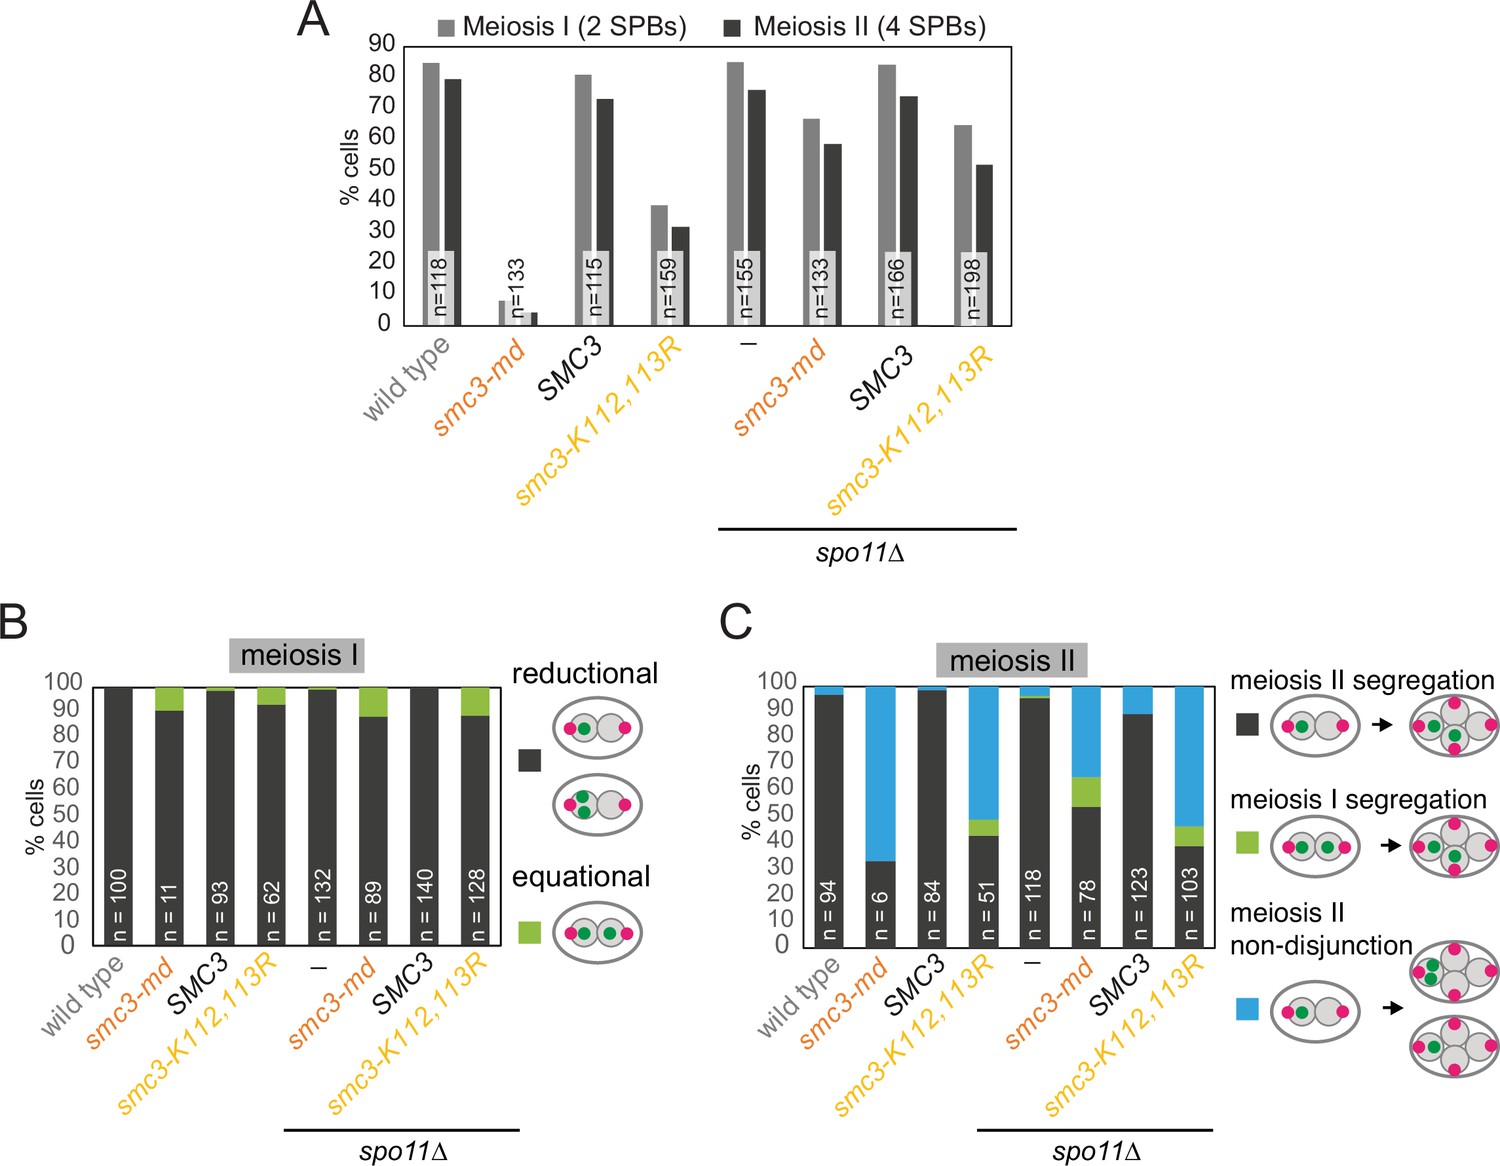
Smc3 acetylation is essential for meiosis.
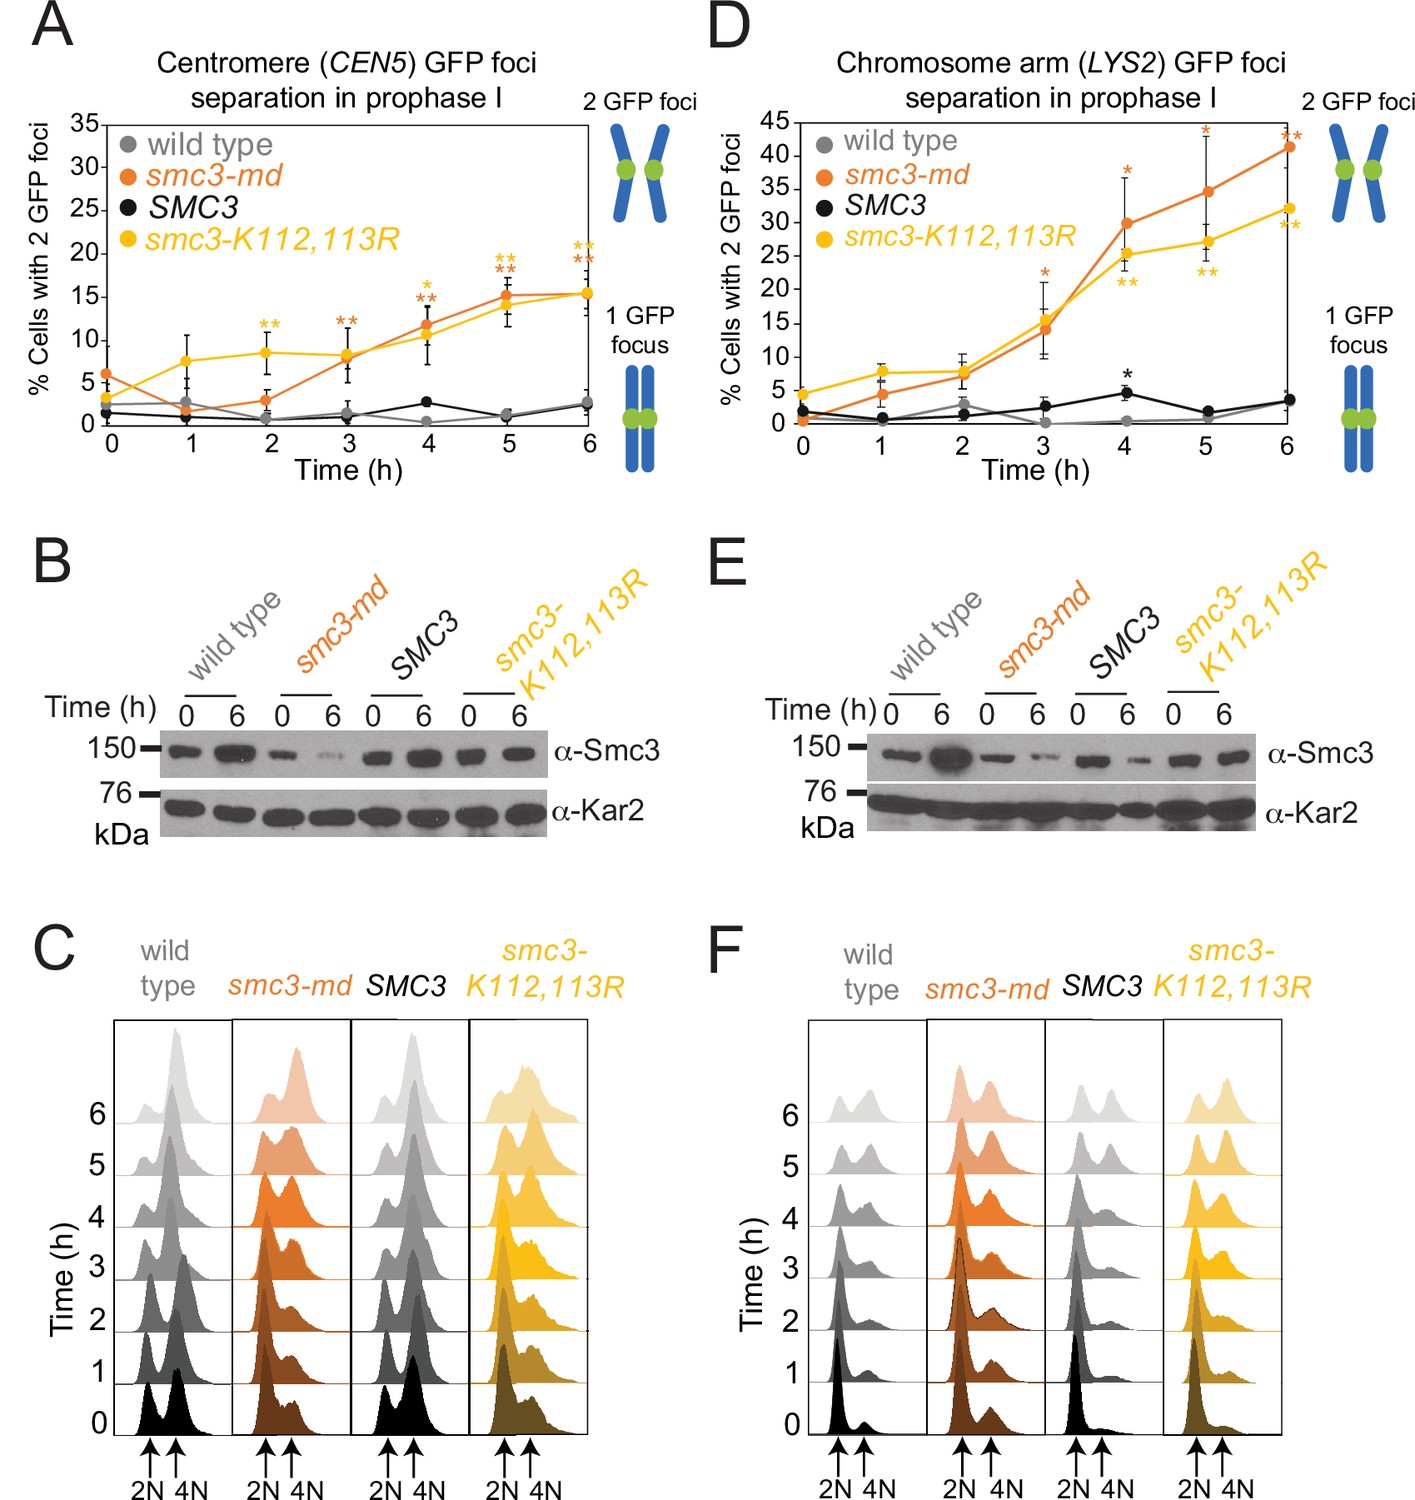
(A–D) smc3-K112,113R leads to a global reduction in chromosomal Smc3 levels, which is only partially restored by WPL1 deletion. SMC3 (AM29315), smc3-K112,113R (AM29316), SMC3 wpl1Δ (AM30310), and smc3-K112,113R wpl1Δ (AM30311) strains carrying ndt80Δ were harvested 6 hr after induction of sporulation. (A) Flow cytometry profiles show similar DNA content at harvesting in all cultures. (B) Western immunoblot with Kar2 loading control (α-Kar2) shows comparable Smc3 (α-Smc3) and Rec8 (α-Rec8) levels in all cultures at the time of harvesting. (C) Calibrated Smc3 ChIP-seq for a representative region surrounding CEN10. (D) Mean calibrated ChIP-seq reads (line), standard error (dark shading), and 95% confidence interval (light shading) at all 16 centromeres, 32 borders, and 32 flanking arm sites. (E–G) Smc3-Ac is required to ensure co-segregation of sister chromatids in meiosis I and accurate meiosis II chromosome segregation. Meiotic progression (E) and meiosis I (F) and II (G) chromosome segregation were scored after live-cell imaging as in Figure 6 (B–E). Strains used were spo11Δ (AM30238), spo11Δ smc3-md (AM30240), spo11Δ SMC3 (AM30242), spo11 smc3-K112,113R (AM30244), spo11Δ wpl1Δ (AM30234), spo11Δ wpl1Δ smc3-md (AM30235), spo11Δ wpl1Δ SMC3 (AM30655), and spo11Δ wpl1Δ smc3-K112,113R (AM30237).
-
Figure 9—source data 1
Source images for the blot in Figure 9B.
- https://cdn.elifesciences.org/articles/74447/elife-74447-fig9-data1-v2.zip
-
Figure 9—source data 2
Source images for the blot in Figure 9B.
- https://cdn.elifesciences.org/articles/74447/elife-74447-fig9-data2-v2.zip
-
Figure 9—source data 3
Source images for the blot in Figure 9B.
- https://cdn.elifesciences.org/articles/74447/elife-74447-fig9-data3-v2.zip
Figure 9—figure supplement 1
A system to express Smc3-K112,113R in meiosis.
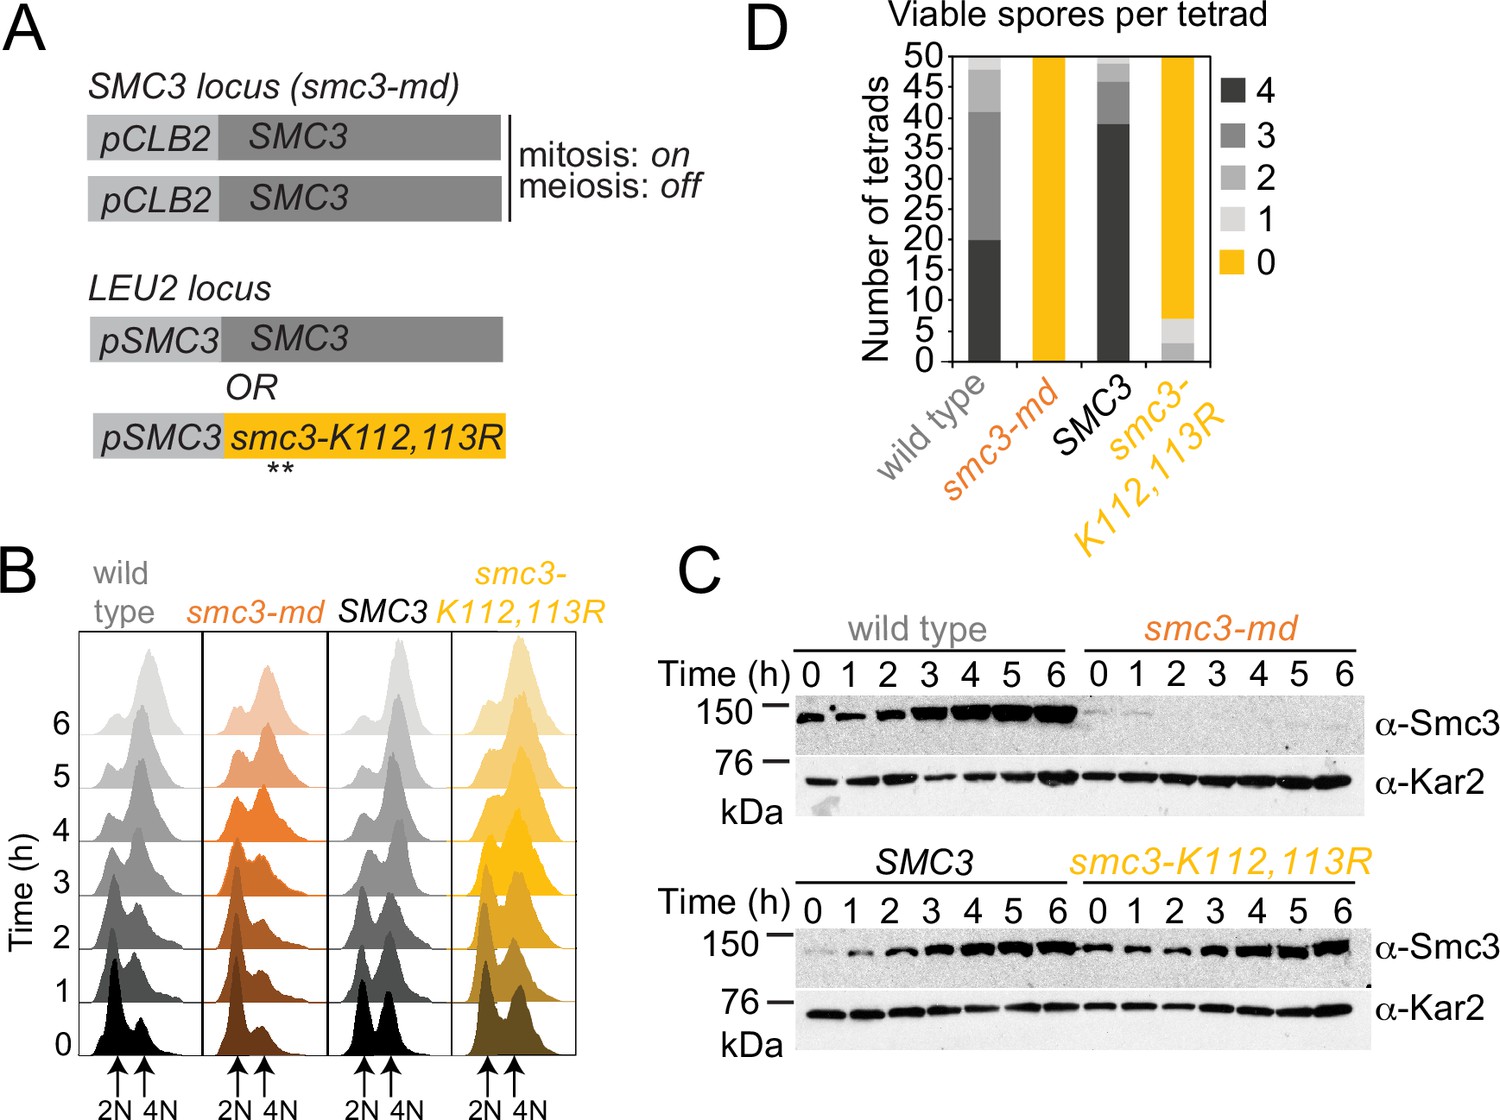
Ectopic expression of SMC3 and SMC3-K112,113R in meiosis. (A) Strategy to express non-acetylatable Smc3-K112,113R as the only Smc3 source in meiosis. In all diploid strains, both copies of endogenous SMC3 are placed under control of the CLB2 promoter, which is repressed in meiosis. Either wild-type SMC3 or smc3-K112,113R under the endogenous promoter are integrated at an ectopic locus of one parent (heterozygous). (B, C) Smc3-K112,113R is expressed but residual Smc3 persists from the smc3-md construct after meiotic induction. Wildtype (AM11633), smc3-md (AM28718), SMC3 (AM29315), and smc3-K112,113R (AM29316) carrying ndt80Δ were induced to sporulate. (B) Flow cytometry confirms DNA replication and prophase arrest. (C) Western immunoblot shows Smc3 (α-Smc3) and Kar2 (α-Kar2, loading control) levels at the indicated times after inducing sporulation. (D) Smc3 acetylation is required for meiosis. Spore viability of wild-type (AM25765), smc3-md (AM25067), SMC3 (AM25920), and smc3-K112,113R (AM28741) cells.
-
Figure 9—figure supplement 1—source data 1
Source images for the blot in Figure 9C.
- https://cdn.elifesciences.org/articles/74447/elife-74447-fig9-figsupp1-data1-v2.zip
-
Figure 9—figure supplement 1—source data 2
Source images for the blot in Figure 9C.
- https://cdn.elifesciences.org/articles/74447/elife-74447-fig9-figsupp1-data2-v2.zip
Figure 9—figure supplement 2
Establishment of meiotic cohesion requires Smc3 acetylation.
Cells carrying ndt80Δ and heterozygous CEN5-GFP (A–C) or LYS2-GFP (D–F) were induced to sporulate. The mean percentage of cells with two visible CEN5-GFP (A) or LYS2-GFP (D) foci were scored at the indicated timepoints in four (A) or three (D) biological replicates (100 cells per timepoint). Bars show standard error. *p<0.05; **p<0.005, paired t-test. Western immunoblots (B, E) show Smc3 (α-Smc3) and loading control (α-Kar2) levels at the indicated timepoints for a representative experiment. (C, F) Flow cytometry shows DNA content at the indicated timepoints for a representative experiment. Strains used in (A–C) were wild-type (AM29184), smc3-md (AM29185), SMC3 (AM29186), or smc3-K112,113R (AM29187). Strains used in (D–F) were wild-type (AM29247), smc3-md (AM29248), SMC3 (AM29249), or smc3-K112,113R (AM29250).
-
Figure 9—figure supplement 2—source data 1
Source images for the blot in Figure 9B and E.
- https://cdn.elifesciences.org/articles/74447/elife-74447-fig9-figsupp2-data1-v2.zip
-
Figure 9—figure supplement 2—source data 2
Source images for the blot in Figure 9B and E.
- https://cdn.elifesciences.org/articles/74447/elife-74447-fig9-figsupp2-data2-v2.zip
Figure 9—figure supplement 3
Prevention of meiotic recombination allows smc3-K112,113R cells to efficiently exit prophase.
Live-cell imaging of smc3-K112,113R cells demonstrates that defective meiosis I sister chromatid mono-orientation and meiosis II sister chromatid non-disjunction occur also in recombination-proficient cells that overcome the prophase delay, and that deletion of SPO11 allows cells to overcome this delay. Cells of the indicated genotypes were grown and analyzed as described in Figure 9B–E. (A) Meiotic progression was scored based on the number of Spc42-tdTomato foci. (B) Meiosis I chromosome segregation (heterozygous CENV-GFP) was scored in cells with two separated Spc42-tdTomato foci. (C) Meiosis II chromosome segregation (heterozygous CENV-GFP) was scored in cells with four separated Spc42-tdTomato foci. Strains used were AM29317 (wild type), AM29318 (smc3-md) AM29319 (SMC3), AM29320 (smc3-K112,113R), AM30238 (spo11Δ), AM30240 (spo11Δ smc3-md), AM30242 (spo11Δ SMC3), and AM30244 (spo11Δ smc3-K112,113R).
Figure 10
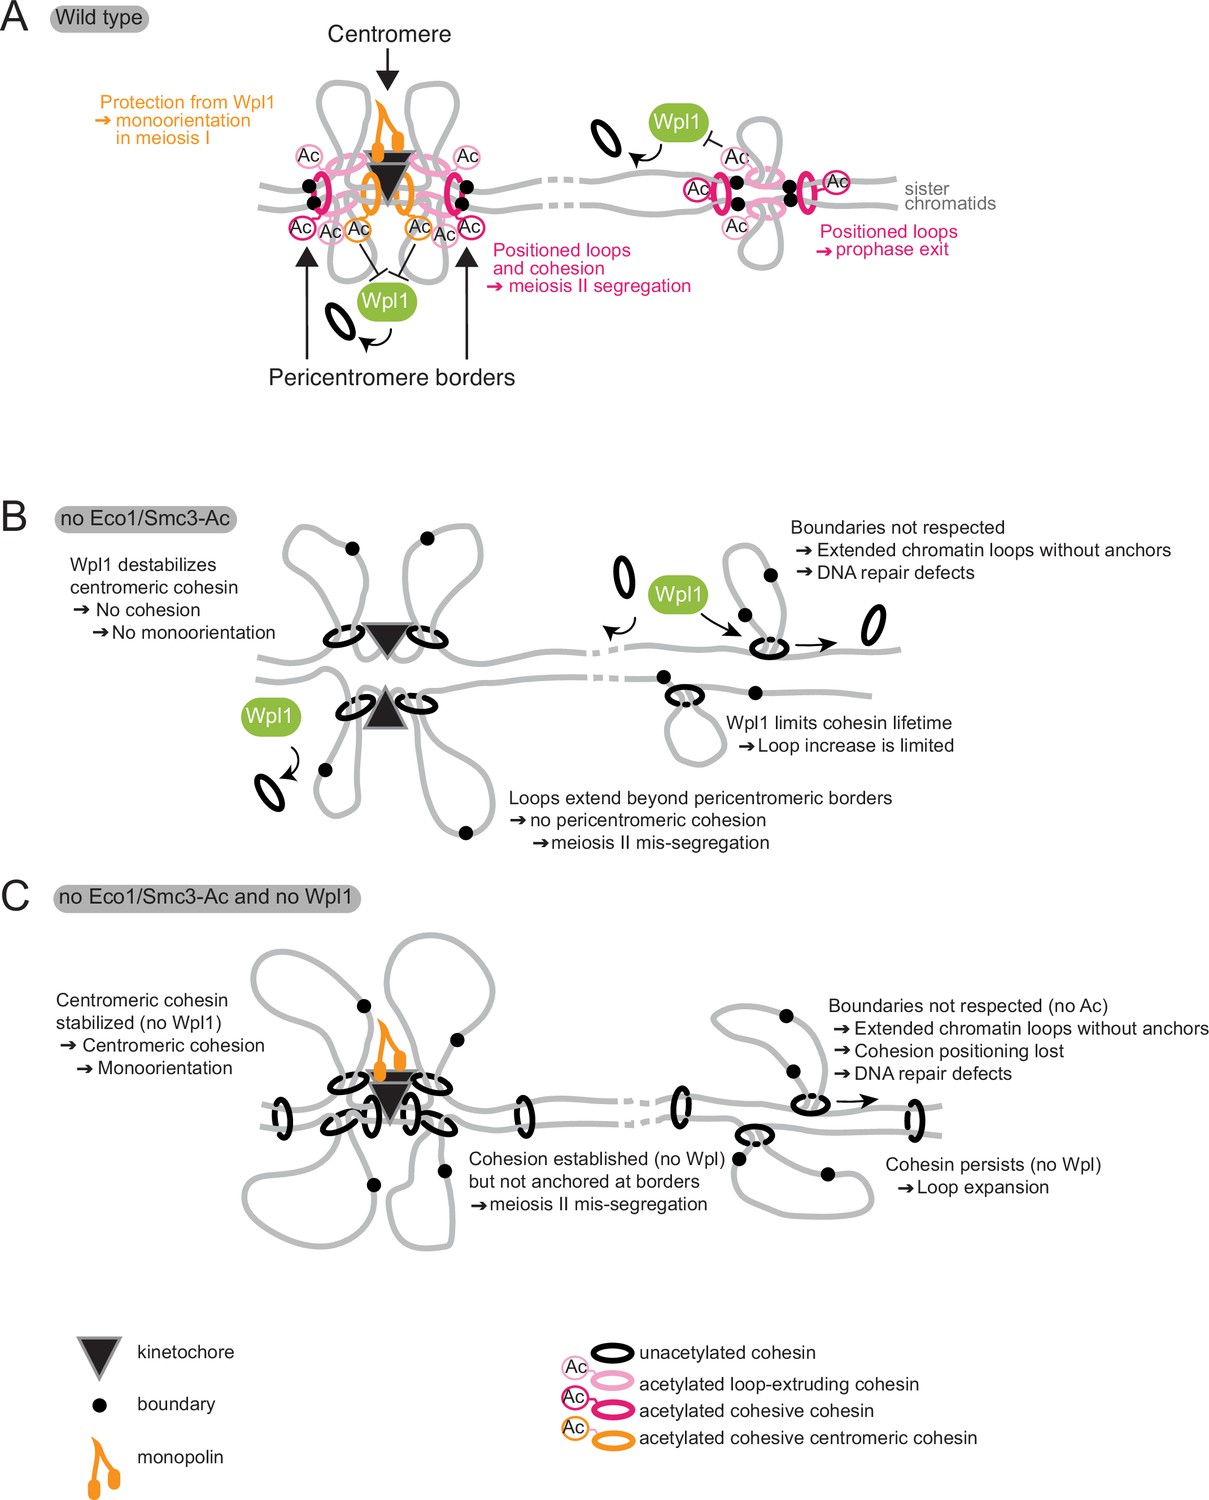
Model for Eco1 and Wpl1 roles in meiosis.
(A) In wild-type cells (top panel), Eco1 cohesin acetylation is essential in three meiotic processes: it protects centromeric cohesin from Wpl1-mediated release, allowing sufficient cohesion to be built to establish mono-orientation; it positions DNA loops along chromosome arms to promote recombination and prophase exit; and it positions loops and cohesion at pericentromeric borders to guide correct sister chromatid segregation in meiosis II. (B) In the absence of Eco1 or Smc3-Ac, boundaries are not respected and more cohesin complexes are released from DNA due to the action of Wpl1, with detrimental effects on recombination and meiosis I and II segregation. (C) In the absence of both Eco1 or Smc3-Ac and Wpl1, cohesion is partially restored, specifically at the centromere, but loop boundaries are not, leading to the formation of long unpositioned loops that are not able to support prophase recombination and meiosis II segregation.
Tables
Key resources table
| Reagent type (species) or resource | Designation | Source or reference | Identifiers | Additional information |
|---|---|---|---|---|
| Strain, strain background (Saccharomyces cerevisiae) | NCBITaxon: 4932 | This paper | Yeast strains; RRID:SCR_003093 | Supplementary file 1 |
| Strain, strain background (Schizosaccharomyces pombe) | NCBITaxon:4896 | This paper | Yeast strains; RRID:SCR_010536 | Supplementary file 1 |
| Antibody | Anti-HA 12CA5 (mouse monoclonal) | Roche | Cat# 11666606001; RRID:AB_514506 | WB (1:1000), ChIP |
| Antibody | Anti-HA 11 (mouse monoclonal) | BioLegend | Cat# MMS-101R; RRID:AB_291262 | WB (1:1000) |
| Antibody | Anti-FLAG M2 (mouse monoclonal) | Sigma | Cat# F1804; RRID:AB_262044 | WB (1:1000), ChIP |
| Antibody | Anti-Pgk1 (rabbit polyclonal) | Marston lab stock | n/a | WB (1:10,000) |
| Antibody | Anti-Kar2 (rabbit polyclonal) | Marston lab stock | n/a | WB (1:10,000) |
| Antibody | Anti Smc3-K112,113Ac (rabbit polyclonal) | Marston lab stock | n/a | WB (1:1000) |
| Antibody | Anti-Rec8 (rabbit polyclonal) | Marston lab stock | n/a | WB (1:15,000), ChIP |
| Antibody | Anti-Smc3 (rabbit polyclonal) | Marston lab stock | n/a | WB (1:1000), ChIP |
| Antibody | Anti-mouse HRP (sheep monoclonal) | GE Healthcare | Cat# NXA931; RRID:AB_772209 | WB (1:10,000) |
| Antibody | Anti-rabbit (donkey monoclonal) | GE Healthcare | Cat# NA934; RRID:AB_772206 | WB (1:10,000) |
| Antibody | Anti-tubulin alpha (rat monoclonal) | Bio-Rad AbD Serotec | Cat# MCA78G; RRID:AB_325005 | IF (1:50) |
| Antibody | Anti-rat FITC antibody (donkey polyclonal) | Jackson ImmunoResearch | Cat# 712-095-153; RRID:AB_325005 | IF (1:100) |
| Recombinant DNA reagent | AMp1342 (plasmid) | This paper | YIplac128-SMC3 | LEU2 integration plasmid carrying SMC3 |
| Recombinant DNA reagent | AMp1392 (plasmid) | This paper | YIplac128-smc3-K112R,K113R | LEU2 integration plasmid carrying smc3-K112R,K113R |
| Sequence-based reagent | Primers | This paper | qPCR primers | Appendix 1—table 1 |
| Peptide, recombinant protein | Zymolyase | AMS Biotechnology | Cat# 120491-1 | |
| Peptide, recombinant protein | Glusolase | PerkinElmer | Cat# NEE154001EA | |
| Peptide, recombinant protein | RNAse A | Amresco | Cat# 0675–250MG | |
| Peptide, recombinant protein | Proteinase K | Invitrogen | Cat# 25530015 | |
| Peptide, recombinant protein | Klenow (exo-) enzyme | NEB | Cat# M0212S | |
| Peptide, recombinant protein | Phusion High-Fidelity DNA Polymerase | NEB | Cat# F530L | |
| Peptide, recombinant protein | Klenow fragment Dpol I | NEB | Cat# M0210L | |
| Peptide, recombinant protein | T4 DNA ligase | Invitrogen | Cat# 15224090 | |
| Peptide, recombinant protein | T4 DNA Polymerase | NEB | Cat# M0203 | |
| Peptide, recombinant protein | T4 Polynucleotide Kinase | NEB | Cat# M0201 | |
| Commercial assay or kit | QuikChange XL Site-directed mutagenesis kit | Agilent | Cat# 200516 | |
| Commercial assay or kit | SYBR GreenER | Invitrogen | Cat# 11762500 | |
| Commercial assay or kit | Luna Universal qPCR Master Mix | NEB | Cat# M3003X | |
| Commercial assay or kit | Quick Ligation kit | NEB | Cat# M2200L | |
| Commercial assay or kit | 2100 Bioanalyzer High Sensitivity DNA kit | Agilent | Cat# 5067-4626 | |
| Commercial assay or kit | Qubit HS DNA assay kit | Thermo Scientific | Cat# Q32854 | |
| Commercial assay or kit | ECL SuperSignal West Pico chemiluminescence kit | Thermo Scientific | Cat# 34580 | |
| Commercial assay or kit | SuperSignal West Femto chemiluminescence kit | Thermo Scientific | Cat# 34094 | |
| Chemical compound, drug | Complete EDTA-free protease inhibitor cocktail tablets | Roche | Cat# 1873580001 | |
| Chemical compound, drug | NEB Buffer 2 | NEB | Cat# B7202 | |
| Chemical compound, drug | NEB Buffer 3.1 | NEB | Cat# B7203S | |
| Chemical compound, drug | 0.4 mM biotin-14-dCTP | Invitrogen | Cat# 19518018 | |
| Chemical compound, drug | Phenol:chloroform:isoamyl alcohol 25:24:1 | Sigma | Cat# P3803 | |
| Software, algorithm | ImageJ software version 2.0.0-rc-43/1.51g | National Institutes of Health | https://imagej.nih.gov/ij/; RRID:003070 | |
| Software, algorithm | Integrated Genome Viewer | Broad Institute | https://software.broadinstitute.org/software/igv/; RRID:SCR_011793 | |
| Software, algorithm | Hi-C pipeline | n/a | https://github.com/danrobertson87/Barton_2021 | |
| Software, algorithm | ChIP-seq pipeline | n/a | https://github.com/danrobertson87/Barton_2021 | |
| Software, algorithm | HiGlass | Harvard, MIT | https://higlass.io/ | |
| Other | Protein G Dynabeads | Invitrogen | Cat# 10009D | |
| Other | Chelex-100 Resin | Bio-Rad | Cat# 1421253 | |
| Other | AMPure XP bead | Beckman | Cat# A63881 | |
| Other | Dynabeads MyOne Streptavidin C1 beads | Invitrogen | Cat# 65002 | |
| Other | Ibidi dishes μ-Slide 8-Well Glass | Ibidi | Cat# 80827 | |
| Other | DNA LoBind tubes | Eppendorf | Cat# 0030 108.051 | |
| Other | MiniSeq High output reagent kit (150-cycles) | Illumina | Cat# FC-420-1002 | |
| Other | Amicon 30 kDa columns | Merck | Cat# ufc903008 | |
| Other | NEXTflex-6 DNA Barcodes | PerkinElmer | Cat# 514101 |
Appendix 1—table 1
List of qPCR primers used in this study.
| Chr | Location | Distance from centromere | Primer pair | Sequence | Figure |
|---|---|---|---|---|---|
| IV | Arm | –95 kb | 782 | AGATGAAACTCAGGCTACCA | Figure 8—figure supplement 2A and B |
| 783 | TGCAACATCGTTAGTTCTTG | ||||
| IV | Pericentromere | –9.5 kb | 1319 | ATGATTCAATGGATTTAGCC | |
| 1320 | GTCAGTCTTATGCTGTTCCC | ||||
| IV | Centromere | +150 bp | 794 | CCGAGGCTTTCATAGCTTA | |
| 795 | ACCGGAAGGAAGAATAAGAA | ||||
| III | Centromere | –42 bp | 8196 | ATAAACCAAACCCTTCCCCTTC | Figure 8—figure supplement 2E |
| 8197 | CCATATTGTTTGGCGCTGAT | ||||
| IV | Arm | –95 kb | 8175 | GCTACCACCAATAACACAGTTGAG | |
| 8176 | GTACCTTCCCTGATAATCCGTCT | ||||
| IV | Centromere | +51 bp | 8172 | GCCGAGGCTTTCATAGCTTA | |
| 8173 | GACGATAAAACCGGAAGGAAG | ||||
| XII | Centromere | –45 bp | 8206 | GGTTTGTAGACAACCAAACTGGTG | |
| 8207 | ACTCTTTACGCGGGTGTGTACT |
Appendix 1—table 2
SK1 genome coordinates used to generate ChIP-seq and Hi-C pileup plots.
| Chr | Left arm peak | Left border | CEN | Right border | Right arm peak |
|---|---|---|---|---|---|
| I | 143,338 | 156,847 | 160,506–160,623 | 170,170 | 174,656 |
| II | 209,535 | 226,877 | 229,855–229,971 | 235,956 | 269,863 |
| III | 56,131 | 106,064 | 119,146–119,262 | 134,944 | 148,849 |
| IV | 412,039 | 452,984 | 461,938–462,053 | 468,978 | 191,167 |
| V | 143,196 | 150,521 | 156,659–156,776 | 170,642 | 194,898 |
| VI | 141,526 | 145,685 | 150,233–150,350 | 156,148 | 174,078 |
| VII | 480,232 | 500,759 | 508,233–508,352 | 515,930 | 563,982 |
| VIII | 72,321 | 95,832 | 100,974–101,091 | 105,373 | 114,788 |
| IX | 320,860 | 354,853 | 360,299–360,308 | 370,438 | 381,917 |
| X | 423,353 | 445,538 | 450,666–450,783 | 455,253 | 468,108 |
| XI | 417,329 | 438,536 | 445,725–445,841 | 452,317 | 477,072 |
| XIV | 132,607 | 137,781 | 154,749–154,867 | 165,549 | 185,746 |
| XIII | 249,427 | 254,063 | 266,751–266,870 | 278,483 | 293,988 |
| XIV | 592,647 | 625,567 | 637,885–638,002 | 656,081 | 660,807 |
| XV | 310,053 | 322,437 | 327,363–327,480 | 335,598 | 373,770 |
| XVI | 537,065 | 554,046 | 559,567–559,683 | 564,164 | 584,849 |
Appendix 1—table 3
Hi-C libraries generated in this study.
| Library name | Relevant genotype and stage | Total R1/R2 aligned reads (M) | Valid unique Hi-C pairs (M) |
|---|---|---|---|
| HiC1_28719_wt | RPL13A-2xFKBP12 fpr1∆ tor1-1 ndt80∆ prophase | 97,377,167/93,678,652 | 17,763,563 |
| HiC1_28720_eco1-aa | RPL13A-2xFKBP12 fpr1∆ tor1-1 ndt80∆ ECO1-FRB-GFP prophase | 103,777,687/100,044,807 | 15,759,219 |
| HiC1_29750_wpl1 | RPL13A-2xFKBP12 fpr1∆ tor1-1 ndt80∆ rad61∆ prophase | 77,203,756/74,233,462 | 13,525,545 |
| HiC1_29781_eco1-aa_wpl1 | RPL13A-2xFKBP12 fpr1∆ tor1-1 ndt80∆ ECO1-FRB-GFP rad61∆ prophase | 95,353,060/92,175,659 | 11,292,250 |
| HiC2_11633_wt | ndt80∆ prophase | 175,716,902/172,151,440 | 18,256,545 |
| HiC2_28841_clb5_clb6 | ndt80∆ clb5Δ clb6Δ prophase | 160,012,048/156,826,193 | 20,128,179 |
| HiC3_28719_wt | RPL13A-2xFKBP12 fpr1∆ tor1-1 ndt80∆ prophase | 105,178,126/103,054,489 | 13,127,333 |
| HiC3_28720_eco1-aa | RPL13A-2xFKBP12 fpr1∆ tor1-1 ndt80∆ ECO1-FRB-GFP prophase | 141,270,515/138,743,876 | 18,613,322 |
| HiC3_31003_cdc6 | RPL13A-2xFKBP12 fpr1∆ tor1-1 ndt80∆ cdc6-md prophase | 108,810,021/106,207,643 | 16,583,830 |
| HiC3_20991_eco1-aa | RPL13A-2xFKBP12 fpr1∆ tor1-1 ndt80∆ ECO1-FRB-GFP cdc6-md prophase | 101,646,217/99,245,960 | 15,733,530 |
| HiC4_12145_wt | pCUP1::IME1 pCUP1::IME4meiotic G1 | 201,424,826/198,072,796 | 24,576,849 |
| HiC4_26946_clb5clb6 | pCUP1::IME1 pCUP1::IME4 clb5Δ clb6Δ meiotic G1 | 240,834,552/235,969,577 | 27,737,075 |
Additional files
-
Supplementary file 1
Saccharomyces cerevisiae (SK1 or W303) and Schizosaccharomyces pombe strains used in this study.
- https://cdn.elifesciences.org/articles/74447/elife-74447-supp1-v2.xlsx
-
Transparent reporting form
- https://cdn.elifesciences.org/articles/74447/elife-74447-transrepform1-v2.pdf
Download links
A two-part list of links to download the article, or parts of the article, in various formats.
Downloads (link to download the article as PDF)
Open citations (links to open the citations from this article in various online reference manager services)
Cite this article (links to download the citations from this article in formats compatible with various reference manager tools)
Eco1-dependent cohesin acetylation anchors chromatin loops and cohesion to define functional meiotic chromosome domains
eLife 11:e74447.
https://doi.org/10.7554/eLife.74447


