Synthetic reconstruction of the hunchback promoter specifies the role of Bicoid, Zelda and Hunchback in the dynamics of its transcription
- Institut Curie, Université PSL, Sorbonne Université, CNRS, Nuclear Dynamics, France
- Laboratoire de Physique de l’École Normale Supérieure, CNRS, Université PSL, Sorbonne Université and Université de Paris, France
- Department of Biochemistry and Biomedical Sciences, McMaster University, Canada
- Department of Physics and Astronomy, McMaster University, Canada
- Institut Curie, Université PSL, Sorbonne Université, CNRS UMR168, Laboratoire Physico Chimie Curie, France
Figures
Figure 1 with 1 supplement
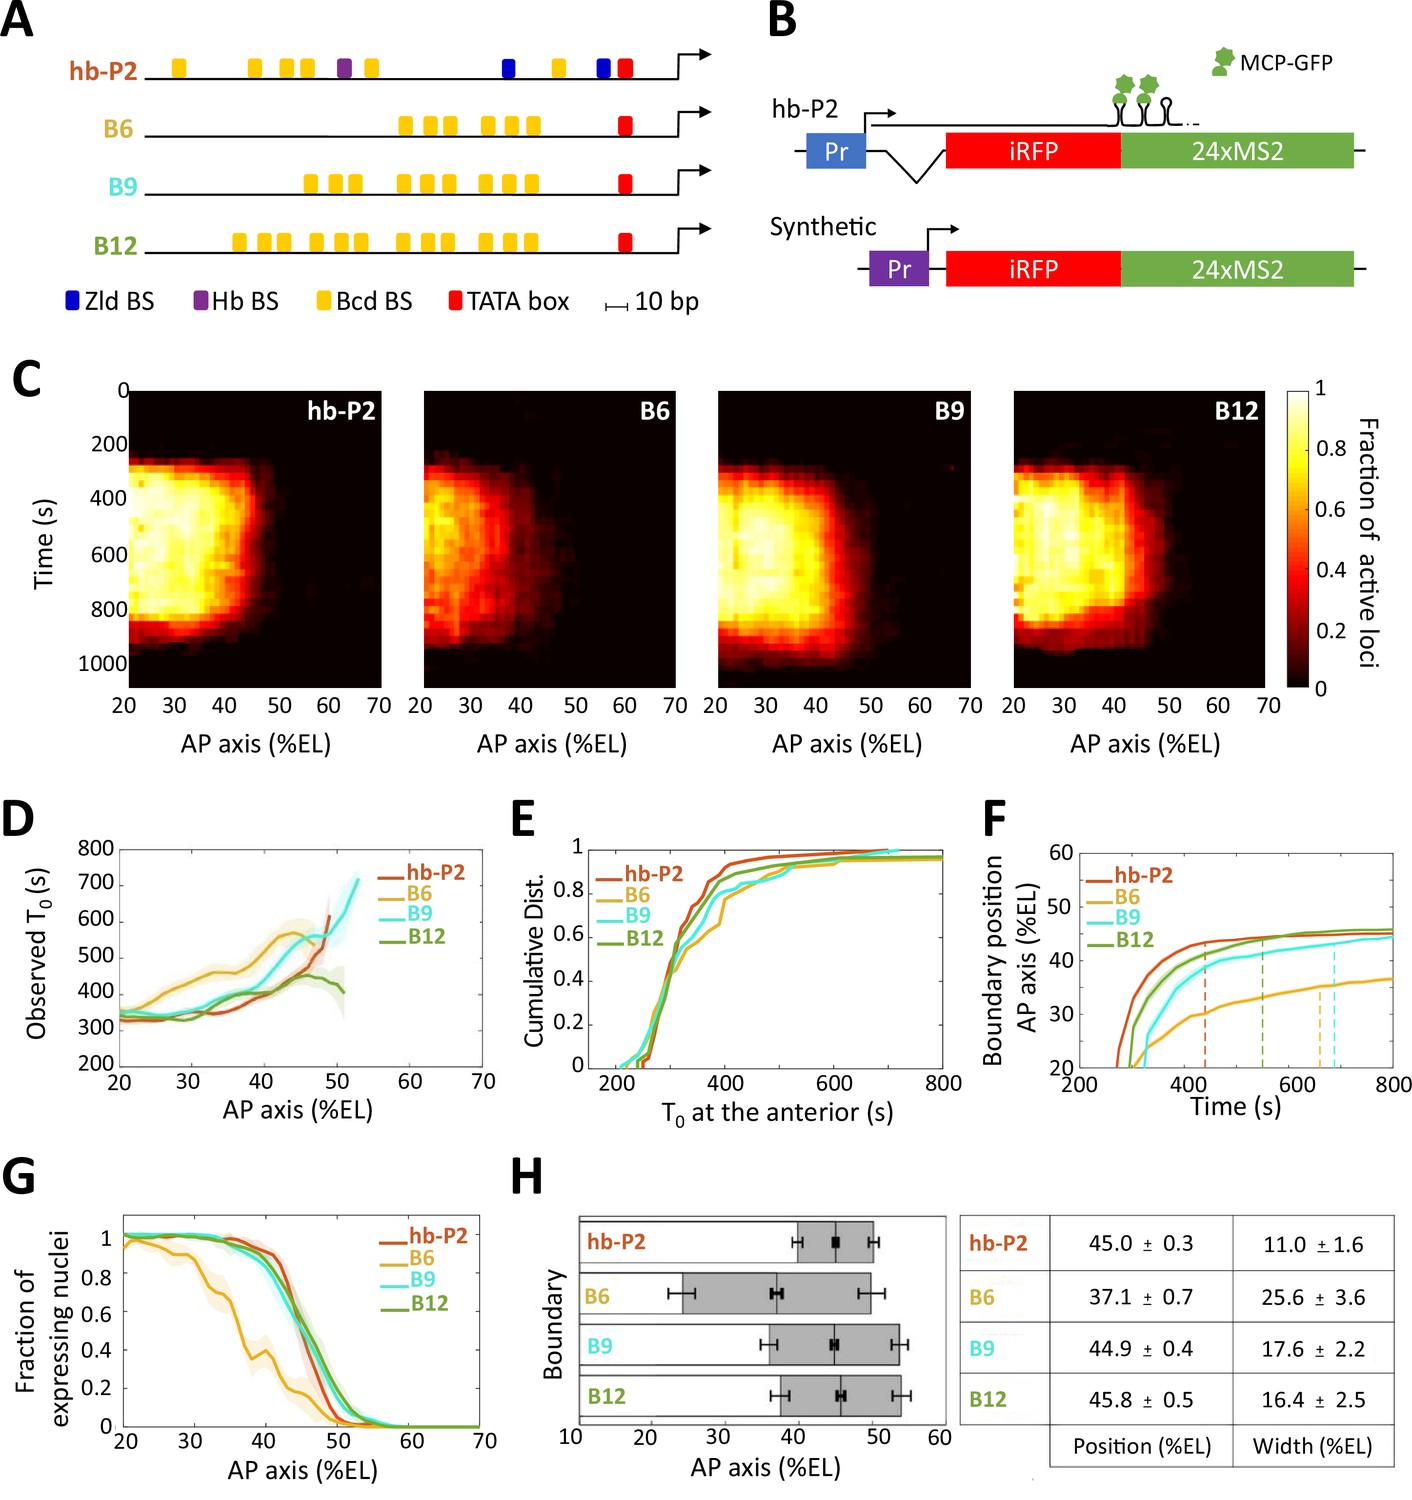
Transcription dynamics of the hb-P2, B6, B9 and B12 reporters.
(A) Arrangement of the binding sites for Bcd (yellow), Hb (purple), and Zld (blue) upstream of the TATA box (red) and the TSS (broken arrow) of each reporter. (B) The MS2 reporters express the iRFP coding sequence followed by the sequence of the 24 MS2 stem loops. In the hb-P2 reporter, the hb-P2 promoter, 5’UTR sequence of the endogenous hb and its intron are placed just upstream of the iRFP sequence. In the synthetic reporters, the minimal promoter of the hsp70 gene was used. Of note, replacing the minimal promoter of hsp70 in B6 by the hb minimal promoter leads to a reporter with lower activity (Figure 1—figure supplement 1), (F–G). (C) Kymographs of mean fraction of active loci (colormap on the right) as a function of time (Y axis in s) and nuclei position along the AP axis (X axis in %EL) at nc13. (D) Along the AP axis (%EL), mean time of first spot appearance T0 (s) with shaded standard error of the mean and calculated only for loci with observed expression. (E) Cumulative distribution function of T0 (s) in the anterior (20% ± 2.5 %EL). (F) Boundary position (%EL) of fraction of nuclei with MS2 signal along AP axis, with shaded 95% confidence interval, as a function of time. The dash vertical lines represent the time to reach the final decision boundary position ( ± 2 %EL). (G) Fraction of nuclei with any MS2 signal, averaged over n embryos, with shaded standard error of the mean, along the AP axis (%EL), at nc13. (H) Boundary position and width were extracted by fitting the patterns fraction of expressing nuclei, (G) with a sigmoid function. Bar plots with 95% confidence interval for boundary position and width as the gray region placed symmetrically around the boundary position. Average values and confidence intervals are indicated in the adjacent table. (D–H) reporter data are distinguished by color: hb-P2 (orange, n = 5 embryos), B6 (yellow, n = 5 embryos), B9 (cyan, n = 6 embryos), and B12 (green, n = 4 embryos).
Figure 1—figure supplement 1
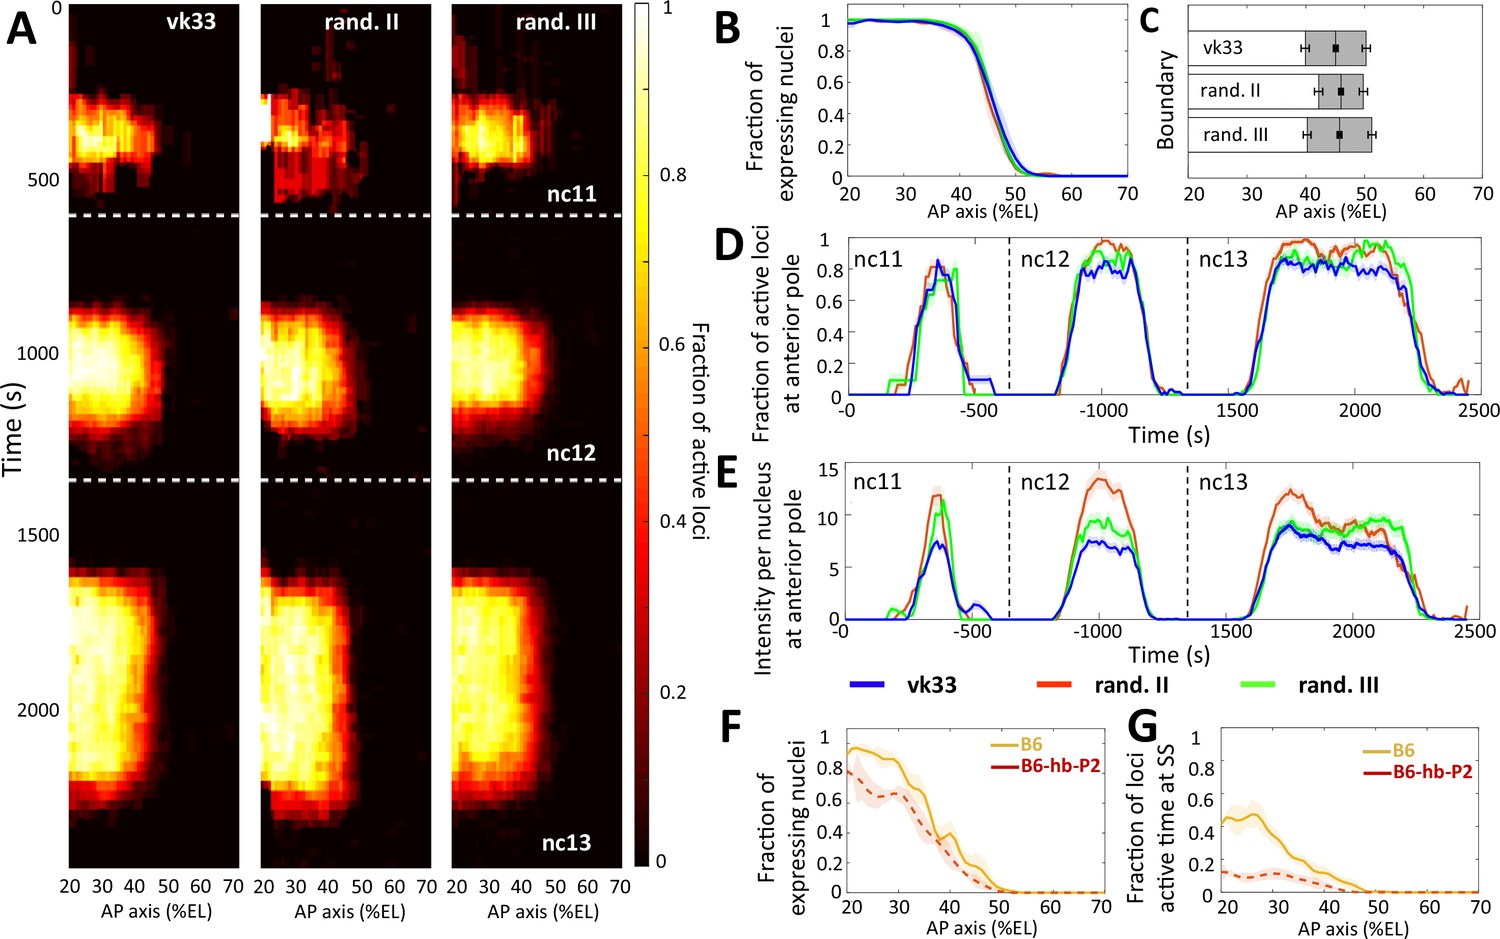
Comparison of transcription dynamics with hb-P2 reporters.
inserted at the vk33 site on the 3rd chromosome and randomly in the 2nd chromosome and 3rd chromosome (Lucas et al., 2018). (A) Kymographs representing the fraction of nuclei with active MS2 loci (represented as by the colormap) as a function of time and nuclei position along the AP axis. The white dashed horizontal lines represent mitoses between nuclear cycles. (B) Fraction of nuclei with any MS2 expression in nc13, averaged over multiple embryos, with shaded error of the mean as a function of nuclei position along AP axis (%EL). (C) Bar plots with 95% confidence interval for the expression boundary position for MS2 reporters, based on the fraction of expressing loci (panel B). For each reporter, also shown is the boundary width as the gray region placed symmetrically around the boundary position. (D) Time evolution of the fraction of active MS2 loci near the anterior pole (from 15% to 25%EL) in nc11, nc12, and nc13. (E) Time evolution of the MS2 locus intensity per nucleus at the anterior pole (from 15% to 25%EL) in nc11, nc12, and nc13. In panels B, E, and D, data is shown for the hb-P2 reporter inserted at the vk33 site (blue, n = 5 embryos), randomly in the 2nd chromosome (red, n = 3) and in the 3rd chromosome (green, n = 6). (F) Fraction of nuclei with MS2 expression, averaged over multiple embryos, with shaded standard error of the mean, during nc13 along the AP axis (%EL). (G) Fraction of MS2 loci active time at steady state, averaged over multiple embryos, with shaded standard error of the mean, during nc13 along the AP axis (%EL). In panel F and G, data shown for B6 reporters with TATA box of HSBG promoter (solid orange) and of hb-P2 promoter (dashed red).
Figure 2 with 3 supplements

Modeling transcription dynamics at steady state.
(A) Fraction of loci active time () at steady state (time window of 600–800 s into nc13), averaged over n embryos, as a function of nuclei position along AP axis (%EL). (B) Mean fluorescent intensity () with standard error of active MS2 loci detected in the anterior region ( ~ 20% ± 2.5% EL) at steady state. In (A-B) reporter data are distinguished by color: hb-P2 (orange, n = 5 embryos), B6 (yellow, n = 5 embryos), B9 (cyan, n = 6 embryos), and B12 (green, n = 4 embryos). (C) Model of Bicoid binding and unbinding to an array of identical binding sites: nuclear Bcd molecules can bind independently to individual binding sites at rate . The binding array state is denoted by where i is the number of bound sites. The forward rate constants are the binding rates of Bcd to the free remaining sites of : . The backward rate constants are the unbinding rates of bound Bcd from . (D) Transcription dynamics is modeled as a bursty two-state ON/OFF model with the switching rate constants and . The switching rate depends on i the number of bound Bcd molecules. Transcription is not activated with fewer than bound Bcd (). Only during the ON state can RNAPs arrive and initiate transcription at rate constant . (E–G) Fraction of active loci at steady state obtained experimentally for B6 (E, solid yellow), B9 (F, solid cyan), B12 (G, solid green) compared to the fraction of active loci at steady state from the best fitting models (dashed black) for corresponding BS numbers N=6 for B6 (E), =9 for B9 (F) or N =12 for B12 (G). In these models, the free parameters are the unbinding rate constant (), the promoter switching rates with bound Bcd molecules ( and ). is set to 3. The switching ON rates at higher bound states are set , given the synergistic activation of transcription by bound Bcd (see Supplementary file 5). The binding rate constant is determined by assuming that Bcd binding is diffusion limited (Appendix 2).
Figure 2—figure supplement 1
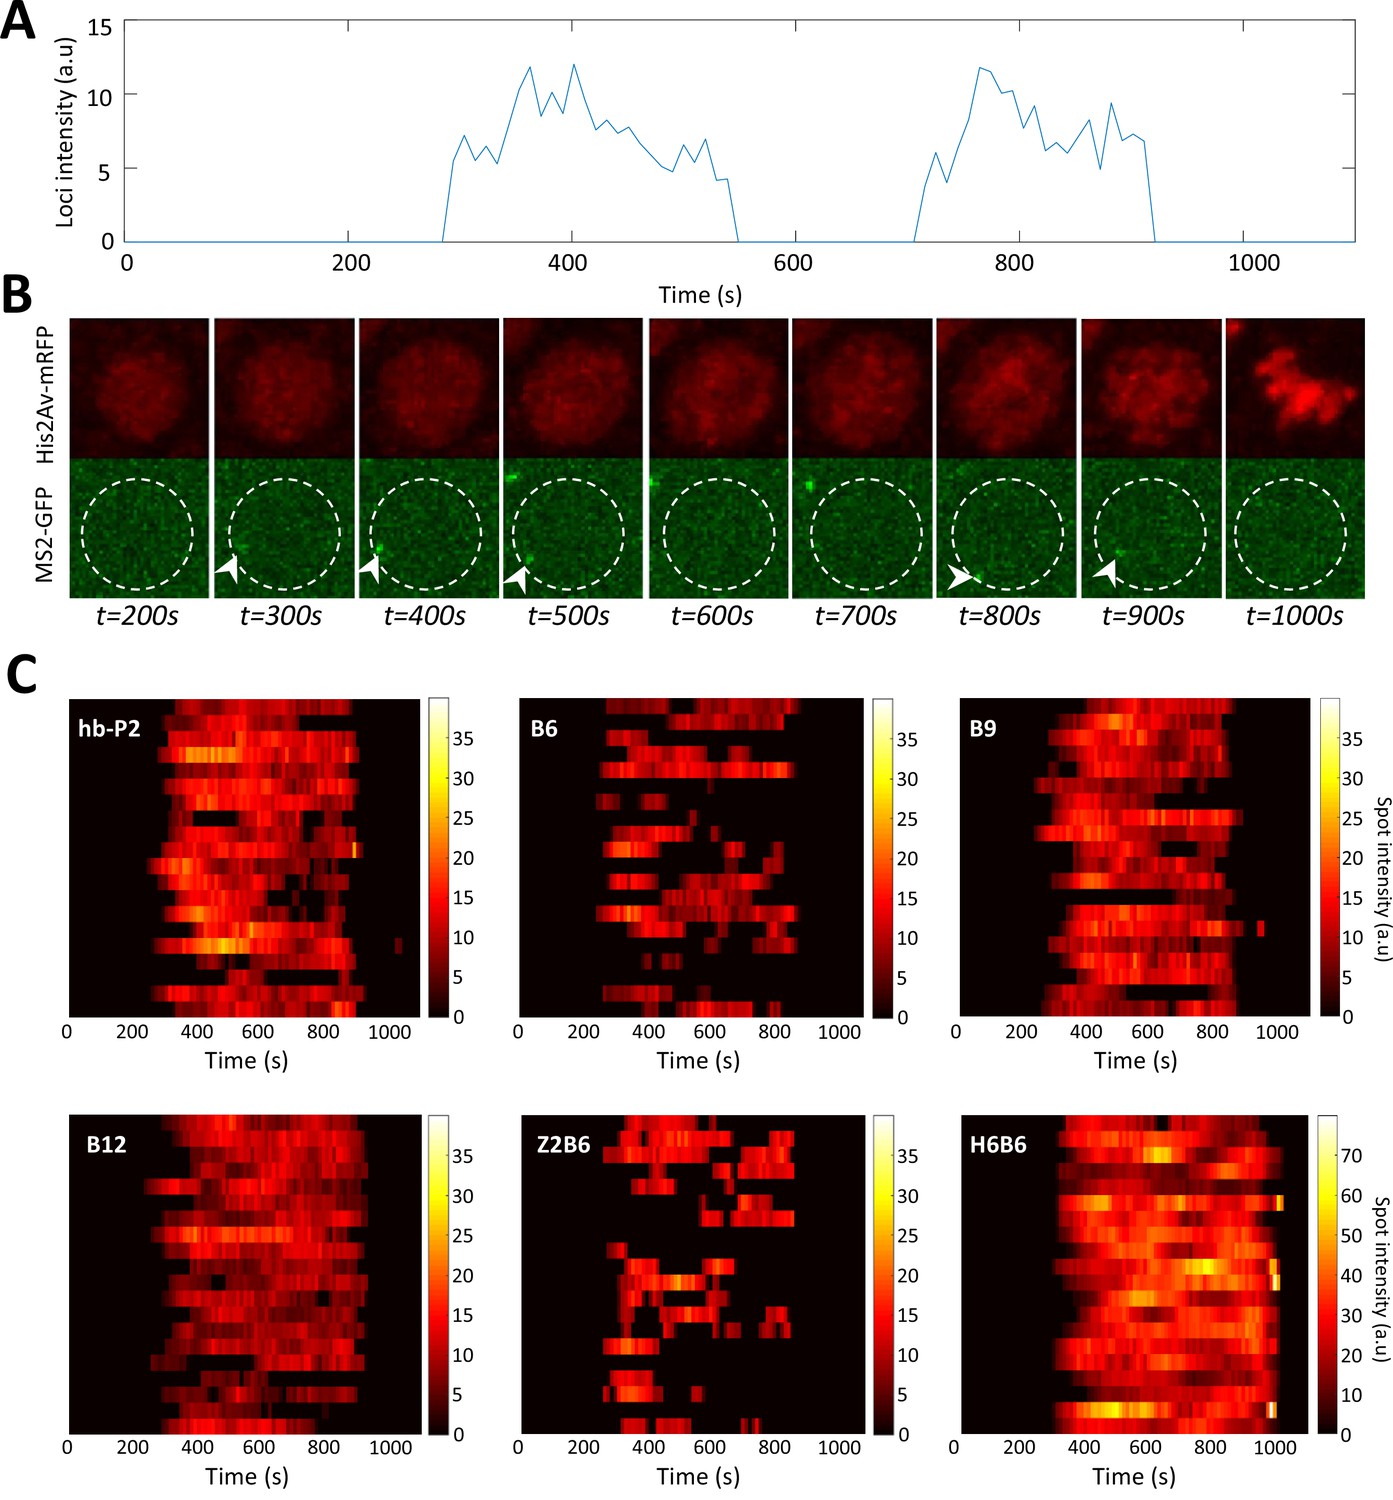
Example of timely transcription dynamics (bursting) monitored with MS2-MCP system.
(A) Example of a fluorescent intensity trace as a function of time for the B6 reporter in a nucleus in the anterior region (~20 %EL). (B) Image of the nucleus which exhibited the trace observed in panel A with hisAV-mRFP (red, top) and the MS2-GFP (green, bottom). Active transcription can be detected as a bright spot in the green channel (white arrowheads). The white dashed circle corresponds to the estimated nuclear envelope. (C) Kymographs of MS2-GFP intensity traces at the hb-P2 and the synthetic B6, B9, B12, H6B6, and Z2B6 reporters in the anterior region (~20% ± 2.5 %EL). For each construct, 20 traces are shown as horizontal bars with the intensity described by the color heatmap (right). Of note, the heatmap scale is shared by hb-P2, B6, B9, B12, and Z2B6 while it is twice higher for H6B6.
Figure 2—figure supplement 2
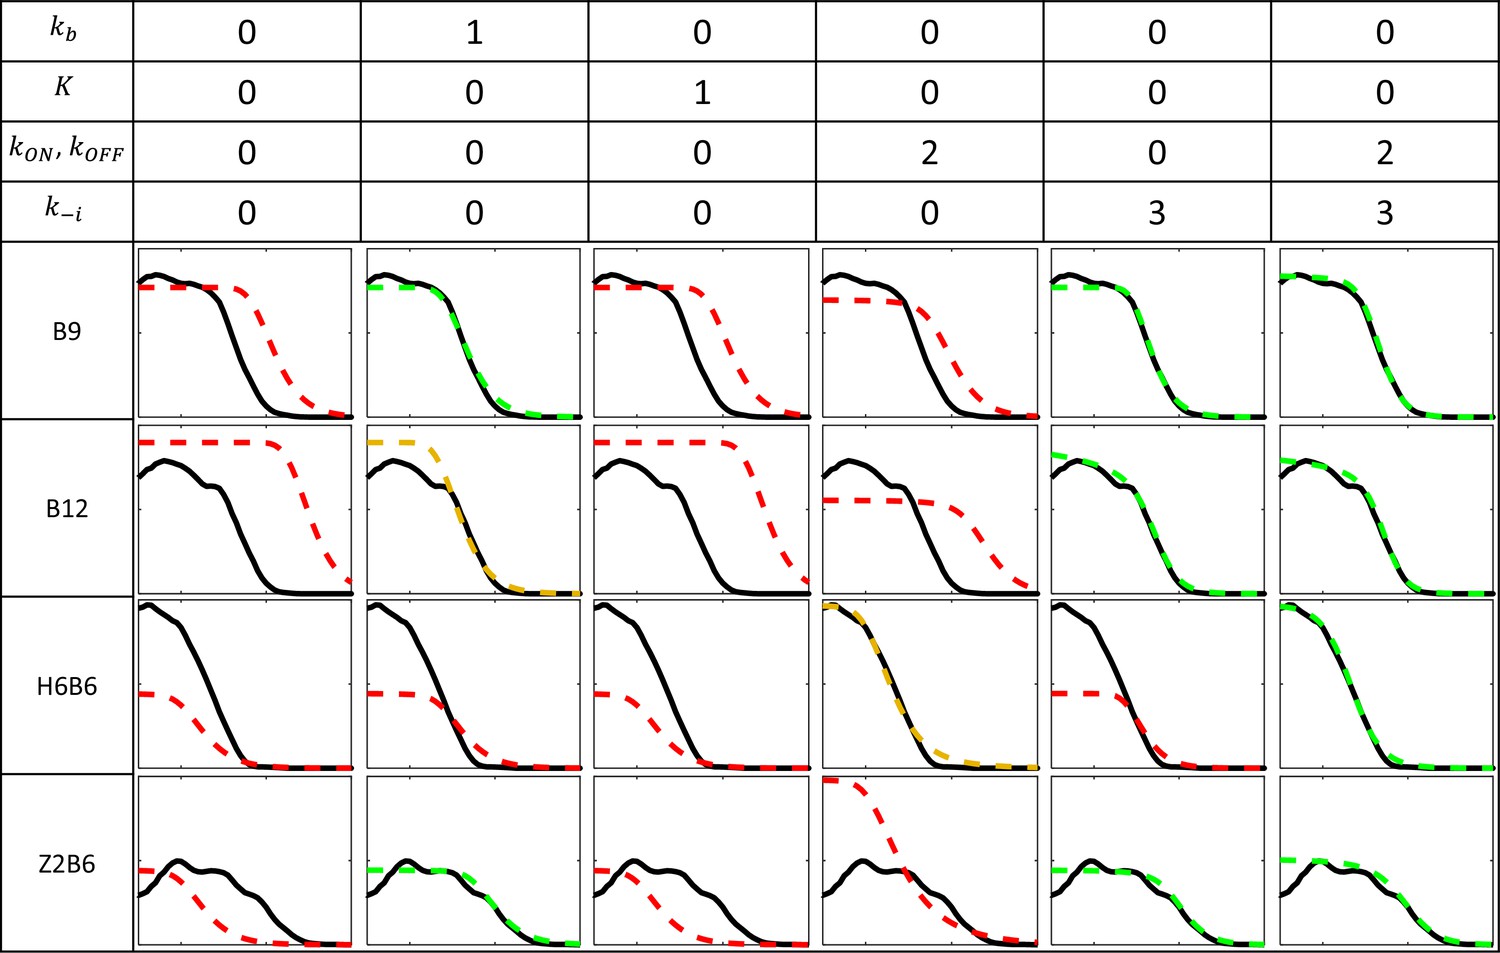
Fitting models to experimental data for the B9, B12, Z2B6, and H6B6 with the least degree of freedom when compared to B6.
Each column corresponds to a fitting configuration with the number indicating the degree of freedom from the fitted B6 model for each group of kinetic parameters. A value of 0 indicates that the value of the kinetic parameter is imposed from the fitted model of B6 pattern (Figure 2E). Parameters include the Bcd binding rate constant , the minimal number of bound Bcd for transcription activation , the promoter switching rate when bound by Bcd molecules and , and the unbinding rate constants of Bcd from the BS array (see Appendix 2). The switching ON rates at higher bound states are set to , given the synergistic activation of transcription by bound Bcd (see Appendix 3). For each fitting configuration and reporter are shown the patterns from the data (solid black) and from the fitted model (dashed color). On the y axis: fraction of loci active time at steady state (from 0 to 1). On the x axis: position along the AP axis (from –30 to 20%EL). The quality of the model fit to the data (visually determined) is indicated by the color of the dashed curves as follow: good (green), moderate (orange) and red (bad).
Figure 2—figure supplement 3
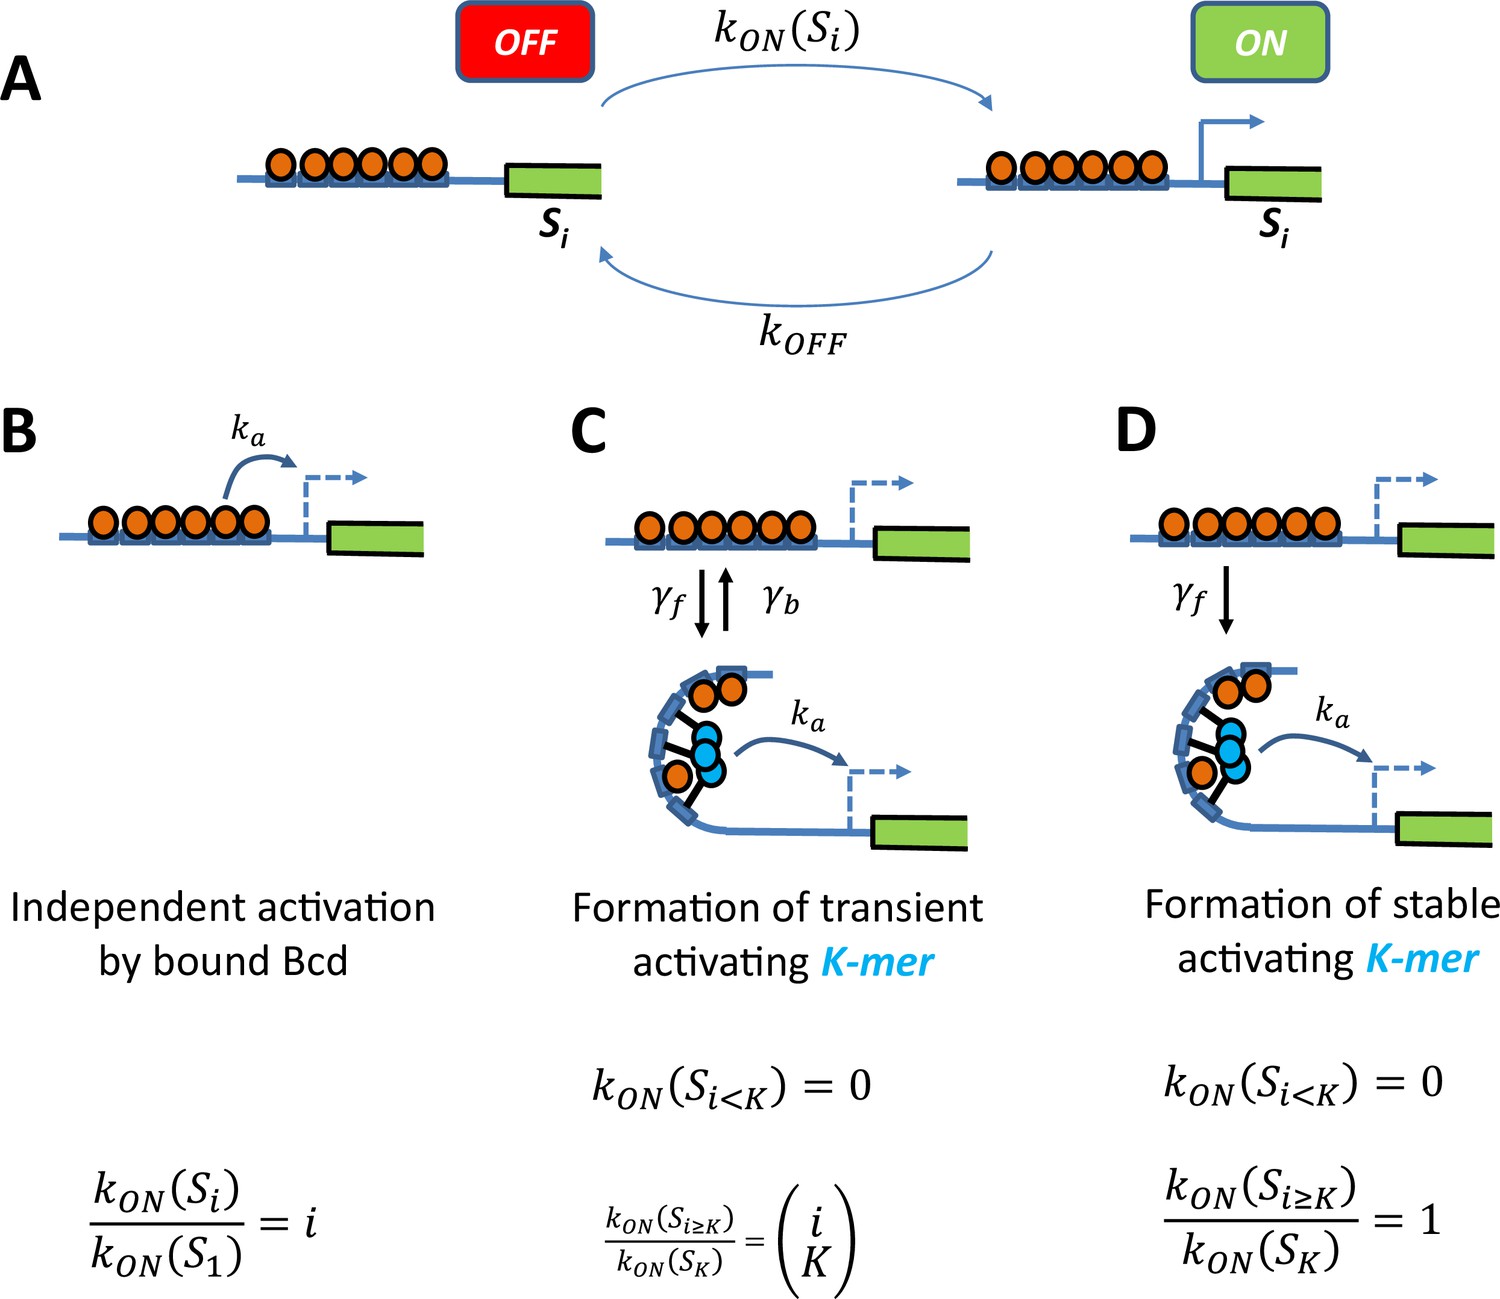
Schemes of transcription activation by bound Bcd molecules.
(A) Context: When the binding sites are occupied by i Bcd molecules, the promoter can switch between two transcriptional states ON and OFF. The activation rate , not the deactivation rate, depends on the binding state and how it interacts with the promoter (see schemes in panel B, C and D). (B) Independent activation: Bound Bcd molecules (orange balls) can independently activate transcription at rate . Activation can be enabled with even a single bound Bcd: The activation rate with binding state is proportional to the number of bound Bcd: (C-D) Formation of a stable activating “K-mer”: Bound Bcd molecules (orange balls) can randomly form protein complexes (cyan balls) containing molecules (hence called “K-mers”), which can activate transcription at rate. There is no activation of transcription with less than K bound Bcd . In panel C, The “K-mer” is constantly formed and degraded at rates and respectively. Assuming that these rates are fast enough (so that the formation and degradation of ‘K-mers’ are always in equilibrium) and that , the fold change in the activation rate is given by the number of ways to choose a subset of K molecules from i bound Bcd: In panel D, the protein complex is stable once formed . Assuming a negligible formation time when enough Bcd is bound , the activation rate is always constant .
Figure 3 with 1 supplement
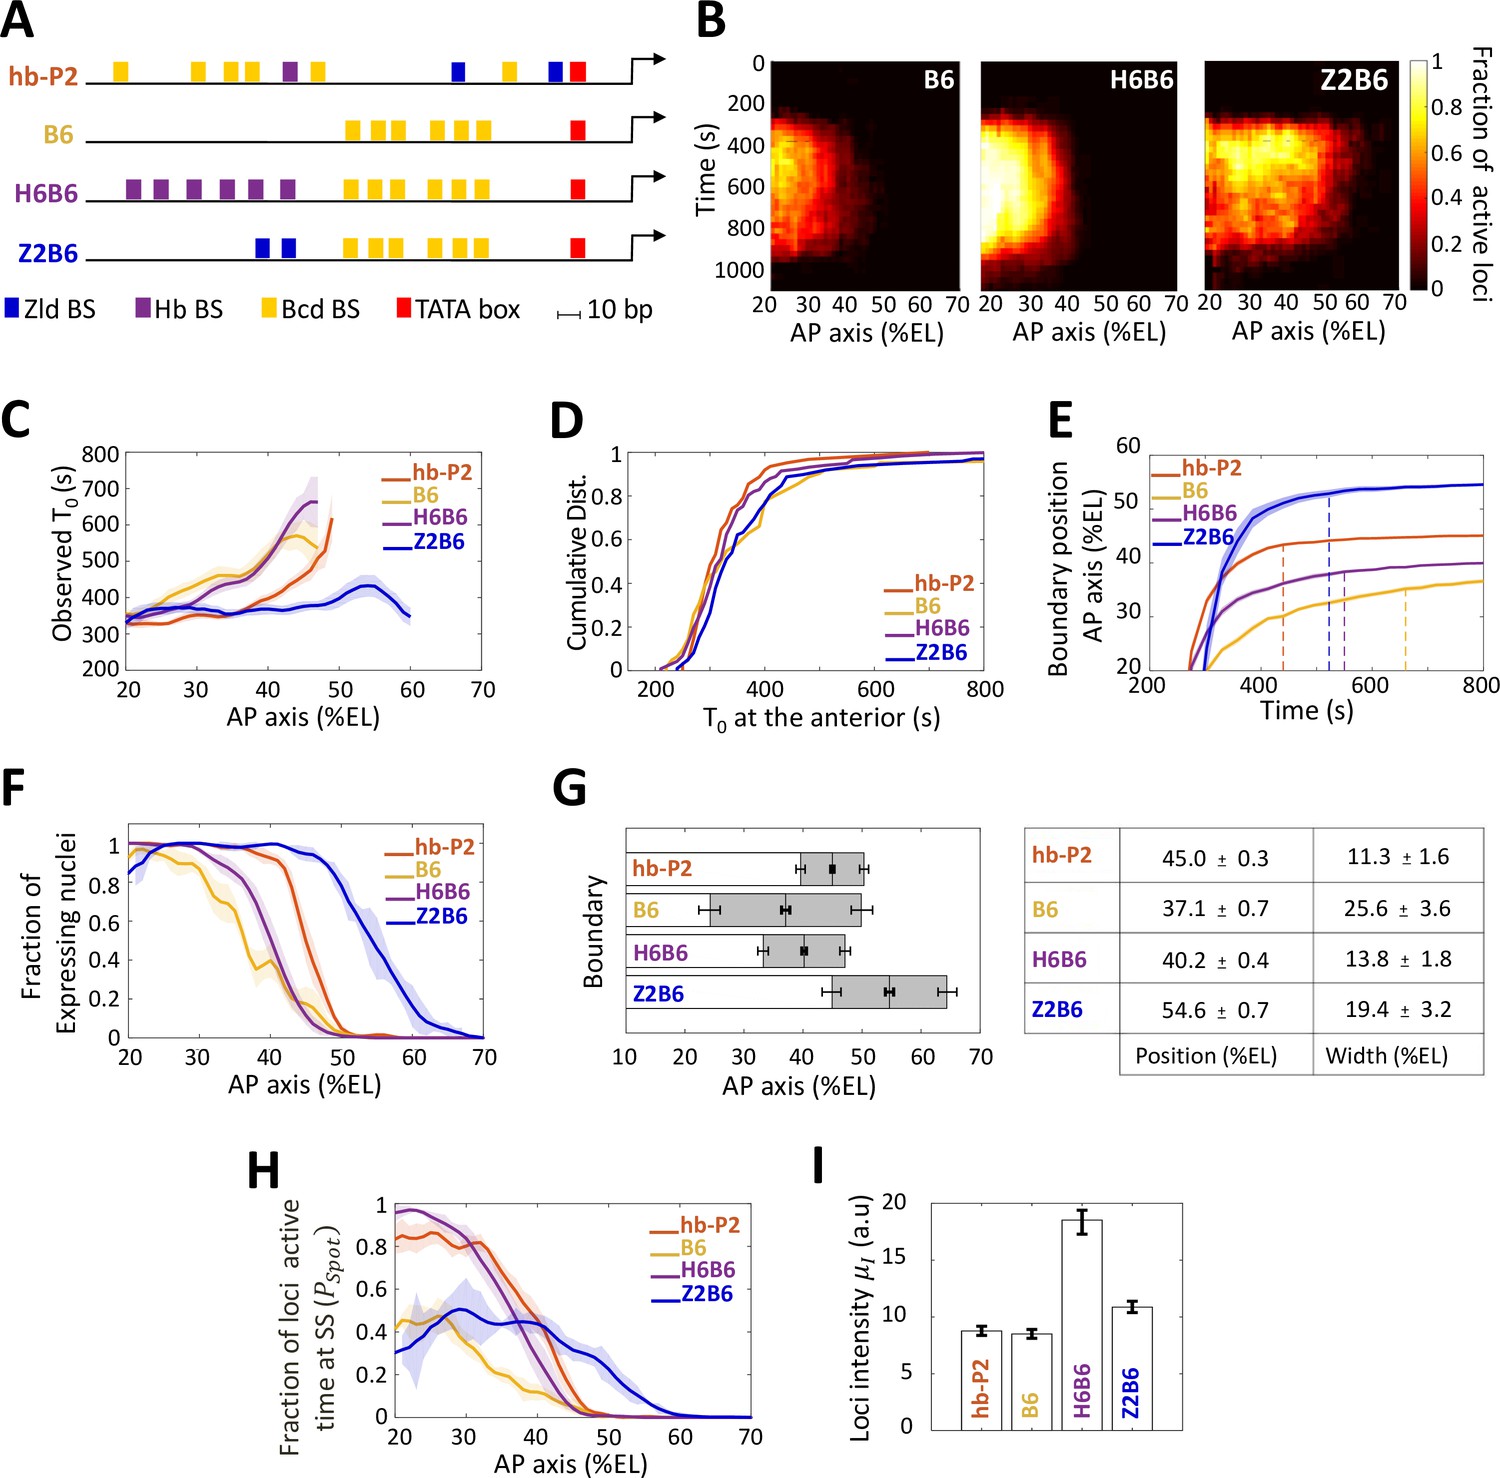
Transcription dynamics of the B6, H6B6, and Z2B6 reporters.
(A) Arrangement of the binding sites for Bcd (yellow), Hb (purple), and Zld (blue) upstream of the TATA box (red) and the TSS (broken arrow) of each reporter. (B) Kymographs of mean fraction of active loci (colormap on the right) as a function of time (Y axis in s) and nuclei position along the AP axis (X axis in %EL) at nc13. (C) Mean time of first spot appearance T0 (s) along the AP axis with shaded standard error of the mean and calculated only for loci with observed expression. (D) Cumulative distribution function of T0 (s) at the anterior (20% ± 2.5%EL). (E) Boundary position (as %EL) of fraction of nuclei with MS2 signal along AP axis, with shaded 95% confidence interval, as a function of time. The dash vertical curves represent the time to reach the final decision boundary position ( ± 2 %EL). (F) Fraction of nuclei with any MS2 signal along the AP axis (%EL) with shaded standard error of the mean. (G) Boundary position and width were extracted by fitting the patterns fraction of expressing nuclei, (F) with a sigmoid function. Bar plots with 95% confidence interval for boundary position and width as the grey region placed symmetrically around the boundary position. Average values and confidence intervals are indicated in the adjacent table. (H) Fraction of loci active time () at steady state (time window of 600–800 s into nc13) as a function of nuclei position along AP axis. (I) Mean intensity () with standard error of active fluorescent loci detected in the anterior region (~20% ± 2.5% EL) at steady state. (C–I) reporter data are distinguished by color: hb-P2 (orange, n = 5 embryos), B6 (yellow, n = 5 embryos), H6B6 (purple, n = 7 embryos), and Z2B6 (blue, n = 3 embryos).
Figure 3—figure supplement 1

Transcription dynamics of the Z6 reporter (n = 2 embryos), B6 (n = 5 embryos) and Z2B6 (n = 3 embryos) expression patterns.
A) Kymographs representing the fraction of nuclei with active MS2 loci (represented by the colormap) as a function of time and nuclei position along the AP axis. The white dashed horizontal lines represent mitoses between nuclear cycles. (B–D) Comparison of B6 (orange) and Z2B6 (blue) patterns based on the fraction of loci active time, averaged over multiple embryos, with shaded standard error of the mean, in different time windows: (B) 450 s-550s into nc12, (C) 450 s-550s into nc13 and (D) 700 s-800s into nc13.
Figure 4 with 1 supplement
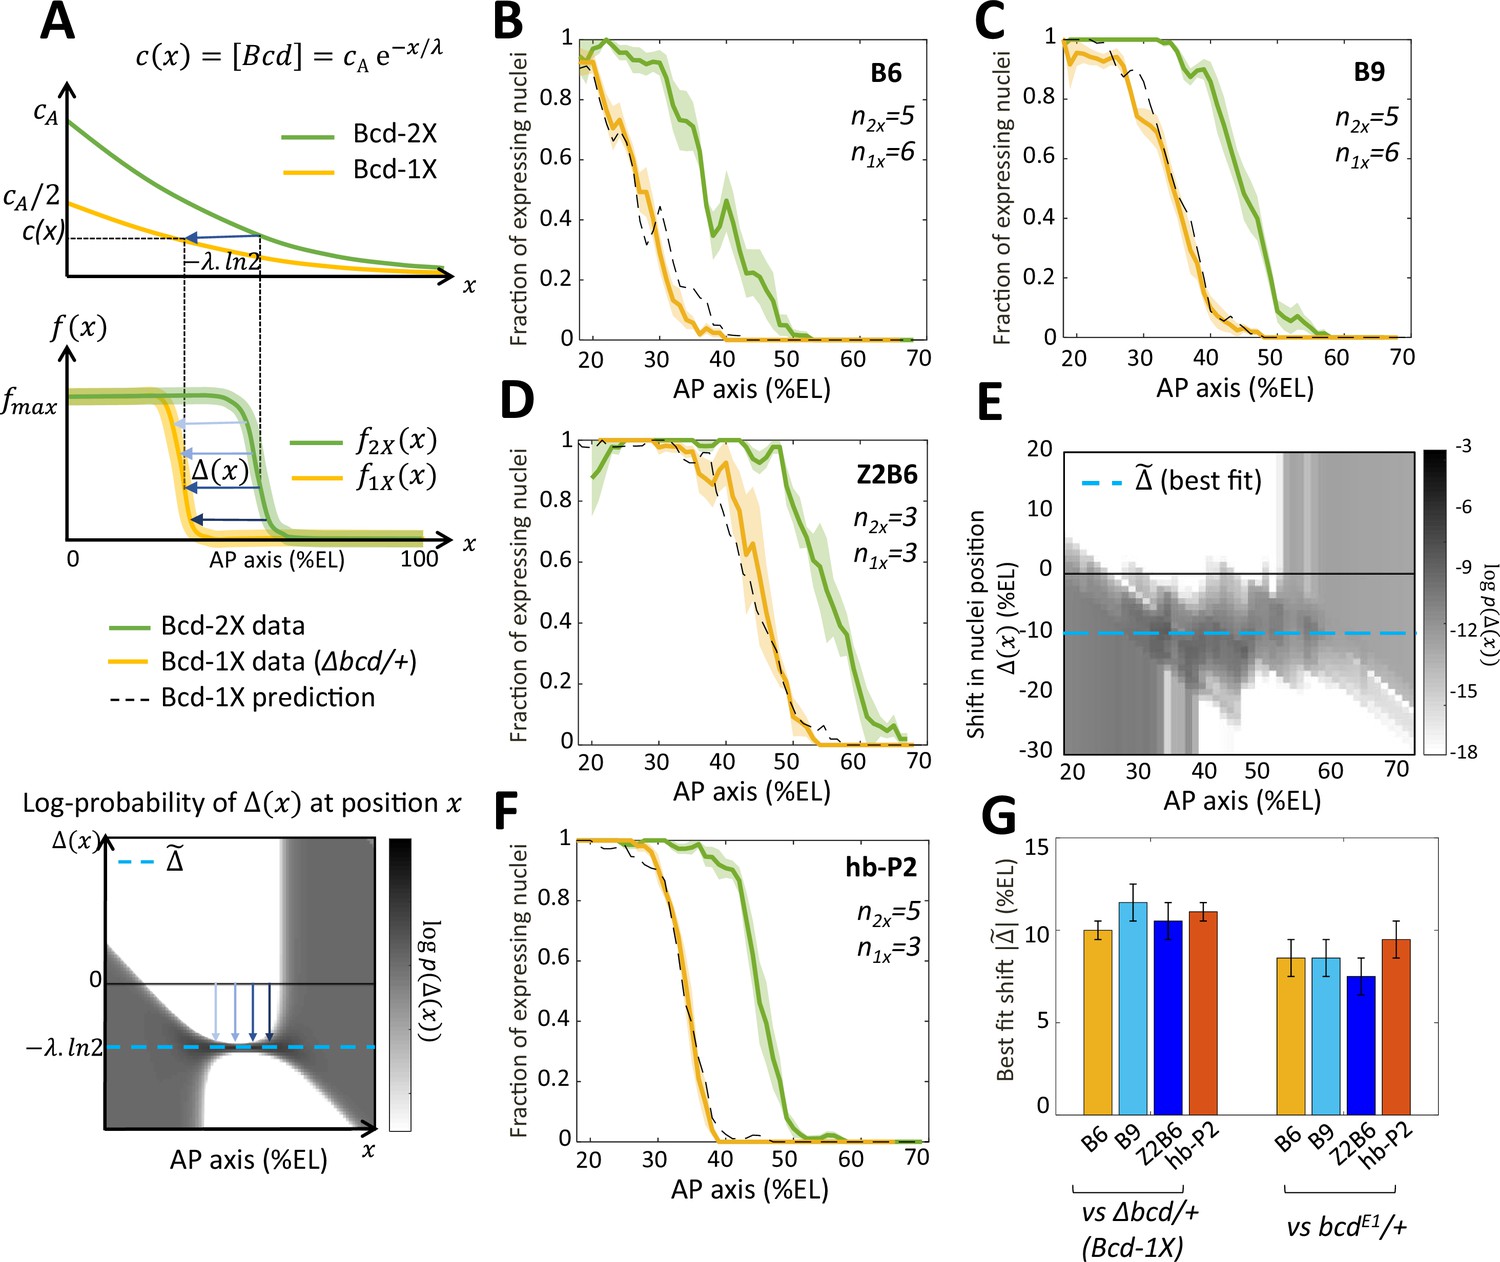
Bicoid thresholds measurements by the Bcd-only synthetic reporters.
(A) Modeling the pattern shifts between Bcd-2X and Bcd-1X embryos. Top: The Bcd concentration gradient along the AP axis with its exponential decay length λ. At the anterior pole, Bcd concentration is in Bcd-2X embryos (solid green line) and in Bcd-1X embryos (solid yellow line). The distance between any two nuclei columns in Bcd-2X and Bcd-1X that have the same Bcd concentration (blue horizontal arrow) is given by . Middle: along the AP axis, expression pattern of a Bcd-dependent reporter in Bcd-2X embryos (, solid green line) and in Bcd-1X embryos ( solid yellow line). : the shift in position (blue horizontal arrows) from a nuclei column in Bcd-2X embryos at position to one at Bcd-1X embryos with the same expression level, such that . Bottom: Cartoon of log-probability map of the shift based on the expression patterns in Bcd-2X and Bcd-1X (i.e. and ). Its value is represented on the grey scale. The blue vertical arrows denoting the shift correspond to the horizontal arrows with similar shade observed in the middle panel. If the Bcd gradient is the only source of positional information for the expression patterns, then the best fit value of given the probability map is (horizontal blue dashed line). (B–D and F) Expression patterns of B6 (B), B9 (C), Z2B6 (D) and hb-P2 (F) reporters in embryos from wild-type (Bcd-2X, solid green lines with shaded errors) and Δbcd/+ (Bcd-1X, solid yellow lines with shaded errors) females. In each panel, the numbers of embryos for each construct and condition are also shown. Prediction of Bcd-1X patterns from the Bcd-2X patterns assuming a fitted constant shift (values in panel G) are shown as dashed black lines. (E) Log-probability map () of the shift (in %EL) at a given nuclei position in Bcd-2X embryos (, in %EL), extracted from combined B6, B9, and Z2B6 reporters’ data. The horizontal cyan dashed line represents the best fit value = 10.5 %EL from the log-probability map. (G) Comparison of the shift, with 95% confidence interval, in nuclei position from wild-type embryos to embryos from Δbcd/ + females (left bars) and from wild-type embryos to embryos from bcdE1/ + females (right bars) fitted individually to B6, B9, Z2B6 and hb-P2 reporters’ data.
Figure 4—figure supplement 1
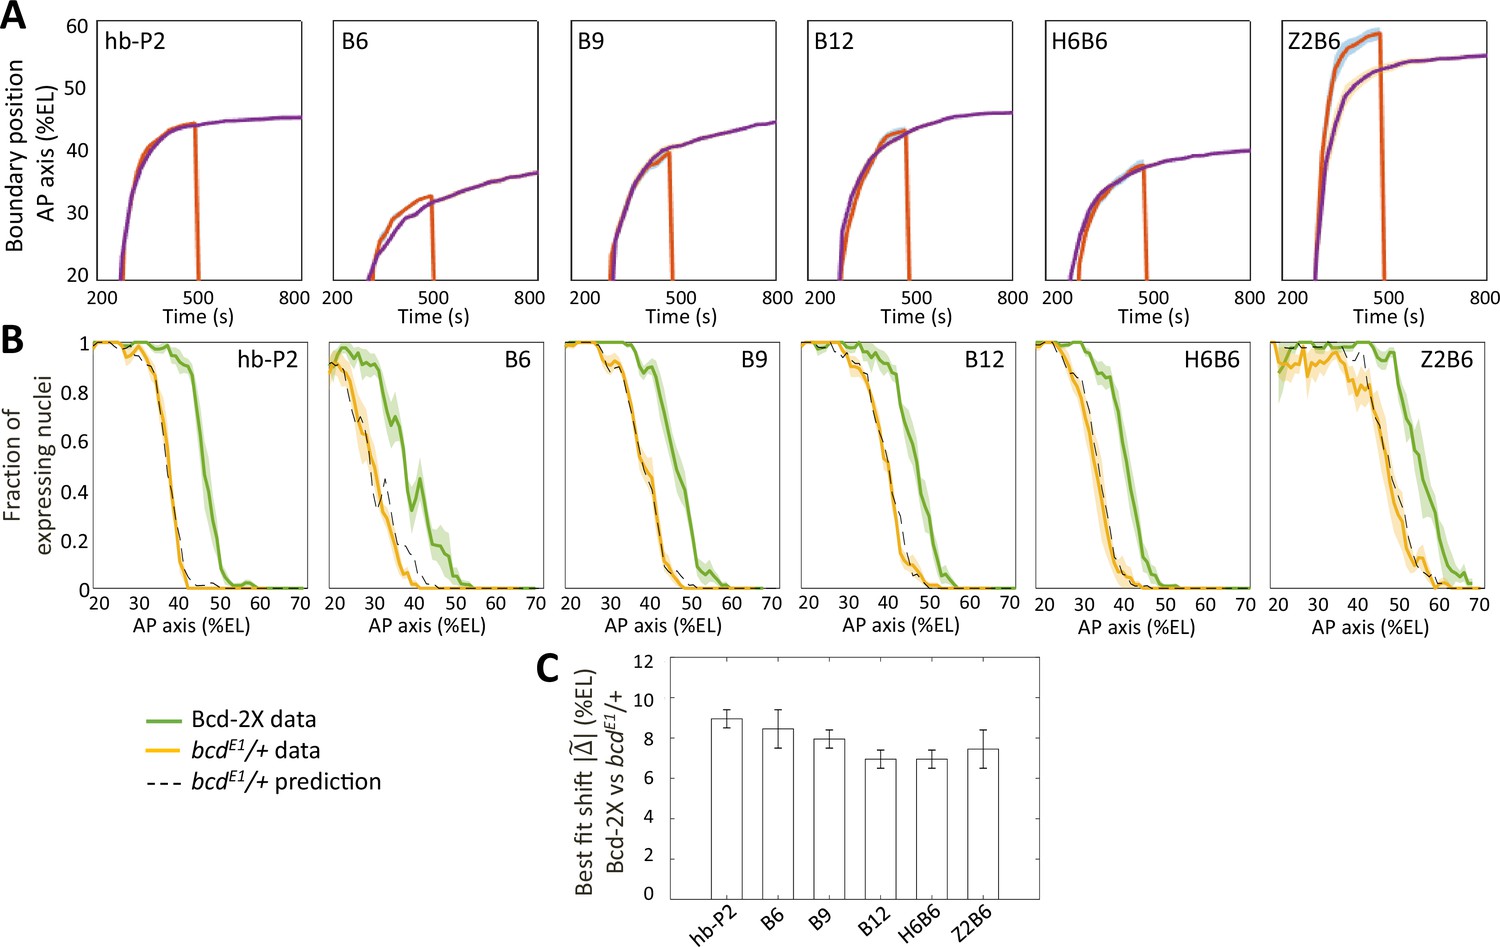
Comparison of fraction of expressing nuclei between nuclear cycles and between Bcd-2X and bcdE1/ + flies.
A) Boundary position of fraction of expressing nuclei along AP axis as a function time in nc12 (red) and nc13 (purple), shown for hb-P2 and synthetic reporters, shown with 95% confidence interval. The hb-P2 reporter reach position of expression boundary very rapidly therefore, the position of the boundary is the same at nc12 and nc13 for the hb-P2 reporter even though nc12 is very short. In contrast, positions of the Bcd-only reporters are different at the end of nc12 and nc13. This also true for H6B6 and Z2B6. (B) Expression patterns of hb-P2 and synthetic reporters in embryos from wild-type (Bcd-2X, solid green lines with shaded errors) and bcdE1/+ (solid yellow lines with shaded errors) females. Projection of bcdE1/ + pattern (black dashed) from the Bcd-2X pattern assuming a fitted constant shift = 9.0% ± 0.5 %EL for hb-P2 (n2x = 5 embryos, nbcdE1/+ = 4 embryos), = 8.5% ± 1.0 %EL for B6 (n2x = 5, nbcdE1/+ = 4), = 8.0% ± 0.5 %EL for B9 (n2x = 6, nbcdE1/+ = 6), = 7.0% ± 0.5 %EL for B12 (n2x = 4, nbcdE1/+ = 6), = 7.0% ± 0.5 %EL for H6B6 (n2x = 7, nbcdE1/+ = 5), = 7.5% ± 1.0 %EL for Z2B6 (n2x = 3, nbcdE1/+ = 5). (C) Comparison of the best fitted shift constant from Bcd-2X to bcdE1/ + flies for hb-P2 and synthetic reporters.
Figure 5

Fitting the data with models assuming different values for the Bcd gradient decay length .
(A) Hill coefficient (see Materials and methods) (solid red) in the steady state window (600 s-800s into nc13 interphase) calculated numerically from the best fitted models. Given that the pattern sharpness is measured to be 0.34 from the hb-P2 data, the observed Hill coefficient as a function of λ is given by the black line with shaded error. The physical limit of equilibrium sensing model with 6 BS ( = 6, black dashed line). (B) Log-likelihood of the best fitted models (solid red). The dashed line corresponds to the log-likelihood thresholds for a significantly worse fit (p-value = 0.05).
Videos
Video 1
Live imaging of transcription dynamics of B6 reporter.
The videos have two channels: MCP-GFP channel (green) for monitoring the dynamics of nascent mRNA production and His-RFP (red) for nuclei detection. The capture frame is from 15% to 65% of embryo length. The anterior pole is on the left side of the frame. Position along the AP axis is indicated by white vertical bars positioned every 10% EL with the tallest one corresponding to 50% EL.
Video 2
Live imaging of transcription dynamics of B9 reporter.
The videos have two channels: MCP-GFP channel (green) for monitoring the dynamics of nascent mRNA production and His-RFP (red) for nuclei detection. The capture frame is from 18% to 65% of embryo length. The anterior pole is on the left side of the frame. Position along the AP axis is indicated by white vertical bars positioned every 10% EL with the tallest one corresponding to 50% EL.
Video 3
Live imaging of transcription dynamics of B12 reporter.
The videos have two channels: MCP-GFP channel (green) for monitoring the dynamics of nascent mRNA production and His-RFP (red) for nuclei detection. The capture frame is from 20% to 70% of embryo length. The anterior pole is on the left side of the frame. Position along the AP axis is indicated by white vertical bars positioned every 10% EL with the tallest one corresponding to 50% EL.
Video 4
Live imaging of transcription dynamics of hb-P2 reporter.
The videos have two channels: MCP-GFP channel (green) for monitoring the dynamics of nascent mRNA production and His-RFP (red) for nuclei detection. The capture frame is from 15% to 70% of embryo length. The anterior pole is on the left side of the frame. Position along the AP axis is indicated by white vertical bars positioned every 10% EL with the tallest one corresponding to 50% EL.
Video 5
Live imaging of transcription dynamics of H6B6 reporter.
The videos have two channels: MCP-GFP channel (green) for monitoring the dynamics of nascent mRNA production and His-RFP (red) for nuclei detection. The capture frame is from 18% to 65% of embryo length. The anterior pole is on the left side of the frame. Position along the AP axis is indicated by white vertical bars positioned every 10% EL with the tallest one corresponding to 50% EL.
Video 6
Live imaging of transcription dynamics of Z2B6 reporter.
The videos have two channels: MCP-GFP channel (green) for monitoring the dynamics of nascent mRNA production and His-RFP (red) for nuclei detection. The capture frame is from 20% to 70% of embryo length. The anterior pole is on the left side of the frame. Position along the AP axis is indicated by white vertical bars positioned every 10% EL with the tallest one corresponding to 50% EL.
Tables
Author response table 1
| λ in µm | λ as % EL | Method of detection | Reference |
|---|---|---|---|
| 100 | ~ 20 | fixed embryos, antibody against the wt Bicoid protein | Houchmandzadeh et al., Nat, 2002 |
| 125 | ~ 25 | live detection of the Bcd-eGFP fusion | Abu-Arish et al., Biophys, 2010 |
| 19.3 | live detection of the Bcd-eGFP fusion | Liu et al., PNAS 2013 (Figure S4) | |
| 18.2 | live detection of the Bcd-Venus fusion | Liu et al., PNAS 2013 (Figure S4) | |
| 16.4 | fixed embryos, Bcd antibody against Bcd-eGFP | Liu et al., PNAS 2013 (Figure S4) | |
| 100 | 20 | Fixed embryos, antibodies against the wt Bicoid protein at nc13 | Xu et al., Nature Methods 2015 |
| 89 | ~ 17.8 | Live detection of tandem-fluorescent protein timer fused to Bcd | Durrieu et al., Mol Sys Biol 2018 (Page 7) |
Additional files
-
Supplementary file 1
Promoter sequences of hb-P2, synthetic MS2 reporters and oligonucleotides required for generating the Δ bcd molecular null allele.
The sequences are shown in modules, as arranged in Figure 1 in the main text. The TATA boxes of hb-P2 and HSBG promoter are highlighted in bold. In the binding array sequences, the binding sites for each protein are highlighted in grey (Bcd), green (Hb) and yellow (Zelda). For clarity, the binding array sequences are shown up to the TATA box of HSBG promoter.
- https://cdn.elifesciences.org/articles/74509/elife-74509-supp1-v1.docx
-
Supplementary file 2
Position and width of the gene expression boundary based on fraction of expression nuclei feature (Figures 1H and 3G) and fraction of active loci feature (Figures 2A and 3H) in the steady window (600–800 s into nc13) for hb-P2 and synthetic reporters in Bcd-2X, shown with 95% confidence interval.
For the fraction of expression nuclei, also shown is the time to reach the final activation decision boundary ( ± 2 %EL) starting from the detection the first spot (~225 s) after mitosis.
- https://cdn.elifesciences.org/articles/74509/elife-74509-supp2-v1.docx
-
Supplementary file 3
Estimated values of gradient decay length for the Bcd protein and Bcd fluorescently tagged protein gradients from previous works.
- https://cdn.elifesciences.org/articles/74509/elife-74509-supp3-v1.docx
-
Supplementary file 4
Estimated values of Bcd concentration at the anterior (), diffusion coefficient () and the size of the target for binding () from previous work.
- https://cdn.elifesciences.org/articles/74509/elife-74509-supp4-v1.docx
-
Supplementary file 5
Bcd search time for the target site () and the readout time () required for 10% error in Bcd concentration readout at hb-P2 boundary position (–4.9 %EL), calculated for different values of Bcd concentration at the anterior (), diffusion coefficient () and targets size () in the Berg & Purcell limit (Berg and Purcell, 1977).
- https://cdn.elifesciences.org/articles/74509/elife-74509-supp5-v1.docx
-
Supplementary file 6
Expected fold change in the activation rates in the anterior region (saturating Bcd concentration) between B9 and B6 and between B12 and B6.
The fold changes are shown for different schemes of activation and values of K (Figure 2—figure supplement 3). The fold changes above the value calculated from the data (~4.5) are made bold.
- https://cdn.elifesciences.org/articles/74509/elife-74509-supp6-v1.docx
-
Transparent reporting form
- https://cdn.elifesciences.org/articles/74509/elife-74509-transrepform1-v1.pdf
Download links
A two-part list of links to download the article, or parts of the article, in various formats.
Downloads (link to download the article as PDF)
Open citations (links to open the citations from this article in various online reference manager services)
Cite this article (links to download the citations from this article in formats compatible with various reference manager tools)
Synthetic reconstruction of the hunchback promoter specifies the role of Bicoid, Zelda and Hunchback in the dynamics of its transcription
eLife 11:e74509.
https://doi.org/10.7554/eLife.74509


