Post-translational modification patterns on β-myosin heavy chain are altered in ischemic and nonischemic human hearts
- Department of Biomedical Sciences, College of Medicine, The Florida State University, United States
- Department of Bioengineering, College of Medicine, University of Washington, United States
- Department of Nutrition and Integrative Physiology, The Florida State University, United States
- Translational Science Laboratory, College of Medicine, The Florida State University, United States
- Department of Physiology and Cell Biology, College of Medicine, The Ohio State University, United States
- Department of Surgery, College of Medicine, The Ohio State University, United States
- Department of Biological Science, The Florida State University, United States
Figures
Figure 1 with 1 supplement
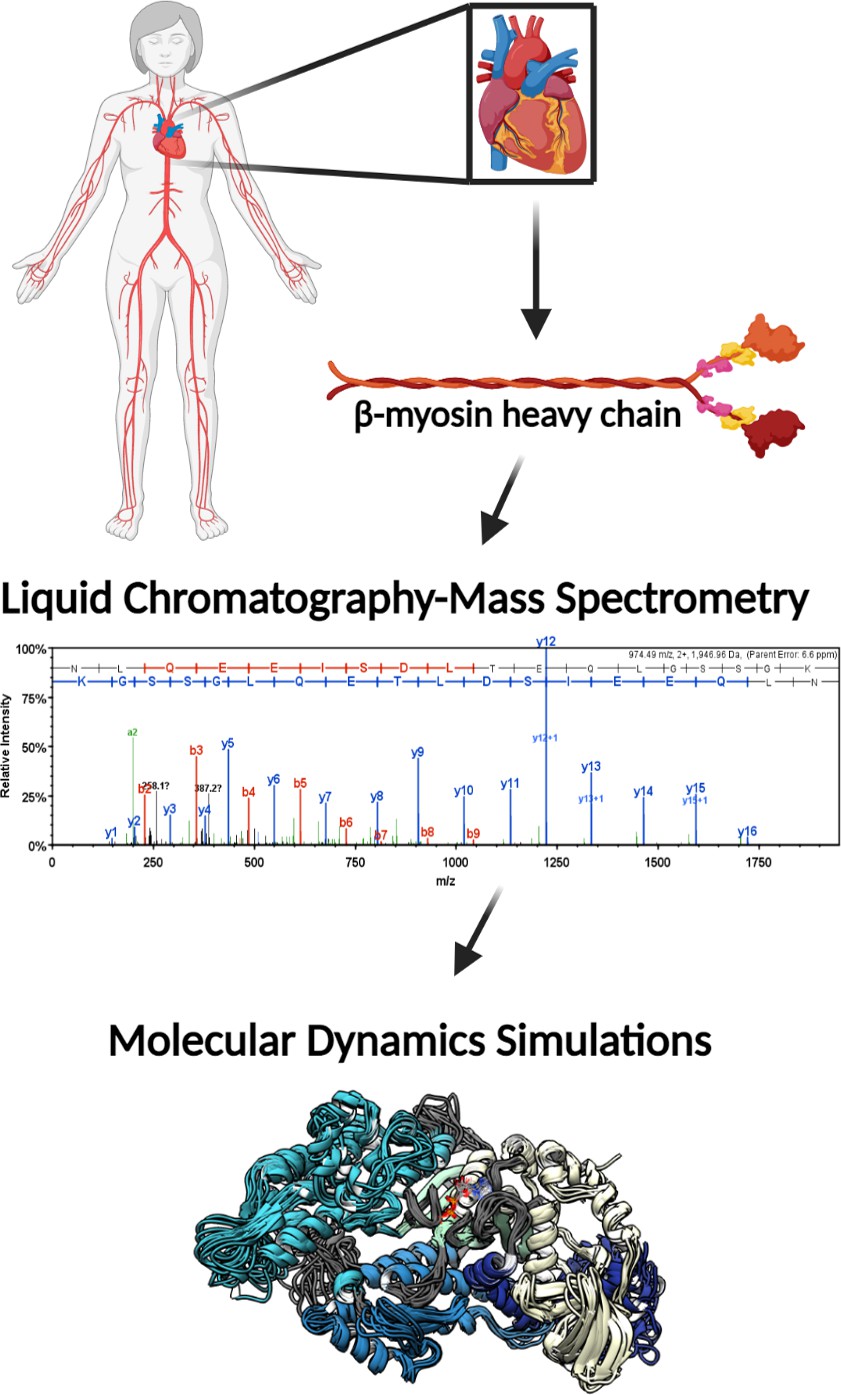
Illustrative schematic of the integrative approaches used to identify novel post-translational modifications (PTMs) on human β-myosin heavy chain (β-MHC) and investigate their roles in cardiac muscle regulation.
De-identified human heart samples were obtained from nonfailing, ischemic heart failure, and nonischemic heart failure patients. The presence of PTMs on human β-MHC was confirmed by liquid chromatography-mass spectrometry (LC/MS). b-ions and y-ions indicate N-terminal and C-terminal ions, respectively. Molecular dynamics (MD) simulations were used to further understand the functional significance of the newly identified PTMs on β-MHC. The schematic was generated using BioRender.com.
Figure 1—figure supplement 1
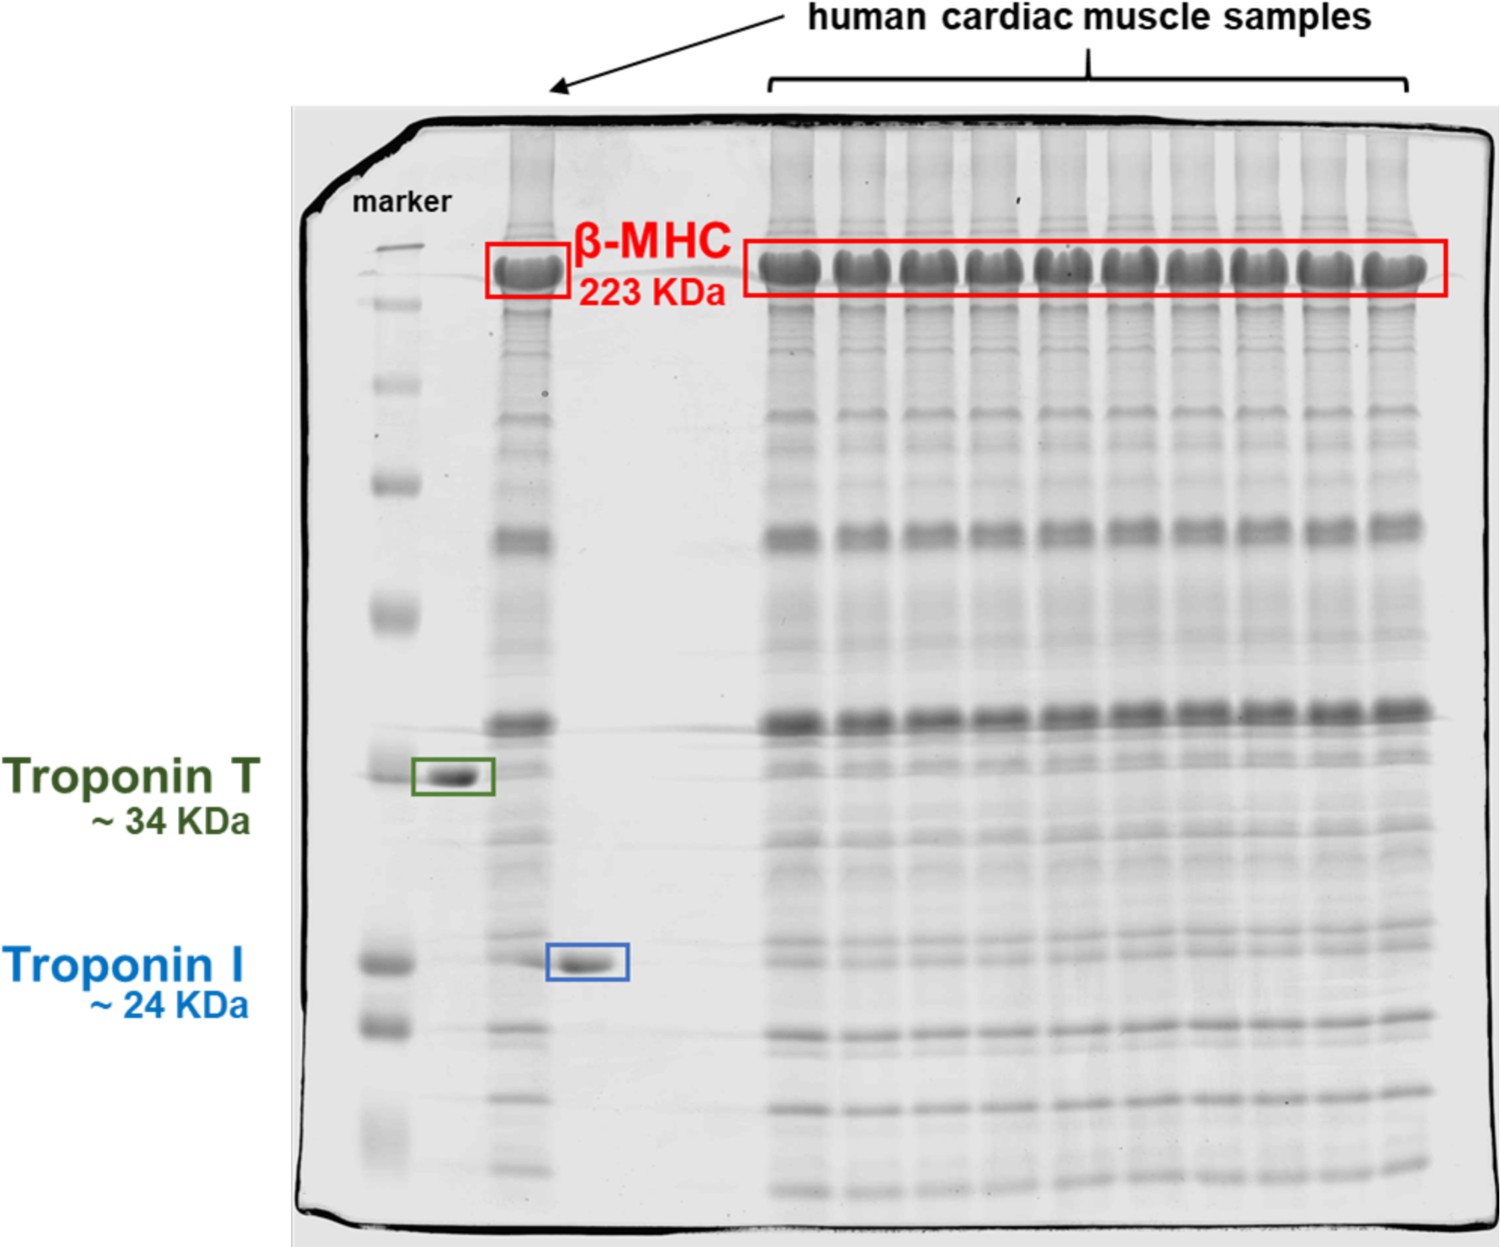
Coomassie-stained gel of homogenized human heart tissues.
The red box indicates the band corresponding to β-myosin heavy chain (β-MHC) in the cardiac human samples analyzed here at the predicted molecular weight of ~223 kDa. The lanes are BioRad Dual marker, troponin T (TnT) (green box, ~34 kDa), cardiac human sample, troponin I (TnI) (blue box, ~24 kDa), 2 blank lanes, then 10 lanes of human cardiac samples.
-
Figure 1—figure supplement 1—source data 1
Source data for Figure 1—figure supplement 1.
- https://cdn.elifesciences.org/articles/74919/elife-74919-fig1-figsupp1-data1-v2.pdf
Figure 2

Detailed mass spectrometry (MS)/MS spectra of acetylated human β-myosin heavy chain (β-MHC) peptide sequences.
MS/MS spectra of trypsin-digested, acetylated β-MHC peptide sequences 24–35 (K34-Ac, m/z 496.61), 55–67 (K58-Ac, m/z 705.84), 414–434 (K429-Ac, m/z 774.41), 942–952 (K951-Ac, m/z 483.57), and 1195–1212 (K1195-Ac, m/z 689.01). b-ions and y-ions indicate N-terminal and C-terminal ions, respectively.
Figure 3

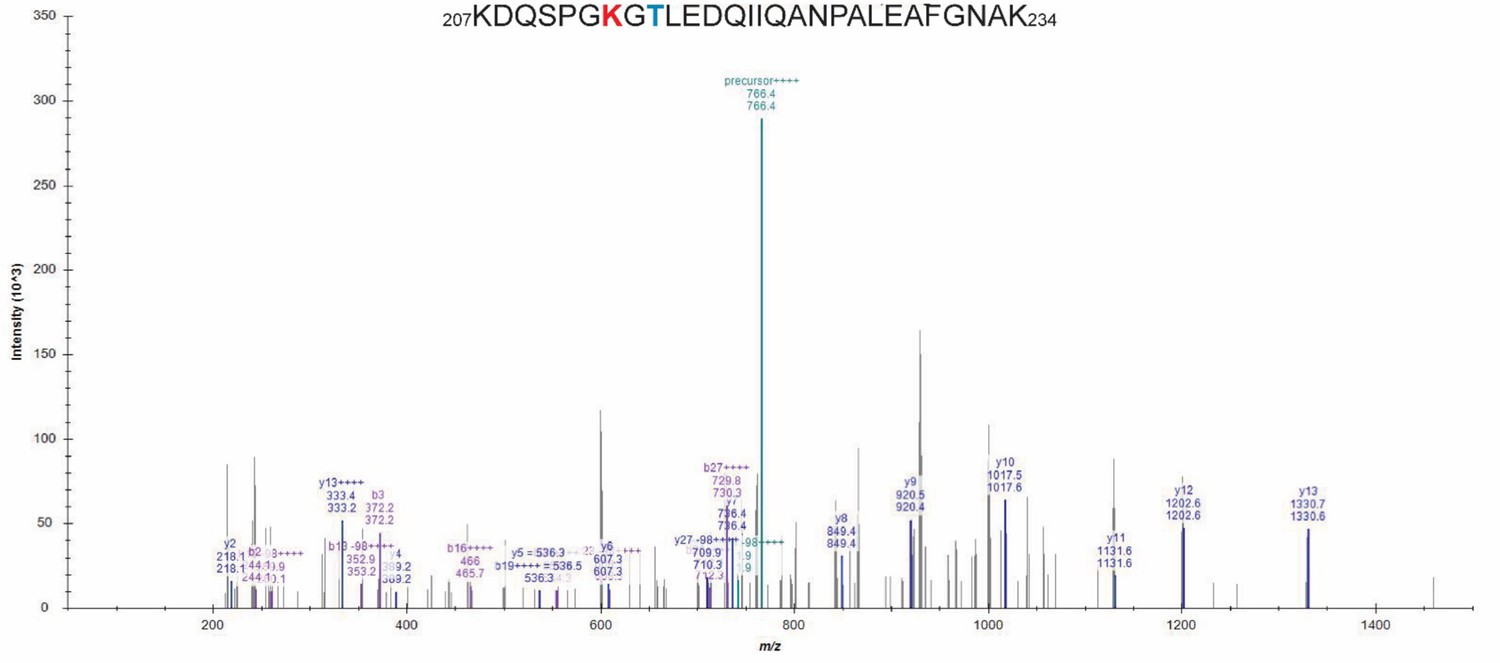
Detailed mass spectrometry (MS/MS) spectra of phosphorylated human β-myosin heavy chain (β-MHC) peptide sequences.
MS/MS specta of trypsin-digested, phosphorylated β-MHC peptide sequences 207–234 (S210-P, m/z 1007.49) and 208–234 (T215-P, m/z 964.80). b-ions and y-ions indicate N-terminal and C-terminal ions, respectively.
Figure 4 with 2 supplements

Structural models of post-translational modifications (PTMs) on β-myosin heavy chain (β-MHC).
X-ray crystal structures of the β-MHC. In (A) a post-rigor X-ray structure was used to model K58-Ac, K213-Ac, T215-P PTMs. The four motor subdomains – the N-terminal domain (yellow), upper 50 kDa domain (cyan), lower 50 kDa domain (light blue), and converter domain (dark blue) – and function sites they form are labeled. Inset highlights the nucleotide-binding pocket and functional loops (loop 1, Switch 1, Switch 2, phosphate-binding loop). (B) An X-ray structure of an S2 fragment was used to model the K951-Ac PTM and served as the initial conformations of molecular dynamics (MD) simulations. In (A, B), residues with reported PTMs are shown and colored red. (C) The colored boxes display side-chain atoms in the vicinity of the modified (red ribbon) residues for K58 (green), K213/T215 (purple), and K951 (pink).
Figure 4—figure supplement 1
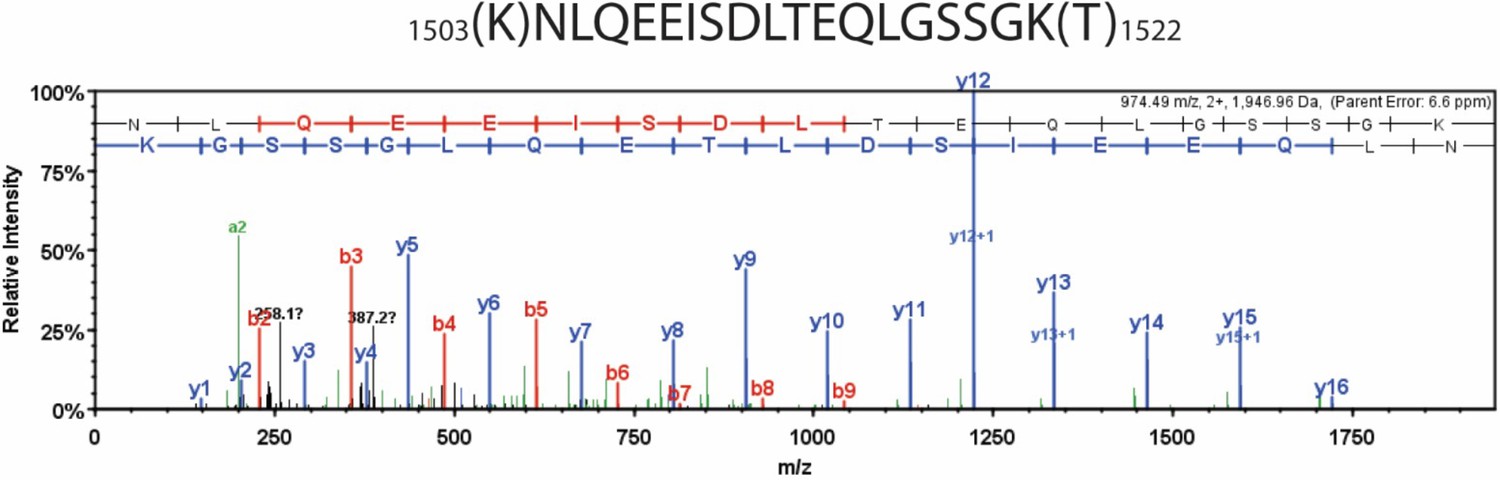
Detailed liquid chromatography-mass spectrometry (MS) spectrum of the common internal peptide sequence (IRP).
MS/MS spectrum of trypsin-digested β-myosin heavy chain (β-MHC) peptide sequence (1504–1521, m/z 974.49). b-ions and y-ions indicate N-terminal and C-terminal ions, respectively.
Figure 4—figure supplement 2
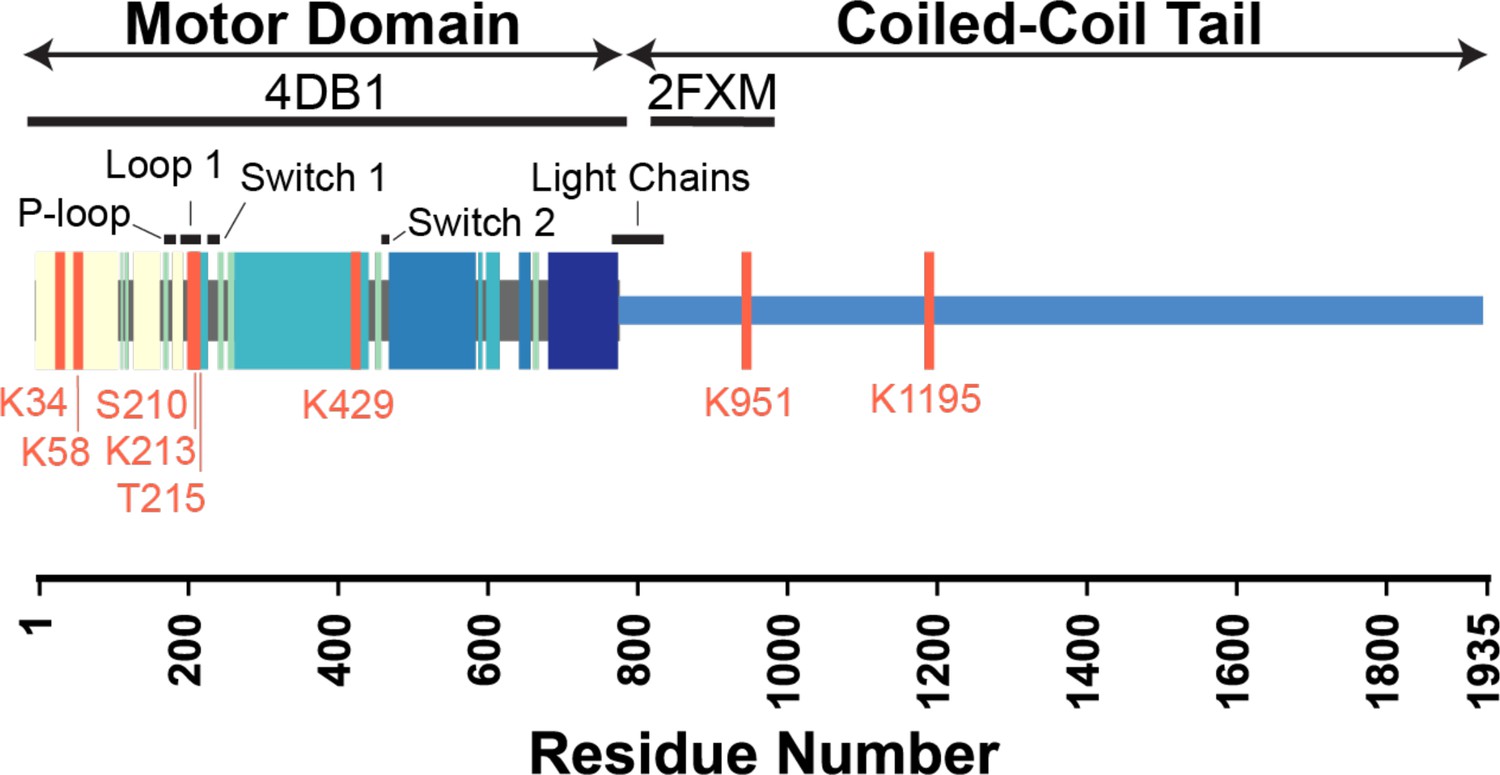
Key functional regions of cardiac β-myosin motor domain and locations of the identified post-translational modifications (PTMs).
The locations of PTMs and functional regions are annotated on a schematic of the β-myosin heavy chain (β-MHC) sequence. PTM sites are denoted with pink lines, and significant structural elements are annotated with black bars. The regions of the sequence modeled in our simulations (4DB1 and 2FXM) are denoted with thick black bars. Colored blocks correspond to structural elements shown in Figure 4A and B.
Figure 5 with 1 supplement
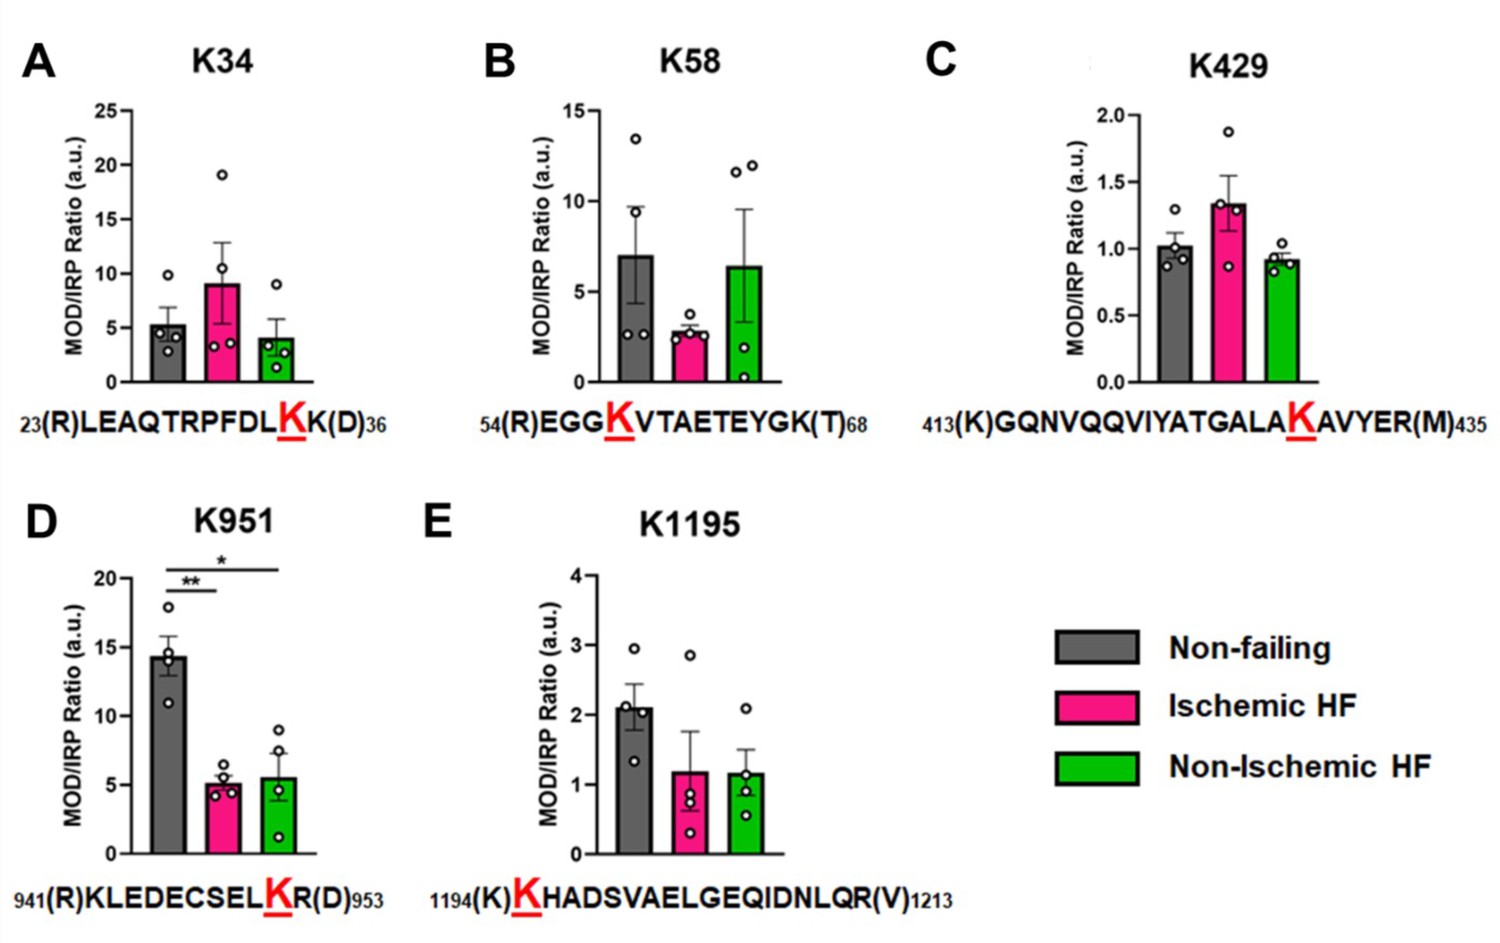
Calculations of post-translational modification (PTM) occupancy of acetylated residues on β-myosin heavy chain (β-MHC).
Peak areas of all modified peptide sequences (MOD) were normalized to the peak area of a common internal reference peptide sequence (IRP, 1504–1521). (A) Peptide 1 sequence is shown with the site of acetylated lysine residue K34 indicated in red. (B) Peptide 2 is shown with the site of acetylated lysine residue K58 indicated in red. (C) Peptide 3 sequence is shown with the acetylated lysine residue K429. (D) Peptide 4 sequence is shown with the acetylated lysine residue K951 in red. (E) Peptide 5 sequence is shown with the acetylated lysine residue K1195 indicated in red. In the histograms, different human heart samples are indicated with nonfailing donor hearts (gray), ischemia-induced heart failure (pink), and nonischemia-induced heart failure (green). Trypsin-cutting sites are shown between parentheses. Data are expressed as mean ± SEM. Statistical analysis was performed by one-way ANOVA, *p<0.05, n = 4.
Figure 5—figure supplement 1
Mass spectrometry (MS/MS) spectrum of the doubly modified peptide sequence.
The K213-Ac/T215-P-modified sequence (207–234, m/z 766.36) presented an isotope dot product (idotp) value below 0.5, which indicates that the modified peptide was detectable but not quantifiable. Acetylated residues are highlighted in red while phosphorylated residues are in blue.
Figure 6
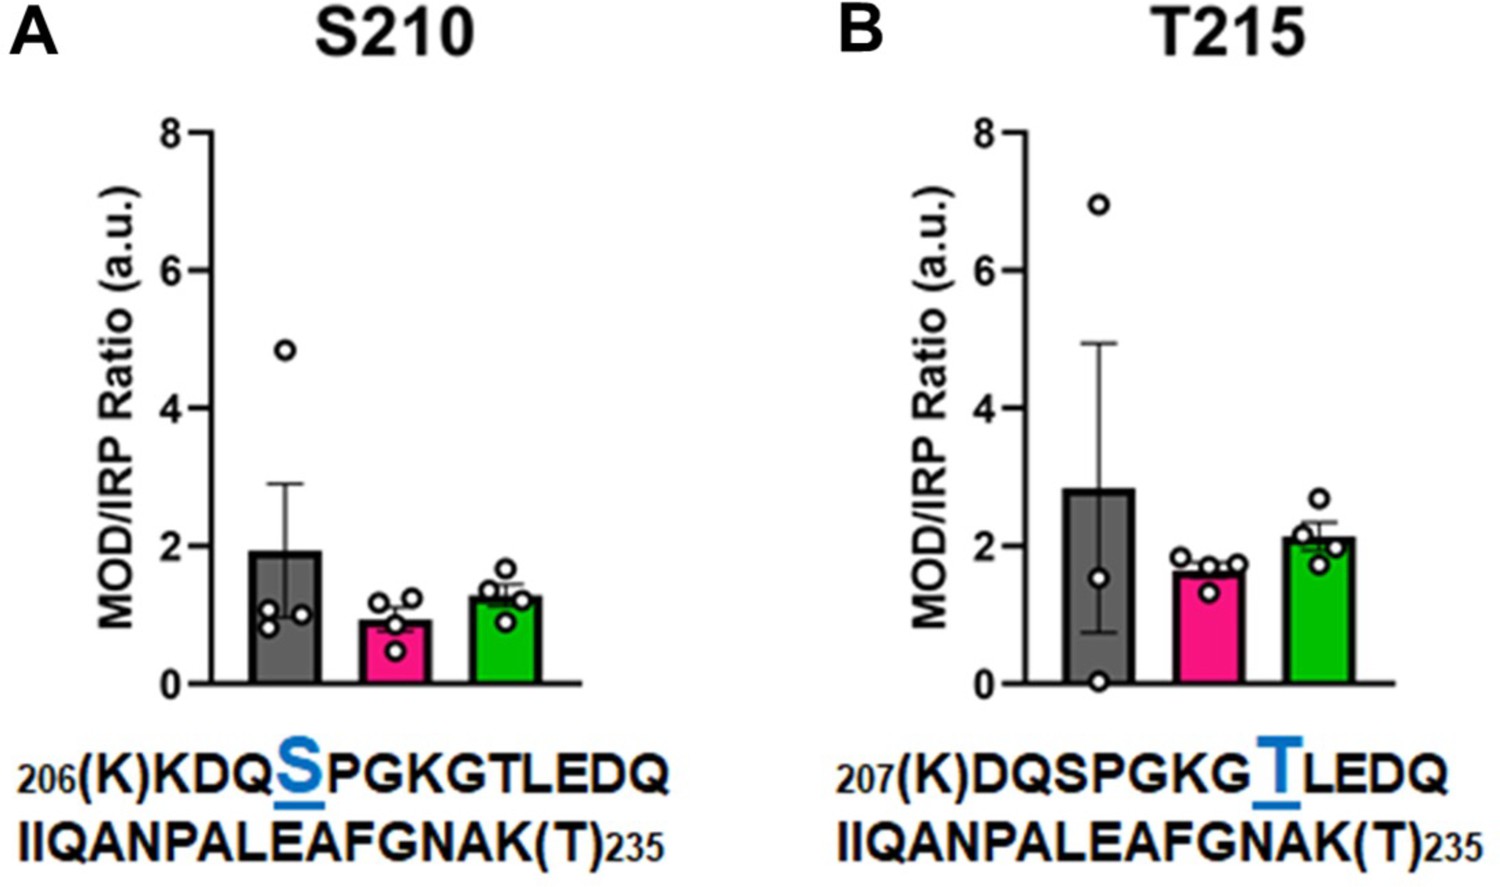
Calculations of post-translational modification (PTM) occupancy of phosphorylated residues on β-myosin heavy chain (β-MHC).
Peak areas of all modified peptide sequences (MOD) were normalized to the peak area of a common internal reference peptide sequence (IRP, 1504–1521). (A) Peptide 1 sequence is shown with phosphorylated serine indicated in blue. (B) Peptide 2 sequence is shown with phosphorylated threonine shown in blue. Trypsin-cutting sites are shown between parentheses. Data are expressed as mean ± SEM. Statistical analysis was performed by one-way ANOVA, n = 3–4.
Figure 7
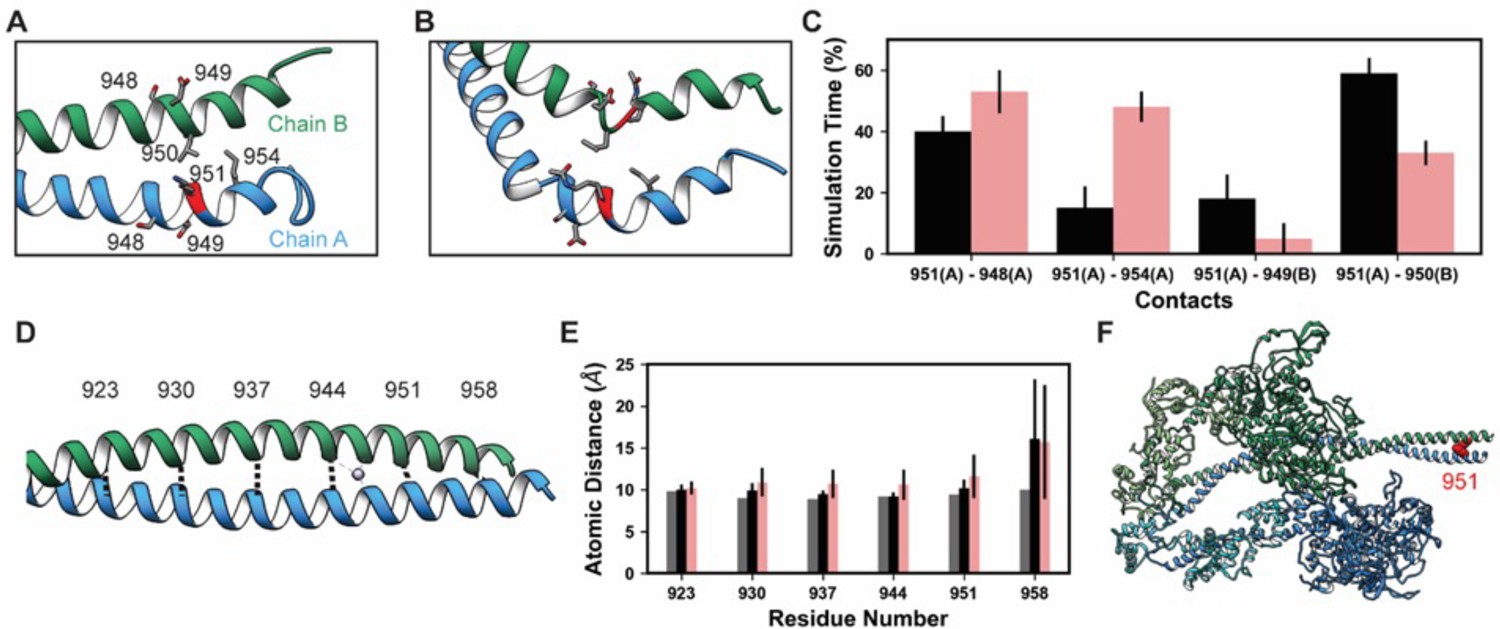
K951-Ac increased flexibility of the myosin tail.
Structural changes in the S2 fragment caused by K951-Ac are shown in representative snapshots from molecular dynamics (MD) simulations. In the snapshots, the ribbon of residue 951 is colored red, chain A is colored blue, and chain B green. The atoms of neighboring side chains are displayed. The coiled-coil structure was preserved in the unmodified simulations (A). In the modified simulations (B), the coiled-coil structure was interrupted by kinks, a loss of α-helix structure, and increased separation of the chains. Collectively, these changes increased the local flexibility of S2. (C) Changes in S2 structure and dynamics caused by K951-Ac were associated with changes in local inter- and intra-chain contacts. (D) The inter-chain distance was monitored at six positions along S2, chosen to align with the heptad repeat position of the modified residue position. Distances between the Cα atoms between these residues were tracked for the X-ray structure (shown) and the MD simulations. (E) K951-Ac increased the inter-helix distance (~1 Å) relative to the unmodified simulations. This effect propagated towards the N-terminal end of the helix. The effect may also propagate towards the C-terminus; however, the structure is truncated at residue 961 and unfolding of the helices occurred in these simulations. (F) In the super-relaxed conformation, the portion of S2 affected by this modification is located nearby the motor domains as indicated on this model (PDB ID: 5TBY).
-
Figure 7—source data 1
Source data for Figure 7.
- https://cdn.elifesciences.org/articles/74919/elife-74919-fig7-data1-v2.xlsx
Figure 8
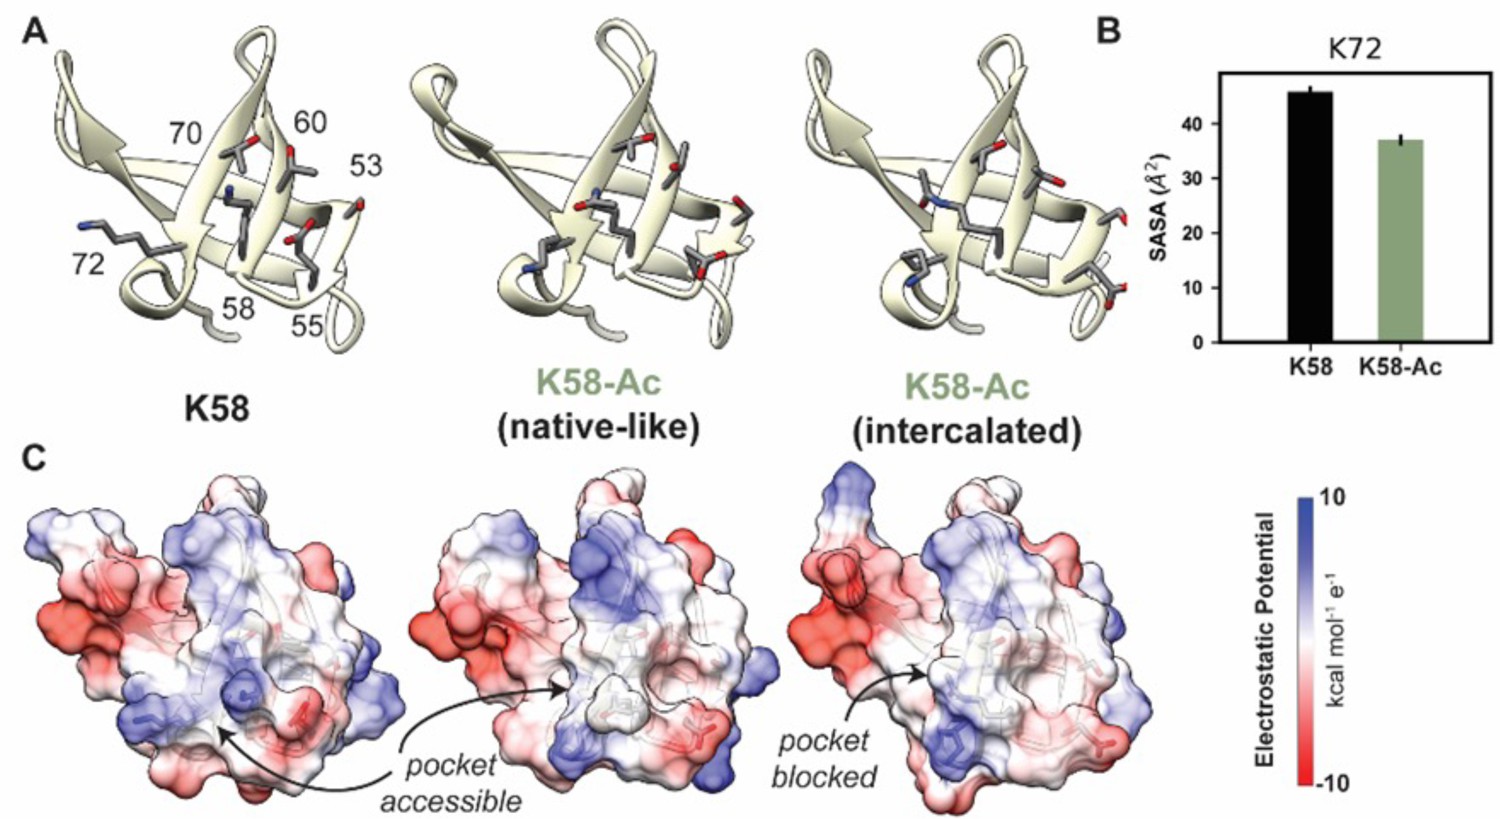
K58-Ac altered the solvent-exposed surface of myosin’s SH3-like domain.
(A) Representative structural changes in the SH3 domain associated with K58-Ac are shown in the endpoint structures of one unmodified (‘K58’) and two modified (‘K58-Ac’) simulations. K58-Ac formed increased interactions with T70, V71, and K72 in the neighboring strand and transiently formed an ‘intercalated’ conformation where the side chain was inserted between T70 and K72. (B) The transiently formed intercalated conformation led to a decrease in the solvent-accessible surface of K72. (C) Modification of K58 also altered the electrostatic potential of the SH3 domain surface, and in the intercalated conformation, K58-Ac blocks a surface pocket. The molecular surfaces in (C) correspond to the same structures shown in (A), and the electrostatic potential was calculated using Chimera’s Coulombic surface coloring method.
-
Figure 8—source data 1
Source data for Figure 8.
- https://cdn.elifesciences.org/articles/74919/elife-74919-fig8-data1-v2.xlsx
Figure 9

K58-Ac/T215-P altered loop 1 structure and dynamics.
Molecular dynamics (MD) snapshots in (A) show representative structures from the unmodified (K213/T215) and modified (K213-Ac/T215-P) simulations. In the unmodified simulations, the loop makes long-lasting interactions with the upper 50 kDa domain (teal) of myosin. In the modified simulations, it became more compact and made fewer interactions with the upper 50 kDa domain. (B) The K213-Ac and T215-P post-translational modification (PTMs) altered the duration of inter-residue contacts made by K213 and T215: fewer interactions were made with the upper 50 kDa domain of myosin and more enduring interactions were made with other loop 1 residues.
-
Figure 9—source data 1
Source data for Figure 9 (contacts).
- https://cdn.elifesciences.org/articles/74919/elife-74919-fig9-data1-v2.xlsx
-
Figure 9—source data 2
Source data for Figure 9 (distances).
- https://cdn.elifesciences.org/articles/74919/elife-74919-fig9-data2-v2.xlsx
Tables
Table 1
Liquid chromatography-mass spectrometry (LC-MS/MS) analysis of trypsin-digested human β-myosin heavy chain (β-MHC) sequences containing acetylated residues.
*An isotope dot product (idotp) value below 0.5 denotes a detectable but not quantifiable peptide sequence. C = carbamidomethyl. Acetylated residues are highlighted in red while phosphorylated residues are in blue.
| Protein | Peptide sequence | Protease | Modified residues | Modification | Calculated molecular mmass | Observed m/z | Observed molecular mass | Error (ppm) | Charge | . idotp |
|---|---|---|---|---|---|---|---|---|---|---|
| β-MHC | 23(R)LEAQTRPFDLKK(D)36 | Trypsin | K34 | Acetylation (+42) | 1487.82 | 496.61 | 1486.82 | 1.3 | 3+ | 0.99 |
| 54(R)EGGKVTAETEYGK(T)68 | Trypsin | K58 | Acetylation (+42) | 1410.67 | 705.84 | 1409.67 | 3.2 | 2+ | 0.91 | |
| 206(K)DQSPGKGTLEDQIIQANPALEAFGNAK(T)235 | Trypsin | K213/T215 | Acetylation (+42) Phosphorylation (+80) | 3061.48 | 766.37 | 3061.48 | 0.0 | 4+ | 0.48* | |
| 413(K)GQNVQQVIYATGALAKAVYER(M)435 | Trypsin | K429 | Acetylation (+42) | 2321.22 | 774.41 | 2320.21 | –3.6 | 3+ | 0.93 | |
| 941(R)KLEDECSELKR(D)953 | Trypsin | K951 | Carbamidomethyl (+57) Acetylation (+42) | 1448.70 | 483.57 | 1447.69 | 0.57 | 3+ | 0.70 | |
| 1194(K)KHADSVAELGEQIDNLQR(V)1213 | Trypsin | K1195 | Acetylation (+42) | 2065.03 | 689.01 | 2064.01 | –7.4 | 3+ | 0.95 |
Table 2
Liquid chromatography-mass spectrometry (LC-MS/MS) analysis of trypsin-digested human β-myosin heavy chain (β-MHC) sequences containing phosphorylated residues.
*An isotope dot product (idotp) value below 0.5 denotes a detectable but not quantifiable peptide sequence. C = carbamidomethyl. Acetylated residues are highlighted in red while phosphorylated residues are in blue.
| Protein | Peptide sequence | Protease | Modified residues | Modification | Calculated molecular mass | Observed m/z | Observed molecular mass | Error (ppm) | Charge | idotp |
|---|---|---|---|---|---|---|---|---|---|---|
| β-MHC | 206(K)KDQSPGKGTLEDQIIQANPALEAFGNAK(T)235 | Trypsin | S210 | Phosphorylation (+80) | 3020.47 | 1007.49 | 3019.46 | –0.96 | 3+ | 0.99 |
| 206(K)KDQSPGKGTLEDQIIQANPALEAFGNAK(T)235 | Trypsin | K213/T215 | Acetylation (+42) Phosphorylation (+80) | 3061.48 | 766.37 | 3061.48 | 0.0 | 4+ | 0.48* | |
| 207(K)DQSPGKGTLEDQIIQANPALEAFGNAK(T)235 | Trypsin | T215 | Phosphorylation (+80) | 2892.37 | 964.80 | 2891.37 | –0.79 | 3+ | 0.99 |
Table 3
Inventory of β-myosin heavy chain (β-MHC) post-translational modification (PTM) simulations.
Each row corresponds to a simulated system and reports the modifications that were made and the extent of molecular dynamics (MD) sampling.
| ID | PDB | Condition | Runs | Length per run(ns) | Net sampling (ns) |
|---|---|---|---|---|---|
| 4DB1 unmodified | 4DB1 | Unmodified | 3 | 500 | 1500 |
| 4DB1 K58-Ac | 4DB1 | K58Ac | 3 | 500 | 1500 |
| 4DB1 K213-Ac/T215-P | 4DB1 | K213Ac, T215P | 3 | 500 | 1500 |
| 2FXM K951 | 2FXM | Unmodified | 3 | 500 | 1500 |
| 2FXM K951-Ac | 2FXM | K951Ac | 3 | 500 | 1500 |
Table 4
Average Cα root mean squared deviation (RMSD) values.
| ID | Run number | Cα RMSD (Å) |
|---|---|---|
| 4DB1 unmodified | 1 | 3.9 ± 0.3 |
| 2 | 3.2 ± 0.3 | |
| 3 | 4.1 ± 0.3 | |
| 4DB1 K58-Ac | 1 | 3.8 ± 0.3 |
| 2 | 3.6 ± 0.2 | |
| 3 | 4.1 ± 0.5 | |
| 4DB1 K213-Ac/T215-P | 1 | 3.5 ± 0.4 |
| 2 | 3.6 ± 0.4 | |
| 3 | 3.6 ± 0.3 | |
| 2FXM unmodified | 1 | 6.9 ± 2.4 |
| 2 | 7.5 ± 2.3 | |
| 3 | 7.2 ± 2.4 | |
| 2FMX K951-Ac | 1 | 10.8 ± 2.8 |
| 2 | 9.2 ± 2.5 | |
| 3 | 10.1 ± 2.0 |
-
Table 4—source data 1
Source data for Table 4.
- https://cdn.elifesciences.org/articles/74919/elife-74919-table4-data1-v2.xlsx
Author response table 1
| K34 | WT | ISC HF | NON-ISC HF | IRP | WT | ISC HF | NON-ISC HF | ||||
|---|---|---|---|---|---|---|---|---|---|---|---|
| 171243328 | 37933984 | 123456288 | 37951213568 | 35468374016 | 36720361472 | WT | ISC HF | NON-ISC HF | |||
| 304486400 | 474435776 | 254883488 | 30835193856 | 24838664192 | 28284686336 | 4.5121964 | 10.486356 | 3.36206625 | |||
| 137056288 | 474435776 | 254883488 | 33189758776 | 22171635712 | 32563331072 | 9.8746387 | 19.100696 | 9.011359892 | |||
| 86855160 | 136785104 | 100508704 | 30544549888 | 38021373952 | 37236039680 | 4.1294752 | 3.2725629 | 1.374162978 | |||
| 2.8435567 | 3.5975845 | 2.699231843 | |||||||||
| AVG | 5.33997 | 9.1143 | 4.111705241 | ||||||||
| K58 | WT | ISC HF | NON-ISC HF | IRP | WT | ISC HF | NON-ISC HF | ||||
| 356371104 | 95448224 | 426329504 | 37951213568 | 35468374016 | 36720361472 | WT | ISC HF | NON-ISC HF | |||
| 414622496 | 58387644 | 338617856 | 30835193856 | 24838664192 | 28284686336 | 9.3902426 | 2.6910798 | 11.61016632 | |||
| 87149368 | 56710632 | 8662002 | 33189758976 | 22171635712 | 32563331072 | 13.446405 | 2.3506757 | 0.233004789 | |||
| 80678968 | 142589216 | 71101432 | 30544549888 | 38021373952 | 37236039680 | 2.6257909 | 2.5582069 | 0.266004789 | |||
| 2.641354 | 3.7502384 | 1.909478898 | |||||||||
| AVG | 7.02595 | 2.83755 | 6.439355856 | ||||||||
| S210 | WT | ISC HF | NON-ISC HF | IRP | WT | ISC HF | NON-ISC HF | ||||
| 37987736 | 30292644 | 32893104 | 37951213568 | 35468374016 | 36720361472 | WT | ISC HF | NON-ISC HF | |||
| 149246768 | 29204212 | 38378992 | 30835193856 | 24838664192 | 29284686336 | 1.0009624 | 0.8540748 | 0.895772881 | |||
| 35820280 | 27507396 | 54357632 | 33189758976 | 22171635712 | 32563331072 | 4.8401437 | 1.1757561 | 1.356882362 | |||
| 25008872 | 18092996 | 45057196 | 30544549888 | 38021373952 | 37236039680 | 1.079257 | 1.240657 | 1.669289664 | |||
| 0.8187671 | 0.4758638 | 1.210004265 | |||||||||
| AVG | 1.93478 | 0.93659 | 1.282006889 | ||||||||
| Y215 | WT | ISC HF | NON-ISC HF | IRP | WT | ISC HF | NON-ISC HF | ||||
| 58306360 | 60397624 | 63556984 | 37951213568 | 35468374016 | 36720361472 | WT | ISC HF | NON-ISC HF | |||
| 214473888 | 43148672 | 60914896 | 30835193856 | 24838664192 | 28284686336 | 1.5363503 | 1.7028586 | 1.730837646 | |||
| 40785388 | 87614824 | 33189758976 | 22171635712 | 32563331072 | 6.9554902 | 1.7371575 | 2.153635196 | ||||
| 1100631.5 | 50358960 | 73574128 | 30544549888 | 38021373952 | 37226039680 | 1.83953 | 2.69059771 | ||||
| 0.0360336 | 1.3244908 | 1.975884886 | |||||||||
| AVG | 2.84262 | 1.65101 | 2.137738859 | ||||||||
| K429 | WT | ISC HF | NON-ISC HF | IRP | WT | ISC HF | NON-ISC HF | ||||
| 38319744 | 66542720 | 34278128 | 37951213568 | 35468374016 | 36720361472 | WT | ISC HF | NON-ISC HF | |||
| 39962528 | 31968566 | 25058588 | 30835193856 | 24828664192 | 28284686336 | 1.0097106 | 1.8761142 | 0.933491029 | |||
| 30577718 | 29568352 | 33888364 | 33189758976 | 22171635712 | 32563331072 | 1.2960038 | 1.2870485 | 0.885941873 | |||
| 26531748 | 32985240 | 30807246 | 30544549888 | 38021373952 | 37236039680 | 0.9212998 | 1.3336117 | 1.040690952 | |||
| 0.8686246 | 0.8675447 | 0.82735023 | |||||||||
| AVG | 1.02391 | 1.34108 | 0.921868521 | ||||||||
| K951 | WT | ISC HF | NON-ISC HF | IRP | WT | ISC HF | NON-ISC HF | ||||
| 554000765 | 156454688 | 274431584 | 37951213568 | 35468374016 | 36720361472 | WT | ISC HF | NON-ISC HF | |||
| 431275680 | 104078096 | 254465008 | 30835193856 | 24838664192 | 28284686336 | 14.597709 | 4.411104 | 7.473555345 | |||
| 594530432 | 143491840 | 150870720 | 33189758976 | 22171635712 | 32563331072 | 13.986475 | 4.1901648 | 8.996564607 | |||
| 334659520 | 210390240 | 44803980 | 3.05446E+11 | 38021373952 | 37236039680 | 17.913069 | 6.4718653 | 4.633147624 | |||
| 10.95644 | 5.5334728 | 1.203242353 | |||||||||
| AVG | 14.3634 | 5.15165 | 5.576627007 | ||||||||
| K1195 | WT | ISC HF | NON-ISC HF | IRP | WT | ISC HF | NON-ISC HF | ||||
| 77233384 | 30782836 | 20483700 | 37951213568 | 35468374016 | 36720361472 | WT | ISC HF | NON-ISC HF | |||
| 90984128 | 70924552 | 59125832 | 30835193856 | 24838664192 | 28284686336 | 2.0350702 | 0.8678953 | 0.557829476 | |||
| 44304144 | 16460342 | 29519324 | 33189758976 | 22171635712 | 32563331072 | 2.9506585 | 2.8554093 | 2.09038316 | |||
| 64847704 | 11629701 | 423826652 | 30544569888 | 38021373952 | 37236039680 | 1.3348739 | 0.7424054 | 0.906520403 | |||
| 2.1230532 | 0.3058727 | 1.138215889 | |||||||||
| AVG | 2.11091 | 1.1929 | 1.173237232 |
Additional files
-
Supplementary file 1
Summary of the patients’ demographic features.
Deidentified human heart samples were obtained from nonfailing, ischemic heart failure, and nonischemic heart failure patients.
- https://cdn.elifesciences.org/articles/74919/elife-74919-supp1-v2.docx
-
Supplementary file 2
Comparison of location of residues bearing post-translational modifications (PTMs) with known cardiomyopathy variants in MYH7.
List of potential pathogenicity of the variants and their location within nearby PTM regions. Cardiomyopathy-loop (CM-loop), likely pathogenic (LP), pathogenic (P), hypertrophic cardiomyopathy (HCM), and dilated cardiomyopathy (DCM).
- https://cdn.elifesciences.org/articles/74919/elife-74919-supp2-v2.docx
-
Transparent reporting form
- https://cdn.elifesciences.org/articles/74919/elife-74919-transrepform1-v2.pdf
Download links
A two-part list of links to download the article, or parts of the article, in various formats.
Downloads (link to download the article as PDF)
Open citations (links to open the citations from this article in various online reference manager services)
Cite this article (links to download the citations from this article in formats compatible with various reference manager tools)
Post-translational modification patterns on β-myosin heavy chain are altered in ischemic and nonischemic human hearts
eLife 11:e74919.
https://doi.org/10.7554/eLife.74919


