Cryo-sensitive aggregation triggers NLRP3 inflammasome assembly in cryopyrin-associated periodic syndrome
- Division of Inflammation Research, Center for Molecular Medicine, Jichi Medical University, Japan
Figures
Figure 1 with 1 supplement
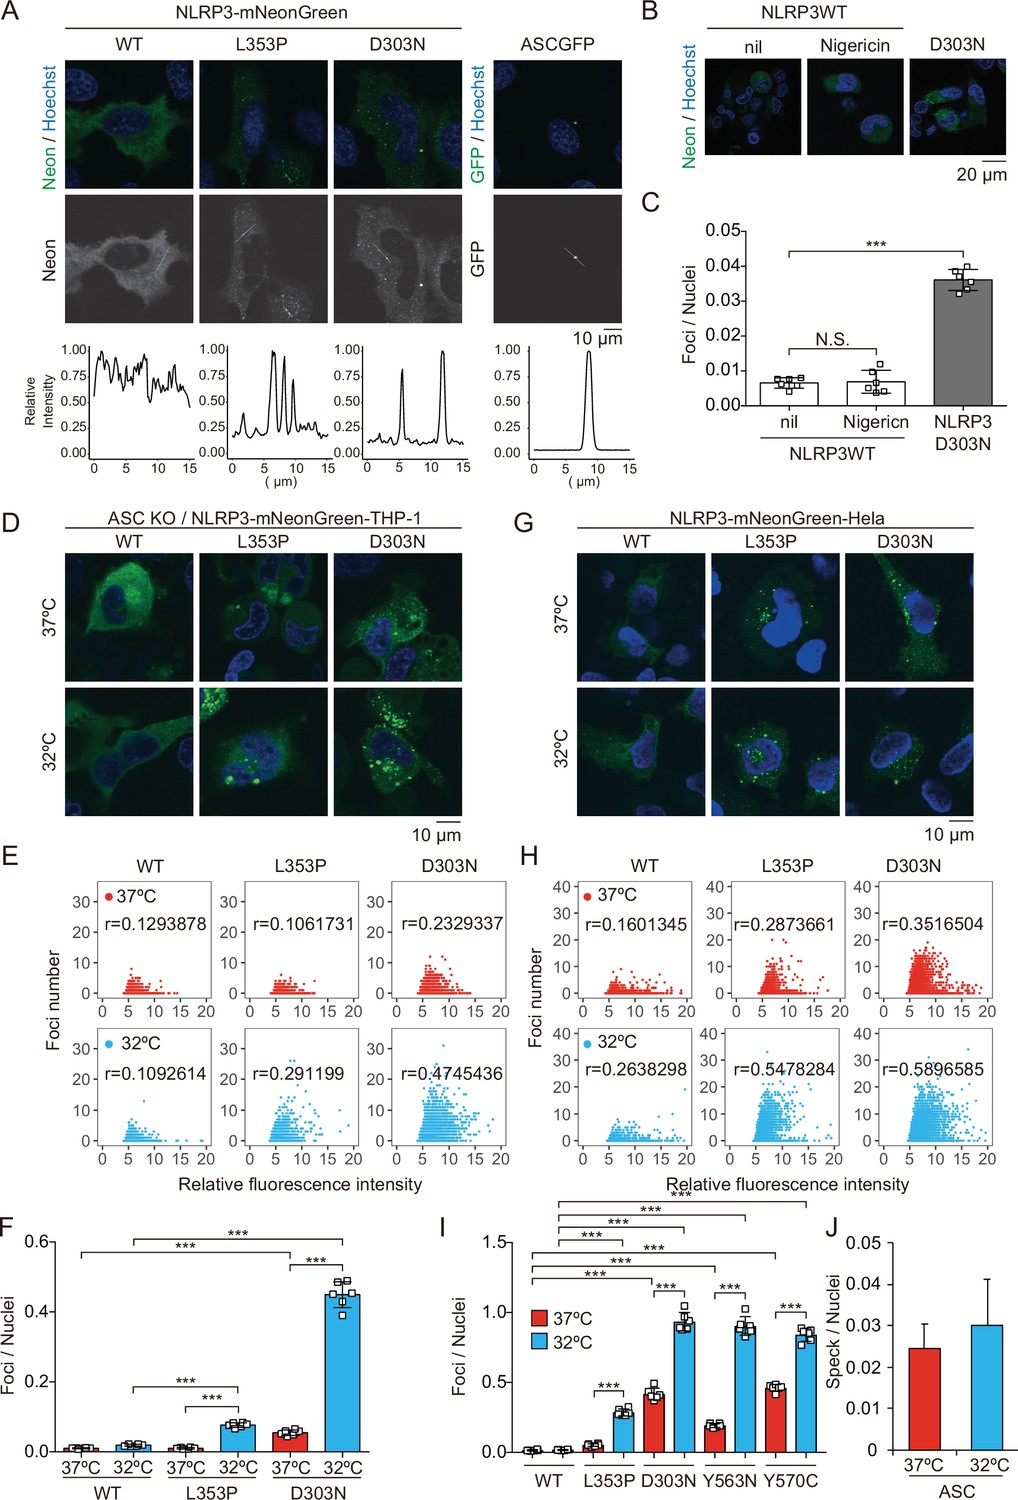
Cryopyrin-associated periodic syndrome-associated NLRP3 mutants form cryo-sensitive foci.
(A) EF1-NLRP3-WT-, NLRP3-L353P-, or NLRP3-D303N-mNeonGreen-HeLa cells or EF1-ASC-GFP-HeLa cells were analyzed by confocal microscopy. Line profiles of foci or specks in the images were analyzed. (B and C) ASC KO/EF1-NLRP3-WT- or NLRP3-D303N-mNeonGreen-THP-1 cells were differentiated with 200 nM phorbol-12-myristate-13-acetate for 24 hr and then treated with nigericin for 6 hr. (B) Representative images by confocal microscopy. (C) The number of foci was counted by high-content analysis. (D–F) Differentiated ASC KO/EF1-NLRP3-WT-, NLRP3-L353P-, or NLRP3-D303N-mNeonGreen-THP-1 cells were cultured at 37 or 32°C for 24 hr. (G–I) EF1-NLRP3-WT-, NLRP3-L353P-, NLRP3-D303N-, NLRP3-Y563N-, or NLRP3-Y570C-mNeonGreen-HeLa cells were cultured at 37 or 32°C for 24 hr. (D and G) Representative images by confocal microscopy. (E, F, H, and I) The number of foci and the fluorescence intensity of the cells were analyzed by high-content analysis. Pearson correlation coefficients are shown. (J) EF1-ASC-GFP-HeLa cells were cultured at 37 or 32°C for 24 hr. The number of nuclei and speck was counted. (C, F, I, and J) Data are expressed as the mean ± SD. ***p<0.005 as determined by two-way ANOVA with a post hoc test. Data are representative of three independent experiments. WT, wild type.
-
Figure 1—source data 1
Source data for Figure 1E.
- https://cdn.elifesciences.org/articles/75166/elife-75166-fig1-data1-v2.txt
-
Figure 1—source data 2
Source data for Figure 1H.
- https://cdn.elifesciences.org/articles/75166/elife-75166-fig1-data2-v2.txt
-
Figure 1—source data 3
Source data for Figure 1J.
- https://cdn.elifesciences.org/articles/75166/elife-75166-fig1-data3-v2.csv
Figure 1—figure supplement 1
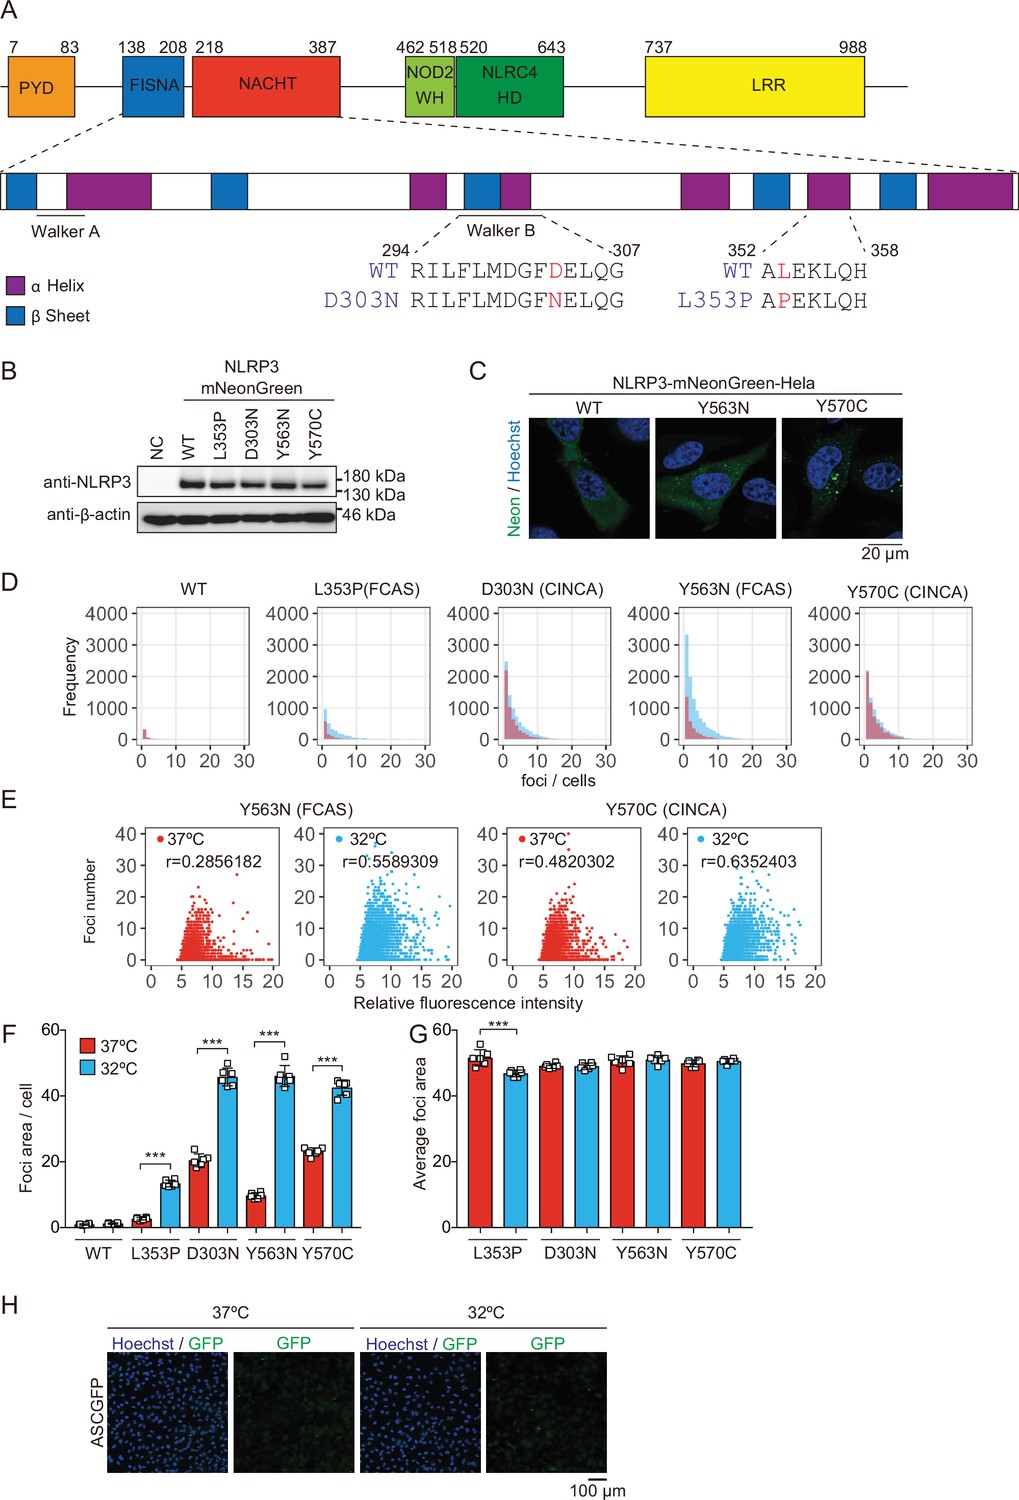
Expression of NLRP3-mNeonGreen and apoptosis-associated speck-like protein containing a caspase recruitment domain (ASC)-GFP.
(A) Amino acid sequence of chronic infantile neurological, cutaneous, and articular syndrome (CINCA)-associated D303N mutant and familial cold autoinflammatory syndrome (FCAS)-associated L353P mutant. (B) Lysates of EF1-NLRP3-WT-, NLRP3-L353P-, NLRP3-D303N, NLRP3-Y563N, or NLRP3-Y570C-mNeonGreen-HeLa cells were analyzed by western blot. (C) EF1-NLRP3-WT-, NLRP3-Y563N-, or NLRP3-Y570C-mNeonGreen-HeLa cells were analyzed by confocal microscopy. (D–G) EF1-NLRP3-WT-, NLRP3-L353P-, NLRP3-D303N-, NLRP3-Y563N-, or NLRP3-Y570C-mNeonGreen-HeLa cells were cultured at 37 or 32°C for 24 hr. The number and area of the foci, and the fluorescence intensity of the cells were analyzed by high-content analysis. (D) The histogram of foci number in foci-positive cells. (E) The scatter plot of relative fluorescence intensity and foci number in each group. (F) Relative foci area per cell and (G) average foci area were quantified. (H) EF1-ASC-GFP-HeLa cells were cultured at 37 or 32°C for 24 hr. Representative image of confocal microscopy. (F and G) Data are expressed as the mean ± SD. ***p<0.005 as determined by two-way ANOVA with a post hoc test. Data are representative of two or three independent experiments. WT, wild type.
-
Figure 1—figure supplement 1—source data 1
Source data for Figure 1—figure supplement 1B.
- https://cdn.elifesciences.org/articles/75166/elife-75166-fig1-figsupp1-data1-v2.zip
Figure 2 with 2 supplements
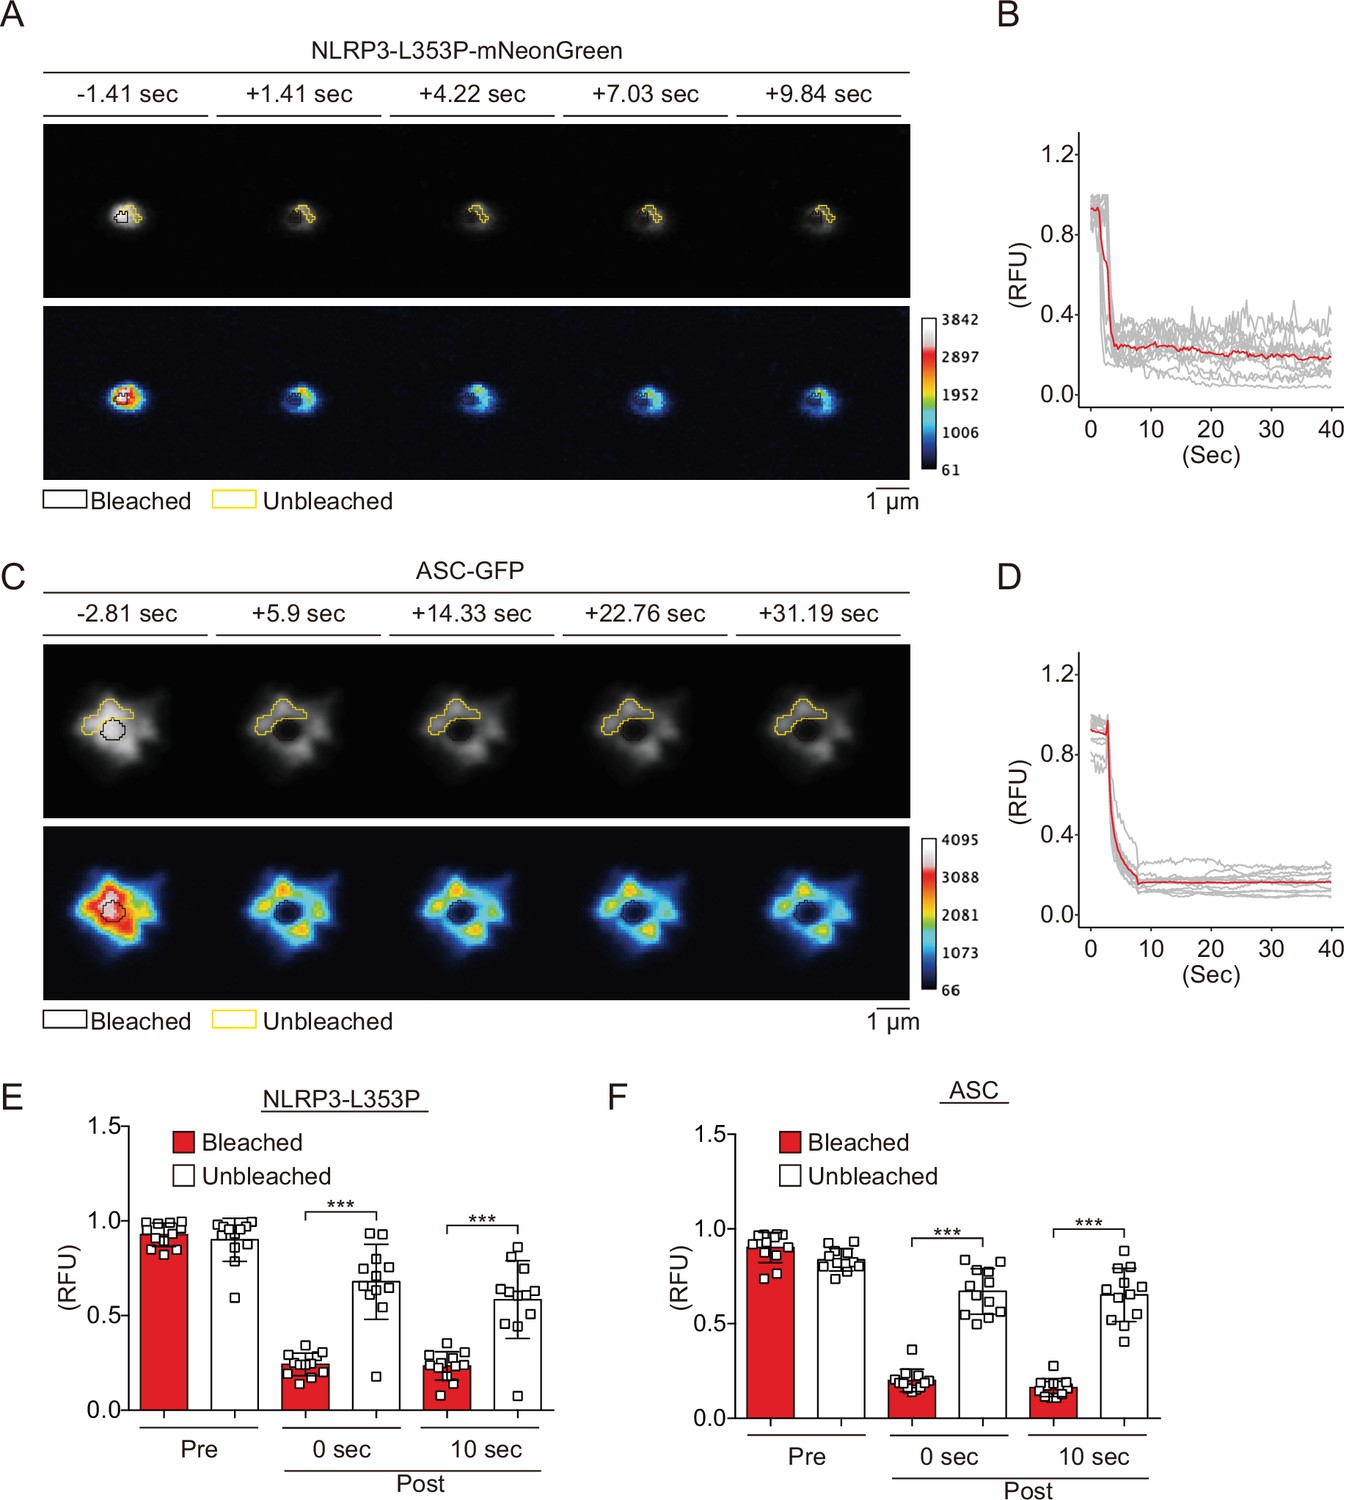
Cryopyrin-associated periodic syndrome-associated NLRP3 mutants form aggregates.
(A–F) EF1-NLRP3-L353P-mNeonGreen- or EF1-ASC-GFP-HeLa cells were cultured at 32°C for 24 hr. Foci or specks in the cells were analyzed by fluorescence recovery after photobleaching. Representative images of (A) foci formed by NLRP3-L353P-mNeonGreen or (C) specks formed by apoptosis-associated speck-like protein containing a caspase recruitment domain (ASC)-GFP before and after photobleaching. The bleached and unbleached areas are shown in black lines and yellow lines, respectively. Plots of relative fluorescence units during photobleaching of (B and E) NLRP3-L353Pm-NeonGreen (n=12) and (D and F) ASC specks (n=12). (B and D) The red line represents mean values, and the gray lines represent each measurement. (E and F) Data are expressed as the mean ± SD. ***p<0.005 as determined by two-way ANOVA with a post hoc test. Data are from three independent live-cell imaging.
-
Figure 2—source data 1
Source data for Figure 2B.
- https://cdn.elifesciences.org/articles/75166/elife-75166-fig2-data1-v2.txt
-
Figure 2—source data 2
Source data for Figure 2D.
- https://cdn.elifesciences.org/articles/75166/elife-75166-fig2-data2-v2.txt
Figure 2—figure supplement 1
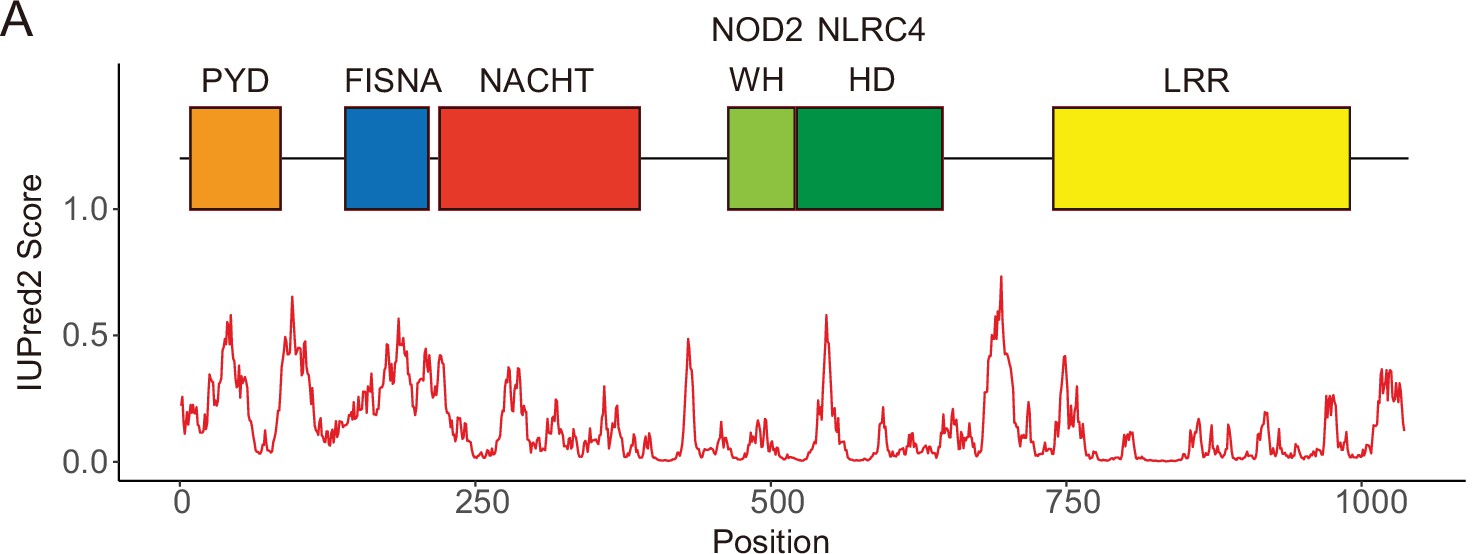
Domains composing NLRP3.
(A) IUPred score of NLRP3 and domains in human NLRP3. PYD, pyrin domain; FISNA, fish-specific NACHT associated domain; NACHT, NACHT domain; WH, winged helix domain; HD, helical domain; LRR, leucine rich repeat.
Figure 2—figure supplement 2
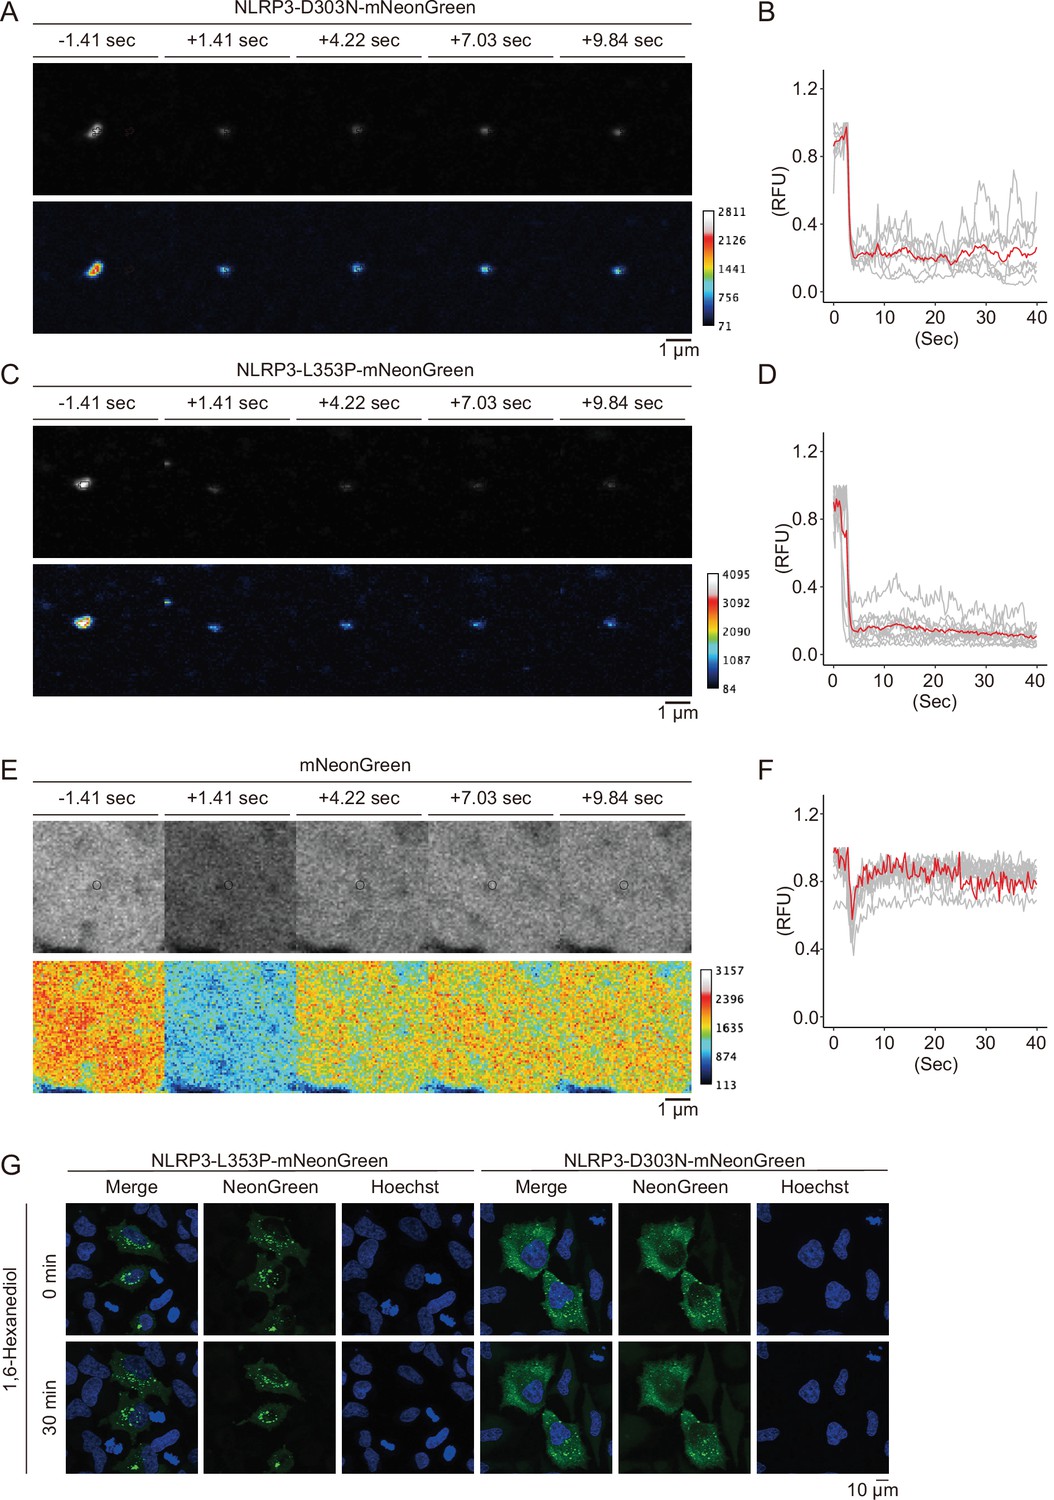
Cryopyrin-associated periodic syndrome-associated NLRP3 mutants form aggregates.
(A–D) EF1-NLRP3-L353P-, or NLRP3-D303N-mNeonGreen-HeLa cells were cultured at 32°C for 24 hr. Foci in the cells were analyzed by fluorescence recovery after photobleaching (FRAP). Representative images of foci formed (A) by NLRP3-D303N-mNeonGreen or (C) by NLRP3-L353P-mNeonGreen before and after photobleaching. The bleached area and unbleached area are shown in black lines and yellow lines, respectively. Plot of relative fluorescence unit during photobleaching of (B) NLRP3-D303N-mNeonGreen (n=7) and (D) NLRP3-L353P-mNeonGreen (n=10). The red line represents the mean value, and the gray lines represent each measurement. Data are from two or three independent live-cell imaging. (E and F) mNeonGreen-HeLa cells were analyzed by FRAP. (E) Representative images of mNeonGreen before and after photobleaching. The targeted area is shown by black circle. (F) Plot of relative fluorescence unit during photobleaching of mNeonGreen (n=10). The red line represents the mean value, and the gray lines represent each measurement. (G) EF1-NLRP3-L353P- or NLRP3-D303N-mNeonGreen-HeLa cells were treated with 5% 1,6-hexanediol for 30 min. Representative images of live-cell imaging.
-
Figure 2—figure supplement 2—source data 1
Source data for Figure 2—figure supplement 2B.
- https://cdn.elifesciences.org/articles/75166/elife-75166-fig2-figsupp2-data1-v2.txt
-
Figure 2—figure supplement 2—source data 2
Source data for Figure 2—figure supplement 2F.
- https://cdn.elifesciences.org/articles/75166/elife-75166-fig2-figsupp2-data2-v2.txt
Figure 3 with 1 supplement

Aggregates formed by cryopyrin-associated periodic syndrome-associated NLRP3 mutant are the scaffold for inflammasome activation.
(A–C) EF1-ASC-BFP/TRE-NLRP3-WT or L353P-mNeonGreen-THP-1 cells were treated with doxycycline (DOX). (A) Localization of apoptosis-associated speck-like protein containing a caspase recruitment domain (ASC) and NLRP3 was analyzed by confocal microscopy. (B) The number of foci was counted. (C) The ASC-speck number in NLRP3 foci was analyzed. (D and E) TRE-NLRP3-L353P-THP-1 cells were differentiated with phorbol-12-myristate-13-acetate (PMA) for 24 hr and then treated with DOX (30 ng/mL) at 37 or 32°C for 6 hr. (D) Triton X-soluble and triton X-insoluble fractions were analyzed by western blot. (E) Oligomerized ASC in Triton X-insoluble fractions was crosslinked with bis(sulfosuccinimidyl)suberate (BS3) and analyzed by western blot. (F) Differentiated TRE-NLRP3-L353P-THP-1 cells were treated with nigericin at 37 or 32°C for 6 hr. Triton X-insoluble fractions were crosslinked with BS3 and analyzed by western blot. (G) EF-1-ASC-GFP/TRE-NLRP3-L353P-THP-1 cells were differentiated with PMA for 24 hr and then treated with DOX (30 ng/mL) at 37 or 32°C for 6 hr. Representative images by confocal microscopy and the number of nuclei and specks were counted. (H) Differentiated TRE-NLRP3-L353P-THP-1 cells were treated with DOX at 37 or 32°C for 6 hr. The IL-1β levels in the supernatants were assessed by ELISA (n=3). (B, C and H) Data are expressed as the mean ± SD. **p<0.01 and ***p<0.005 as determined by (B, C, and H) two-way ANOVA with a post hoc test or (G) Fisher’s exact test with the Holm correction. Data are representative of two or three independent experiments.
-
Figure 3—source data 1
Source data for Figure 3D.
- https://cdn.elifesciences.org/articles/75166/elife-75166-fig3-data1-v2.zip
-
Figure 3—source data 2
Source data for Figure 3E.
- https://cdn.elifesciences.org/articles/75166/elife-75166-fig3-data2-v2.zip
-
Figure 3—source data 3
Source data for Figure 3F.
- https://cdn.elifesciences.org/articles/75166/elife-75166-fig3-data3-v2.zip
-
Figure 3—source data 4
Source data for Figure 3G.
- https://cdn.elifesciences.org/articles/75166/elife-75166-fig3-data4-v2.csv
Figure 3—figure supplement 1
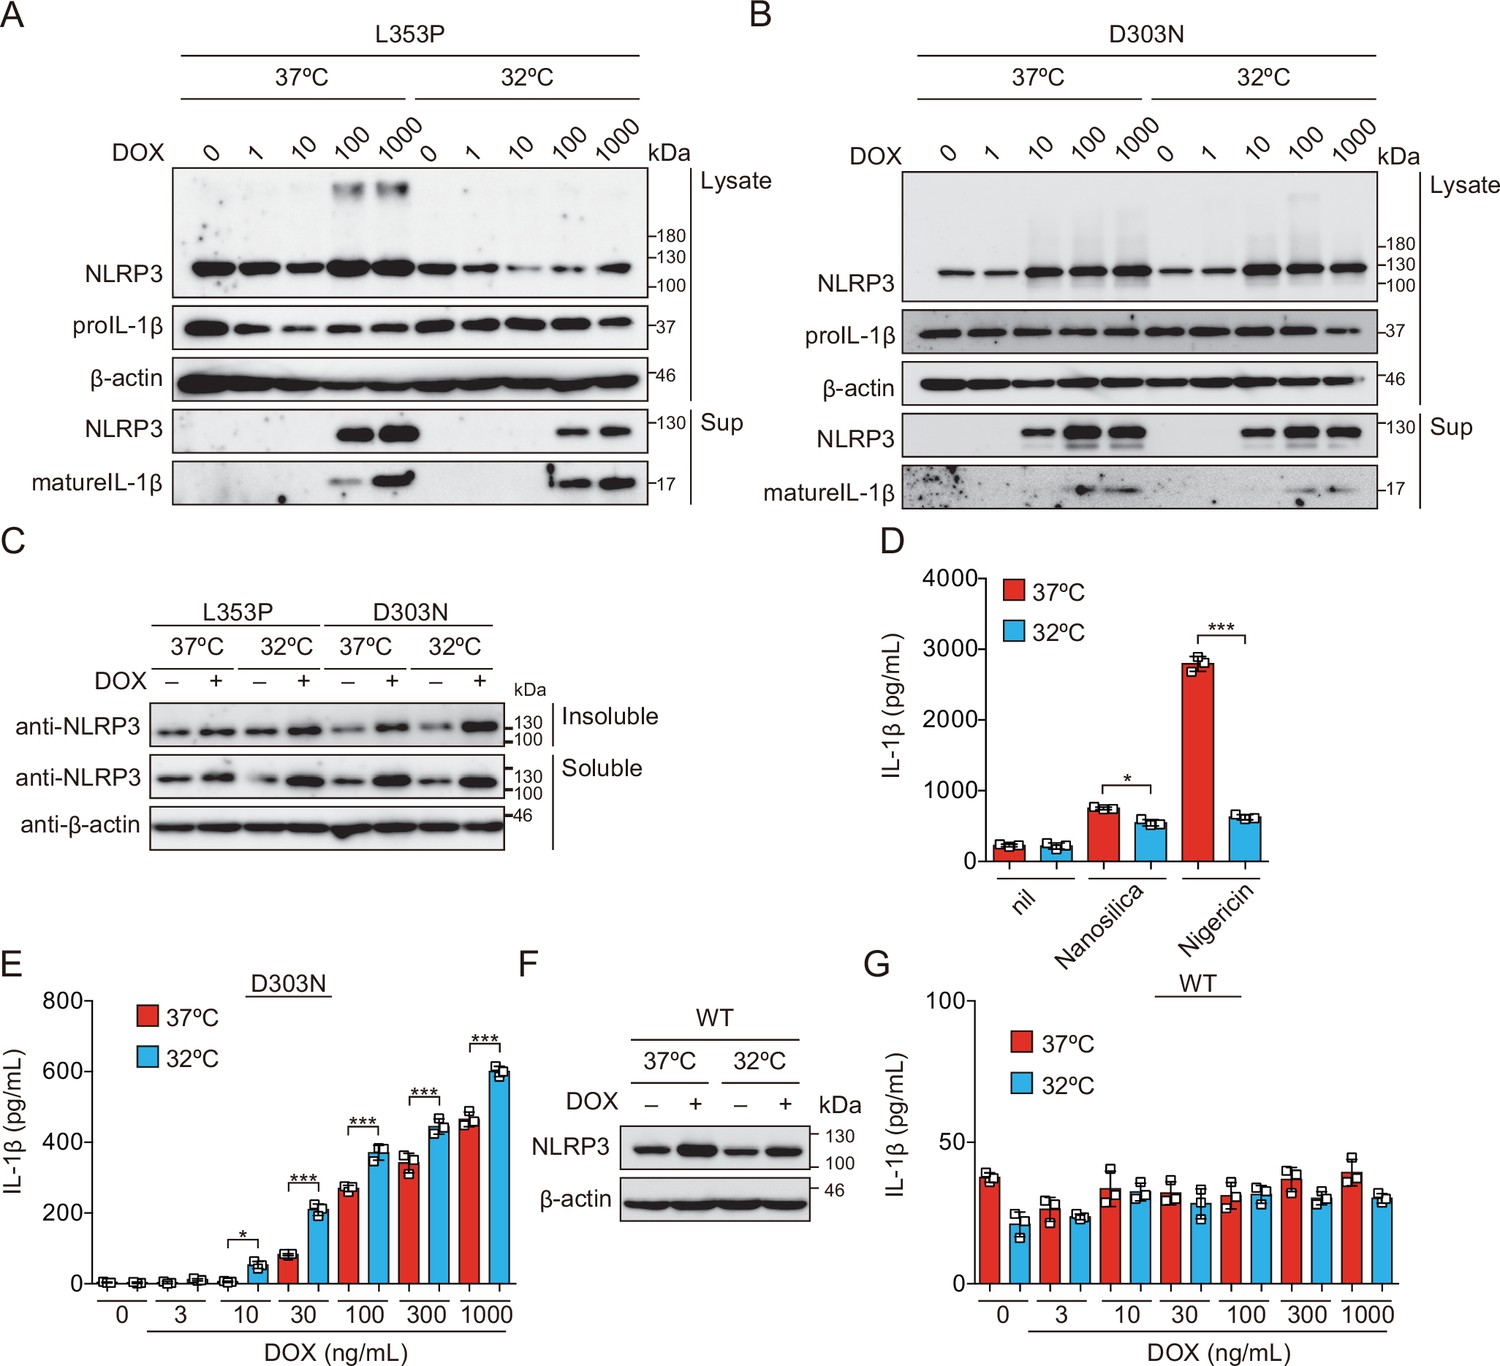
Cold exposure enhances IL-1β release in NLRP3 familial cold autoinflammatory syndrome mutant-expressing cells.
(A) TRE-NLRP3-L353P- or (B and E) NLRP3-D303N- or (C) ASC KO/TRE-NLRP3-L353P- or (F and G) NLRP3WT-THP-1 cells were differentiated with phorbol-12-myristate-13-acetate for 24 hr and then treated with doxycycline (DOX) at 37 or 32°C for 6 hr. (D) Differentiated TRE-NLRP3-L353P-THP-1 cells were treated with 5 µM nigericin or nanosilica (30 µg/mL) at 37 or 32°C for 6 hr. (A, B, C, and F) Lysates and supernatants were analyzed by western blot. (D, E, and G) The levels of IL-1β in the supernatants were assessed by ELISA (n=3). Data are expressed as the mean ± SD. *p<0.05, **p<0.01, and ***p<0.005 as determined by two-way ANOVA with a post hoc test. Data are representative of two or three independent experiments.
-
Figure 3—figure supplement 1—source data 1
Source data for Figure 3—figure supplement 1A.
- https://cdn.elifesciences.org/articles/75166/elife-75166-fig3-figsupp1-data1-v2.zip
-
Figure 3—figure supplement 1—source data 2
Source data for Figure 3—figure supplement 1B.
- https://cdn.elifesciences.org/articles/75166/elife-75166-fig3-figsupp1-data2-v2.zip
-
Figure 3—figure supplement 1—source data 3
Source data for Figure 3—figure supplement 1C.
- https://cdn.elifesciences.org/articles/75166/elife-75166-fig3-figsupp1-data3-v2.zip
-
Figure 3—figure supplement 1—source data 4
Source data for Figure 3—figure supplement 1F.
- https://cdn.elifesciences.org/articles/75166/elife-75166-fig3-figsupp1-data4-v2.zip
Figure 4 with 1 supplement
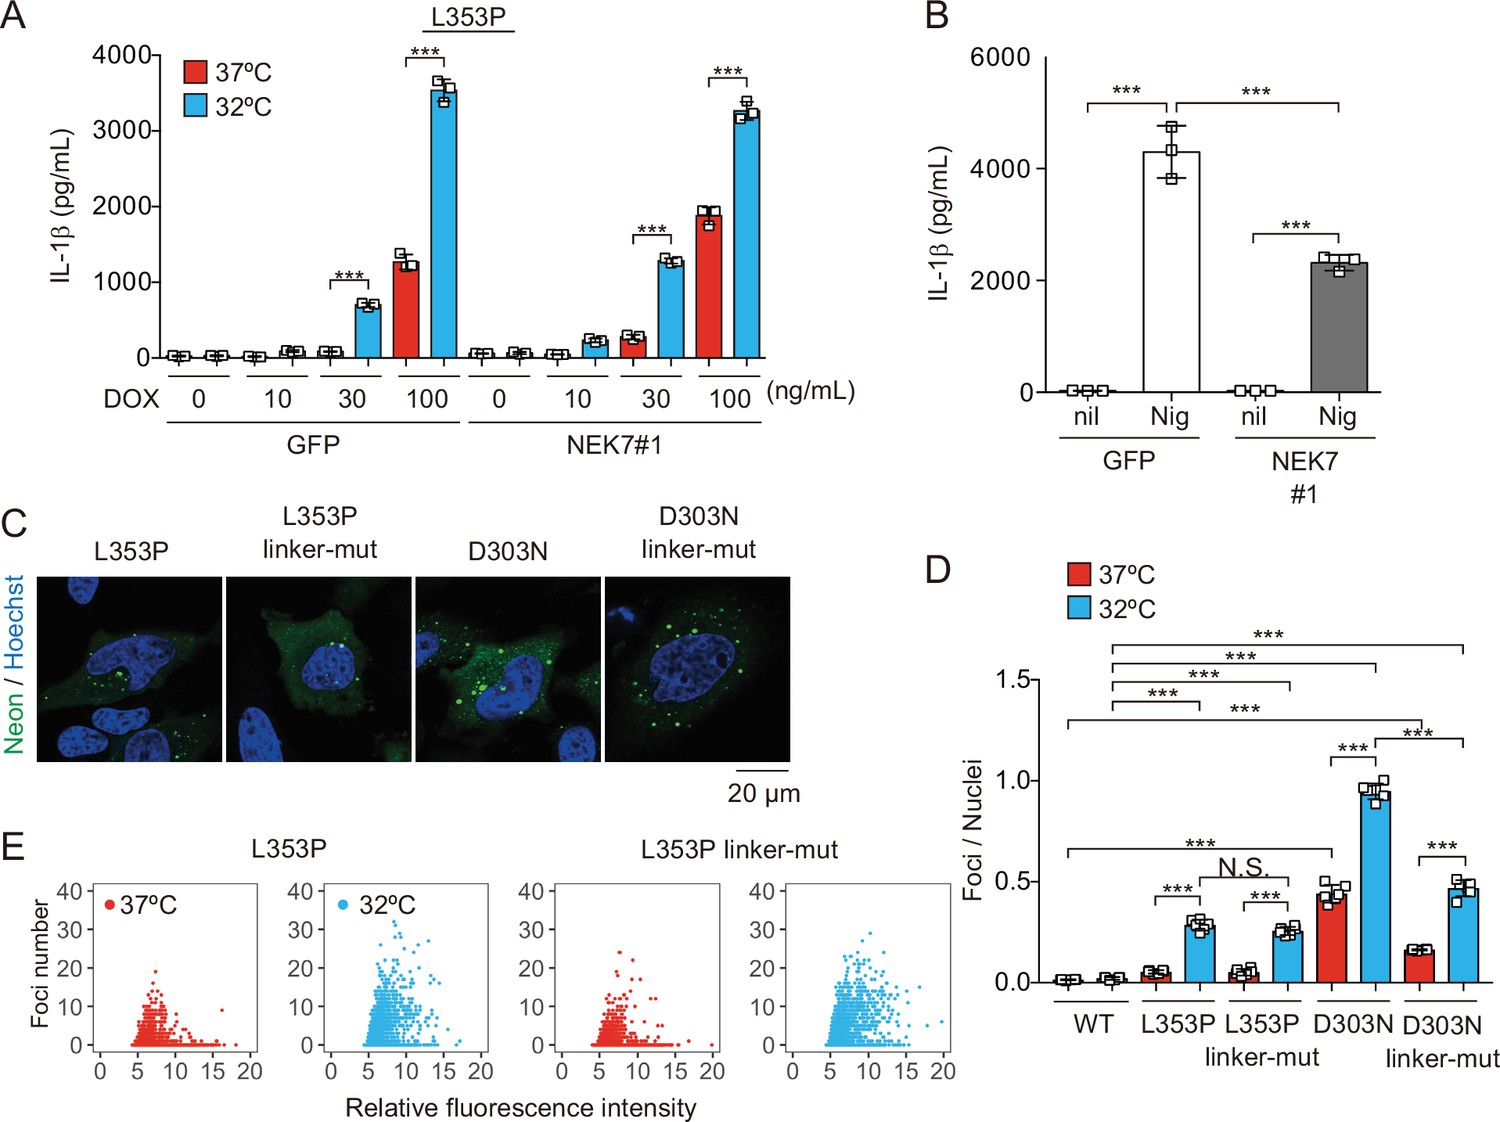
NEK7 and polybasic linker in NLRP3 are dispensable for cryopyrin-associated periodic syndrome-associated NLRP3 mutant-mediated inflammasome assembly.
(A and B) Differentiated NEK7-mutated TRE-NLRP3-L353P-THP-1 cells were treated with (A) doxycycline (DOX) (30 ng/mL) or (B) nigericin at 37 or 32°C for 6 hr. The levels of IL-1β in the supernatants were assessed by ELISA (n=3). (C) EF1-NLRP3-L353P-, NLRP3-L353P3KA-, EF1-NLRP3-D303N-, or NLRP3-D303N3KA-mNeonGreen-HeLa cells were analyzed by confocal microscopy. (D and E) EF1-NLRP3-L353P-, NLRP3-L353P-linker mutant-, EF1-NLRP3-D303N-, or NLRP3-D303N-linker mutant-mNeonGreen-HeLa cells were cultured at 37 or 32°C for 24 hr. The number of foci and the fluorescence intensity of the cells were analyzed by high-content analysis. Data are expressed as the mean ± SD. ***p<0.005 as determined by two-way ANOVA with a post hoc test. Data are representative of three independent experiments.
-
Figure 4—source data 1
Source data for Figure 4E.
- https://cdn.elifesciences.org/articles/75166/elife-75166-fig4-data1-v2.txt
Figure 4—figure supplement 1
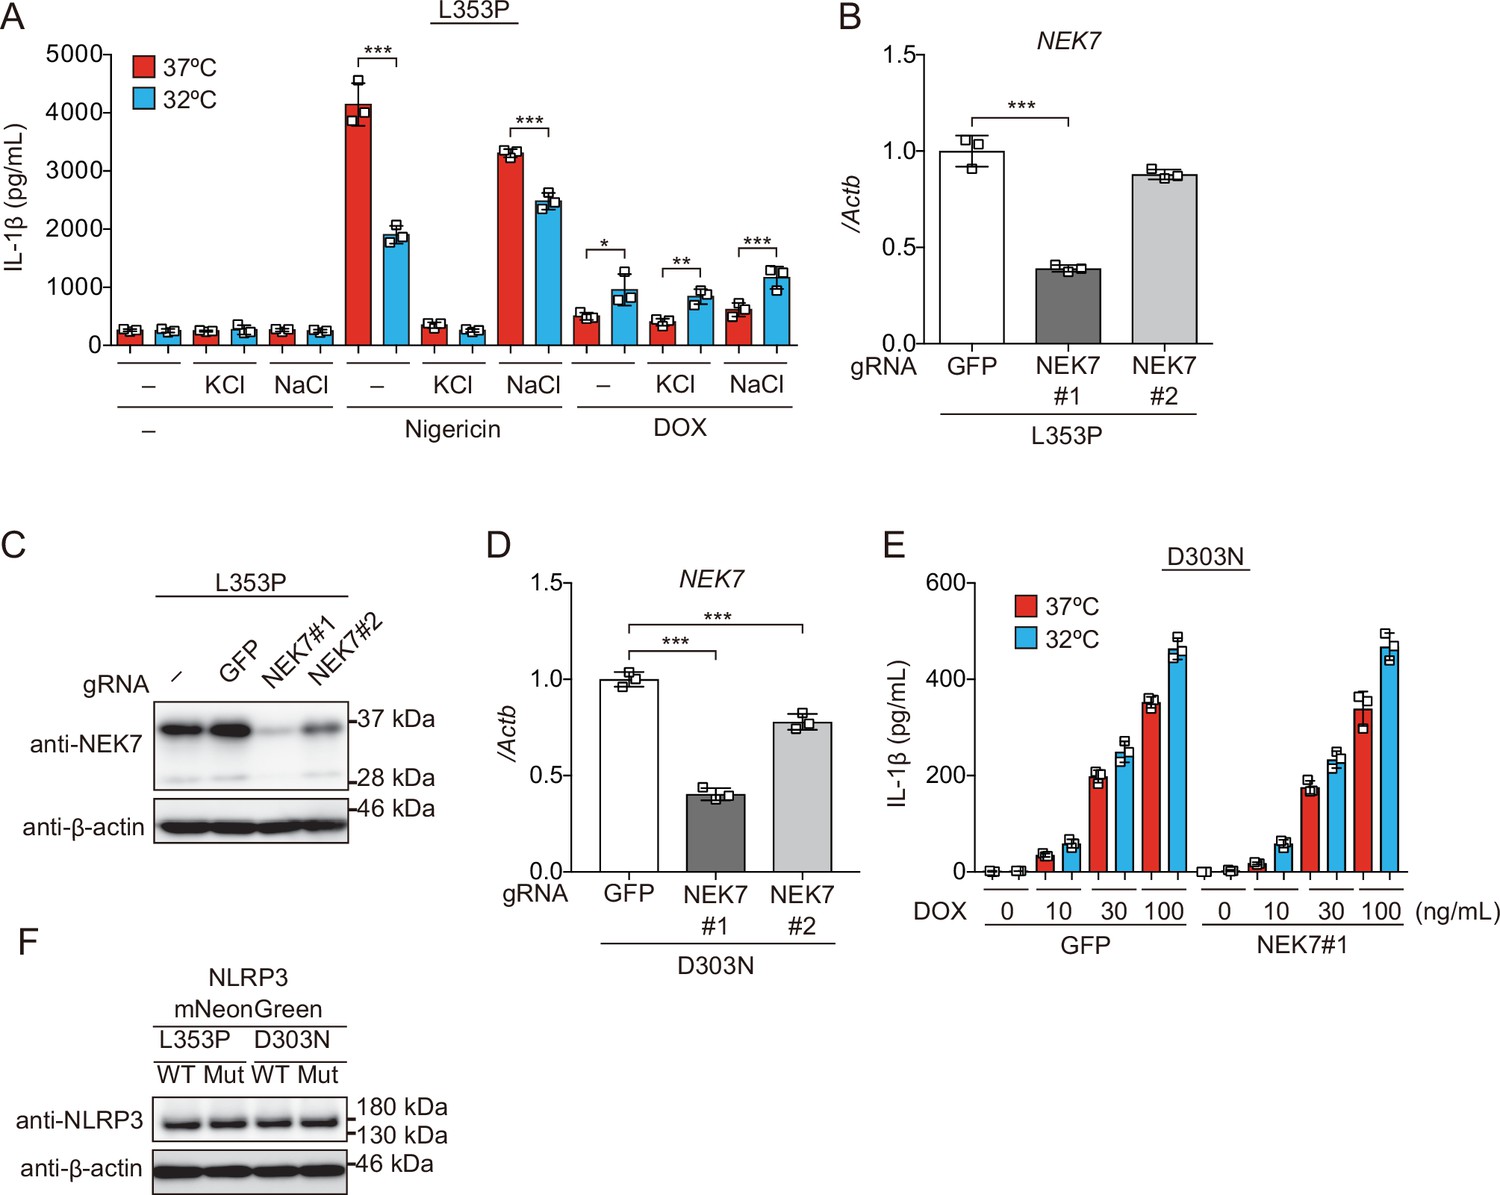
K+ efflux is dispensable for inflammasome activation induced by cryopyrin-associated periodic syndrome-associated NLRP3 mutant.
(A) Differentiated TRE-NLRP3-L353P-THP-1 cells were pretreated with the indicated dose of KCl or NaCl and then treated with doxycycline (DOX) (30 ng/mL) at 37 or 32°C for 6 hr. (B–D) NEK7-mutated (B and C) TRE-NLRP3-L353P-THP-1 cells or (D) TRE-NLRP3-D303N-THP-1 cells were differentiated with phorbol-12-myristate-13-acetate for 24 hr. (B and D) mRNA expression of NEK7 was analyzed by real-time PCR (n=3). (C) Lysates were analyzed by western blot. (E) Differentiated NEK7-mutated TRE-NLRP3-D303N-THP-1 cells were treated with DOX (30 ng/mL) at 37 or 32°C for 6 hr. The levels of IL-1β in the supernatants were assessed by ELISA (n=3). (F) Lysates of EF1-NLRP3-L353P-, NLRP3-L353P-linker mutant-, NLRP3-D303N, or NLRP3-D303N-linker mutant-mNeonGreen-HeLa cells were analyzed by western blot. (A, B, D, and E) Data are expressed as the mean ± SD. *p<0.05, **<0.01, and ***p<0.005 as determined by (B and D) one-way or (A and E) two-way ANOVA with a post hoc test. Data are representative of two independent experiments.
-
Figure 4—figure supplement 1—source data 1
Source data for Figure 4—figure supplement 1C.
- https://cdn.elifesciences.org/articles/75166/elife-75166-fig4-figsupp1-data1-v2.zip
-
Figure 4—figure supplement 1—source data 2
Source data for Figure 4—figure supplement 1F.
- https://cdn.elifesciences.org/articles/75166/elife-75166-fig4-figsupp1-data2-v2.zip
Figure 5 with 2 supplements
Ca2+ is required for cryopyrin-associated periodic syndrome-associated NLRP3 mutant-mediated inflammasome assembly.
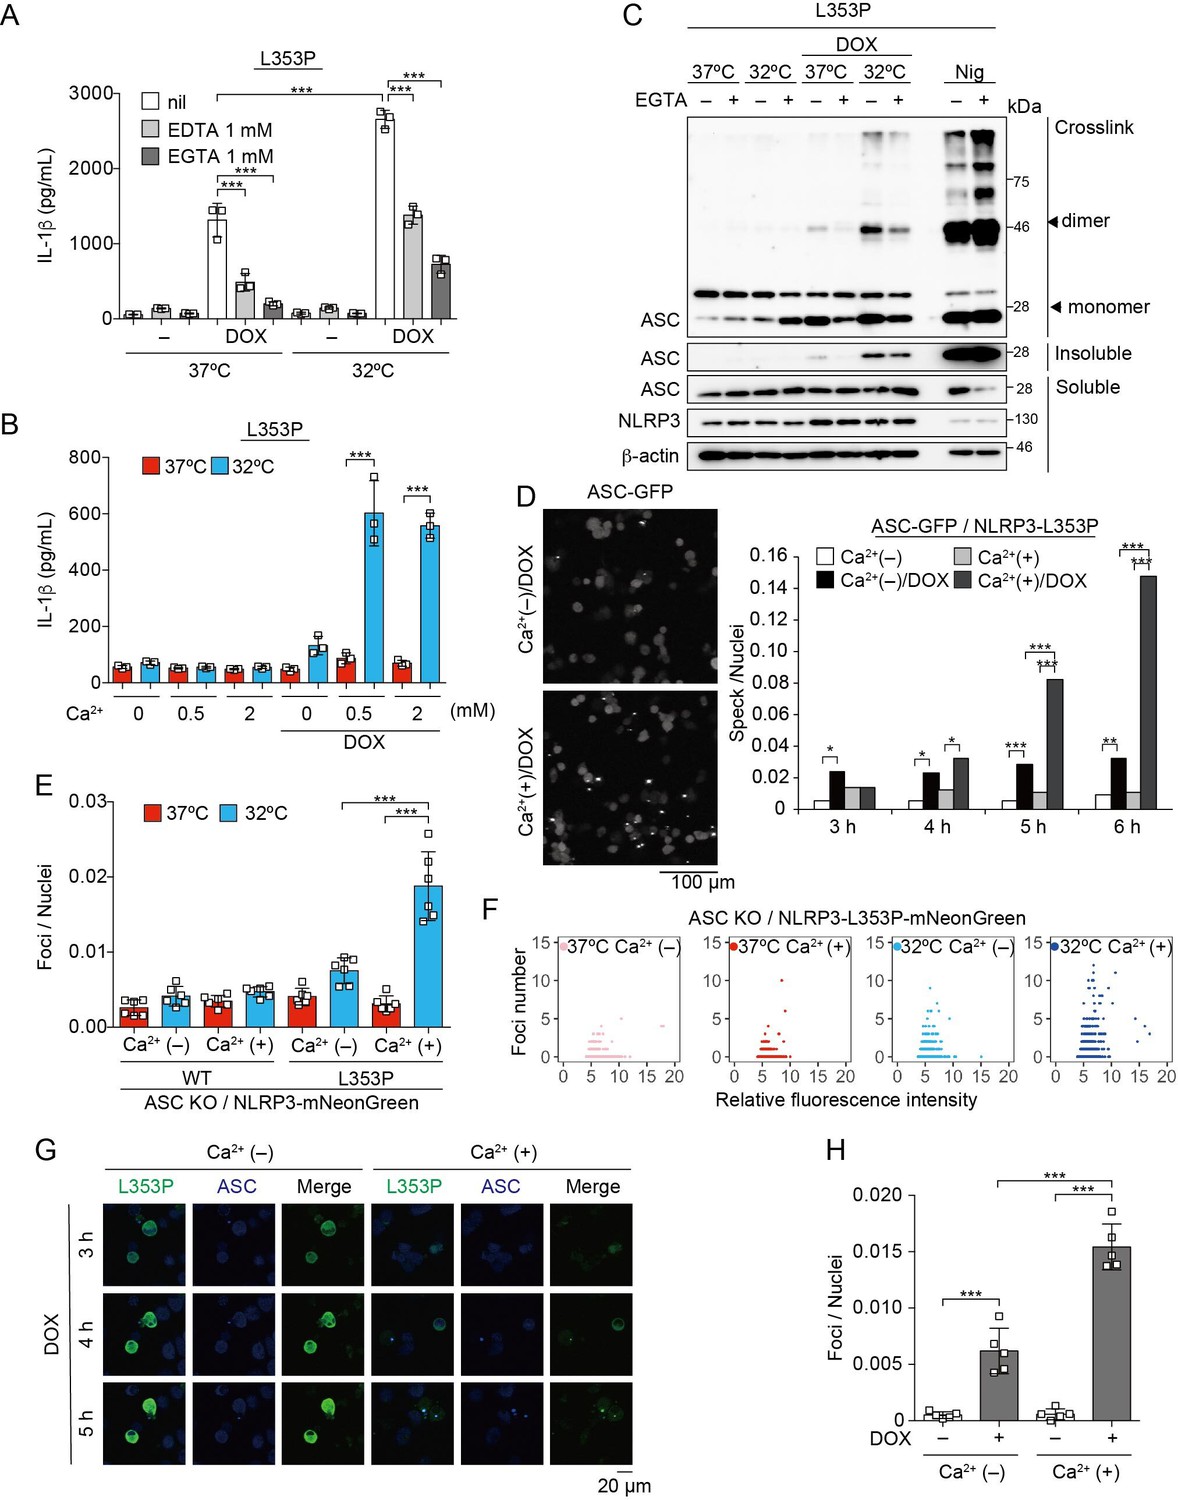
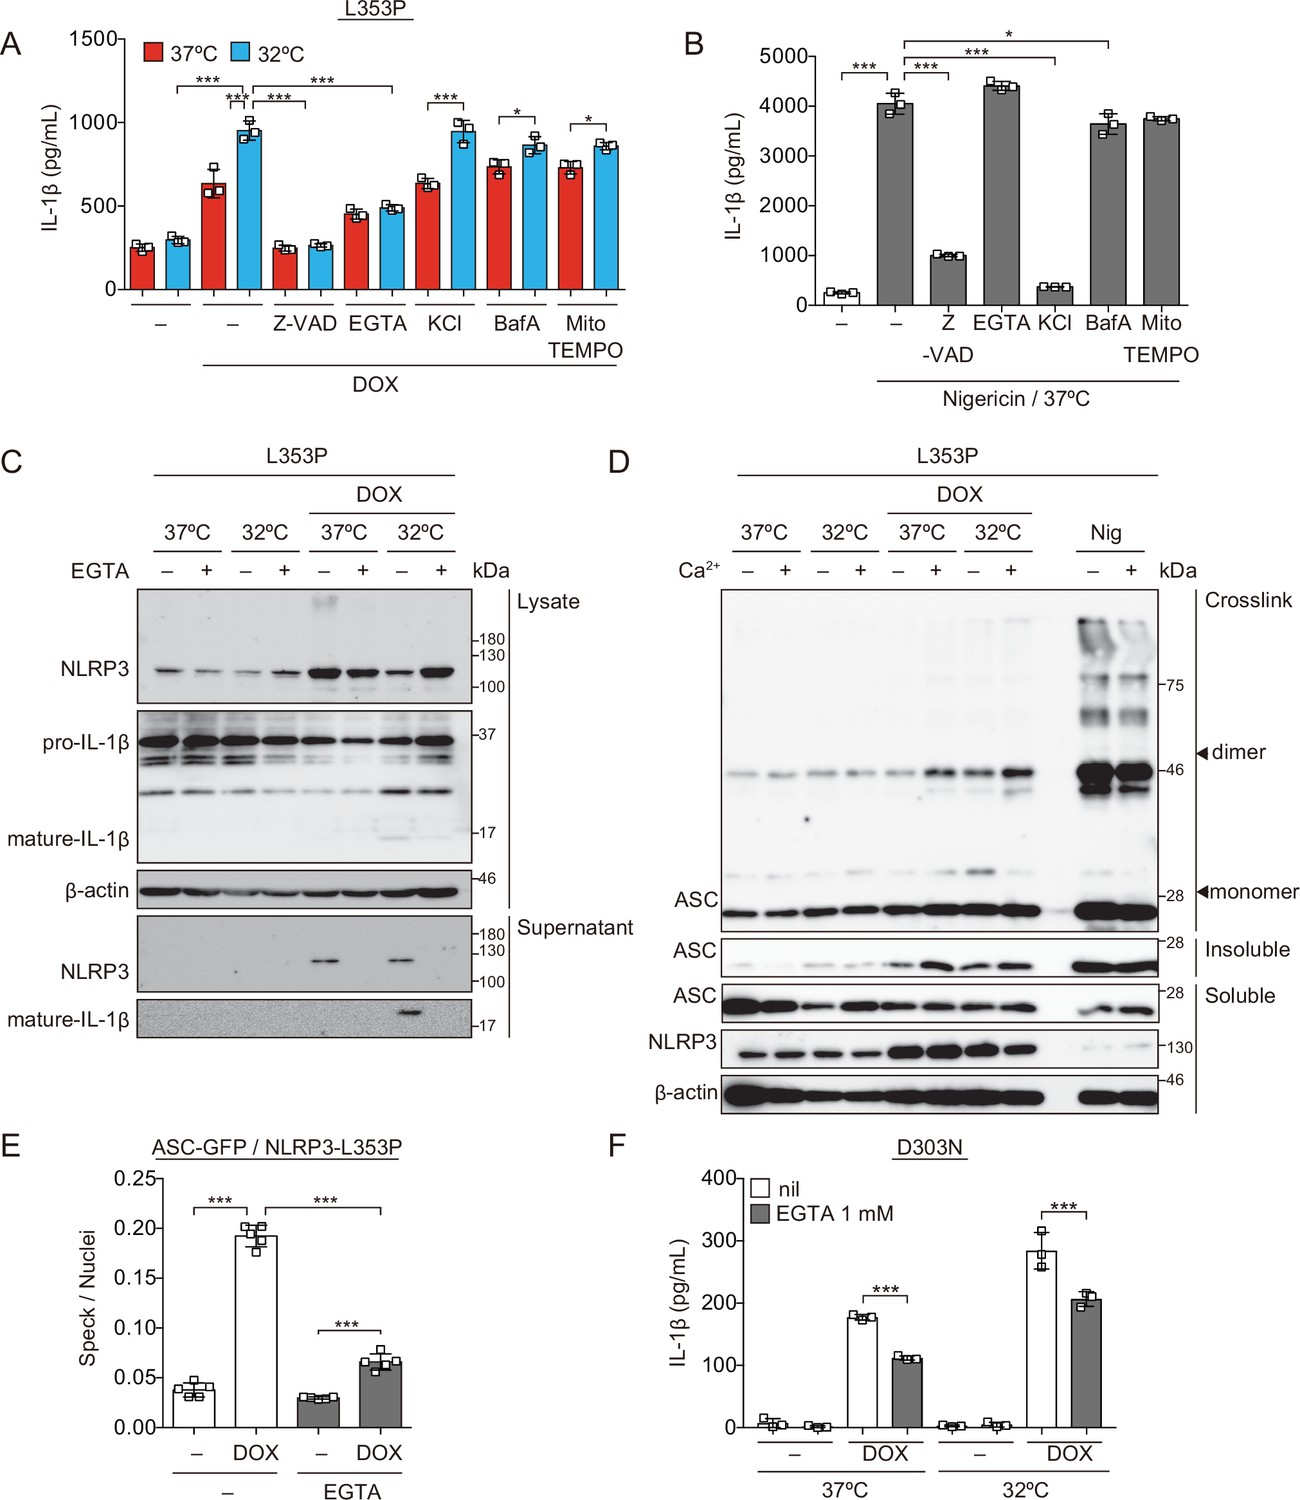
(A–C) Differentiated TRE-NLRP3-L353P-THP-1 cells were pretreated with indicated conditions, and then treated with doxycycline (DOX) (30 ng/mL) at 37 or 32°C for 6 hr. (A and B) The IL-1β levels in the supernatants were assessed by ELISA (n=3). (C) Oligomerized apoptosis-associated speck-like protein containing a caspase recruitment domain (ASC) in Triton X-insoluble fractions was crosslinked with bis(sulfosuccinimidyl)suberate and analyzed by western blot. (D) EF1-ASC-GFP/TRE-NLRP3-L353P-THP-1 cells were pretreated with Ca2+-depleted or -supplemented media and then treated with DOX (30 ng/mL) at 37°C. ASC-speck formation was analyzed by confocal microscopy. (E and F) ASC KO / EF1-NLRP3-WT- or L353P- mNeonGreen-THP-1 cells were cultured at 37 or 32°C for 24 hr in Ca2+-depleted or -supplemented media. The number of foci and fluorescent intensity was analyzed by high-content analysis. (G and H) Differentiated EF1-ASC-BFP/TRE-NLRP3-L353P-mNeonGreen THP-1 cells were pretreated with Ca2+-depleted or -supplemented media and then treated with DOX (30 ng/mL) at 37°C. (G) Representative images by confocal microscopy. (H) The number of foci was analyzed by high-content analysis. (A, B, F, and G) Data are expressed as the mean ± SD. *p<0.05, **p<0.01, and ***p<0.005 as determined by (A, B, E, and H) two-way ANOVA with a post hoc test or (D) Fisher’s exact test with the Holm correction. Data are representative of two or three independent experiments.
-
Figure 5—source data 1
Source data for Figure 4C.
- https://cdn.elifesciences.org/articles/75166/elife-75166-fig5-data1-v2.zip
-
Figure 5—source data 2
Source data for Figure 4D.
- https://cdn.elifesciences.org/articles/75166/elife-75166-fig5-data2-v2.csv
-
Figure 5—source data 3
Source data for Figure 5F and Figure 5—figure supplement 2.
- https://cdn.elifesciences.org/articles/75166/elife-75166-fig5-data3-v2.txt
Figure 5—figure supplement 1
Ca2+ is necessary for inflammasome activation induced by cryopyrin-associated periodic syndrome-associated NLRP3 mutant.
(A and B) Differentiated TRE-NLRP3-L353P-THP-1 cells were pretreated with the indicated inhibitors and then treated with doxycycline (DOX) (30 ng/mL) or nigericin (5 µM) at 37 or 32°C for 6 hr. The levels of IL-1β in the supernatants were assessed by ELISA (n=3). (C) Differentiated TRE-NLRP3-L353P-THP-1 cells were pretreated with EGTA and then treated with DOX (30 ng/mL) at 37 or 32°C for 6 hr. Lysates and supernatants were analyzed by western blot. (D) Differentiated TRE-NLRP3-L353P-THP-1 cells were pretreated with Ca2+-depleted or -supplemented media and then treated with DOX (30 ng/mL) at 37 or 32°C for 6 hr. Oligomerized apoptosis-associated speck-like protein containing a caspase recruitment domain (ASC) in Triton X-insoluble fractions was crosslinked by bis(sulfosuccinimidyl)suberate and analyzed by western blot. (E) EF1-ASC-GFP/TRE-NLRP3-L353P-THP-1 cells were pretreated with EGTA and then treated with DOX (30 ng/mL) at 37°C. The formation of ASC speck was analyzed by high-content analysis. (F) Differentiated TRE-NLRP3-D303N-THP-1 cells were pretreated with EGTA and then treated with DOX (30 ng/mL) at 37 or 32°C for 6 hr. The IL-1β levels in the supernatants were assessed by ELISA (n=3). (A, B, E, and F) Data are expressed as the mean ± SD. *p<0.05, **p<0.01, and ***p<0.005 as determined by two-way ANOVA with a post hoc test. Data are representative of two or three independent experiments.
-
Figure 5—figure supplement 1—source data 1
Source data for Figure 5—figure supplement 1C.
- https://cdn.elifesciences.org/articles/75166/elife-75166-fig5-figsupp1-data1-v2.zip
-
Figure 5—figure supplement 1—source data 2
Source data for Figure 5—figure supplement 1D.
- https://cdn.elifesciences.org/articles/75166/elife-75166-fig5-figsupp1-data2-v2.zip
Figure 5—figure supplement 2
Ca2+ is necessary for aggregation of cryopyrin-associated periodic syndrome-associated NLRP3 mutant.
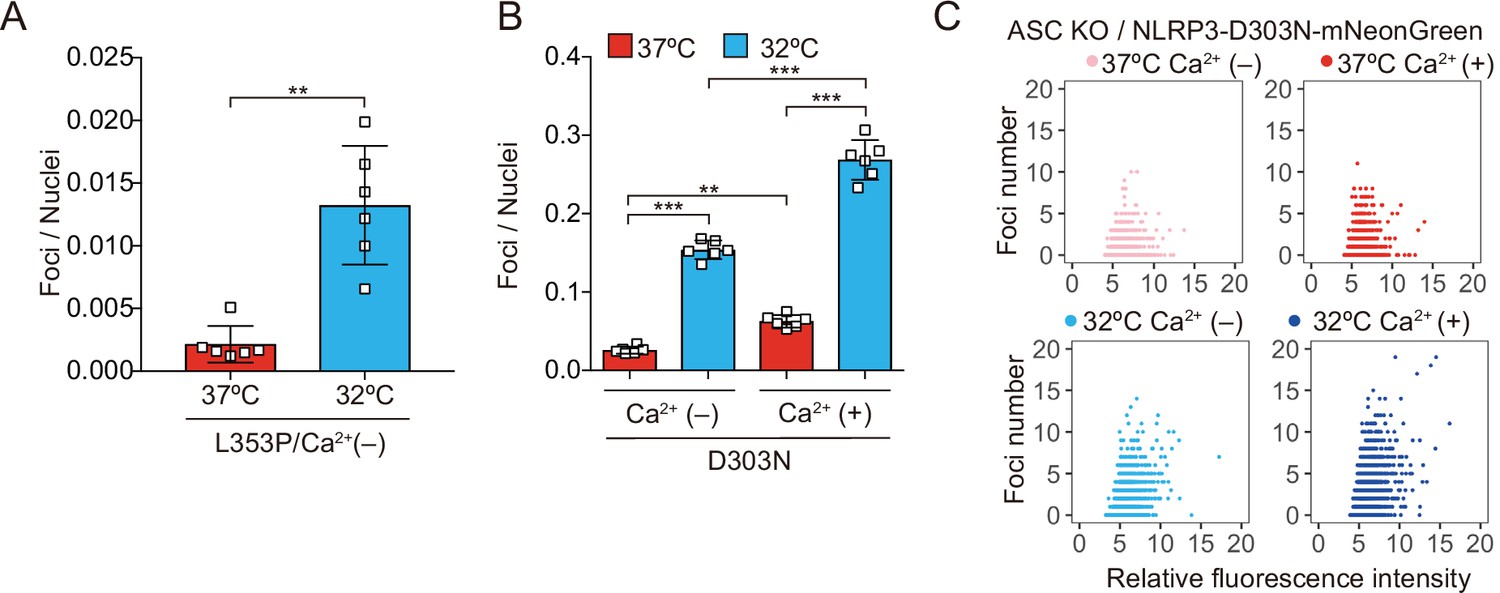
(A) ASC KO/EF1-NLRP3-L353P-mNeonGreen-THP-1 cells were cultured at 37 or 32°C for 24 hr in Ca2+-depleted media. The number of foci and fluorescent intensity was analyzed by high-content analysis. (B and C) ASC KO/EF1-NLRP3-D303N-mNeonGreen-THP-1 cells were cultured at 37 or 32°C for 24 hr in Ca2+-depleted or -supplemented media. The number of foci and fluorescent intensity was analyzed by high-content analysis. Data are expressed as the mean ± SD. **p<0.01 and ***p<0.005 as determined by Welch’s t test or two-way ANOVA with a post hoc test. Data are representative of three independent experiments.
Figure 6 with 2 supplements

Ca2+ influx is provoked during mutated NLRP3-mediated inflammasome assembly.
(A–C) Differentiated TRE-NLRP3-L353P-THP-1 cells were loaded with 4 µM Fluo-8 for 1 hr and treated with doxycycline (DOX) (30 ng/mL) at 37°C for 6 hr. The images were recorded by confocal microscopy at 5 min intervals from 3 hr to 6 hr. (A) Representative temporal subtraction images. (B) The frequency of intracellular Ca2+ increase at each time point. (C) The cumulative number of Fluo-8-positive cells. (D–F) Differentiated TRE-NLRP3-L353P-THP-1 cells were loaded with 4 µM Fluo-8 for 1 hr and treated with DOX (30 ng/mL) at 37°C for 6 hr in Ca2+-depleted or -supplemented media. The images were recorded by confocal microscopy at 5 min intervals from 3 hr to 6 hr. (D) Representative temporal subtraction images. (E) The frequency of intracellular Ca2+ increase at each time point. (F) The cumulative number of Fluo-8-positive cells. (G–I) Differentiated EF1-ASC-BFP/TRE-NLRP3-L353P-THP-1 cells were loaded with 4 µM Fluo-8 for 1 hr and treated with DOX (30 ng/mL) at 37°C. The images were recorded at 5 min intervals. (G) Representative images of the cells with increased Fluo-8 signals. (H) The apoptosis-associated speck-like protein containing a caspase recruitment domain (ASC)-BFP speck size (I) and fluorescent intensity of Fluo-8 were analyzed. The peak time point of Fluo-8 signals was defined as 0 min. (H) The blue line and the (I) green line represent mean values, and the gray line represents each measurement. *p<0.05, **p<0.01, and ***p<0.005 as determined by (C and F) Fisher’s exact test with the Holm correction or (H and I) repeated one-way ANOVA with a post hoc test. (A–G) Data are representative of three independent experiments. (H and I) Data are from three independent live-cell imaging.
-
Figure 6—source data 1
Source data for Figure 6B and C.
- https://cdn.elifesciences.org/articles/75166/elife-75166-fig6-data1-v2.csv
-
Figure 6—source data 2
Source data for Figure 6E and F.
- https://cdn.elifesciences.org/articles/75166/elife-75166-fig6-data2-v2.csv
Figure 6—figure supplement 1
Ca2+ influx is induced by chronic infantile neurological, cutaneous, and articular syndrome-associated NLRP3 mutant.
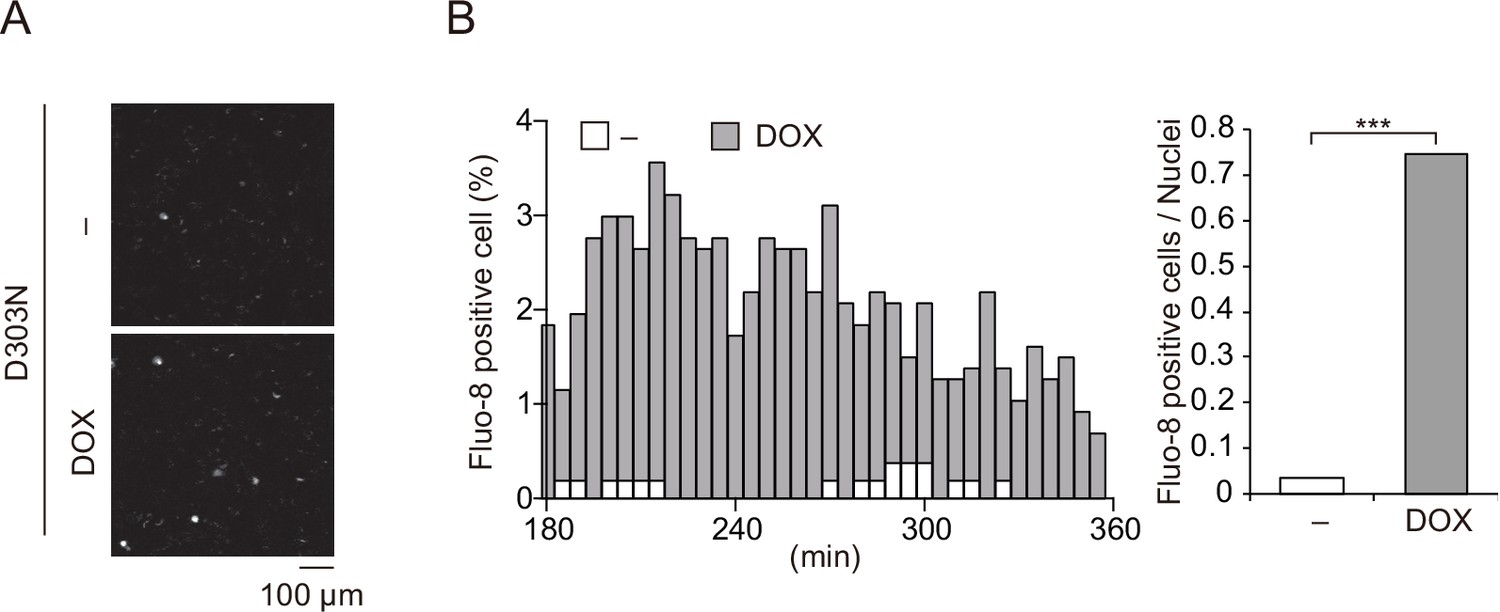
(A–C) Differentiated TRE-NLRP3-D303N-THP-1 cells were loaded with 4 µM Fluo-8 for 1 hr and treated with doxycycline (DOX) (30 ng/mL) at 37°C for 6 hr. The images were recorded by confocal microscopy at 5 min intervals from 3 hr to 6 hr. (A) Representative temporal subtraction images. (B) The frequency of intracellular Ca2+ increase at each time point. (C) The cumulative number of Fluo-8-positive cells. ***p<0.005 as determined by Fisher’s exact test with the Holm correction. Data are representative of three independent experiments.
-
Figure 6—figure supplement 1—source data 1
Source data for Figure 6—figure supplement 1A.
- https://cdn.elifesciences.org/articles/75166/elife-75166-fig6-figsupp1-data1-v2.csv
Figure 6—figure supplement 2
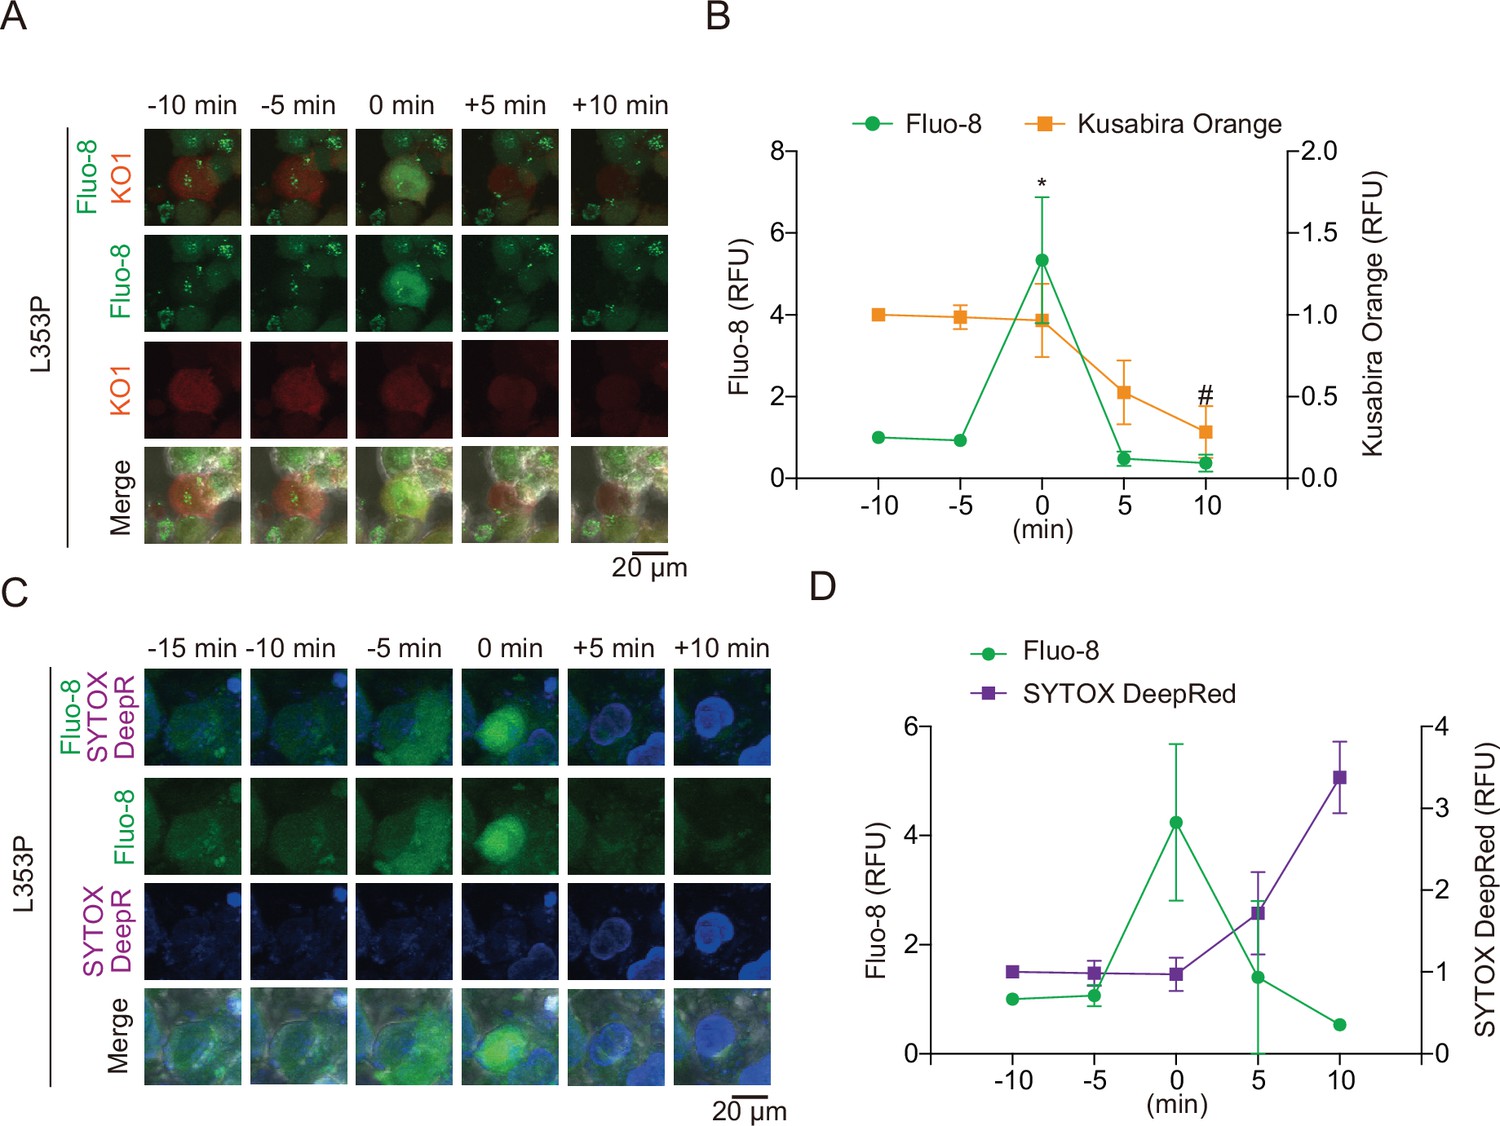
Pyroptosis is induced by mutated NLRP3 after Ca2+ influx.
(A and B) Differentiated TRE-NLRP3-L353P-THP-1 cells were loaded with 4 µM Fluo-8 for 1 hr and treated with doxycycline (DOX) (30 ng/mL) at 37°C for 6 hr. (A) Representative images of cells with increased Fluo-8 signal. (B) The relative fluorescent intensity of Fluo-8 and Kusabira Orange in cells with increased Fluo-8 signal was quantified (n=10). (C and D) Differentiated TRE-NLRP3-L353P-THP-1 cells were loaded with 4 µM Fluo-8 for 1 hr and treated with DOX (30 ng/mL) at 37°C for 6 hr in the presence of SYTOX Deep Red. (C) Representative images of cells with increased Fluo-8 signal. (D) The relative fluorescent intensity of Fluo-8 and SYTOX Deep Red in cells with increased Fluo-8 signal was quantified (n=5). Data are expressed as the mean ± SD. *p<0.05 as determined by repeated one-way ANOVA with a post hoc test. Data are analyzed from two independent time-lapse imaging.
Figure 7 with 1 supplement

Caspase-1 inhibition prevents familial cold autoinflammatory syndrome-associated NLRP3 mutant-mediated inflammasome assembly.
(A –C) Differentiated TRE-NLRP3-L353P-THP-1 cells were loaded with 4 µM Fluo-8 for 1 hr and were pretreated with VX-765 (20 µM) for 30 min. After doxycycline (DOX) (30 ng/mL) treatment, the images were recorded at 5 min intervals from 3 hr to 6 hr. (A) Representative temporal subtraction images. (B) The frequency of intracellular Ca2+ increase at each time point. (C) The cumulative number of Fluo-8-positive cells. (D and F) Differentiated TRE-NLRP3-L353P-THP-1 cells were pretreated with VX-765 (20 µM) for 30 min and then treated with DOX (30 ng/mL) or nigericin (5 µM) at 37 or 32°C. (D) Triton X-insoluble fractions were crosslinked with bis(sulfosuccinimidyl)suberate and analyzed by western blot. (F) The IL-1β levels in the supernatants were assessed by ELISA (n=3). (E) EF1-ASC-GFP/TRE-NLRP3-L353P-THP-1 cells were pretreated with 20 µM VX-765 for 30 min and then treated with DOX (30 ng/mL) at 37°C. ASC-speck formation was analyzed by confocal microscopy. (G and H) The differentiated CASP1-mutated TRE-NLRP3-L353P-THP-1 cells were treated with 4 µM Fluo-8 for 1 hr and treated with DOX (30 ng/mL) at 37°C for 6 hr. (G) The frequency of intracellular Ca2+ increase at each time point. (H) The cumulative number of Fluo-8-positive cells. (I) The differentiated CASP1-mutated EF1-ASC-GFP/TRE-NLRP3-L353P-THP-1 cells were treated with DOX (30 ng/mL) at 37°C for 6 hr. ASC-speck formation was analyzed by confocal microscopy. (F) Data are expressed as the mean ± SD. *p<0.05, **p<0.01, and ***p<0.005 as determined by (C, E, G, and H) Fisher’s exact test with the Holm correction or (F) two-way ANOVA with a post hoc test. Data are representative of two or three independent experiments.
-
Figure 7—source data 1
Source data for Figure 7B and C.
- https://cdn.elifesciences.org/articles/75166/elife-75166-fig7-data1-v2.csv
-
Figure 7—source data 2
Source data for Figure 7D.
- https://cdn.elifesciences.org/articles/75166/elife-75166-fig7-data2-v2.zip
-
Figure 7—source data 3
Source data for Figure 7E.
- https://cdn.elifesciences.org/articles/75166/elife-75166-fig7-data3-v2.csv
-
Figure 7—source data 4
Source data for Figure 7G.
- https://cdn.elifesciences.org/articles/75166/elife-75166-fig7-data4-v2.csv
-
Figure 7—source data 5
Source data for Figure 7H.
- https://cdn.elifesciences.org/articles/75166/elife-75166-fig7-data5-v2.csv
Figure 7—figure supplement 1
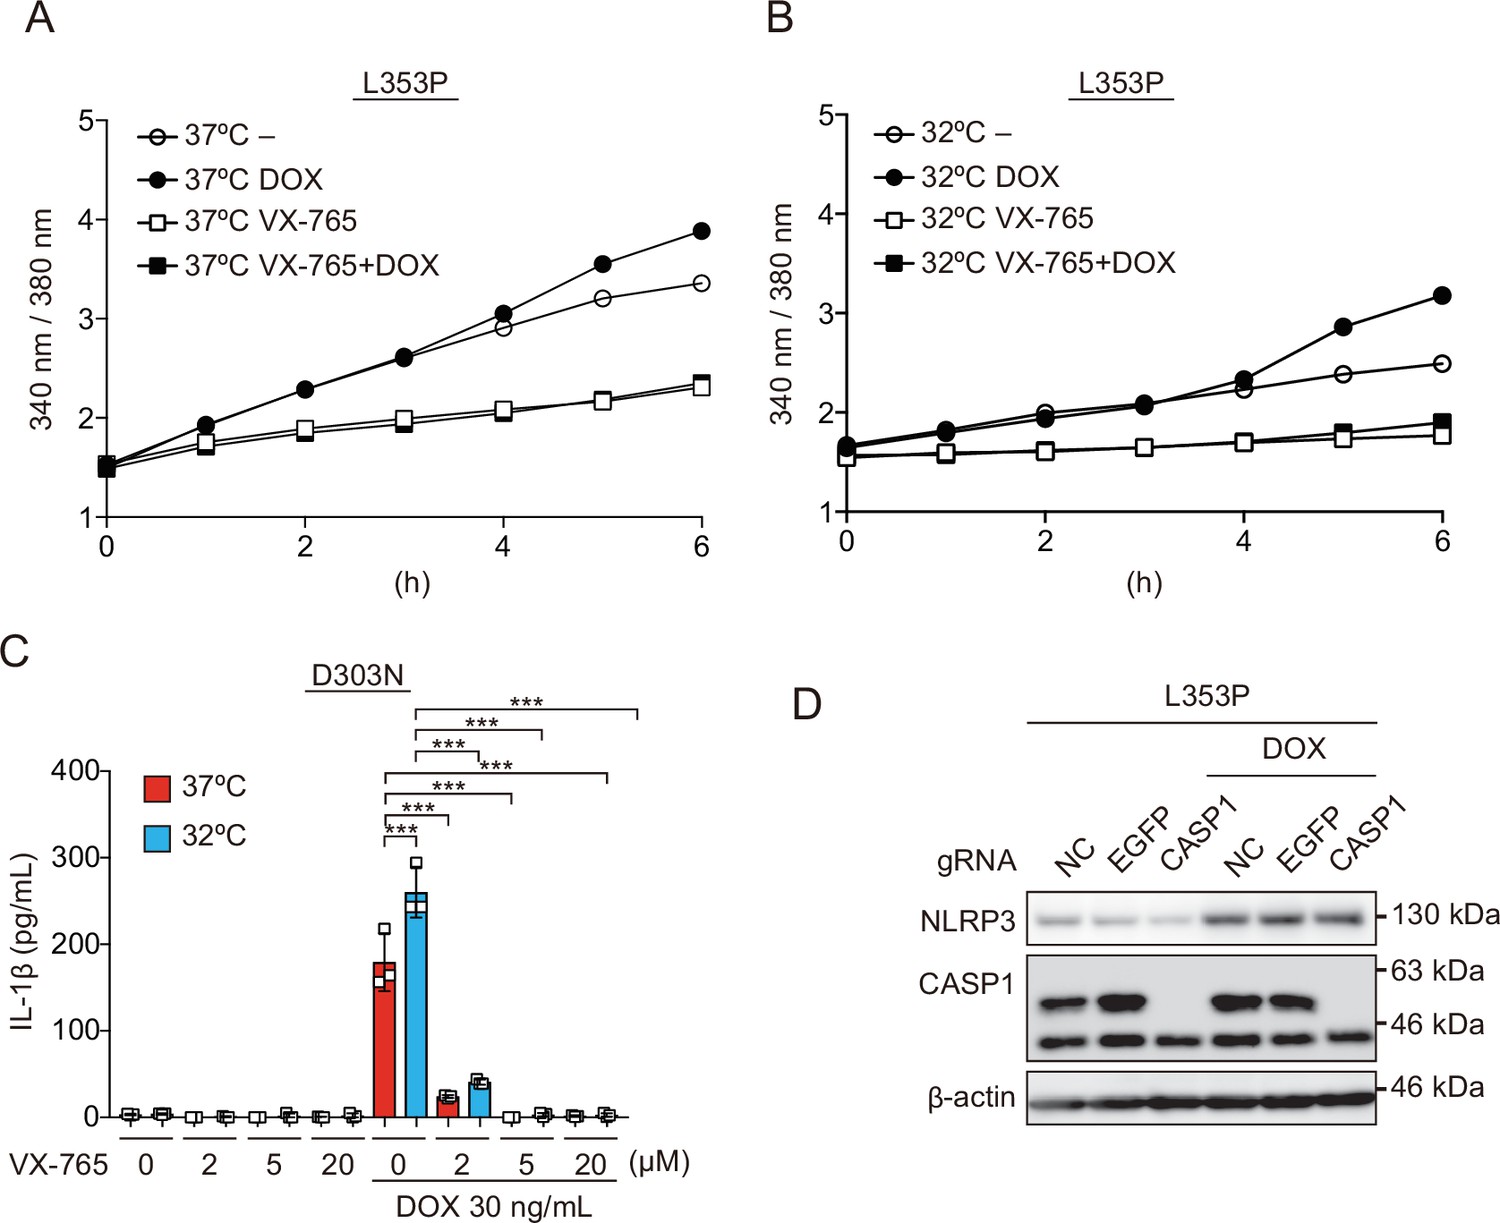
Caspase activity is required for inflammasome assembly induced by familial cold autoinflammatory syndrome-associated NLRP3 mutant.
(A and B) Differentiated NLRP3-L353P-THP-1 cells were loaded with 3 µM Fura2 for 1 hr. Cells were pretreated 20 µM VX-765 for 30 min and then treated with doxycycline (DOX) (30 ng/mL) at 37 or 32°C for 6 hr. Fluorescence (A) at 37 and (B) 32°C was measured at hourly interval (n=6). (C) Differentiated TRE-NLRP3-D303N-THP-1 cells were pretreated with VX-765 for 30 min and then treated with DOX (30 ng/mL) at 37 or 32°C for 6 hr. The IL-1β levels in the supernatants were assessed by ELISA (n=3). (D) The differentiated CASP1-mutated TRE-NLRP3-L353P-THP-1 cells were treated with DOX (30 ng/mL) at 37°C for 6 hr. Lysates were analyzed by western blot. (C) Data are expressed as the mean ± SD. ***p<0.005 as determined by two-way ANOVA with a post hoc test. Data are representative of two or three independent experiments.
-
Figure 7—figure supplement 1—source data 1
Source data for Figure 7—figure supplement 1C.
- https://cdn.elifesciences.org/articles/75166/elife-75166-fig7-figsupp1-data1-v2.zip
Figure 8 with 1 supplement
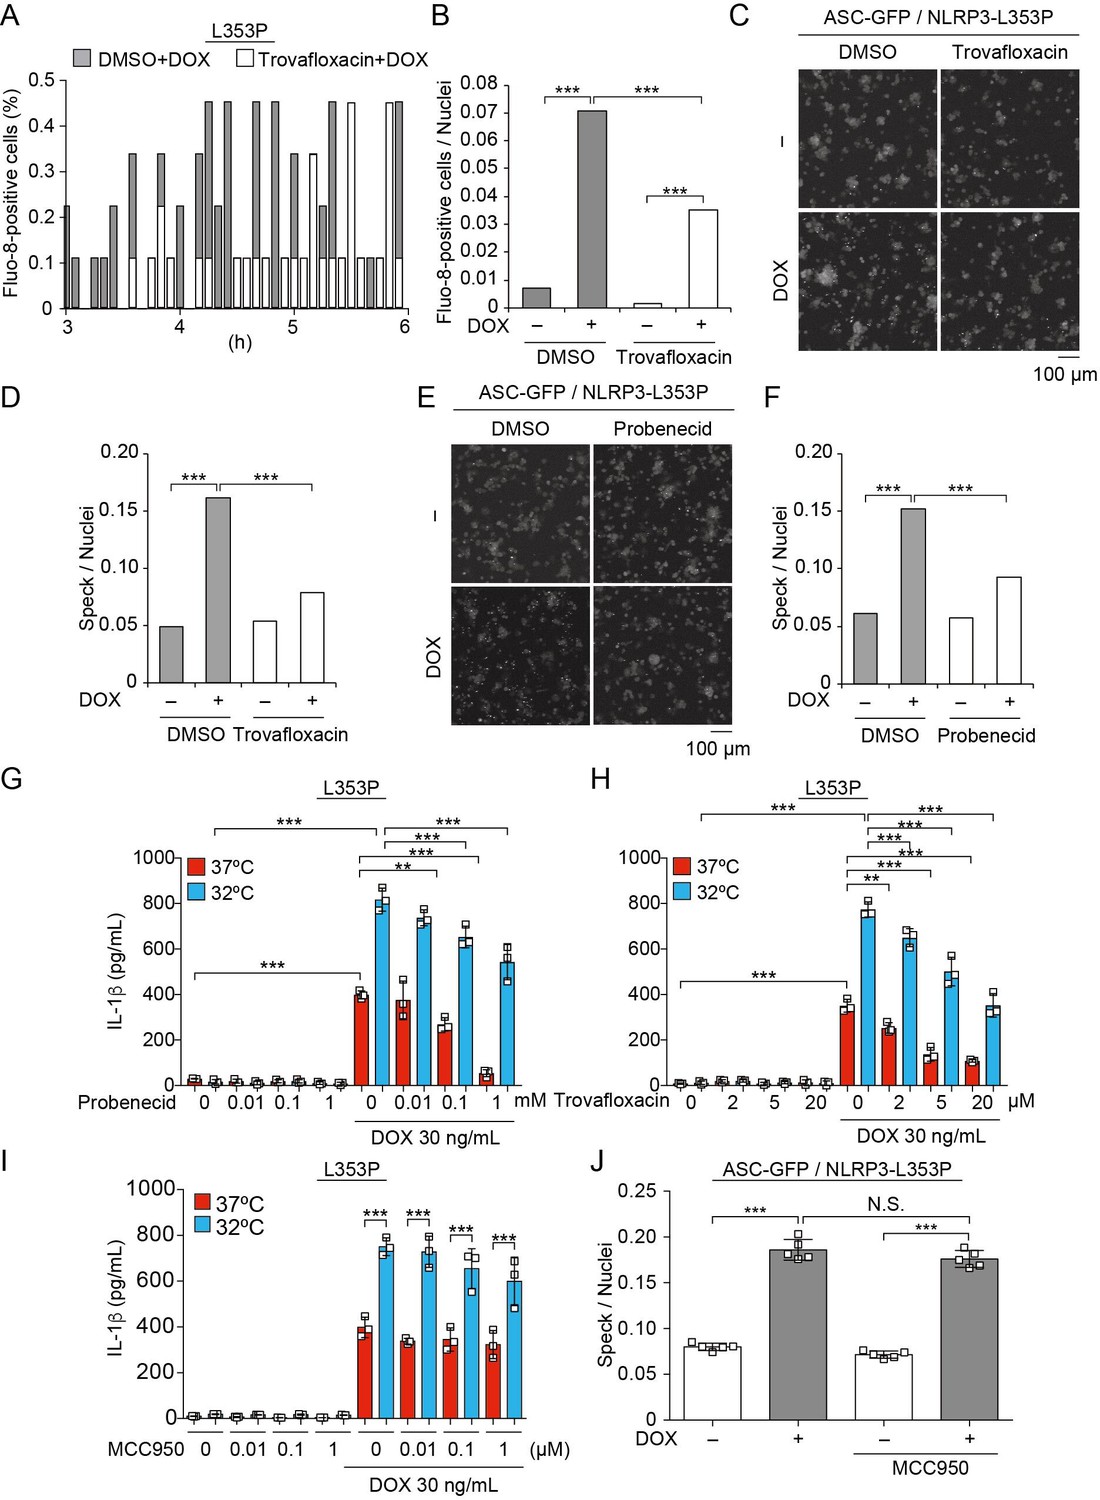
Pannexin 1 inhibition prevents familial cold autoinflammatory syndrome-associated NLRP3 mutant-mediated inflammasome assembly.
(A and B) Differentiated TRE-NLRP3-L353P-THP-1 cells were pretreated with 4 µM Fluo-8 for 1 hr and trovafloxacin (20 µM) for 30 min. After doxycycline (DOX) (30 ng/mL) treatment, the images were recorded at 5 min intervals from 3 hr to 6 hr. (A) The frequency of intracellular Ca2+ increase at each time point. (B) The cumulative number of Fluo-8-positive cells. (C–F) EF1-ASC-GFP/TRE-NLRP3-L353P-THP-1 cells were pretreated with (C and D) trovafloxacin (20 µM) or (E and F) probenecid (1 mM) for 30 min and then treated with DOX (30 ng/mL) at 37°C for 6 hr. Apoptosis-associated speck-like protein containing a caspase recruitment domain (ASC)-speck formation was analyzed by confocal microscopy. (C and E) Representative images by confocal microscopy. (D and F) The number of nuclei and specks was counted. (G – I) Differentiated TRE-NLRP3-L353P-THP-1 cells were pretreated with (G) trovafloxacin, (H) probenecid, or (I) MCC950 for 30 min and then treated with DOX (30 ng/mL) at 37 or 32°C for 6 hr. The IL-1β levels in the supernatants were assessed by ELISA (n=3). (J) EF1-ASC-GFP/TRE-NLRP3-L353P-THP-1 cells were pretreated with MCC950 and then treated with DOX (30 ng/mL) at 37°C. The formation of ASC speck was analyzed by high-content analysis. (G–J) Data are expressed as the mean ± SD. **p<0.01 and ***p<0.005 as determined by (G–J) two-way ANOVA with a post hoc test or (B, D, and F) Fisher’s exact test with the Holm correction. Data are representative of three independent experiments.
-
Figure 8—source data 1
Source data for Figure 8A and B.
- https://cdn.elifesciences.org/articles/75166/elife-75166-fig8-data1-v2.csv
-
Figure 8—source data 2
Source data for Figure 8D.
- https://cdn.elifesciences.org/articles/75166/elife-75166-fig8-data2-v2.csv
-
Figure 8—source data 3
Source data for Figure 8F.
- https://cdn.elifesciences.org/articles/75166/elife-75166-fig8-data3-v2.csv
Figure 8—figure supplement 1
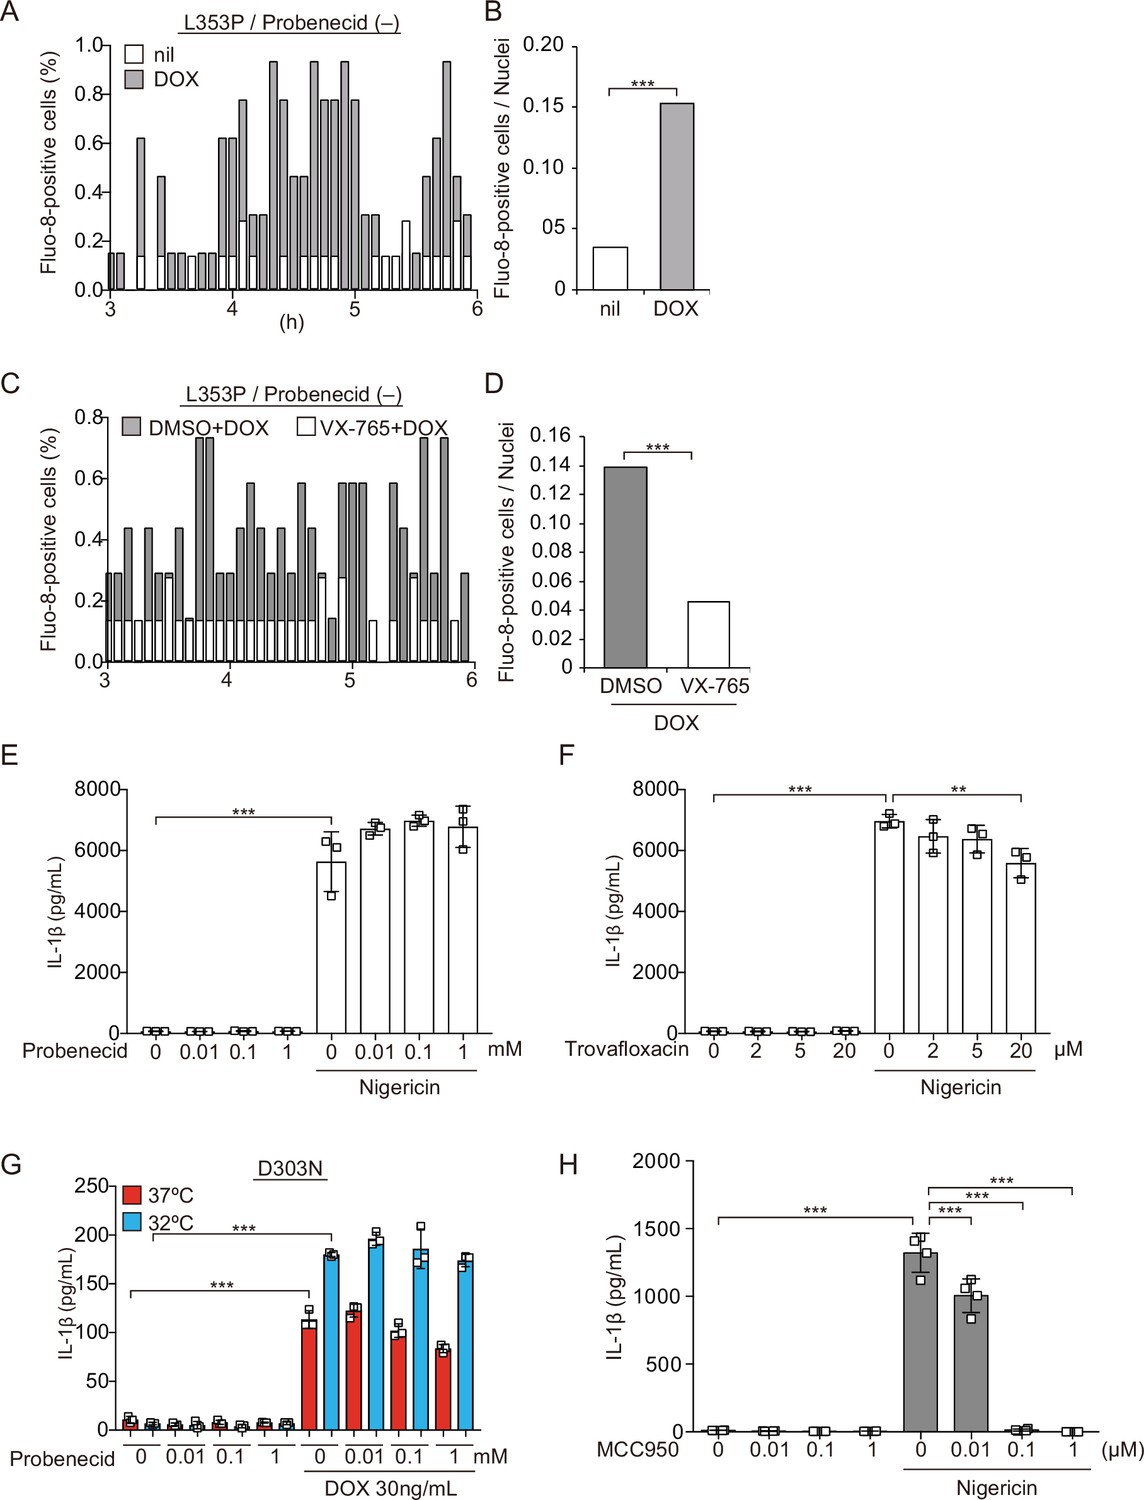
Pannexin 1 inhibition prevents familial cold autoinflammatory syndrome-associated NLRP3 mutant-mediated inflammasome assembly.
(A and B) Differentiated TRE-NLRP3-L353P-THP-1 cells were pretreated with 4 µM Fluo-8 for 1 hr and then treated with doxycycline (DOX) (30 ng/mL) at 37°C for 6 hr. The images were recorded by confocal microscopy at 5 min intervals from 3 hr to 6 hr. (A) The frequency of intracellular Ca2+ increase at each time point. (B) The cumulative number of Fluo-8-positive cells. (C and D) Differentiated TRE-NLRP3-L353P-THP-1 cells were pretreated with 4 µM Fluo-8 for 1 hr and VX-765 (20 µM) for 30 min. After DOX (30 ng/mL) treatment, the images were recorded at 5 min intervals from 3 hr to 6 hr. (C) The frequency of intracellular Ca2+ increase at each time point. (D) The cumulative number of Fluo-8-positive cells. (E, F, H) Differentiated TRE-NLRP3-L353P-THP-1 cells were pretreated with (E) trovafloxacin, (F) probenecid, or (H) MCC950 for 30 min and then treated with nigericin (5 µM) at 37°C for 6 hr. The levels of IL-1β in the supernatants were assessed by ELISA (n=3). (G) Differentiated TRE-NLRP3-D303N-THP-1 cells were pretreated with probenecid for 30 min and then treated with DOX (30 ng/mL) at 37 or 32°C for 6 hr. The IL-1β levels in the supernatants were assessed by ELISA (n=3). (E–H) Data are expressed as the mean ± SD. ***p<0.005 as determined by two-way ANOVA with a post hoc test or (B, D) Fisher’s exact test with the Holm correction. Data are representative of three independent experiments.
-
Figure 8—figure supplement 1—source data 1
Source data for Figure 8—figure supplement 1A.
- https://cdn.elifesciences.org/articles/75166/elife-75166-fig8-figsupp1-data1-v2.csv
-
Figure 8—figure supplement 1—source data 2
Source data for Figure 8—figure supplement 1C.
- https://cdn.elifesciences.org/articles/75166/elife-75166-fig8-figsupp1-data2-v2.csv
Author response image 1

The effect of imiquimod on IL-1β release in THP-1 cells.
THP-1 cells were differentiated with PMA for 24 h and then treated with nigericin, imiquimod, or nanosilica at 37ºC or 32ºC for 6 h. The levels of IL-1β in the supernatants were assessed by ELISA (n = 3). Data are expressed as the mean ± SD.
Videos
Video 1
Ca2+ influx is induced by familial cold autoinflammatory syndrome-associated NLRP3 mutant.
Differentiated TRE-NLRP3-L353P-THP-1 cells were loaded with 4 μM Fluo-8 for 1 hr and treated with doxycycline (30 ng/mL) at 37°C for 6 hr in Ca2+-depleted or -supplemented media. The images were recorded by confocal microscopy at 5 min intervals from 3 hr to 6 hr.
Video 2
Caspase activity is required for Ca2+ influx induced by familial cold autoinflammatory syndrome-associated NLRP3 mutant.
Differentiated TRE-NLRP3-L353P-THP-1 cells were loaded with 4 μM Fluo-8 for 1 hr and were pretreated with VX-765 (20 μM) for 30 min. After doxycycline (30 ng/mL) treatment, the images were recorded at 5 min intervals from 3 hr to 6 hr.
Tables
Appendix 1—key resources table
| Reagent type (species) or resource | Designation | Source or reference | Identifiers | Additional information |
|---|---|---|---|---|
| Cell line (Homo sapiens) | LentiX293T | Takara Bio | Z2180N | |
| Cell line (H. sapiens) | HeLa | Gift from Dr. Kenji Tago | N/A | |
| Cell line (H. sapiens) | EF1-NLRP3-WT-mNeonGreen-HeLa | This manuscript | N/A | Produced by lentiviral transduction |
| Cell line (H. sapiens) | EF1-NLRP3-L353P-mNeonGreen-HeLa | This manuscript | N/A | Produced by lentiviral transduction |
| Cell line (H. sapiens) | EF1-NLRP3-D303N-mNeonGreen-HeLa | This manuscript | N/A | Produced by lentiviral transduction |
| Cell line (H. sapiens) | EF1-NLRP3-Y563N-mNeonGreen-HeLa | This manuscript | N/A | Produced by lentiviral transduction |
| Cell line (H. sapiens) | EF1-NLRP3-Y570C-mNeonGreen-HeLa | This manuscript | N/A | Produced by lentiviral transduction |
| Cell line (H. sapiens) | EF1-NLRP3-L353P-linker-mutant-mNeonGreen-HeLa | This manuscript | N/A | Produced by lentiviral transduction |
| Cell line (H. sapiens) | EF1-NLRP3-D303N-linker-mutant--mNeonGreen-HeLa | This manuscript | N/A | Produced by lentiviral transduction |
| Cell line (H. sapiens) | EF1-mNeonGreen-HeLa | This manuscript | N/A | Produced by lentiviral transduction |
| Cell line (H. sapiens) | EF1-ASC-GFP-HeLa | This manuscript | N/A | Produced by lentiviral transduction |
| Cell line (H. sapiens) | THP-1 | ATCC | TIB-202 | |
| Cell line (H. sapiens) | ASC KO THP-1 | Aizawa et al., 2020 | N/A | Produced by lentiviral transduction |
| Cell line (H. sapiens) | EF1-NLRP3-WT-mNeonGreen/ASC KO THP-1 | This manuscript | N/A | Produced by lentiviral transduction |
| Cell line (H. sapiens) | EF1-NLRP3-L353P-mNeonGreen/ASC KO THP-1 | This manuscript | N/A | Produced by lentiviral transduction |
| Cell line (H. sapiens) | EF1-NLRP3-D303N-mNeonGreen/ASC KO THP-1 | This manuscript | N/A | Produced by lentiviral transduction |
| Cell line (H. sapiens) | TRE-NLRP3-WT-THP-1 | This manuscript | N/A | Produced by lentiviral transduction and limiting dilution |
| Cell line (H. sapiens) | TRE-NLRP3-L353P-THP-1 | This manuscript | N/A | Produced by lentiviral transduction and limiting dilution |
| Cell line (H. sapiens) | TRE-NLRP3-L353P/ASC KO THP-1 | This manuscript | N/A | Produced by lentiviral transduction |
| Cell line (H. sapiens) | TRE-NLRP3-L353P/NEK7 KO THP-1 | This manuscript | N/A | Produced by lentiviral transduction |
| Cell line (H. sapiens) | TRE-NLRP3-L353P/CASP1 KO THP-1 | This manuscript | N/A | Produced by lentiviral transduction |
| Cell line (H. sapiens) | TRE-NLRP3-D303N-THP-1 | Aizawa et al., 2020 | N/A | Produced by lentiviral transduction and limiting dilution |
| Cell line (H. sapiens) | TRE-NLRP3-D303N/ASC KO THP-1 | This manuscript | N/A | Produced by lentiviral transduction |
| Cell line (H. sapiens) | EF1-ASC-GFP/TRE-NLRP3-L353P-THP-1 | This manuscript | N/A | Produced by lentiviral transduction |
| Cell line (H. sapiens) | EF1-ASC-BFP/TRE-NLRP3-L353P-THP-1 | This manuscript | N/A | Produced by lentiviral transduction |
| Cell line (H. sapiens) | EF1-ASC-BFP/TRE-NLRP3-WT-mNeonGreen-THP-1 | This manuscript | N/A | Produced by lentiviral transduction |
| Sequence-based reagent | sgRNA sequence for GFP | Aizawa et al., 2020 | N/A | GAGCTGGACG GCGACGTAAA |
| Sequence-based reagent | sgRNA sequence for apoptosis-associated speck-like protein containing a caspase recruitment domain (ASC) | Aizawa et al., 2020 | N/A | CAGCACGTTA GCGGTGAGCT |
| Sequence-based reagent | sgRNA sequence for NEK7#1 | This manuscript | N/A | ATTACAGAAG GCCTTACGAC |
| Sequence-based reagent | sgRNA sequence for NEK7#2 | This manuscript | N/A | ATAGCCCATA TCCGGTCGTA |
| Sequence-based reagent | sgRNA sequence for CASP1 | Aizawa et al., 2020 | N/A | AAGCTGTTTA TCCGTTCCAT |
| Recombinant DNA reagent | CSCAMCS | RIKEN BRC | RDB05963 | Lentiviral vector for stable gene expression |
| Recombinant DNA reagent | CSIV-TRE-RfA-CMV-KT | RIKEN BRC | RDB12876 | Lentiviral vector for inducible gene expression |
| Recombinant DNA reagent | LentiCRISPRv2 | Addgene | #52,961 | Lentiviral vector expressing sgRNA |
| Transfected construct (H. sapiens) | CSEF1-NLRP3-WT-mNeonGreen | This manuscript | N/A | Lentiviral vector for stable gene expression |
| Transfected construct (H. sapiens) | CSEF1-NLRP3-L353P-mNeonGreen | This manuscript | N/A | Lentiviral vector for stable gene expression |
| Transfected construct (H. sapiens) | CSEF1-NLRP3-D303N-mNeonGreen | This manuscript | N/A | Lentiviral vector for stable gene expression |
| Transfected construct (H. sapiens) | CSEF1-NLRP3-Y563N-mNeonGreen | This manuscript | N/A | Lentiviral vector for stable gene expression |
| Transfected construct (H. sapiens) | CSEF1-NLRP3-Y570C-mNeonGreen | This manuscript | N/A | Lentiviral vector for stable gene expression |
| Transfected construct (H. sapiens) | CSEF1-NLRP3-L353P-linker-mutant-mNeonGreen | This manuscript | N/A | Lentiviral vector for stable gene expression |
| Transfected construct (H. sapiens) | CSEF1-NLRP3-D303N-linker-mutant -mNeonGreen | This manuscript | N/A | Lentiviral vector for stable gene expression |
| Transfected construct (H. sapiens) | CSEF1-mNeonGreen | This manuscript | N/A | Lentiviral vector for stable gene expression |
| Transfected construct (H. sapiens) | CSEF1-ASC-GFP | This manuscript | N/A | Lentiviral vector for stable gene expression |
| Transfected construct (H. sapiens) | CSEF1-ASC-BFP | This manuscript | N/A | Lentiviral vector for stable gene expression |
| Transfected construct (H. sapiens) | CSIV-TRE-NLRP3-WT-CMV-KT | This manuscript | N/A | Lentiviral vector for inducible gene expression |
| Transfected construct (H. sapiens) | CSIV-TRE-NLRP3-L353P-CMV-KT | This manuscript | N/A | Lentiviral vector for inducible gene expression |
| Transfected construct (H. sapiens) | CSIV-TRE-NLRP3-D303N-CMV-KT | Aizawa et al., 2020 | N/A | Lentiviral vector for inducible gene expression |
| Transfected construct (H. sapiens) | CSIV-TRE-NLRP3-WT-mNeonGreen-CMV-KT | This manuscript | N/A | Lentiviral vector for inducible gene expression |
| Transfected construct (H. sapiens) | CSIV-TRE-NLRP3-L353P-mNeonGreen -CMV-KT | This manuscript | N/A | Lentiviral vector for inducible gene expression |
| Transfected construct (H. sapiens) | LentiCRISPRv2 sgGFP | Aizawa et al., 2020 | N/A | Lentiviral vector expressing sgRNA |
| Transfected construct (H. sapiens) | LentiCRISPRv2 sgASC | Aizawa et al., 2020 | N/A | Lentiviral vector expressing sgRNA |
| Transfected construct (H. sapiens) | LentiCRISPRv2 sgNEK7 | This manuscript | N/A | Lentiviral vector expressing sgRNA |
| Transfected construct (H. sapiens) | LentiCRISPRv2 sgCASP1 | Aizawa et al., 2020 | N/A | Lentiviral vector expressing sgRNA |
| Antibody | Rabbit polyclonal anti-NEK7 | Abcam | EPR4900 | WB (1:1000) |
| Antibody | Mouse monoclonal anti-NLRP3 | Adipogen | AG-20B-0014 | WB (1:2000) |
| Antibody | Rabbit polyclonal anti-ASC | Adipogen | AG-25B-0006 | WB (1:2000) |
| Antibody | Rabbit monoclonal anti-caspase-1 (D7F10) | Cell Signaling Technology | #3,866 | WB (1:1000) |
| Antibody | Rabbit polyclonal anti-IL-1β | Santa Cruz | sc-7884 | WB (1:1000) |
| Antibody | Mouse monoclonal anti-β-actin | Sigma-Aldrich | A5441 | WB (1:4000) |
| Commercial assay or kit | Lentiviral qPCR Titration Kit | Applied Biological Materials | #LV900 | |
| Commercial assay or kit | Human IL-1 beta/IL-1F2 DuoSet ELISA | R&D Systems | DY201 | |
| Commercial assay or kit | Super Script VILO cDNA Synthesis kit | Thermo Fisher Scientific | ||
| Chemical compound, drug | MCC950 | AdipoGen | AG-CR1-3615-M005 | |
| Chemical compound, drug | DRAQ5 | Biolegend | 424,101 | 1 µM |
| Chemical compound, drug | Probenecid | Cayman | 14,981 | |
| Chemical compound, drug | Trovafloxacin mesylate | Cayman | 9000303 | |
| Chemical compound, drug | 4',6-diamidino-2-phenylindole, dihydrochloride | DOJINDO | D523 | 1 µg/mL |
| Chemical compound, drug | Fura-2/AM | DOJINDO | F015 | 3 µM |
| Chemical compound, drug | Hoechst33342 | DOJINDO | H342 | 1 µg/mL |
| Chemical compound, drug | PEI MAX | Polyscience | 24765–1 | |
| Chemical compound, drug | VX-765 | Selleck | S2228 | |
| Chemical compound, drug | Pluronic F127 | Sigma-Aldrich | P2443 | 0.04% |
| Chemical compound, drug | Puromycin | Sigma-Aldrich | P8833 | 2 µg/mL |
| Chemical compound, drug | Fluo-8 | Santa Cruz | Sc-362562 | 4 µM |
| Chemical compound, drug | Bis(sulfosuccinimidyl)suberate | Thermo Fisher Scientific | 21,580 | 2 mM |
| Chemical compound, drug | SYTOX Deep Red | Thermo Fisher Scientific | S11380 | 100 nM |
| Chemical compound, drug | Doxycycline Hydrochloride n-Hydrate | Wako | 049–31121 | |
| Chemical compound, drug | Phorbol 12-Myristate 13-Acetate | Wako | 162–23591 | 200 nM |
| Software, algorithm | GraphPad Prism 6 | Graph Pad Software | RRID: SCR_002798 | |
| Software, algorithm | ImageJ/FIJI (2.1.0/1.53 c) | Schindelin et al., 2012 | RRID: SCR_002285 | |
| Software, algorithm | IUpred2A | Mészáros et al., 2018 | RRID: SCR_014632 | |
| Software, algorithm | R version 4.0.2 | R project | RRID: SCR_001905 |
Additional files
Download links
A two-part list of links to download the article, or parts of the article, in various formats.
Downloads (link to download the article as PDF)
Open citations (links to open the citations from this article in various online reference manager services)
Cite this article (links to download the citations from this article in formats compatible with various reference manager tools)
Cryo-sensitive aggregation triggers NLRP3 inflammasome assembly in cryopyrin-associated periodic syndrome
eLife 11:e75166.
https://doi.org/10.7554/eLife.75166


