Macrophage network dynamics depend on haptokinesis for optimal local surveillance
- Max Planck Institute of Immunobiology and Epigenetics, Germany
- International Max Planck Research School for Immunobiology, Epigenetics and Metabolism (IMPRS-IEM), Germany
- Faculty of Biology, University of Freiburg, Germany
Figures
Figure 1 with 5 supplements
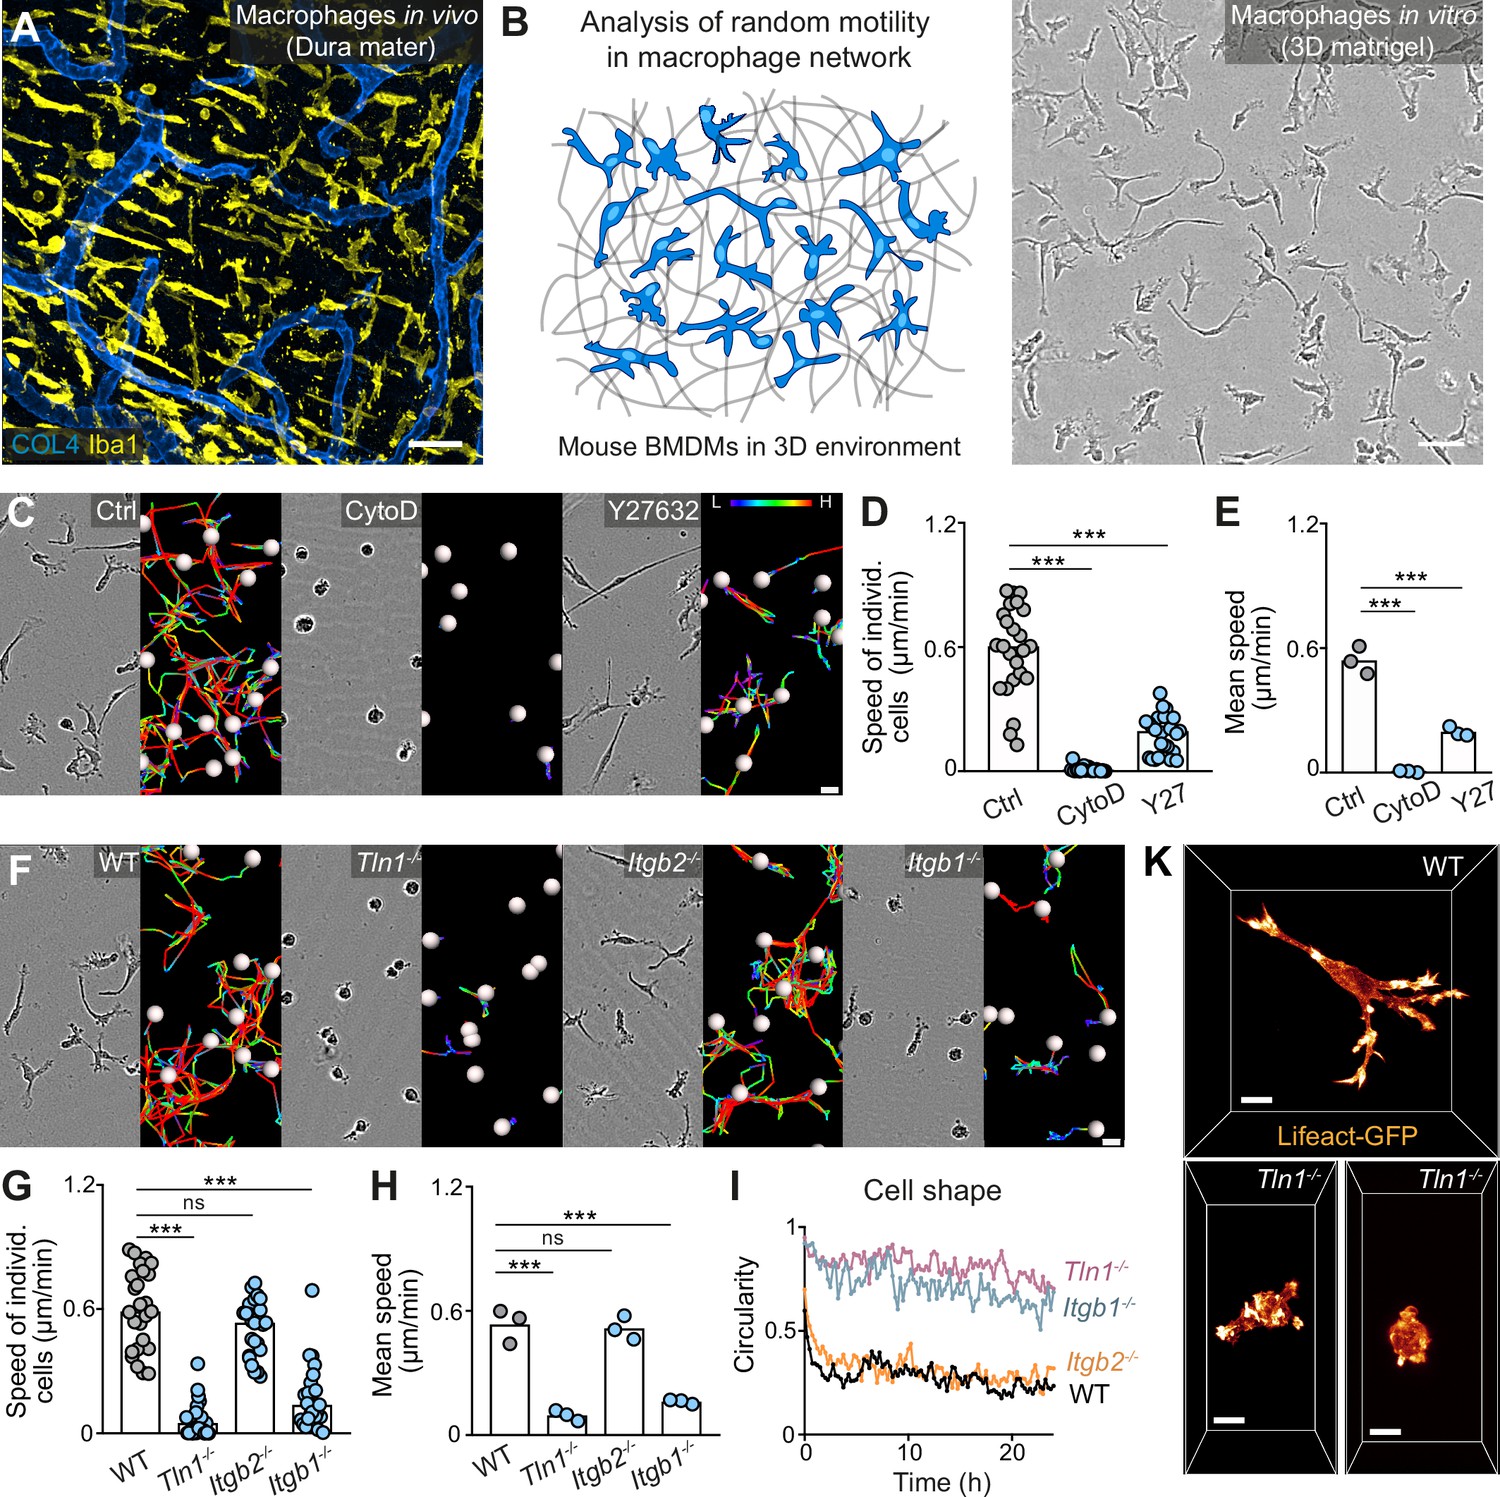
Haptokinetic random motility of macrophages in three-dimensional (3D) matrices.
(A) Representative macrophage network in adult mouse tissue. Immunofluorescence staining of a dura mater whole mount preparation, showing macrophages (yellow) and blood vasculature (blue). COL4: collagen IV. (B) Scheme (left) and brightfield image (right) for studying macrophage network dynamics in 3D in vitro matrices. (C–E) Analysis of bone marrow-derived macrophage (BMDM) random motility in the presence of cytochalasin D (CytoD) or Y27632. (C) Representative cell morphologies (brightfield microscopy) and pseudo-colored tracks (displacement delta length: L(low) = 0, H(high) = 15) over 24 hr. (D) Individual cell speeds from one independent experiment (dots represent randomly chosen cells per condition, N = 25), and (E) mean speed values calculated from three biological replicates (n = 3). (F–H) Analysis of BMDM random motility upon genetic interference with integrin functionality, including (F) cell morphologies and tracks over 24 hr, (G) individual cell speeds from one independent experiment (N = 25), and (H) mean speed values calculated from three biological replicates (n = 3). (I) Graphical analysis of cell shape at 15 min time intervals over 24 hr for integrin-mutant BMDMs. Dots are mean values of N = 5 randomly chosen cells per genotype. A circularity value of 1 equals a perfectly circular cell. (K) Confocal live-cell microscopy of Lifeact-GFP expressing WT or Tln1−/− BMDMs in 3D matrigel. Bars in graphs: median (D, G), mean (E, H). Statistical tests: ***p ≤ 0.001, Dunn’s multiple comparison (post hoc Kruskal-Wallis test) (D, G); ***p ≤ 0.001, Dunnett’s multiple comparison (post hoc analysis of variance [ANOVA]) (E, H). Scale bars: 50 µm (A, B), 10 µm (K), 20 µm (C, F).
-
Figure 1—source data 1
Numerical data for the graph in Figure 1D.
- https://cdn.elifesciences.org/articles/75354/elife-75354-fig1-data1-v1.csv
-
Figure 1—source data 2
Numerical data for the graph in Figure 1E.
- https://cdn.elifesciences.org/articles/75354/elife-75354-fig1-data2-v1.csv
-
Figure 1—source data 3
Numerical data for the graph in Figure 1G.
- https://cdn.elifesciences.org/articles/75354/elife-75354-fig1-data3-v1.csv
-
Figure 1—source data 4
Numerical data for the graph in Figure 1H.
- https://cdn.elifesciences.org/articles/75354/elife-75354-fig1-data4-v1.csv
-
Figure 1—source data 5
Numerical data for the graph in Figure 1I.
- https://cdn.elifesciences.org/articles/75354/elife-75354-fig1-data5-v1.csv
Figure 1—figure supplement 1
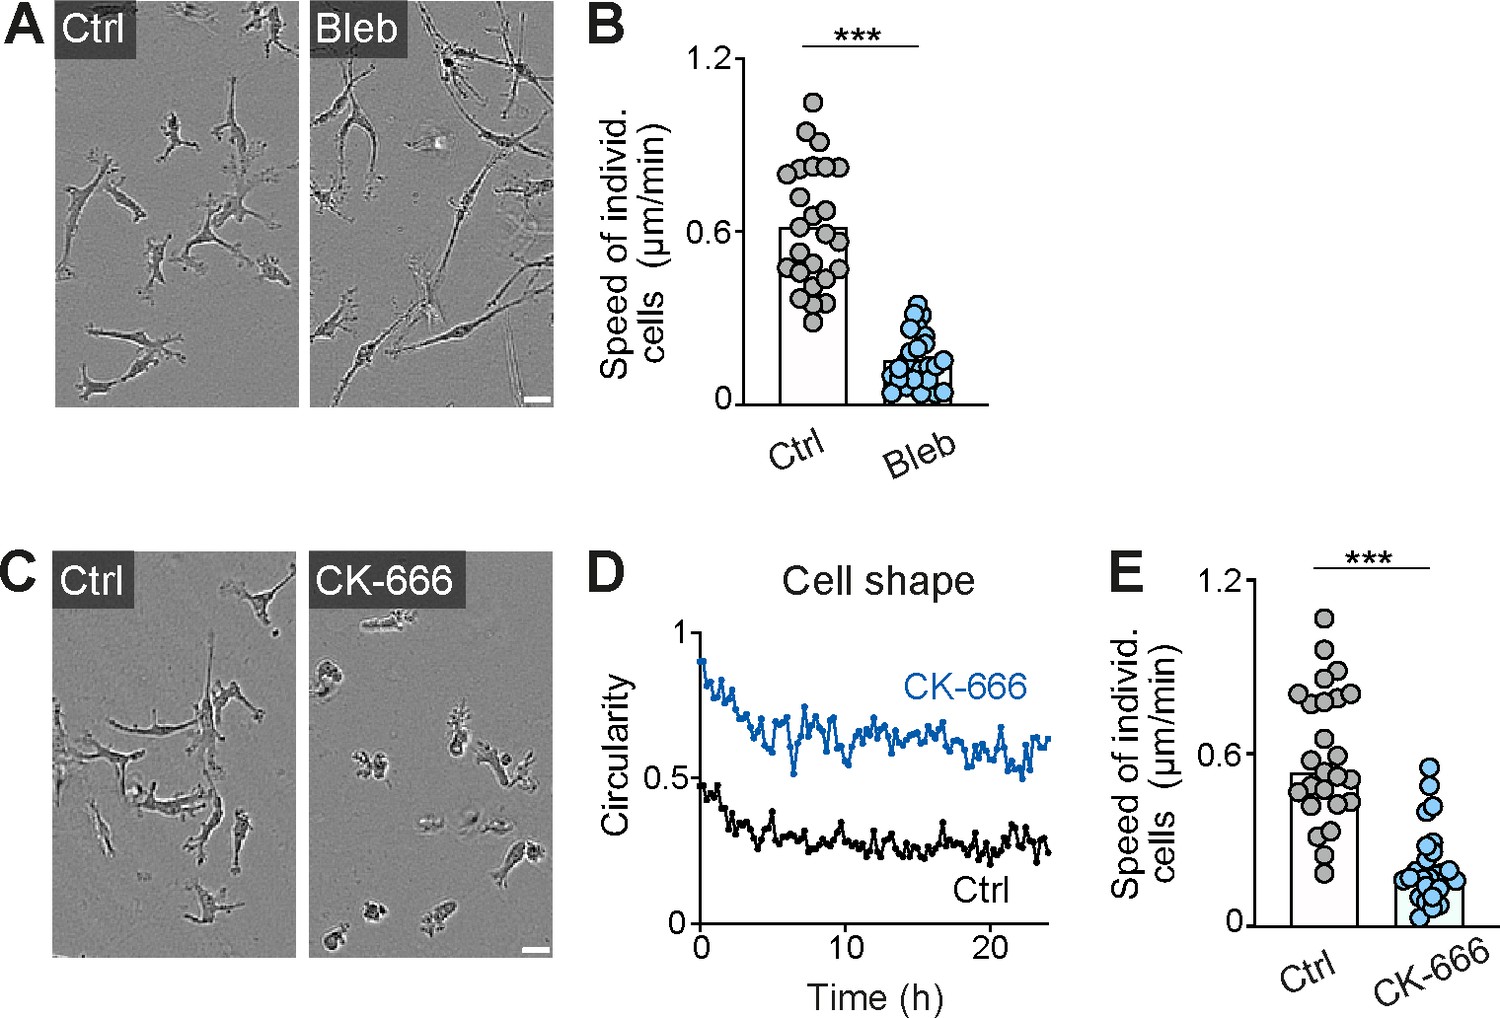
Actomyosin contraction and dendritic actin networks regulate random motility of macrophages in three-dimensional (3D) matrices.
(A, B) Analysis of bone marrow-derived macrophage (BMDM) random motility in the presence of blebbistatin in 3D matrigel. (A) Representative cell morphologies (brightfield microscopy), (B) individual cell speeds from one independent experiment (dots represent randomly chosen cells per condition, N = 25). Bars display the mean; ***p ≤ 0.001, t test. (C–E) Analysis of BMDM random motility in the presence of CK-666 in 3D matrigel. (C) Representative cell morphologies (brightfield microscopy), (D) graphical analysis of cell shape at 15 min time intervals over 24 hr. Dots are mean values of N = 5 randomly chosen cells per genotype. A circularity value of 1 equals a perfectly circular cell, (E) individual cell speeds from one independent experiment (dots represent randomly chosen cells per condition, N = 25). Bars display the median; ***p ≤ 0.001, U test. Scale bars: 20 µm.
-
Figure 1—figure supplement 1—source data 1
Numerical data for the graph in Figure 1—figure supplement 1B.
- https://cdn.elifesciences.org/articles/75354/elife-75354-fig1-figsupp1-data1-v1.csv
-
Figure 1—figure supplement 1—source data 2
Numerical data for the graph in Figure 1—figure supplement 1D.
- https://cdn.elifesciences.org/articles/75354/elife-75354-fig1-figsupp1-data2-v1.csv
-
Figure 1—figure supplement 1—source data 3
Numerical data for the graph in Figure 1—figure supplement 1E.
- https://cdn.elifesciences.org/articles/75354/elife-75354-fig1-figsupp1-data3-v1.csv
Figure 1—figure supplement 2
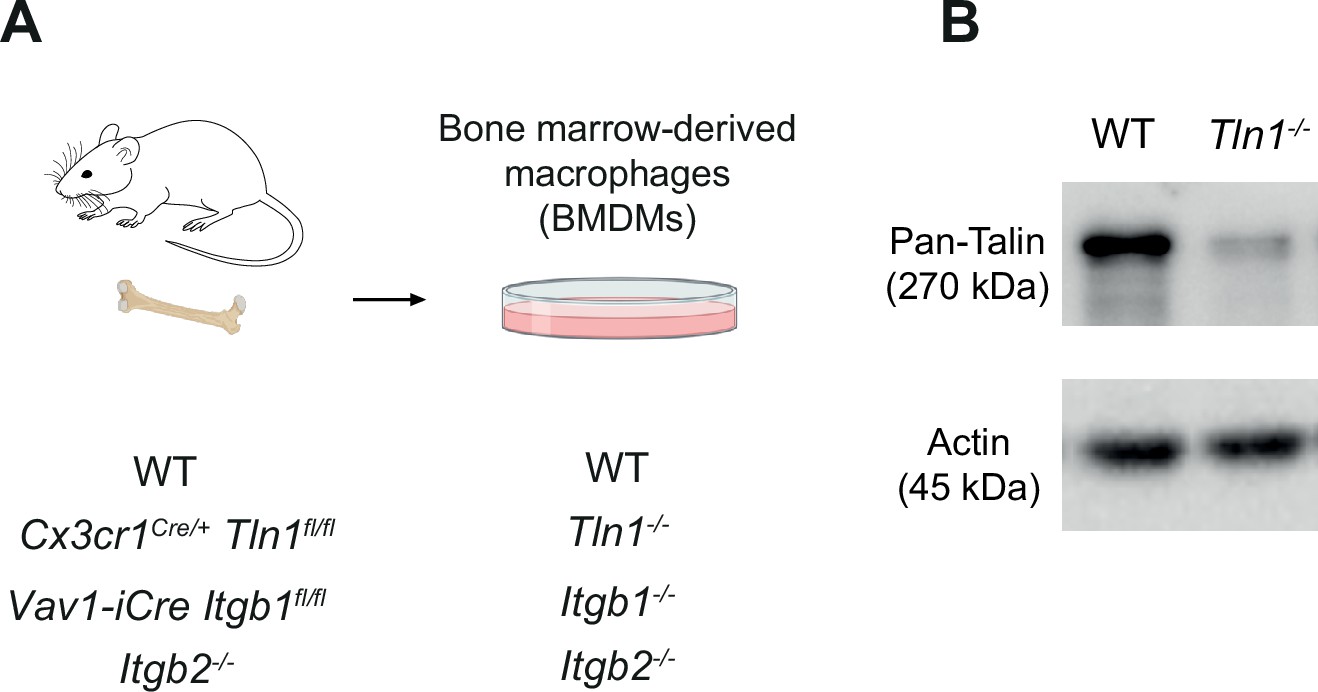
Characterization of mouse bone marrow-derived macrophages (BMDMs) with impaired integrin functionality.
(A) Scheme for the generation of BMDMs from conditional and constitutive knockout mouse models to obtain BMDMs depleted for talin-1 (Tln1−/−) or cell surface integrins from the β1 family (Itgb1−/−) orβ2 family (Itgb2−/−). (B) The efficiency of conditional talin-1 knockout was confirmed by immunoblot analysis (by using a pan-talin antibody recognizing talin-1 and talin-2). Cell lysates were generated from WT and Tln1−/− BMDMs. Actin was used as loading control.
-
Figure 1—figure supplement 2—source data 1
Non-annotated Western blot for Figure 1—figure supplement 2B.
- https://cdn.elifesciences.org/articles/75354/elife-75354-fig1-figsupp2-data1-v1.zip
-
Figure 1—figure supplement 2—source data 2
Annotated Western blot for Figure 1—figure supplement 2B.
- https://cdn.elifesciences.org/articles/75354/elife-75354-fig1-figsupp2-data2-v1.zip
Figure 1—figure supplement 3
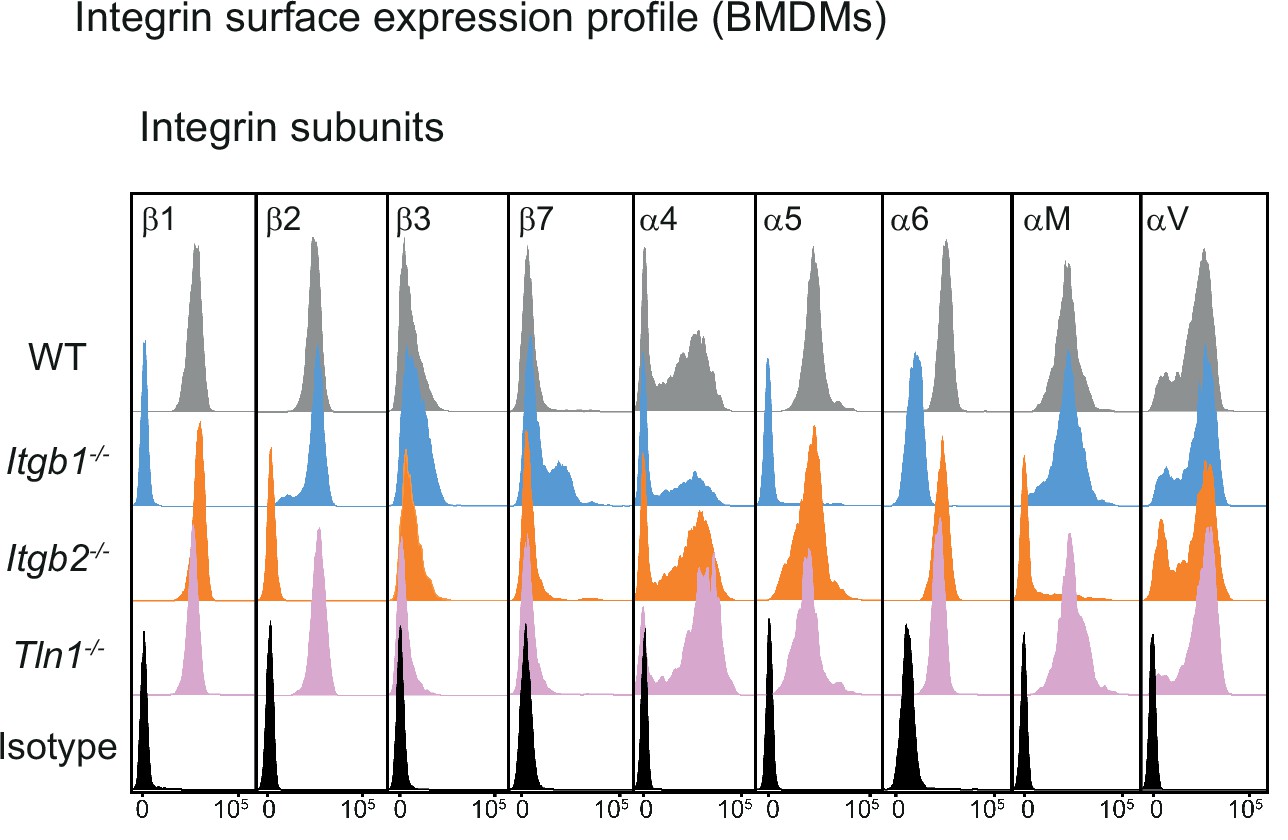
Characterization of mouse bone marrow-derived macrophages (BMDMs) with impaired integrin functionality.
Flow cytometry analysis of integrin subunits expressed on the surface of WT, Itgb1−/−, Itgb2−/−, and Tln1−/− BMDMs. β1 integrin depletion leads to loss of fibronectin-binding α5β1 and laminin-binding α6β1 integrins from the cell surface of Itgb1−/− macrophages. A pool of the α4 subunit remains retained on the cell surface in combination with an upregulation of the corresponding β7 subunit. This switch from α4β1 to α4β7 heterodimers is a well-documented phenomenon for Itgb1−/− leukocytes. β2 integrin deficiency leads to loss of the αM subunit (CD11b) and thus αMβ2 (Mac-1, CR3) from the macrophage surface. Talin depletion in BMDMs leaves the cell surface integrin expression profile unchanged.
Figure 1—video 1
Random motility of macrophages in three-dimensional (3D) matrices.
Bone marrow-derived macrophages (BMDMs) were cultivated from WT mice and embedded in matrigel. Live-cell migration and shape changes were recorded over 20 hr with phase-contrast microscopy using an Incucyte S3 instrument. This video relates to Figure 1B.
Figure 1—video 2
Talin-1 and β1 integrins control the mesenchymal shape and random motility of macrophages in matrigel.
First part: Comparison of cell shape and migratory behavior of WT, Tln1−/−, Itgb2−/−, and Itgb1−/− bone marrow-derived macrophages (BMDMs) in matrigel. Live-cell migration and shape changes were recorded over 20 hr with phase-contrast microscopy using an Incucyte S3 instrument. Second part: Comparison of matrigel-embedded BMDMs from Vav1-iCre +/− Tln1fl/fl Lifeact-GFP+/− WT Lifeact-GFP+/−. Live-cell shape changes and protrusion dynamics were recorded over 10 min with phase-contrast microscopy using confocal fluorescence microscopy. Lifeact-GFP signal is displayed as glow heatmap color. Third part: Comparison of cell shape and migratory behavior of vehicle treated and CK-666 treated BMDMs in matrigel. Live-cell migration and shape changes were recorded over 20 hr with phase-contrast microscopy using an Incucyte S3 instrument. This video relates to Figure 1F–K and Figure 1—figure supplement 1.
Figure 2 with 1 supplement
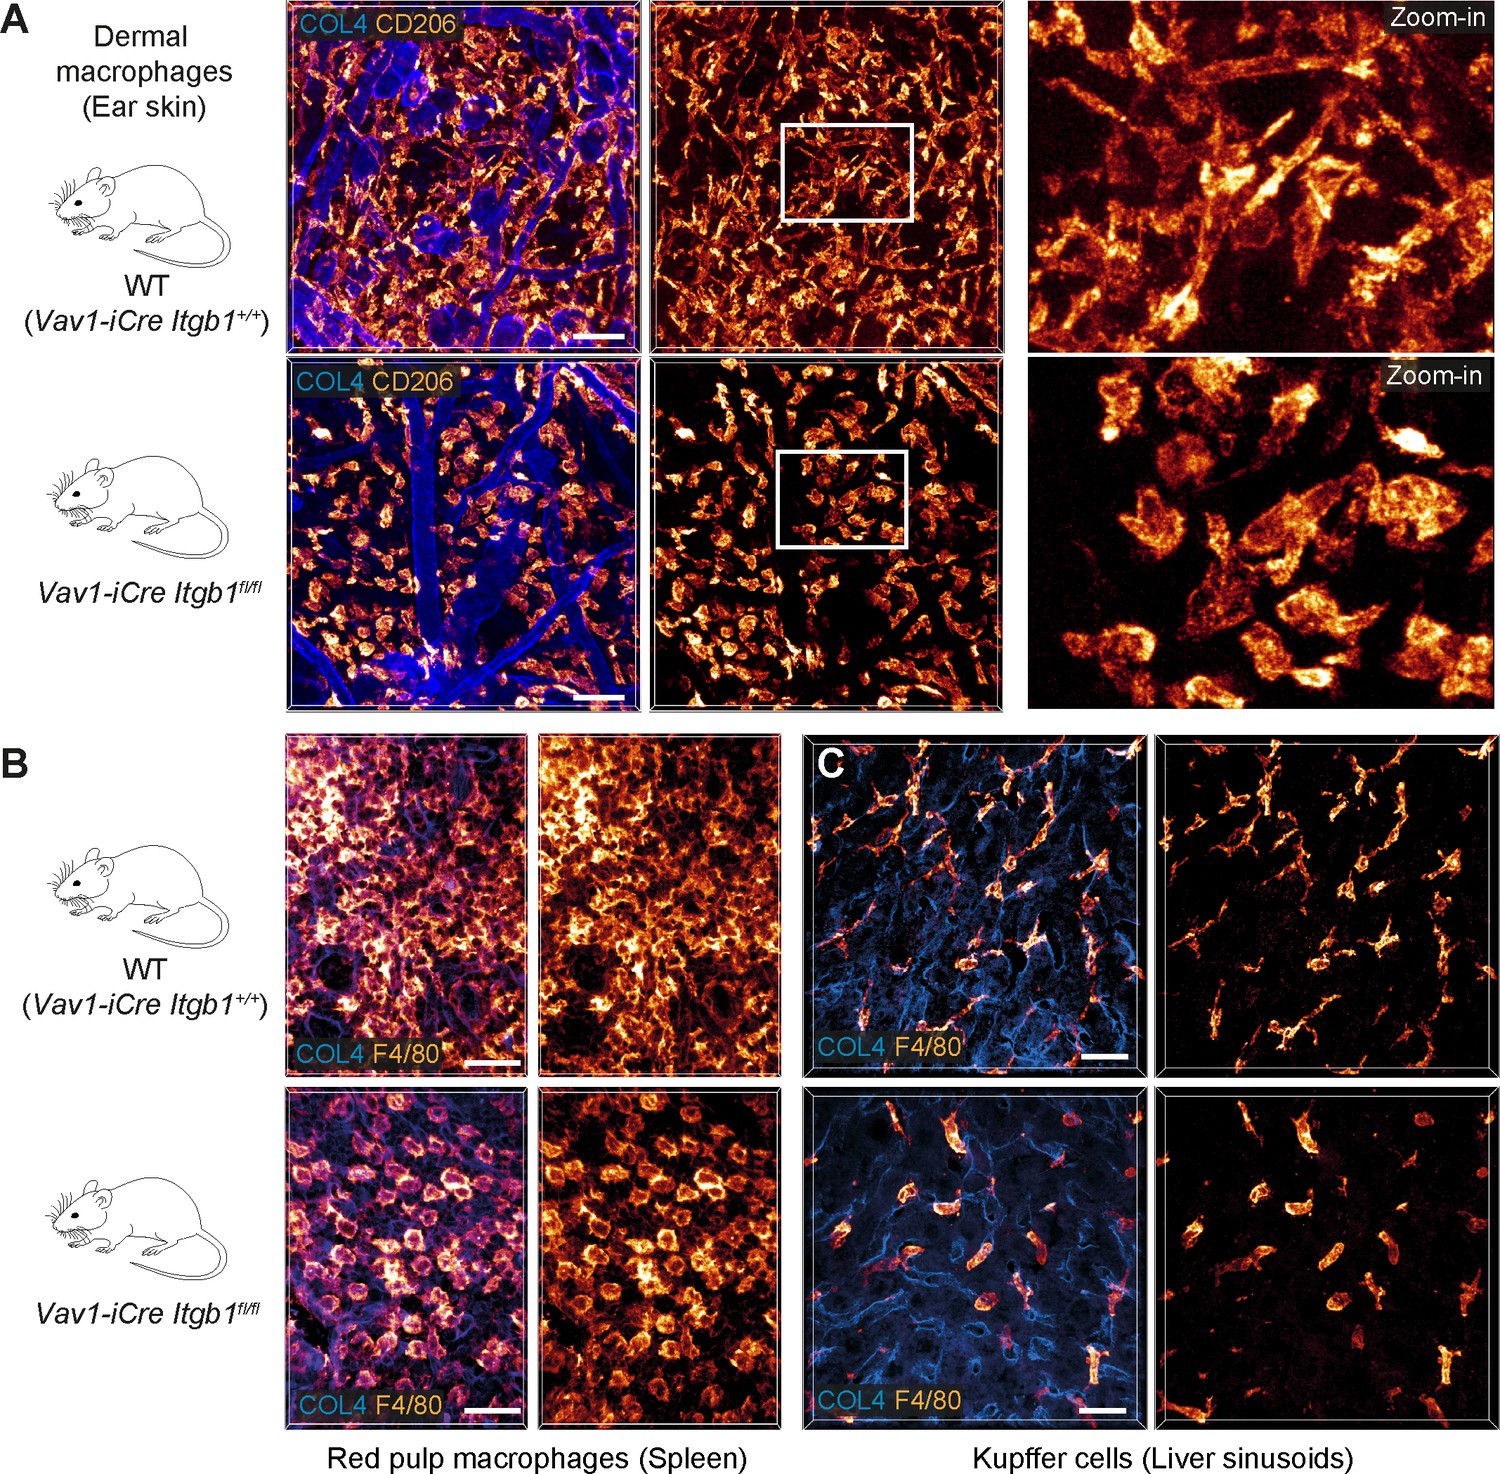
β1 integrins define the mesenchymal shape of macrophages in mouse tissues.
(A–C) Comparative analysis of ear skin dermis (A), spleen (B) and liver (C) tissues of adult Vav1-iCre+/− Itgb1fl/fl mice and littermate controls. Endogenous macrophage subsets were detected with immuno-stainings against CD206 (A) and F4/80 (B, C) and fluorescence signal intensities displayed as glow heatmap color. Collagen IV (COL4)-expressing basement membrane (A, C) or reticular network (B) structures are also displayed (blue). All images are projections of several confocal z-planes. Scale bars: 50 µm (A), 30 µm (B, C).
Figure 2—figure supplement 1
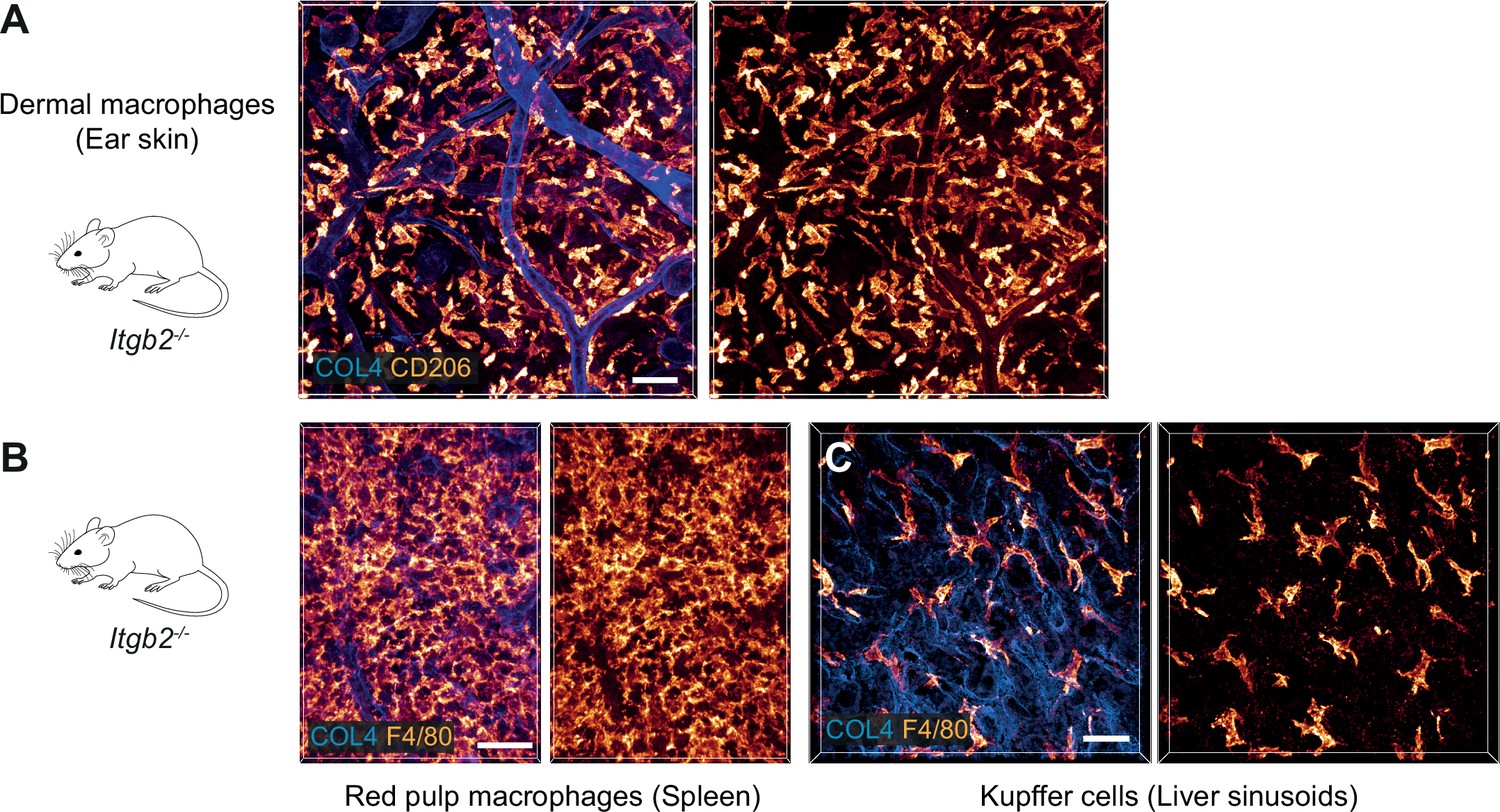
β2 integrins do not contribute to the mesenchymal shape of macrophages in mouse tissues.
(A–C) Immunofluorescence analysis of ear skin dermis (A), spleen (B) and liver (C) tissues of adult Itgb2−/− mice. Endogenous macrophage subsets were detected with immuno-stainings against CD206 (A) and F4/80 (B,C) and fluorescence signal intensities displayed as glow heatmap color. Collagen IV (COL4)-expressing basement membrane (A, C) or reticular network (B) structures are also displayed (blue). All images are projections of several confocal z-planes. Scale bars: 50 µm (A), 30 µm (B, C).
Figure 3 with 3 supplements
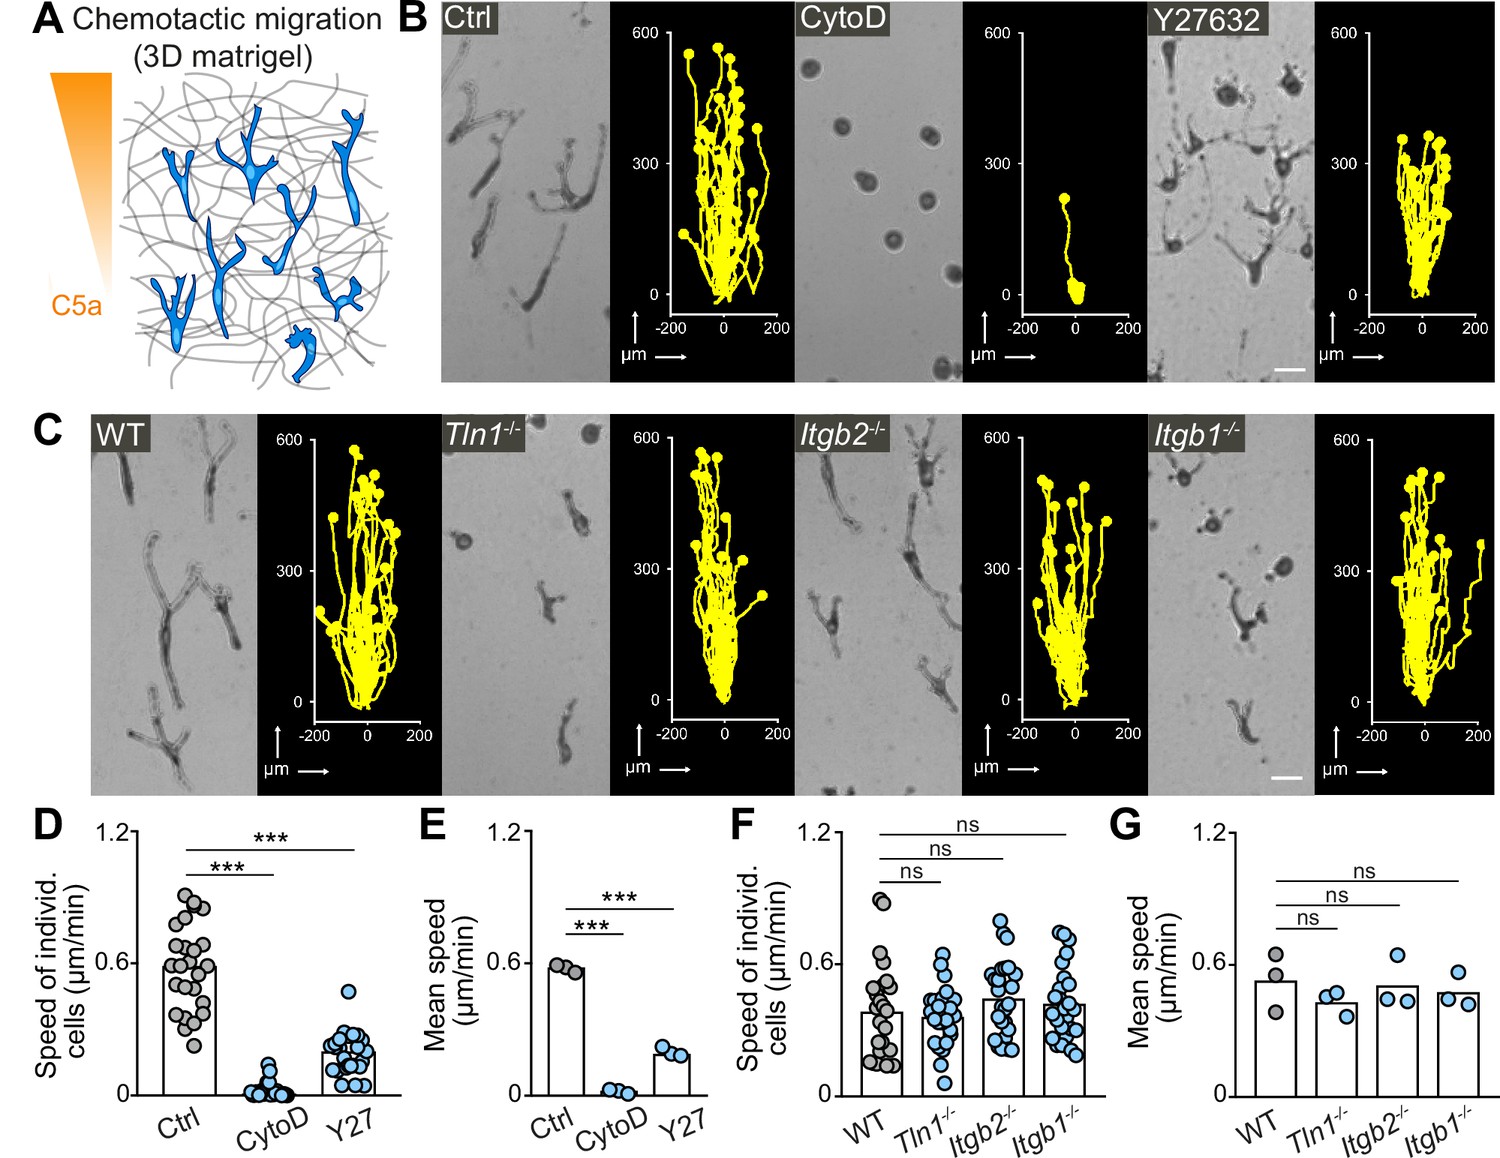
Integrin-independent three-dimensional (3D) macrophage movement during chemotactic responses.
(A) Scheme for studying chemotactic macrophage migration toward C5a gradients in 3D in vitro matrices. (B, C) Representative cell morphologies (brightfield microscopy) and tracks over 24 hr of chemotaxing bone marrow-derived macrophages (BMDMs) (B) in the presence of cytochalasin D (CytoD) and Y27632, and (C) upon genetic interference with integrin functionality. Scale bars: 25 µm. (D–G) Analysis of BMDM chemotactic migration, including (D,F) individual cell speeds from one independent experiment (dots represent randomly chosen cells per condition, N = 25), and (F,G) mean speed values of three biological replicates (n = 3). Bars in graphs: median (D–F), mean (E–G). Statistical tests: ***p ≤ 0.001, Dunn’s multiple comparison (post hoc Kruskal-Wallis test) (D); ***p ≤ 0.001, Dunnett’s multiple comparison (post hoc analysis of variance [ANOVA]) (E–G).
-
Figure 3—source data 1
Numerical data for the graph in Figure 3D.
- https://cdn.elifesciences.org/articles/75354/elife-75354-fig3-data1-v1.csv
-
Figure 3—source data 2
Numerical data for the graph in Figure 3E.
- https://cdn.elifesciences.org/articles/75354/elife-75354-fig3-data2-v1.csv
-
Figure 3—source data 3
Numerical data for the graph in Figure 3F.
- https://cdn.elifesciences.org/articles/75354/elife-75354-fig3-data3-v1.csv
-
Figure 3—source data 4
Numerical data for the graph in Figure 3G.
- https://cdn.elifesciences.org/articles/75354/elife-75354-fig3-data4-v1.csv
Figure 3—figure supplement 1
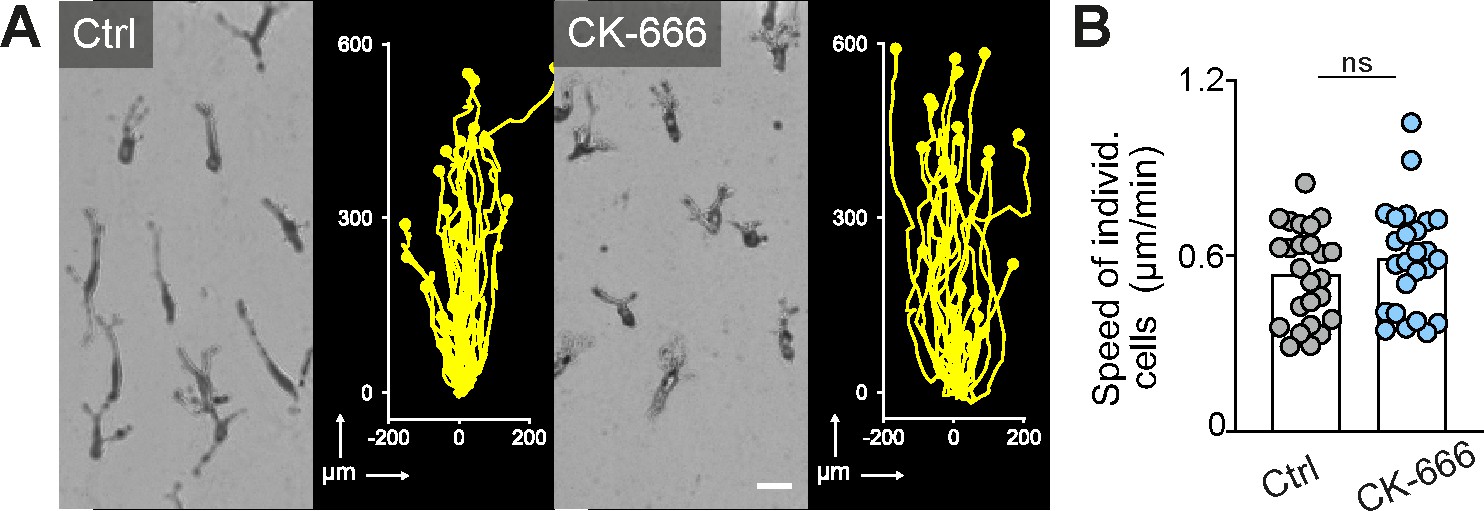
Arp2/3 complex-mediated dendritic actin networks are dispensable for macrophage chemotaxis in three-dimensional (3D) matrigel.
(A) Representative cell morphologies (brightfield microscopy) and tracks over 24 hr of bone marrow-derived macrophages (BMDMs) following a C5a gradient in matrigel in the presence of CK-666. Scale bar: 25 µm. (B) Analysis of BMDM chemotactic migration, individual cell speeds from one independent experiment (dots represent randomly chosen cells per condition, N = 25). Bars display the mean; ns: non-significant, t test.
-
Figure 3—figure supplement 1—source data 1
Numerical data for the graph in Figure 3—figure supplement 1B.
- https://cdn.elifesciences.org/articles/75354/elife-75354-fig3-figsupp1-data1-v1.csv
Figure 3—figure supplement 2
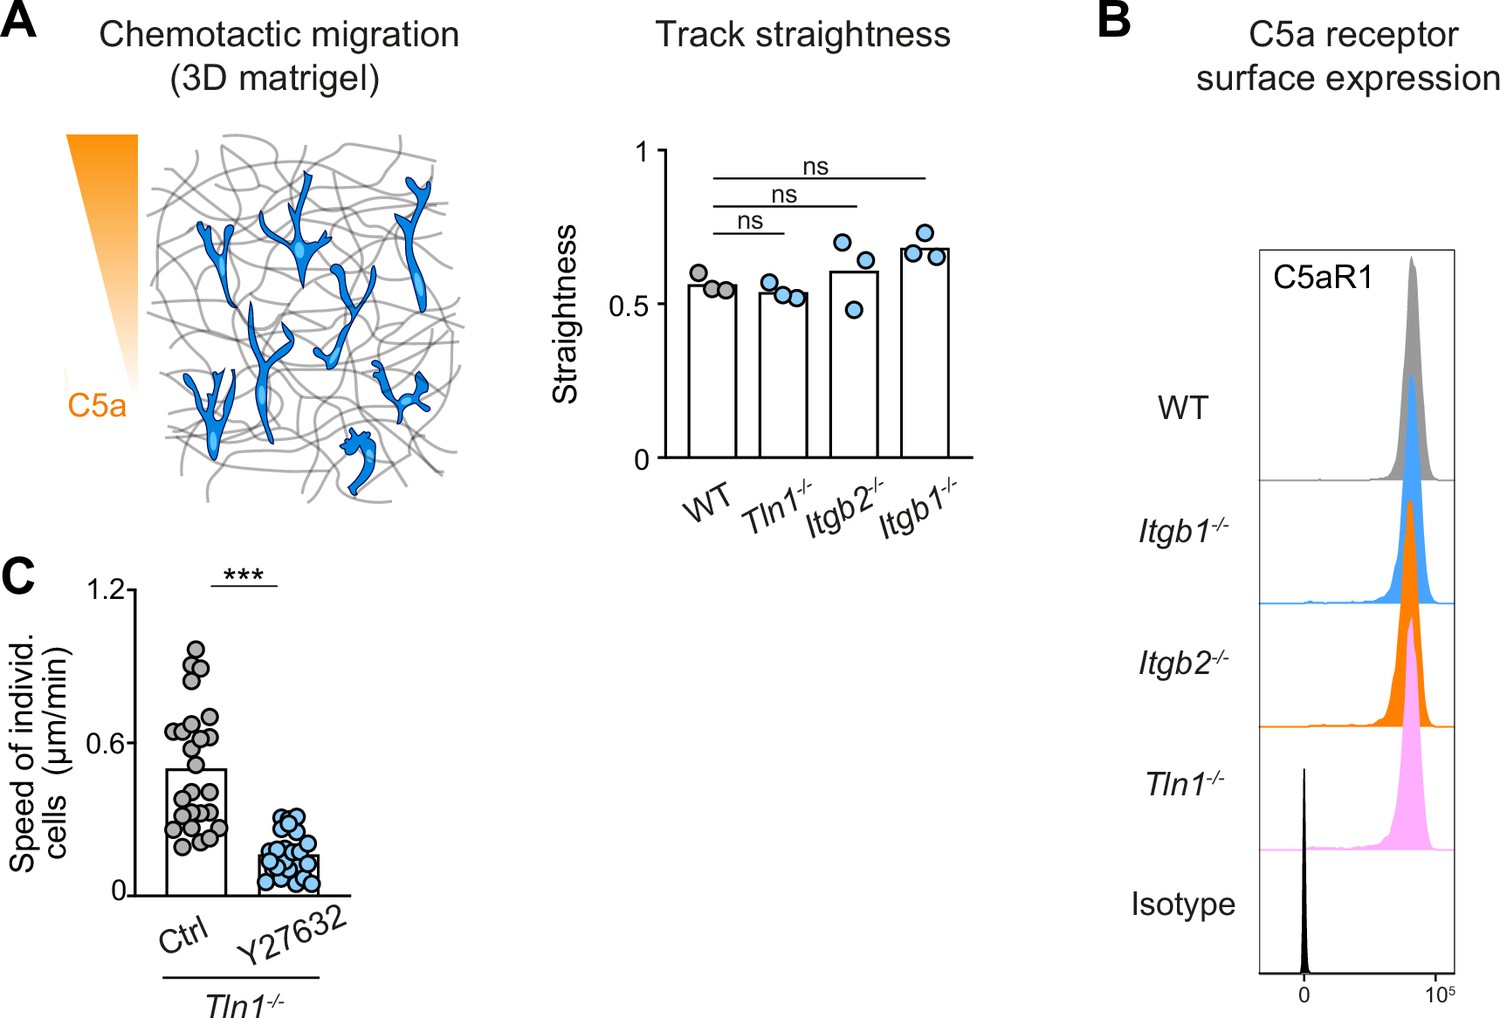
Track straightness and C5aR1 expression are unaltered in chemotaxing bone marrow-derived macrophages (BMDMs) with impaired integrin functionality.
(A) Analysis of track straightness during BMDM chemotactic migration toward C5a gradients. Mean speed values were calculated from three biological replicates (n = 3). In each biological replicate N = 25 cells were tracked and analyzed. Bars in graph display the mean; ns: non-significant, Dunnett’s multiple comparison (post hoc analysis of variance [ANOVA]). (B) Flow cytometry analysis of C5aR1 cell surface expression on WT, Itgb1−/−, Itgb2−/−, and Tln1−/− BMDMs. C5aR1 acts as the major chemotactic receptor for the chemoattractant C5a. (C) Analysis of Tln1−/− BMDM chemotactic migration toward a C5a gradient in three-dimensional (3D) matrigel in the presence of Y27632, individual cell speeds from one independent experiment (dots represent randomly chosen cells per condition, N = 25). Bars display the mean; ***p ≤ 0.001, t test.
-
Figure 3—figure supplement 2—source data 1
Numerical data for the graph in Figure 3—figure supplement 2A.
- https://cdn.elifesciences.org/articles/75354/elife-75354-fig3-figsupp2-data1-v1.csv
-
Figure 3—figure supplement 2—source data 2
Numerical data for the graph in Figure 3—figure supplement 2C.
- https://cdn.elifesciences.org/articles/75354/elife-75354-fig3-figsupp2-data2-v1.csv
Figure 3—video 1
Integrin-independent chemotactic movement of macrophages in matrigel.
First part: WT, Tln1−/−, Itgb2−/−, and Itgb1−/− BMDMs were embedded in matrigel and exposed to a chemotactic C5a gradient. Chemotactic migration along the gradient was recorded over 20 hr with phase-contrast microscopy using an Incucyte S3 instrument. The lower row shows an animation of chemotactic cell tracks over the same time period. Second part: CK-666 treated and control BMDMs were embedded in matrigel and exposed to a chemotactic C5a gradient. Chemotactic migration along the gradient was recorded over 19 hr with phase-contrast microscopy using an Incucyte S3 instrument. This video relates to Figure 3C, F and G and Figure 3—figure supplement 1.
Figure 4 with 3 supplements
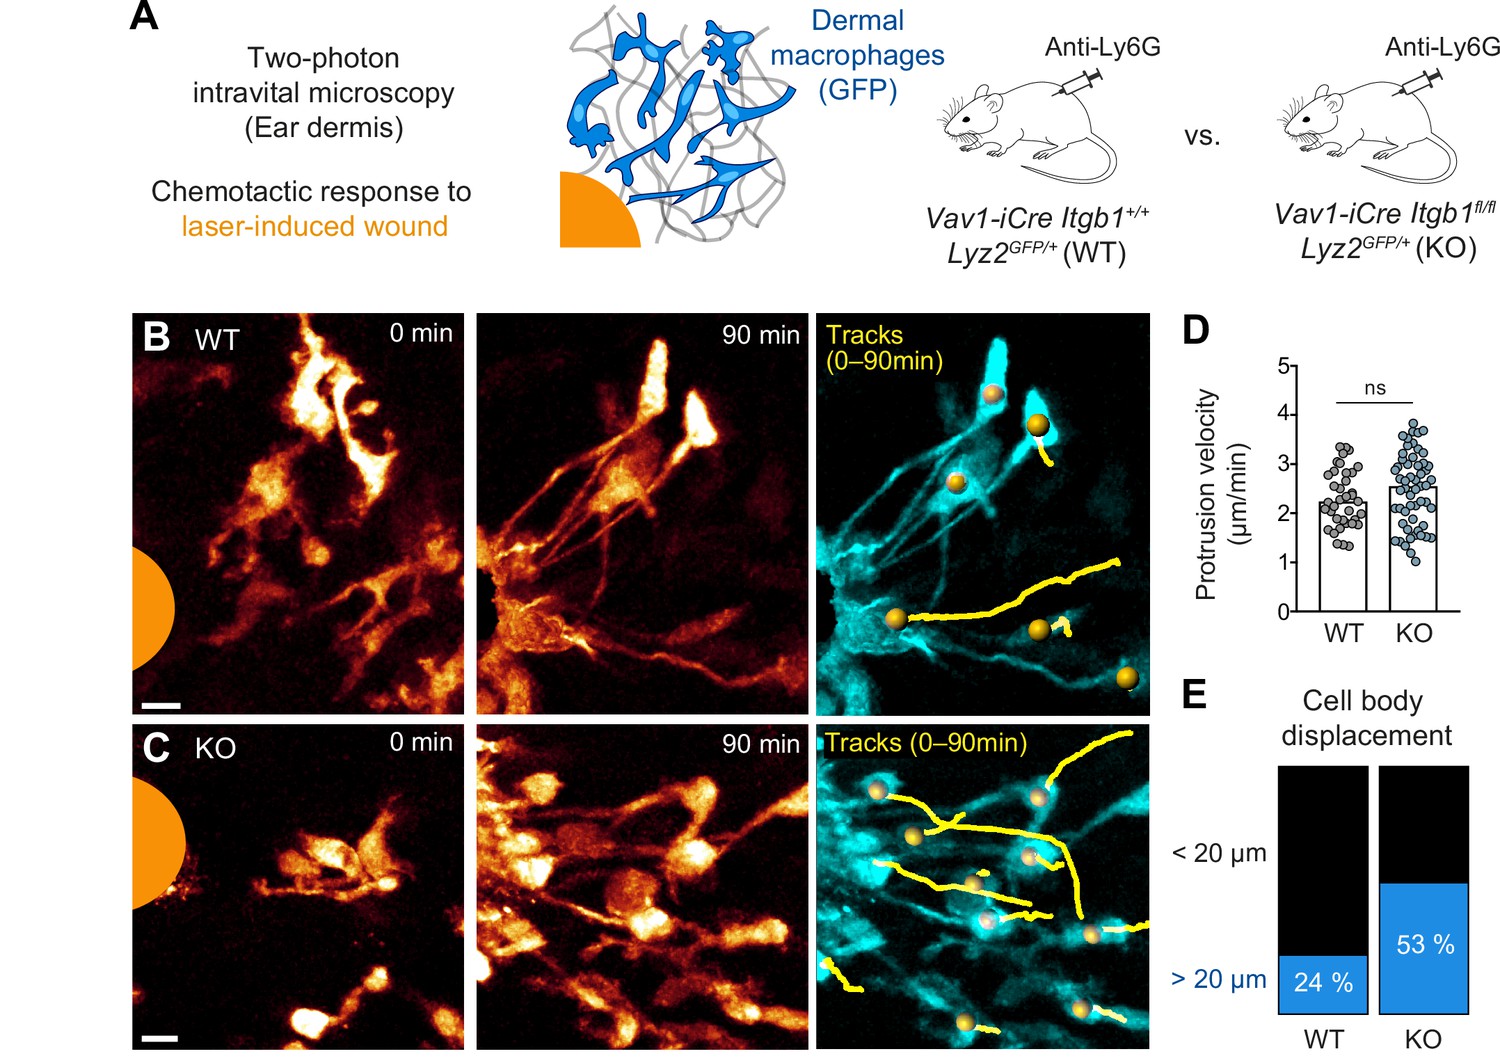
Amoeboid-like macrophages still perform chemotactic migration in mouse tissue.
(A) Scheme for studying the chemotactic response of dermal macrophages to laser-induced tissue injury in mouse ear skin. Two-photon intravital microscopy (2P-IVM) was performed on Vav1-iCre Itgb1fl/fl Lyz2GFP/+ and littermate control mice. Mice were treated with Anti-Ly6G antibody to deplete neutrophils and avoid their presence in imaging field of views. (B, C) 2P-IVM images of GFP-expressing dermal macrophages in WT mice (B) and conditional Itgb1-deficient mice (C) at the onset of the wound response and 90 min later. GFP signal is displayed as glow heatmap color. Cell body displacements are shown as yellow tracks. Scale bars: 10 µm. (D) Velocity analysis of macrophage protrusions moving toward the tissue lesion. Each dot represents one protrusion (WT: N = 37; KO: N = 55). Values are pooled from n = 3 (WT) and n = 4 (KO) mice; ns: non-significant, U test. Bars are median. (E) Cell bodies of responding macrophages were tracked and categorized according to displacement (WT: N = 34; KO: N = 55). Values are pooled from n = 3 (WT) and n = 4 (KO) mice.
-
Figure 4—source data 1
Numerical data for the graph in Figure 4D.
- https://cdn.elifesciences.org/articles/75354/elife-75354-fig4-data1-v1.csv
Figure 4—figure supplement 1
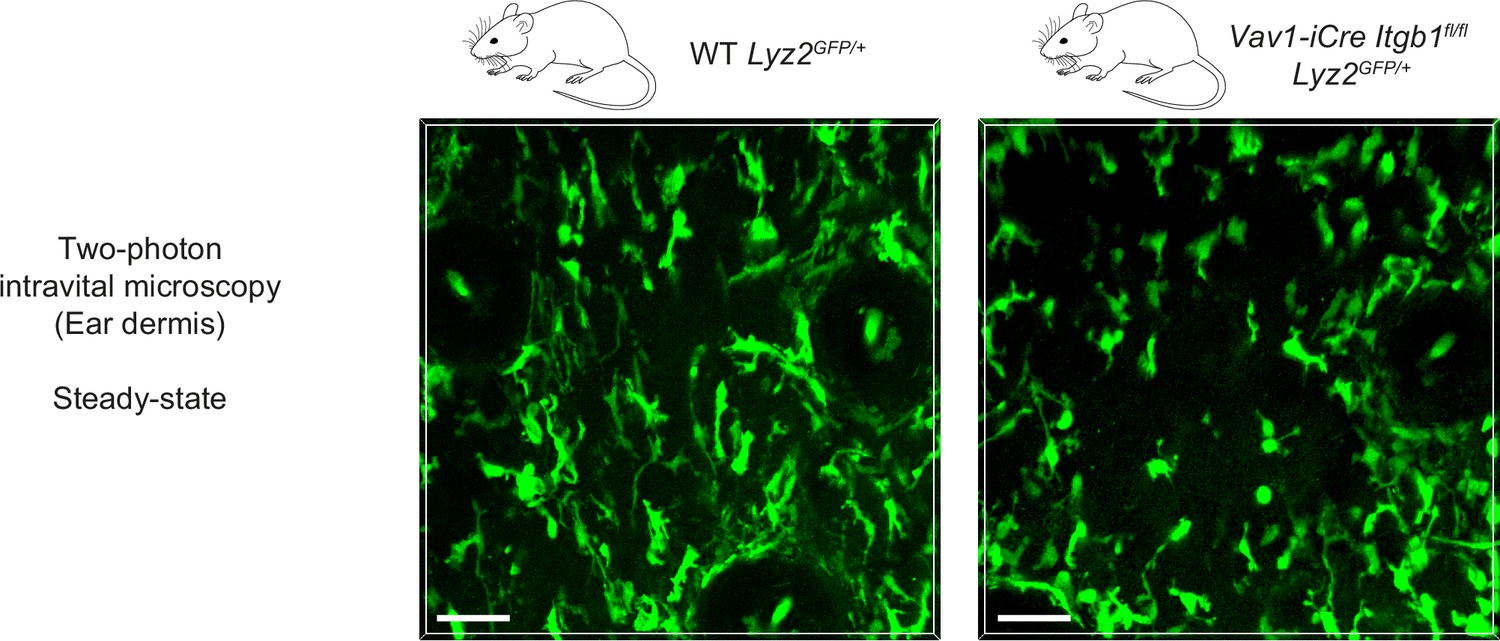
Two-photon intravital microscopy of macrophage shapes in unchallenged mouse skin.
Two-photon intravital microscopy of the dermal compartment in unchallenged ear skin reveals mesenchymal shapes with multiple elongated protrusions in GFP-positive macrophages of WT Lyz2GFP/+ mice. In contrast, the majority of GFP-positive macrophages in the dermis of Vav1-iCre Itgb1fl/fl Lyz2GFP/+ mice showed more amoeboid-like morphologies and less pronounced cell protrusions. Scale bars: 50 µm.
Figure 4—figure supplement 2
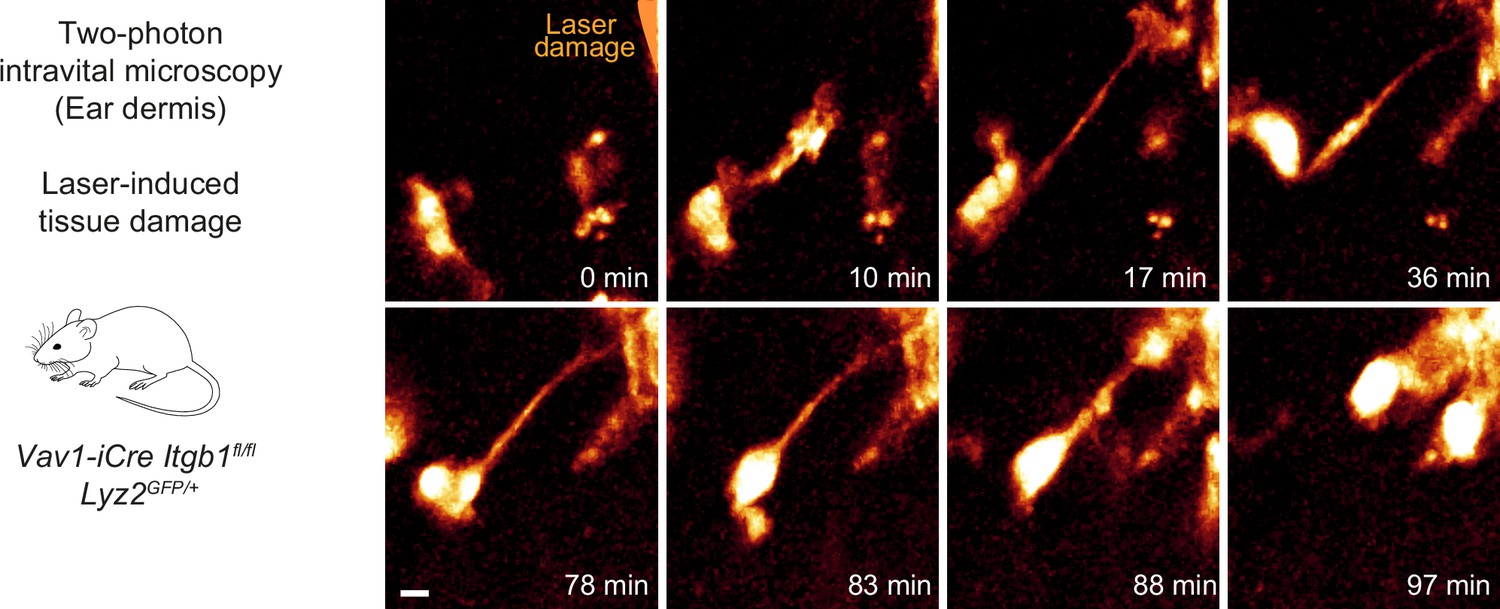
Itgb1-deficient dermal macrophages perform chemotactic migration in mouse skin tissue.
Close-up view and time sequence of an Itgb1-deficient macrophage that chemotactically responds to a laser-induced tissue lesion in the mouse dermis. Despite lack of β1 integrins and loss of mesenchymal cell shape, these cells form directed protrusions and displace their cell bodies toward the wound site. Scale bar: 5 µm.
Figure 4—video 1
Amoeboid-like macrophages still perform chemotactic responses in mouse tissue.
Two-photon intravital microscopy was performed on the ear skin of Vav1-iCre Itgb1fl/fl Lyz2GFP/+ and littermate control mice, which had received neutrophil-depleting Anti-Ly6G antibody to avoid the presence of neutrophils in imaging field of views. Chemotactic protrusion formation and cell body displacement toward a laser-induced tissue injury (orange area) of GFP-expressing dermal macrophages in WT mice (first part) and conditional Itgb1-deficient mice (second part) were recorded over 90 min. GFP signal is displayed as glow heatmap color. This video relates to Figure 4.
Figure 5 with 3 supplements
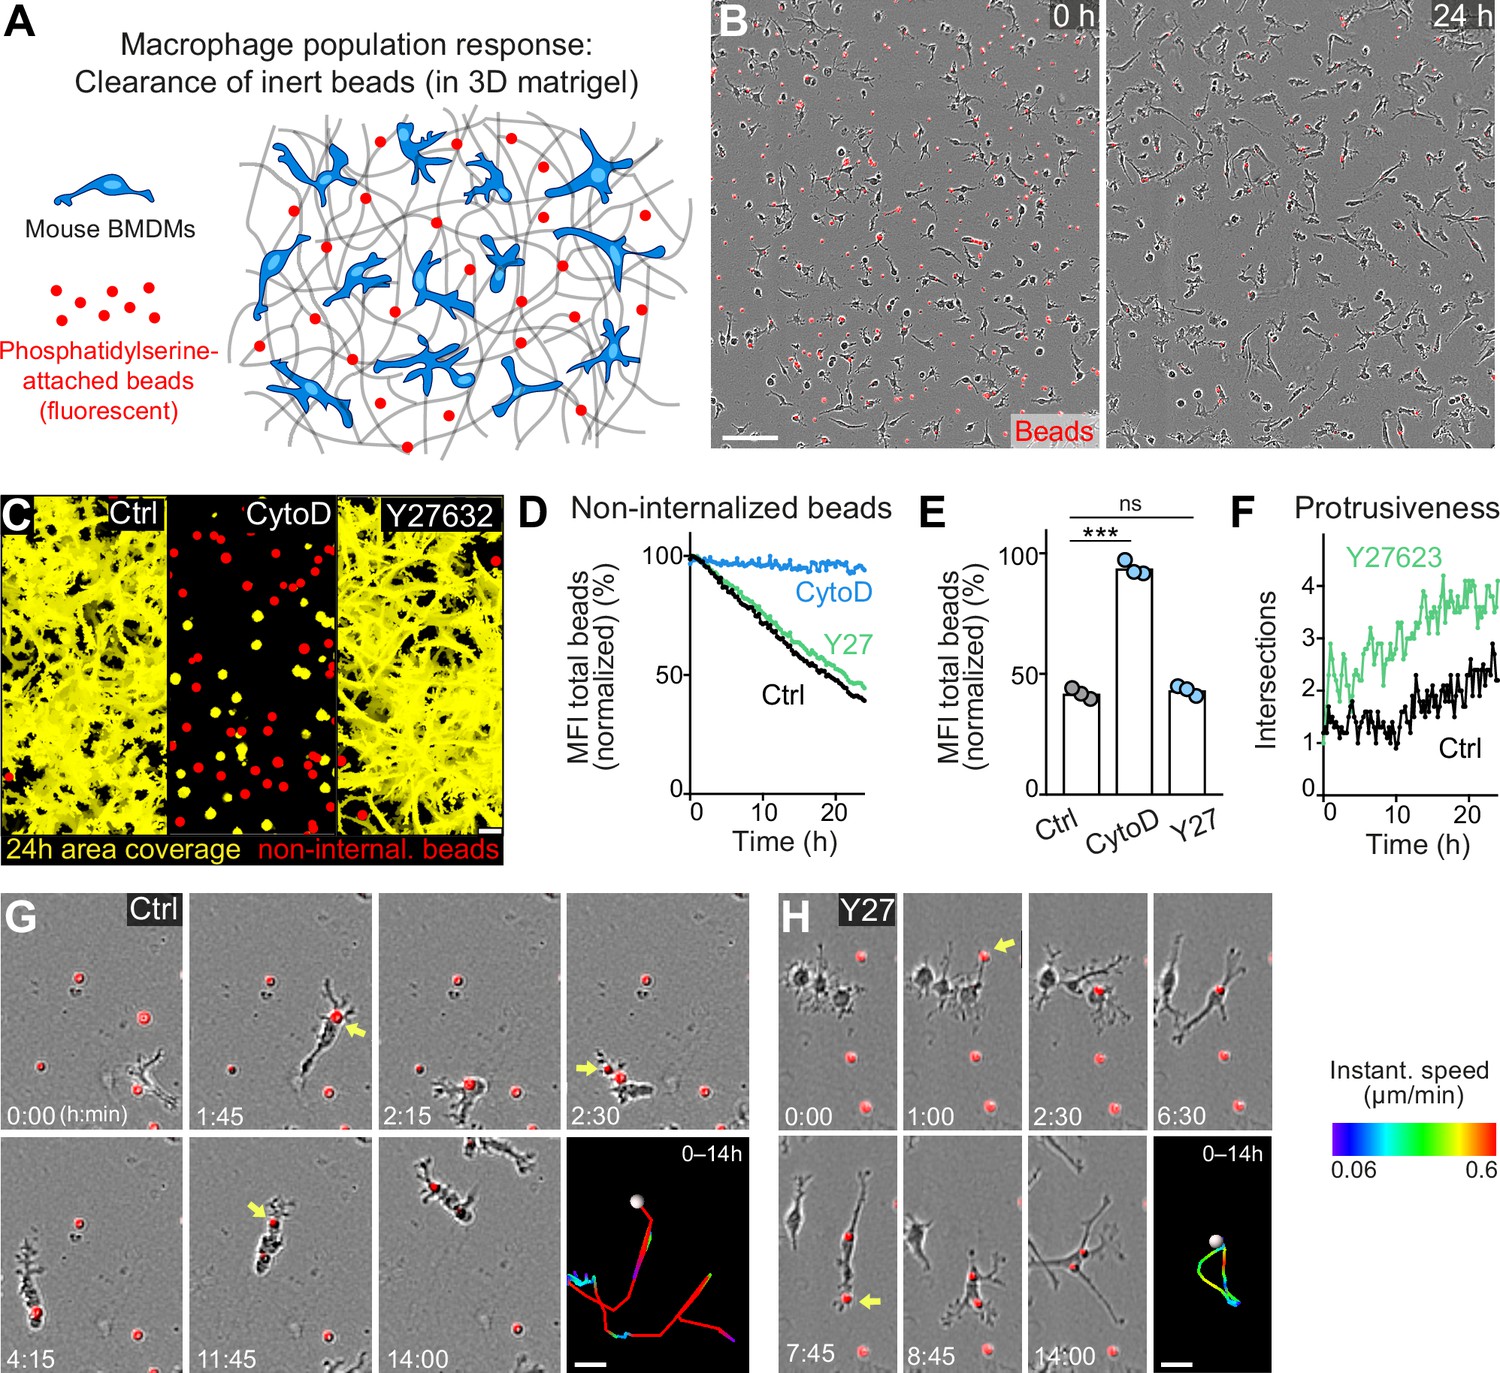
Movement and protrusiveness as two sampling strategies for bead removal by macrophage networks.
(A) Scheme for studying macrophage network surveillance in three-dimensional (3D) in vitro matrices. (B) Images of start (0 hr) and endpoint (24 hr) of bead removal by a population of WT bone marrow-derived macrophages (BMDMs) (unstained). Extracellular, fluorescent beads with surface-attached phosphatidylserine (red, 0 hr) were ingested by BMDMs over time. The image shows a quarter of the total imaging field of view. (C–E) Analysis of BMDM network sampling activity in the presence of cytochalasin D (CytoD) or Y27632, including (C) time projections of macrophage shapes over 24 hr, displayed as total area coverage (yellow) in relation to non-internalized beads (red). Bead sampling by macrophages was measured as mean fluorescence intensity (MFI) decline of bead fluorescence in 15 min intervals over time, presented as (D) time-course analysis from one independent experiment (dots in curves are mean values from N = 4–5 technical replicates (separate wells of matrigel)), and as (E) 24 hr-mean-values calculated from three biological replicates (n = 3 per genotype). (F) Cell protrusiveness of WT and Y27632-treated BMDMs was determined by Sholl analysis for N = 10 randomly chosen cells and presented as mean values at 15 min time intervals over 24 hr. (G, H) Time sequences of individual control (G) and Y27632-treated (Y27) (H) BMDMs, correlating bead sampling and migratory activity. Yellow arrows highlight bead uptake events. Cell tracks over 14 hr are pseudo-colored for instantaneous speed values. All bar graphs display the mean; ***p ≤ 0.001, ns: non-significant; Dunnett’s multiple comparison (post hoc analysis of variance [ANOVA]). Scale bars: 100 µm (B), 40 µm (C), 20 µm (G, H).
-
Figure 5—source data 1
Numerical data for the graph in Figure 5D.
- https://cdn.elifesciences.org/articles/75354/elife-75354-fig5-data1-v1.csv
-
Figure 5—source data 2
Numerical data for the graph in Figure 5E.
- https://cdn.elifesciences.org/articles/75354/elife-75354-fig5-data2-v1.csv
-
Figure 5—source data 3
Numerical data for the graph in Figure 5F.
- https://cdn.elifesciences.org/articles/75354/elife-75354-fig5-data3-v1.csv
Figure 5—figure supplement 1
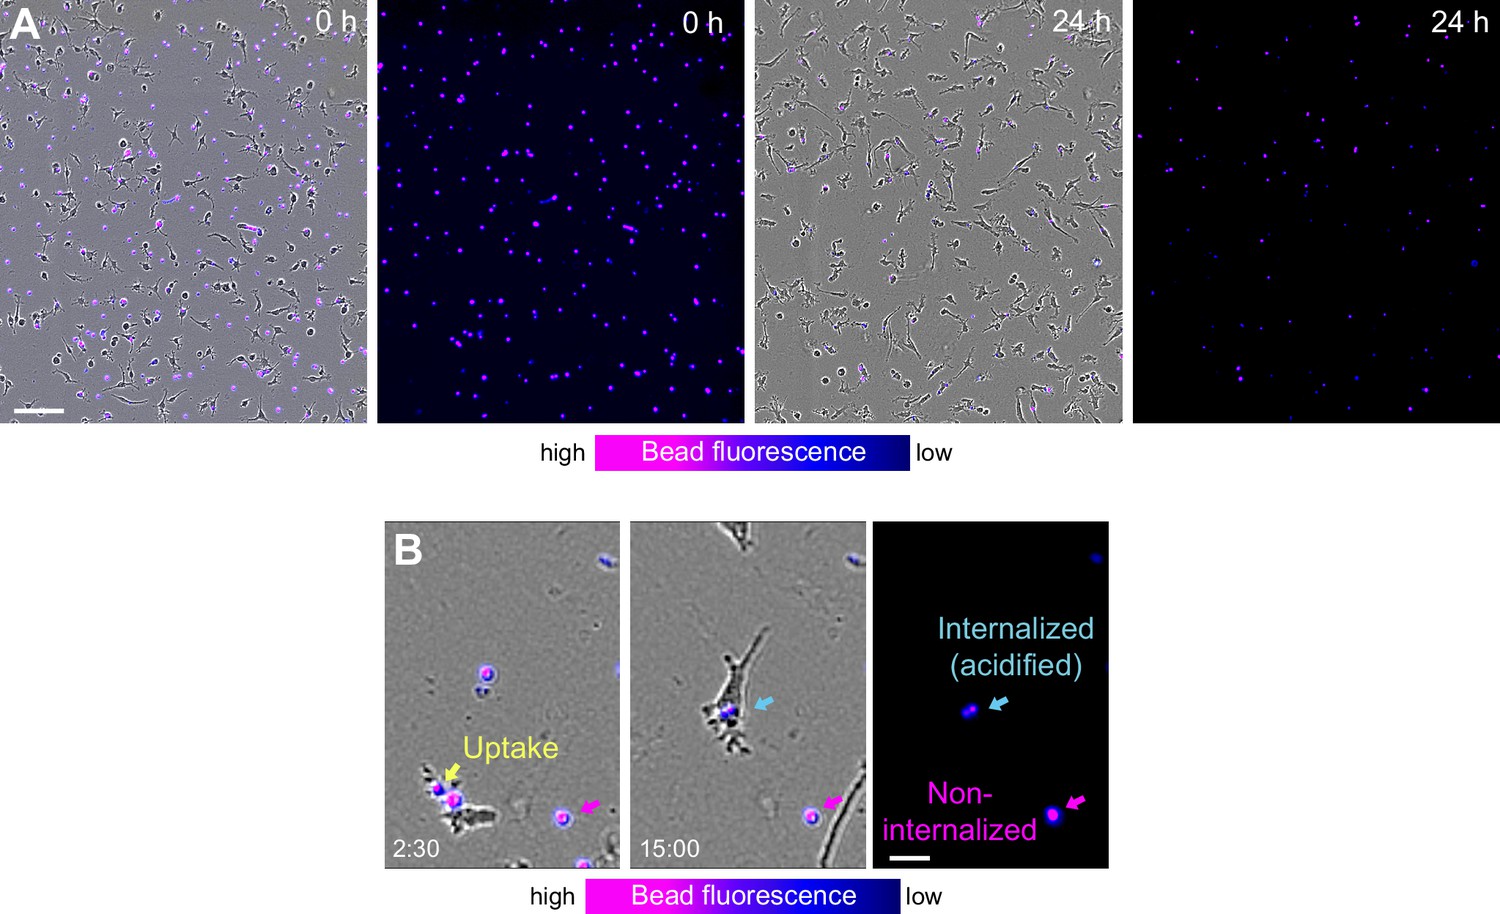
Removal of fluorescent phosphatidylserine-attached beads by macrophage networks and individual macrophages.
(A) Live-cell imaging snapshots showing the start (0 hr) and endpoint (24 hr) of bead removal by a population of WT bone marrow-derived macrophages (BMDMs) (unstained). Fluorescent phosphatidylserine-attached beads were extracellular (red, 0 hr) and fluorescence signal displayed as purple-blue heatmap color. At the onset of the experiment, most beads were extracellular and showed high fluorescence signal. After 24 hr, the majority of beads was internalized by macrophages and showed low fluorescence signal. Scale bars: 100 µm. (B) Live-cell imaging and close-up view of an individual WT BMDM that takes up a fluorescent bead at 2 hr 30 min (yellow arrow). Approximately 12 hr later this internalized bead (light blue arrow) showed reduced signal due to fluorescence quenching in the acidic phagolysosomal compartment of the macrophage. In contrast, non-internalized beads (purple arrow) maintain the fluorescence signal over time. Scale bar: 20 µm.
Figure 5—figure supplement 2
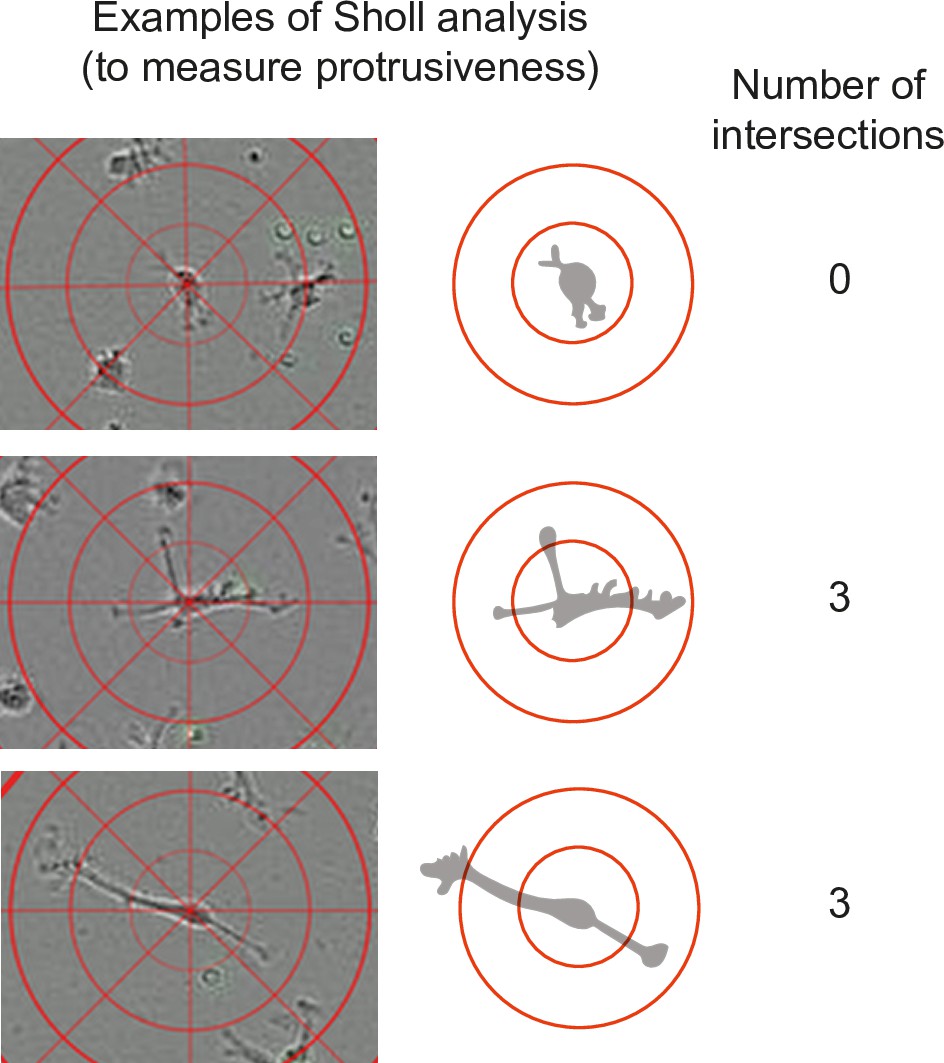
Measurement of cell protrusiveness by Sholl analysis (relates to Figure 5F).
The center points of individual macrophages are overlaid with layers of concentric rings (Sholl cells) at 25 µm intervals. The number of occasions Sholl shells are intersected by cellular process gives a measure of branch-based and elongation-based protrusiveness for an individual cell at a given timepoint.
Figure 5—video 1
Movement and protrusiveness as two sampling strategies for bead removal by macrophage networks.
Bone marrow-derived macrophages (BMDMs) were embedded in matrigel in the presence of fluorescent beads (red) coated with phosphatidylserine, an ‘eat-me’ signal for macrophages. BMDMs were treated with vehicle or the ROCK inhibitor Y27632 and bead sampling activity recorded over 20 hr with phase-contrast and fluorescence microscopy using an Incucyte S3 instrument. Control BMDMs are migratory and cover larger distance to sample beads (first part). Y27632-treated macrophages have reduced migration speed, but the increase in protrusiveness still allows efficient bead sampling (second part). This video relates to Figure 5C–H.
Figure 6 with 3 supplements
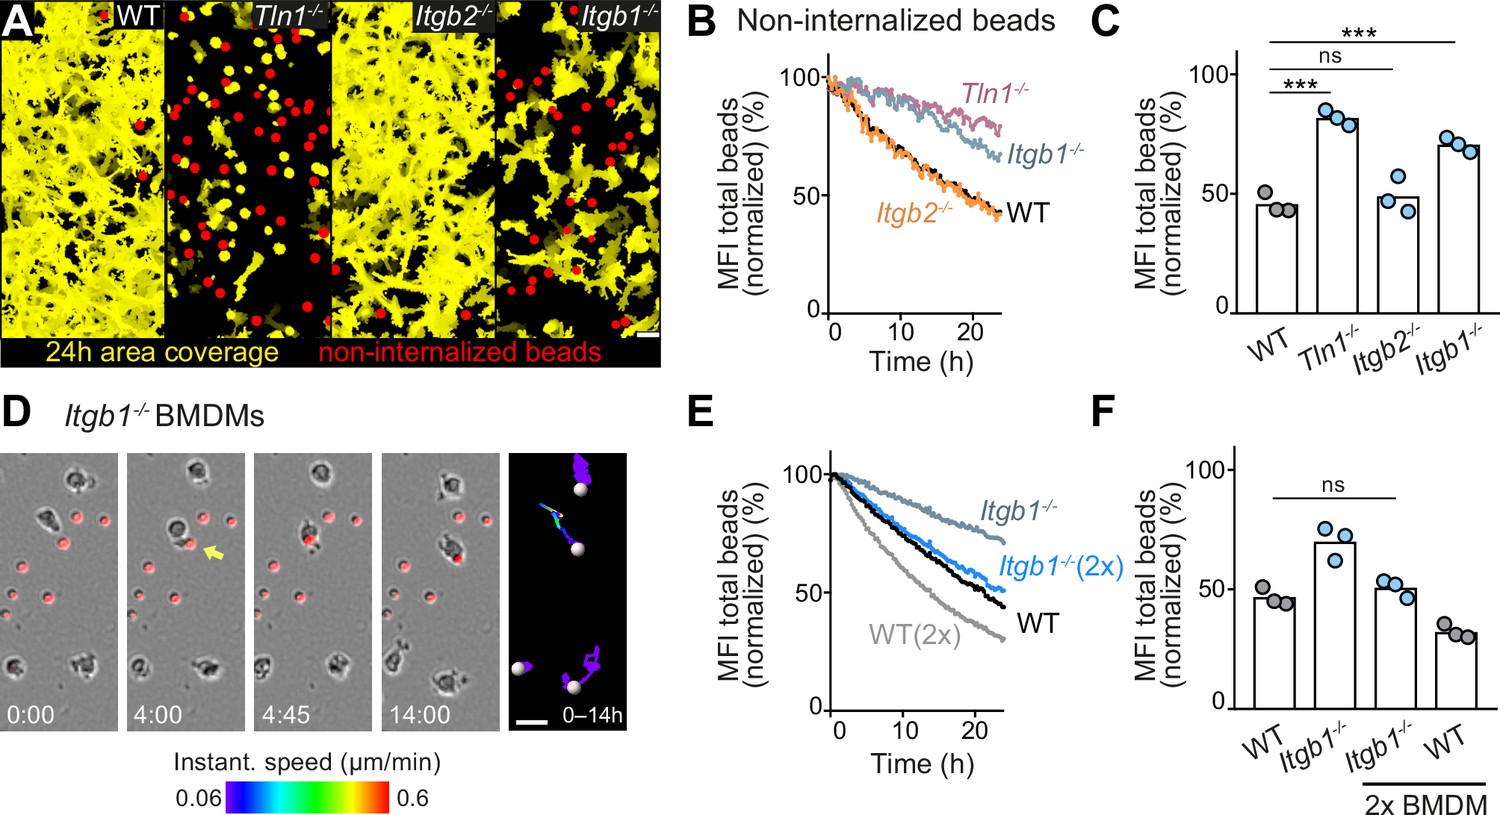
Haptokinesis is required for optimal bead removal by macrophage networks.
(A–C) Analysis of bone marrow-derived macrophage (BMDM) network sampling activity upon genetic interference with integrin functionality was performed as described in Figure 5A–E. (D) Time sequence of an individual Itgb1−/− macrophage is shown, correlating bead sampling and migratory activity as described in Figure 5G and H. (E, F) Analysis of Itgb1−/− BMDM network sampling activity upon doubling (2×) the cell number in the BMDM network. Analysis of network sampling as described in Figure 5C–E. All bar graphs display the mean; ***p ≤ 0.001, ns: non-significant; Dunnett’s multiple comparison (post hoc analysis of variance [ANOVA]). Scale bars: 40 µm (A), 20 µm (D).
-
Figure 6—source data 1
Numerical data for the graph in Figure 6B.
- https://cdn.elifesciences.org/articles/75354/elife-75354-fig6-data1-v1.csv
-
Figure 6—source data 2
Numerical data for the graph in Figure 6C.
- https://cdn.elifesciences.org/articles/75354/elife-75354-fig6-data2-v1.csv
-
Figure 6—source data 3
Numerical data for the graph in Figure 6E.
- https://cdn.elifesciences.org/articles/75354/elife-75354-fig6-data3-v1.csv
-
Figure 6—source data 4
Numerical data for the graph in Figure 6F.
- https://cdn.elifesciences.org/articles/75354/elife-75354-fig6-data4-v1.csv
Figure 6—figure supplement 1
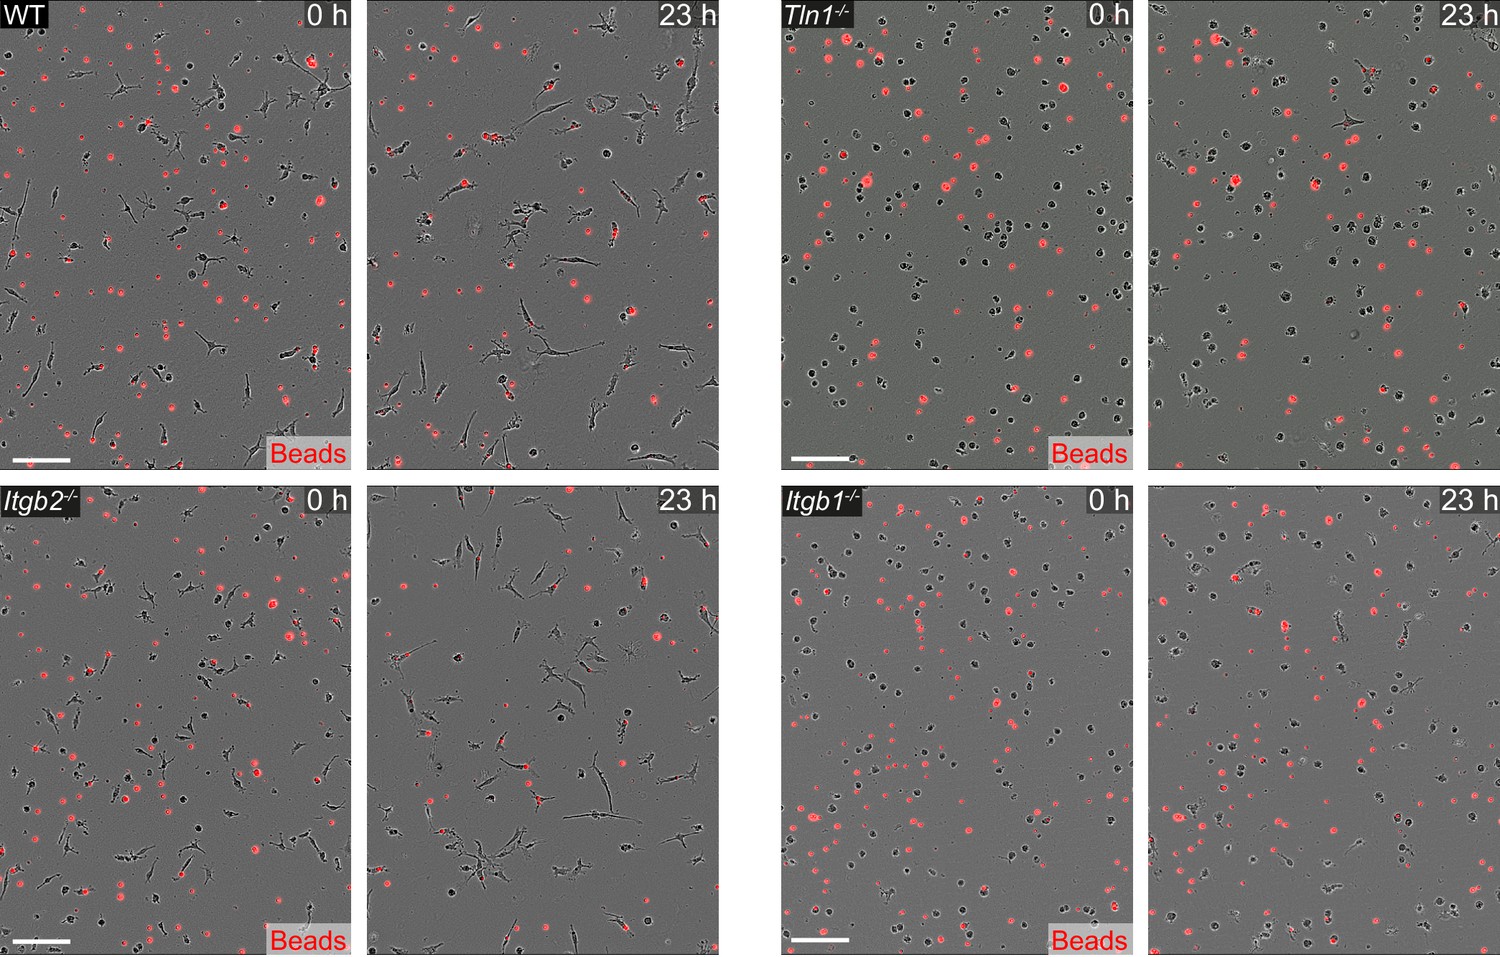
Macrophages require β1 integrins for migration-dependent bead removal in three-dimensional (3D) matrigel.
Live-cell imaging snapshots showing the start (0 hr) and a late timepoint (23 hr) of bead removal by populations of WT, Itgb1−/−, Itgb2−/−, and Tln1−/− bone marrow-derived macrophages (BMDMs). WT and Itgb2−/− BMDMs move in 3D matrigel and reduce the number of extracellular beads, whereas migration-deficient Tln1−/− and Itgb1−/− BMDMs show impaired removal of extracellular beads. Extracellular, non-internalized fluorescent beads appear as bright red signal. Scale bars: 100 µm.
Figure 6—figure supplement 2
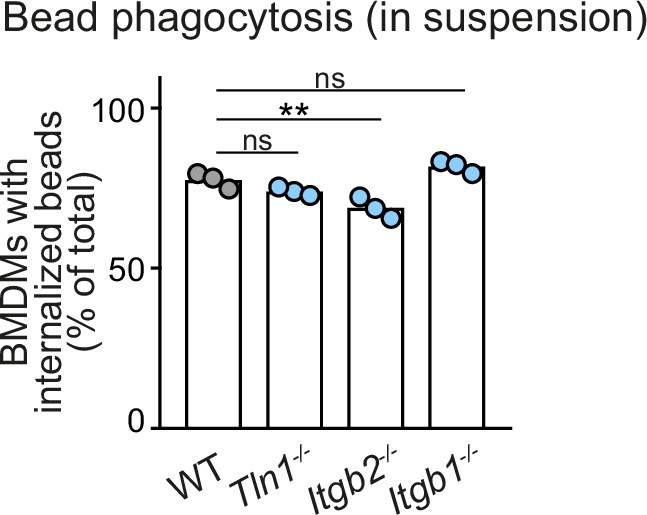
Macrophages do not require β1 integrins bead phagocytosis in suspension.
Analysis of bead phagocytosis in cell suspensions. WT, Itgb1−/−, Itgb2−/−, and Tln1−/− bone marrow-derived macrophages (BMDMs) were kept in stirred cell suspensions with fluorescent beads for a 2 hr incubation time. Bead internalization by macrophages was quantified by flow cytometry analysis, using a combination of intrinsic bead fluorescence and an annexin V labelling of extracellular beads. Representative experiment with N = 3 technical replicates. Bars display the mean; ns: non-significant, **p ≤ 0.01, Dunnett’s multiple comparison (post hoc analysis of variance [ANOVA]).
-
Figure 6—figure supplement 2—source data 1
Numerical data for the graph in Figure 6—figure supplement 2.
- https://cdn.elifesciences.org/articles/75354/elife-75354-fig6-figsupp2-data1-v1.csv
Figure 6—video 1
Haptokinesis is required for optimal bead removal by macrophage networks.
β1 integrin-deficient bone marrow-derived macrophages (BMDMs) were embedded in matrigel in the presence of fluorescent beads (red) coated with phosphatidylserine, an ‘eat-me’ signal for macrophages. Bead sampling activity was recorded over 19 hr with phase-contrast and fluorescence microscopy using an Incucyte S3 instrument. Amoeboid-shaped Itgb1−/− BMDMs hardly move or form pronounced protrusions. Still, these macrophages are able to take up and ingest beads, but only beads in close vicinity to the cells. This video relates to Figure 6A–D.
Figure 7 with 6 supplements
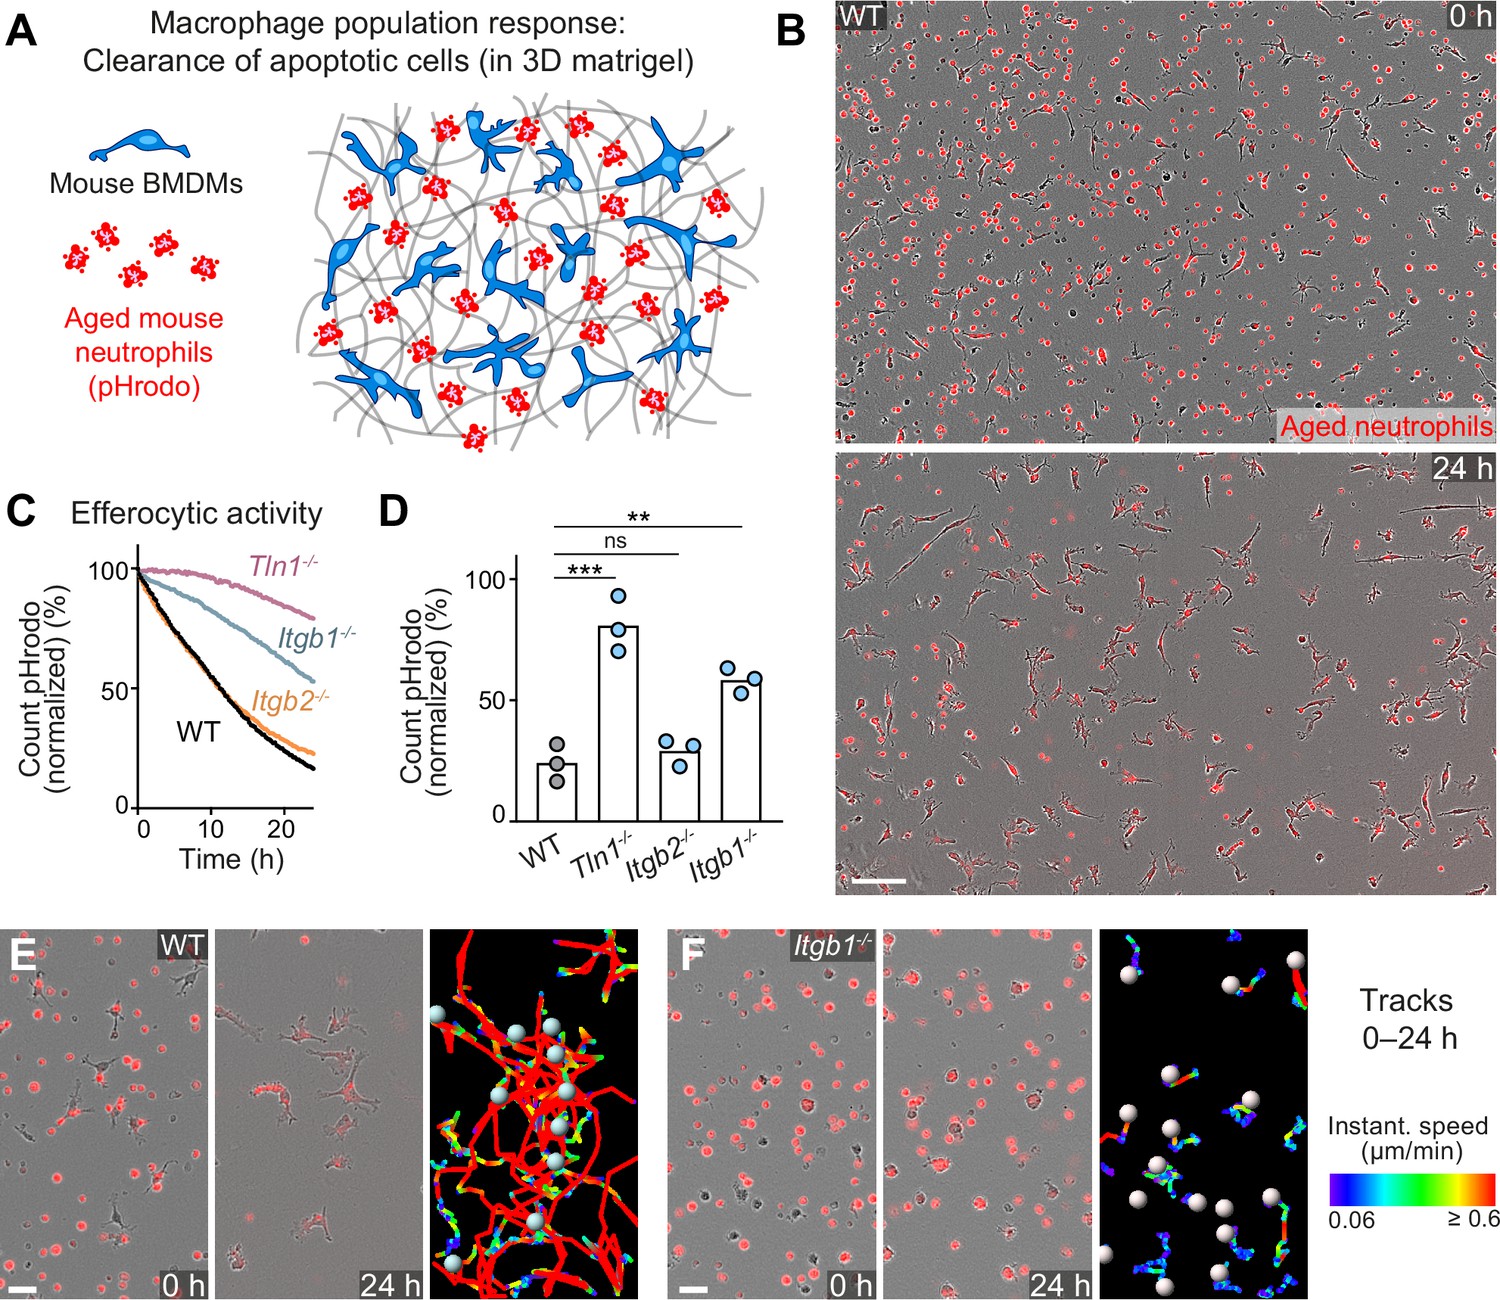
Haptokinesis is required for optimal efferocytosis by macrophage networks.
(A) Scheme for studying the efferocytic response of macrophage networks in three-dimensional (3D) in vitro matrices. (B) Live-cell imaging snapshots showing the start (0 hr) and endpoint (24 hr) of dead cell clearance by a population of WT bone marrow-derived macrophages (BMDMs) (unstained). Extracellular, fluorescently pHrodo-labeled aged neutrophils (red, 0 hr) were engulfed and removed by BMDMs over time. The image shows a quarter of the total imaging field of view. Scale bar: 100 µm. (C, D) Analysis of dead neutrophil removal by BMDM networks upon genetic interference with integrin functionality. Neutrophil uptake and digestion by macrophages was measured as an object count decline of pHrodo in 15 min intervals over time, presented as (C) time-course analysis from one independent experiment (dots in curves are mean values from N = 2–5 technical replicates) (separate wells of matrigel), and as (D) 24 hr-mean-values calculated from three biological replicates (n = 3 per genotype). Bars display the mean; ***p ≤ 0.001, **p ≤ 0.01, ns: non-significant; Dunnett’s multiple comparison (post hoc analysis of variance [ANOVA]). (E, F) Correlation of efferocytic and migratory activity in populations of WT (E) and Itgb1−/− (F) BMDMs. Cell tracks over 24 hr are pseudo-colored for instantaneous speed values. Scale bars: 30 µm.
-
Figure 7—source data 1
Numerical data for the graph in Figure 7C.
- https://cdn.elifesciences.org/articles/75354/elife-75354-fig7-data1-v1.csv
-
Figure 7—source data 2
Numerical data for the graph in Figure 7D.
- https://cdn.elifesciences.org/articles/75354/elife-75354-fig7-data2-v1.csv
Figure 7—figure supplement 1
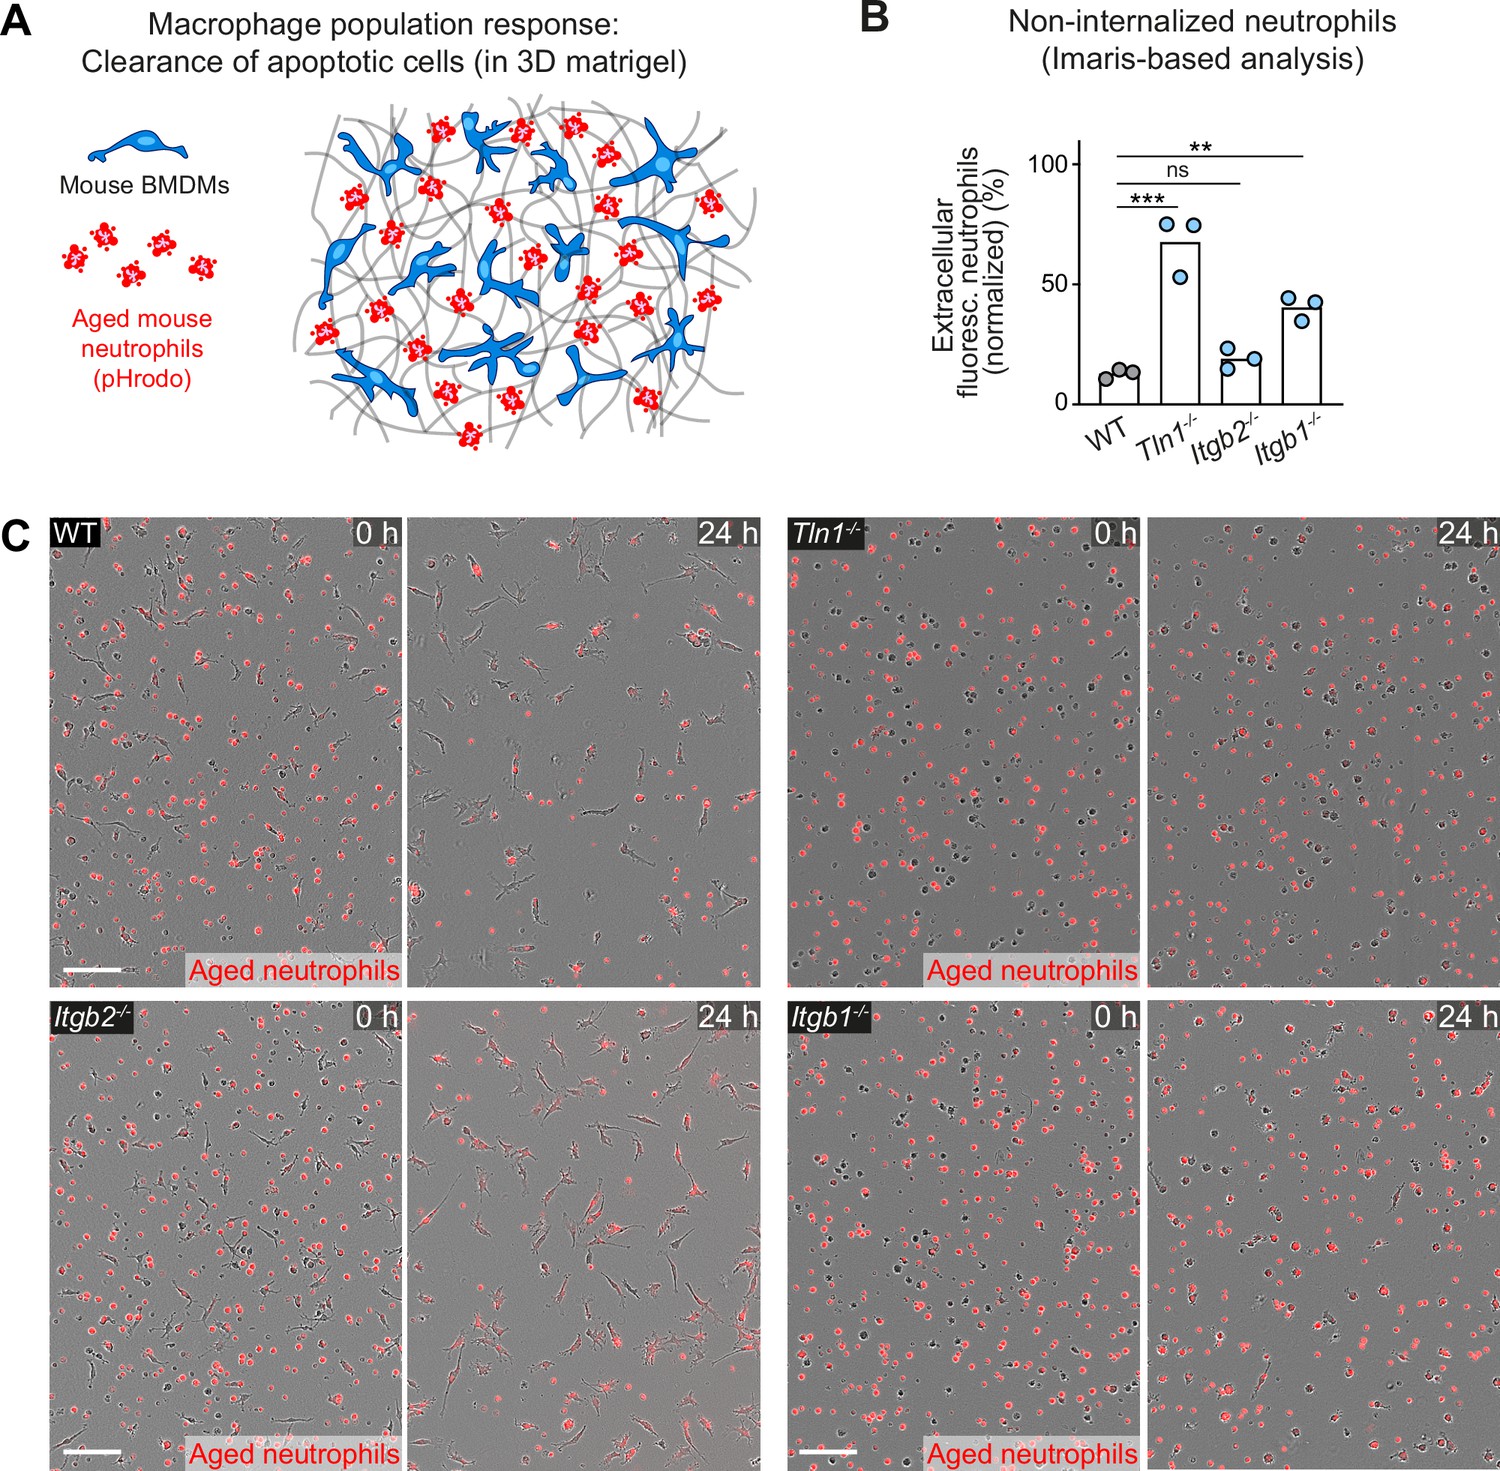
Haptokinetic sampling of dead cells optimizes efferocytosis in macrophage networks.
(A) Scheme for studying the efferocytic response of macrophage networks in three-dimensional (3D) in vitro matrices (same as in Figure 7A). (B) Analysis of dead neutrophil removal after 24 hr by bone marrow-derived macrophage (BMDM) networks upon genetic interference with integrin functionality. Validation of our analysis based on the integrated software of the Incucyte live-cell imaging system (see Figure 7D). Imaris software-based analysis determined only the fluorescence signals of extracellular, non-internalized neutrophils 24 hr after start of the experiment. Neutrophil uptake is measured as an object count and displayed as normalized values of the initial neutrophil numbers (0 hr) for three independent experiments (N = 2–5 technical replicates, which means imaging wells with BMDMs and matrigel). Bars are mean; ***p ≤ 0.001, **p ≤ 0.01, ns: non-significant; Dunnett’s multiple comparison (post hoc analysis of variance [ANOVA]). (C) Live-cell imaging snapshots showing the start (0 hr) and endpoint (24 hr) of dead neutrophil (red) removal by populations of WT, Itgb1−/−, Itgb2−/−, and Tln1−/− BMDMs. Non-internalized dead neutrophils show bright red signal. Scale bars: 100 µm.
-
Figure 7—figure supplement 1—source data 1
Numerical data for the graph in Figure 7—figure supplement 1B.
- https://cdn.elifesciences.org/articles/75354/elife-75354-fig7-figsupp1-data1-v1.csv
Figure 7—figure supplement 2
Haptokinetic sampling of dead cells optimizes efferocytosis in macrophage networks.
Live-cell imaging and close-up view of an individual WT bone marrow-derived macrophage (BMDM) that samples and ingests several pHrodo-Red-labeled dead neutrophils over 28 hr. Yellow numbers indicate individual engulfed cell corpses. The cell track over 28 hr is pseudo-colored for instantaneous speed values. Scale bar: 20 µm.
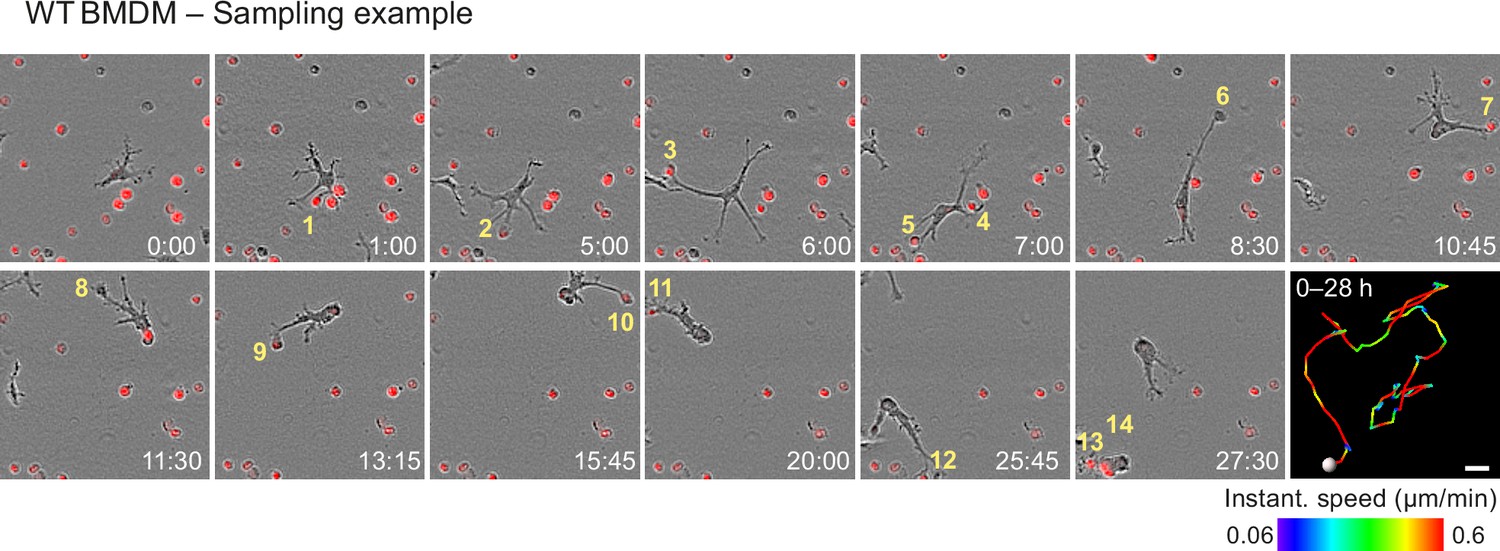
Figure 7—figure supplement 3
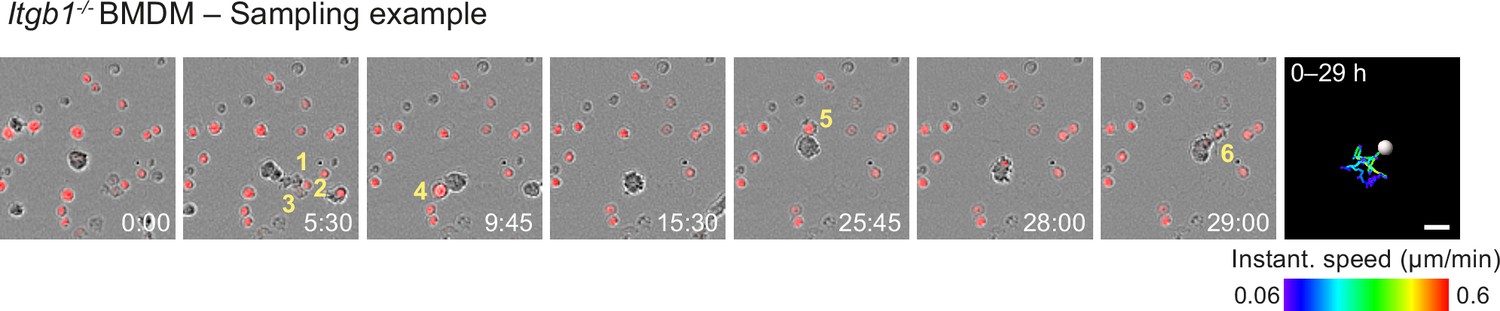
Haptokinetic sampling of dead cells optimizes efferocytosis in macrophage networks.
Live-cell imaging and close-up view of an individual Itgb1−/− bone marrow-derived macrophage (BMDM) that samples and ingests several pHrodo-Red-labeled dead neutrophils over 29 hr. Yellow numbers indicate individual engulfed cell corpses. The cell track over 29 hr is pseudo-colored for instantaneous speed values. Scale bar: 20 µm.
Figure 7—video 1
Efficient efferocytosis of aged neutrophils by macrophage networks.
WT bone marrow-derived macrophages (BMDMs) were embedded in matrigel in the presence of aged neutrophils that were labeled with pHrodo-Red (red). Fluorescent dead neutrophils were extracellular, before they were engulfed and removed by the macrophage network over time. Efficient efferocytosis in this assay relies on the interpretation of ‘find-me’ and ‘eat-me’ signals from dead neutrophils. The efferocytic activity of the macrophage network was recorded over 30 hr with phase-contrast and fluorescence microscopy using an Incucyte S3 instrument. This video relates to Figure 7A and B.
Figure 7—video 2
Examples of efferocytic WT macrophages.
WT bone marrow-derived macrophages (BMDMs) were embedded in matrigel in the presence of aged neutrophils that were labeled with pHrodo-Red (red). Three examples of macrophages that sequentially sample and ingest dead neutrophils are shown, revealing a phenotypic spectrum for efficient efferocytosis in WT cells. Cell 3 provides a good example of very directed protrusion formation toward dead neutrophil material. Efferocytic activity was recorded over 14, 28, and 18 hr with phase-contrast and fluorescence microscopy using an Incucyte S3 instrument. This video relates to Figure 7E and Figure 7—figure supplement 2.
Figure 7—video 3
Haptokinesis is required for optimal efferocytosis by macrophage networks.
WT and Itgb1−/− bone marrow-derived macrophages (BMDMs) were embedded in matrigel in the presence of aged neutrophils that were labeled with pHrodo-Red (red). WT BMDMs are migratory and cover larger distance to sample and engulf dead neutrophils. In contrast, Itgb1−/− BMDMs hardly move or form pronounced protrusions, allowing only uptake of dead neutrophils in close vicinity to them. Efferocytic activity was recorded over 23 hr with phase-contrast and fluorescence microscopy using an Incucyte S3 instrument. This video relates to Figure 7E and F and Figure 7—figure supplement 3.
Figure 8

β1 integrin-dependent surveillance by cortical macrophage networks in lymph nodes.
(A) Immunofluorescence staining of a mouse inguinal lymph node. T cell cortex (cyan outline) was defined as B220- and Lyve-1-negative tissue area. (B) Confocal immunofluorescence images of GFP-expressing cortical macrophages in WT and conditional Itgb1-deficient mice crossed to Lyz2GFP/+ knock-in mice (left). Collagen IV (COL4) stainings display the cortical reticular fiber network. GFP-based surface representations of macrophage morphologies are shown (right). (C) Detection of apoptotic cells by TUNEL method in T cell zones of immuno-stained lymph node sections. TUNEL-positive cells had altered nuclear DAPI stainings, and were found non-internalized (yellow arrow) or internalized by macrophages (stained by CD68). (D) Quantification of non-internalized TUNEL-positive cells in T cell cortices. Dots represent individual mice (n = 3 per genotype). Bars display the mean; **p ≤ 0.01, t test. Scale bars: 100 µm (A), 10 µm (B), 5 µm (C).
-
Figure 8—source data 1
Numerical data for the graph in Figure 8D.
- https://cdn.elifesciences.org/articles/75354/elife-75354-fig8-data1-v1.csv
Tables
Key resources table
| Reagent type (species) or resource | Designation | Source or reference | Identifiers | Additional information |
|---|---|---|---|---|
| Antibody | Anti-CD61 PE(Armenian hamster monoclonal) | BD Biosciences | Cat# 553347;RRID:AB_394800 | FACS(1:400) |
| Antibody | Anti-CD29 PE(Armenian Hamster monoclonal) | BioLegend | Cat# 102208;RRID:AB_312885 | FACS(1:400) |
| Antibody | IgG Isotype Control PE(Armenian hamster monoclonal) | BioLegend | Cat# 400907;RRID:AB_326593 | FACS(1:400) |
| Antibody | Anti-goat Alexa Fluor 488(Donkey polyclonal) | Thermo Fisher Scientific | Cat# A11055;RRID:AB_2534102 | IF(1:300) |
| Antibody | Anti-rabbit Alexa Fluor 568(Donkey polyclonal) | Thermo Fisher Scientific | Cat# A10042;RRID:AB_2534017 | IF(1:300) |
| Antibody | Anti-GFP Dylight 488(Goat polyclonal) | Rockland | Cat# 600-141-215; RRID:AB_1961516 | IF(1:750, 1:500) |
| Antibody | Anti-rabbit Alexa Fluor 405(Goat polyclonal) | Thermo Fisher Scientific | Cat# A-31556;RRID:AB_221605 | IF(1:300, 1:200) |
| Antibody | Anti-rabbit Alexa Fluor 700(Goat polyclonal) | Thermo Fisher Scientific | Cat# A21038;RRID:AB_10373851 | IF(1:100) |
| Antibody | Anti-collagen IV(Goat polyclonal) | Merck Millipore | Cat# AB769;RRID:AB_92262 | IF(1:200) |
| Antibody | Anti-talin(Mouse monoclonal) | Sigma-Aldrich | Cat# T3287;RRID:AB_477572 | WB(1:1000) |
| Antibody | Anti-rabbit HRP(Pig polyclonal) | Agilent Dako | Cat# P0217;RRID: AB_2728719 | WB(1:5000) |
| Antibody | Anti-actin(Rabbit polyclonal) | Sigma-Aldrich | Cat# A2066;RRID:AB_476693 | WB(1:2000) |
| Antibody | Anti-collagen IV(Rabbit polyclonal) | Abcam | Cat# ab19808;RRID:AB_445160 | IF(1:500) |
| Antibody | Anti-Iba1(Rabbit polyclonal) | Wako | Cat# 019–19741;RRID:AB_839504 | IF(1:200) |
| Antibody | Anti-LYVE1(Rabbit polyclonal) | Abcam | Cat# AB14917;RRID:AB_301509 | IF(1:200) |
| Antibody | Anti-mouse HRP(Rabbit polyclonal) | Agilent Dako | Cat# P0161;RRID:AB_2687969 | WB:(1:5000) |
| Antibody | Anti-CD11b PE(Rat monoclonal) | BD Biosciences | Cat# 557397;RRID:AB_396680 | FACS(1:400) |
| Antibody | Anti-CD16/CD32 Antibody(Rat monoclonal) | BD Biosciences | Cat# 553142;RRID:AB_394657 | FACS(1:250) |
| Antibody | Anti-CD18 PE(Rat monoclonal) | BD Biosciences | Cat# 553293;RRID:AB_394762 | FACS(1:400) |
| Antibody | Anti-CD49d PE(Rat monoclonal) | Thermo Fisher Scientific | Cat# 12-0492-82;RRID:AB_465697 | FACS(1:400) |
| Antibody | Anti-CD49e PE(Rat monoclonal) | BD Bioscience | Cat# 557447;RRID:AB_396710 | FACS(1:400) |
| Antibody | Anti-CD49f Alexa Fluor 488(Rat monoclonal) | BioLegend | Cat# 313608;RRID:AB_493635 | FACS(1:400) |
| Antibody | Anti-CD45R/B220 Brilliant violet 421(Rat monoclonal) | BD Bioscience | Cat# 562922;RRID:AB_2737894 | IF(1:200) |
| Antibody | Anti-CD51 PE(Rat monoclonal) | BD Biosciences | Cat# 551187;RRID:AB_394088 | FACS(1:400) |
| Antibody | Anti-CD68 Alexa Flour 488(Rat monoclonal) | Biolegend | Cat#137011;RRID:AB_2074847 | IF(1:200) |
| Antibody | Anti-CD206 PE-Dazzle(Rat monoclonal) | Biolegend | Cat#141731;RRID:AB_2565931 | IF(1:200) |
| Antibody | Anti-F4/80 Brilliant violet 421(Rat monoclonal) | Biolegend | Cat# 123137;RRID:AB_2563102 | FACS (1:100) |
| Antibody | Anti-F4/80 PE(Rat monoclonal) | Thermo Fisher Scientific | Cat# MF48004;RRID:AB_10372666 | IF(1:100) |
| Antibody | Anti-F4/80 Alexa Flour 647(Rat monoclonal) | Thermo Fisher Scientific | Cat# 50-4801-82;RRID:AB_11149361 | FACS(1:100) |
| Antibody | Anti-Integrin β7 Chain PE(Rat monoclonal) | BD Biosciences | Cat# 557498;RRID:AB_396735 | FACS(1:400) |
| Antibody | IgG1 kappa Isotype Control PE(Rat monoclonal) | Thermo Fisher Scientific | Cat# 12-4301-81;RRID:AB_470046 | FACS(1:400) |
| Antibody | IgG2a Isotype Control Alexa Fluor 488(Rat monoclonal) | Thermo Fisher Scientific | Cat# R2a20;RRID:AB_2556535 | FACS(1:400) |
| Antibody | IgG2a kappa Isotype Control PE(Rat monoclonal) | Thermo Fisher Scientific | Cat# 12-4321-80;RRID:AB_1834380 | FACS(1:400) |
| Antibody | IgG2b kappa Isotype Control PE(Rat monoclonal) | Thermo Fisher Scientific | Cat# 12-4031-82;RRID: AB_470042 | FACS(1:400) |
| Antibody | Anti-Ly6G(Rat monoclonal) | Bio X Cell | Cat# BE0075-1;RRID:AB_1107721 | IP(200 µg) |
| Recombinant protein | Annexin V PE | Biolegend | Cat# 640908 | FACS(1:50) |
| Recombinant protein | Recombinant Murine M-CSF | PeproTech | Cat# 315–02 | |
| Chemical, compound, drug | cOmplete, Protease Inhibitor Cocktail (PIC) | Sigma-Aldrich | Cat# 11697498001 | |
| Chemical, compound, drug | Fluoromount G Mounting Medium | SouthernBiotech | Cat# 0100–01 | |
| Chemical, compound, drug | Matrigel Basement Membrane Matrix | Corning | Cat# 354234 | |
| Chemical, compound, drug | Matrigel Growth Factor Reduced (GFR) Basement Membrane Matrix, Phenol Red-free | Corning | Cat# 356231 | |
| Chemical, compound, drug | Cytochalasin D | Merck | Cat# 250255 | |
| Chemical, compound, drug | Y-27632 | Merck | Cat# 688001 | |
| Chemical, compound, drug | CK-666 | Merck | Cat# 182515 | |
| Chemical, compound, drug | Blebbistatin | Merck | Cat# 203390 | |
| Chemical, compound, drug | pHrodo Red SE | Thermo Fisher Scientific | Cat# P36600 | |
| Chemical, compound, drug | PS Lipid Microparticles | Echelon Bioscience | Cat# P-B1PS | |
| Chemical, compound, drug | Tissue Tek | Sakura | Cat# 4583 | |
| Chemical, compound, drug | DAPI | Sigma-Aldrich | Cat# D9542 | |
| Commercial assay, kit | Click-iT Plus TUNEL assay | Thermo Fisher Scientific | Cat# C10618 | |
| Commercial assay, kit | Dead Cell Removal Kit | Miltenyi Biotec | Cat# 130-090-101 | |
| Commercial assay, kit | Neutrophil Isolation Kit | Miltenyi Biotec | Cat# 130-097-658 | |
| Commercial assay, kit | Clarity Western ECL Substrate | Bio-Rad | Cat# 170–5060 | |
| Experimental model, mouse strain | Itgb1fl/fl | Potocnik et al., 2000, provided by R Fässler (MPI of Biochemistry, Martinsried) | MGI:1926498 (Itgb1tm1Ref) | |
| Experimental model, mouse strain | Tln1fl/fl | Petrich et al., 2007, provided by S Monkley and D Critchley (University of Leicester) | MGI:3770513(Tln1tm4.1Crit) | |
| Experimental model, mouse strain | Itgb2−/− | Scharffetter-Kochanek et al., 1998, provided by M Sixt (IST, Klosterneuburg) | MGI: 1861705JAX: 003329(Itgb2tm2Bay) | |
| Experimental model, mouse strain | Vav1-iCre | de Boer et al., 2003, Jackson Laboratory | MGI: 2449949JAX: 008610(Commd10Tg(Vav1-iCre)A2Kio) | |
| Experimental model, mouse strain | Cx3cr1CRE | Yona et al., 2013, Jackson Laboratory | MGI: 5467983JAX: 025524(Cx3cr1tm1.1(cre)Jung) | |
| Experimental model, mouse strain | Lifeact-GFP | Riedl et al., 2010, provided by R Wedlich-Söldner (University of Münster) | MGI: 4831036(Tg(CAG-EGFP)#Rows) | |
| Experimental model, mouse strain | Lyz2GFP | Faust et al., 2000, provided by T Graf (CRG, Barcelona) | MGI: 2654931(Lyz2tm1.1Graf) | |
| Experimental model, mouse strain | Vav1-iCre+/- Itgb1fl/fl | In-house breeding(this paper) | ||
| Experimental model, mouse strain | Vav1-iCre+/- Itgb1fl/fl Lyz2GFP/+ | In-house breeding(this paper) | ||
| Experimental model, mouse strain | Cx3cr1CRE/+ Tln1fl/fl | In-house breeding(this paper) | ||
| Experimental model, mouse strain | Cx3cr1CRE/+ Tln1fl/fl Lifeact-GFP +/− | In-house breeding(this paper) | ||
| Software, algorithm | Adobe Illustrator 2019 | Adobe | https://www.adobe.com | |
| Software, algorithm | BD FACSDiva v6 | BD | https://www.bdbioscibdbio.com/en-us/instruments/researes-instruments/research-software/flow-cytometry-acquisition/facsdiva-software | |
| Software, algorithm | Fiji, ImageJ2 | Rueden et al., 2017; Schindelin et al., 2012 | https://imagej.net | |
| Software, algorithm | FlowJo v10.8.0 | BD | https://www.flowjo.com | |
| Software, algorithm | GraphPad Prism Version 8 | GraphPad | https://www.graphpad.com | |
| Software, algorithm | Image Lab Software | Bio-Rad | https://www.bio-rad.com/de-at/product/image-lab-software | |
| Software, algorithm | Imaris v9.5–9.7 | Bitplane | https://imaris.oxinst.com/versions/9-5 | |
| Software, algorithm | ZEN 2012 SP5 FP3 (black) | ZEISS Microscopy | https://www.zeiss.com/microscopy/int/products/microscope-software/zen.html#modules | |
| Software, algorithm | Incucyte Base Software | Incucyte | https://www.sartorius.com/en/products/live-cell-imaging-analysis/live-cell-analysis-software/incucyte-base-software | |
| Software, algorithm | Incucyte Spheroid Analysis Software Module | Incucyte | https://www.sartorius.com/en/products/live-cell-imaging-analysis/live-cell-analysis-software/incucyte-base-software | |
| Software, algorithm | Ibidi chemotaxis and migration tool | Ibidi | https://ibidi.com/chemotaxis-analysis/171-chemotaxis-and-migration-tool.html?gclid=EAIaIQobChMI2c2LtcbW8wIVgrh3Ch2B8wV9EAAYASAAEgLMbvD_BwE |
Additional files
-
Transparent reporting form
- https://cdn.elifesciences.org/articles/75354/elife-75354-transrepform1-v1.pdf
-
Supplementary file 1
Table for overview on statistical tests.
- https://cdn.elifesciences.org/articles/75354/elife-75354-supp1-v1.docx
Download links
A two-part list of links to download the article, or parts of the article, in various formats.
Downloads (link to download the article as PDF)
Open citations (links to open the citations from this article in various online reference manager services)
Cite this article (links to download the citations from this article in formats compatible with various reference manager tools)
Macrophage network dynamics depend on haptokinesis for optimal local surveillance
eLife 11:e75354.
https://doi.org/10.7554/eLife.75354


