Cortical microtubule pulling forces contribute to the union of the parental genomes in the Caenorhabditis elegans zygote
- Université Paris cité, CNRS, Institut Jacques Monod, F-75013, France
Figures
Figure 1 with 6 supplements
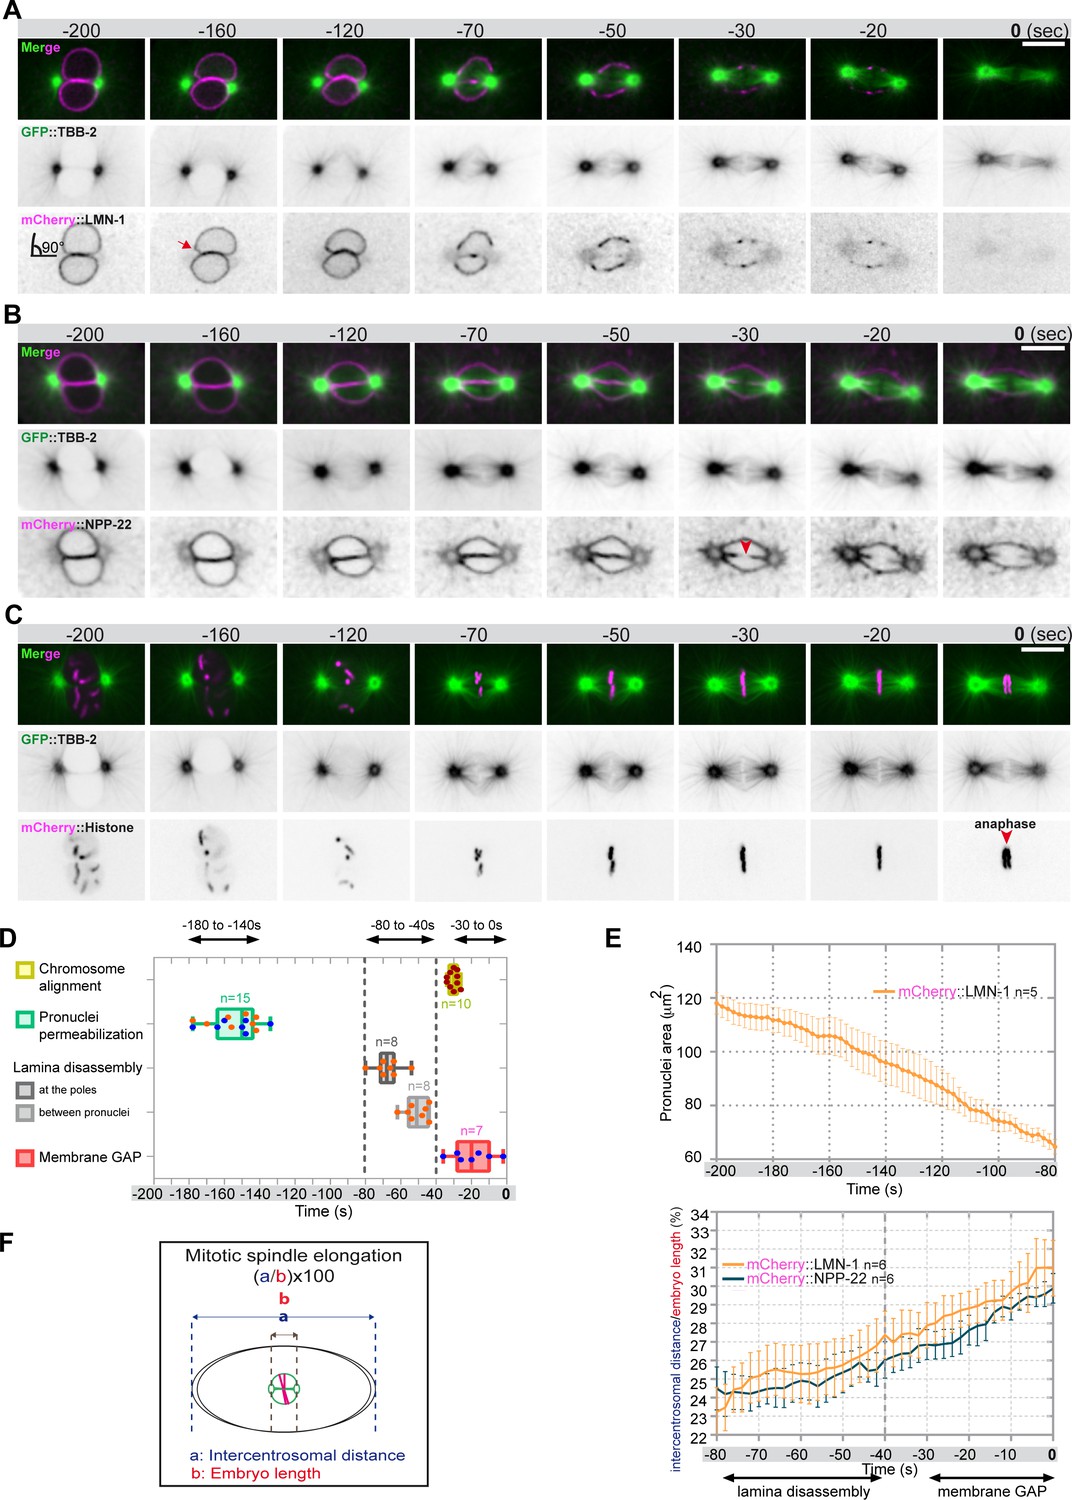
Monitoring microtubule and pronuclear envelopes dynamics in the one-cell Caenorhabditis elegans embryo.
(A–C) Spinning disk confocal micrographs of embryos expressing wild-type GFP::TBB-2 (shown alone, and in green in the merged images) and (A) mCherry::LMN-1 (shown alone and in magenta in the merged image), or (B) mCherry::NPP-22 (magenta, in the merged image), or (C) mCherry::Histone (magenta, in the merged image). Timings in seconds are relative to anaphase onset (0 s). All panels are at the same magnification. Scale bar, 10 μm. (D) Steps of pronuclear envelopes breakdown: pronuclei permeabilization, lamina disassembly (at the poles, between pronuclei), and pronuclear envelopes scission event (membrane gap) relative to anaphase onset were scored in multiple embryos (n). The timing of pronuclear envelopes scission was scored in embryos expressing mCherry::NPP-22 (blue dots, n=7) while the timing of lamina disassembly was scored in embryos expressing mCherry::LMN-1 (orange dots, n=8). (E) Graph presenting the surface area occupied by the pronuclei starting 200 s before anaphase onset (0 s) in embryos expressing GFP::TBB-2 and mCherry::LMN-1. ( F) Graph presenting the intercentrosomal distance normalized to embryo length starting 80 s before anaphase onset (0 s) in embryos expressing GFP::TBB-2 and mCherry::LMN-1 or mCherry::NPP-22.
-
Figure 1—source data 1
Quantification of: (D) The steps of pronuclear envelopes breakdown: pronuclei permeabilization, lamina disassembly (at the poles, between pronuclei), chromosomes alignment, and pronuclear envelopes scission event (membrane gap); (E) The surface area occupied by the pronuclei starting 200 s before anaphase onset (0 s). (F) The intercentrosomal distance normalized to embryo length starting 80 s before anaphase onset (0 s).
- https://cdn.elifesciences.org/articles/75382/elife-75382-fig1-data1-v2.xlsx
Figure 1—figure supplement 1
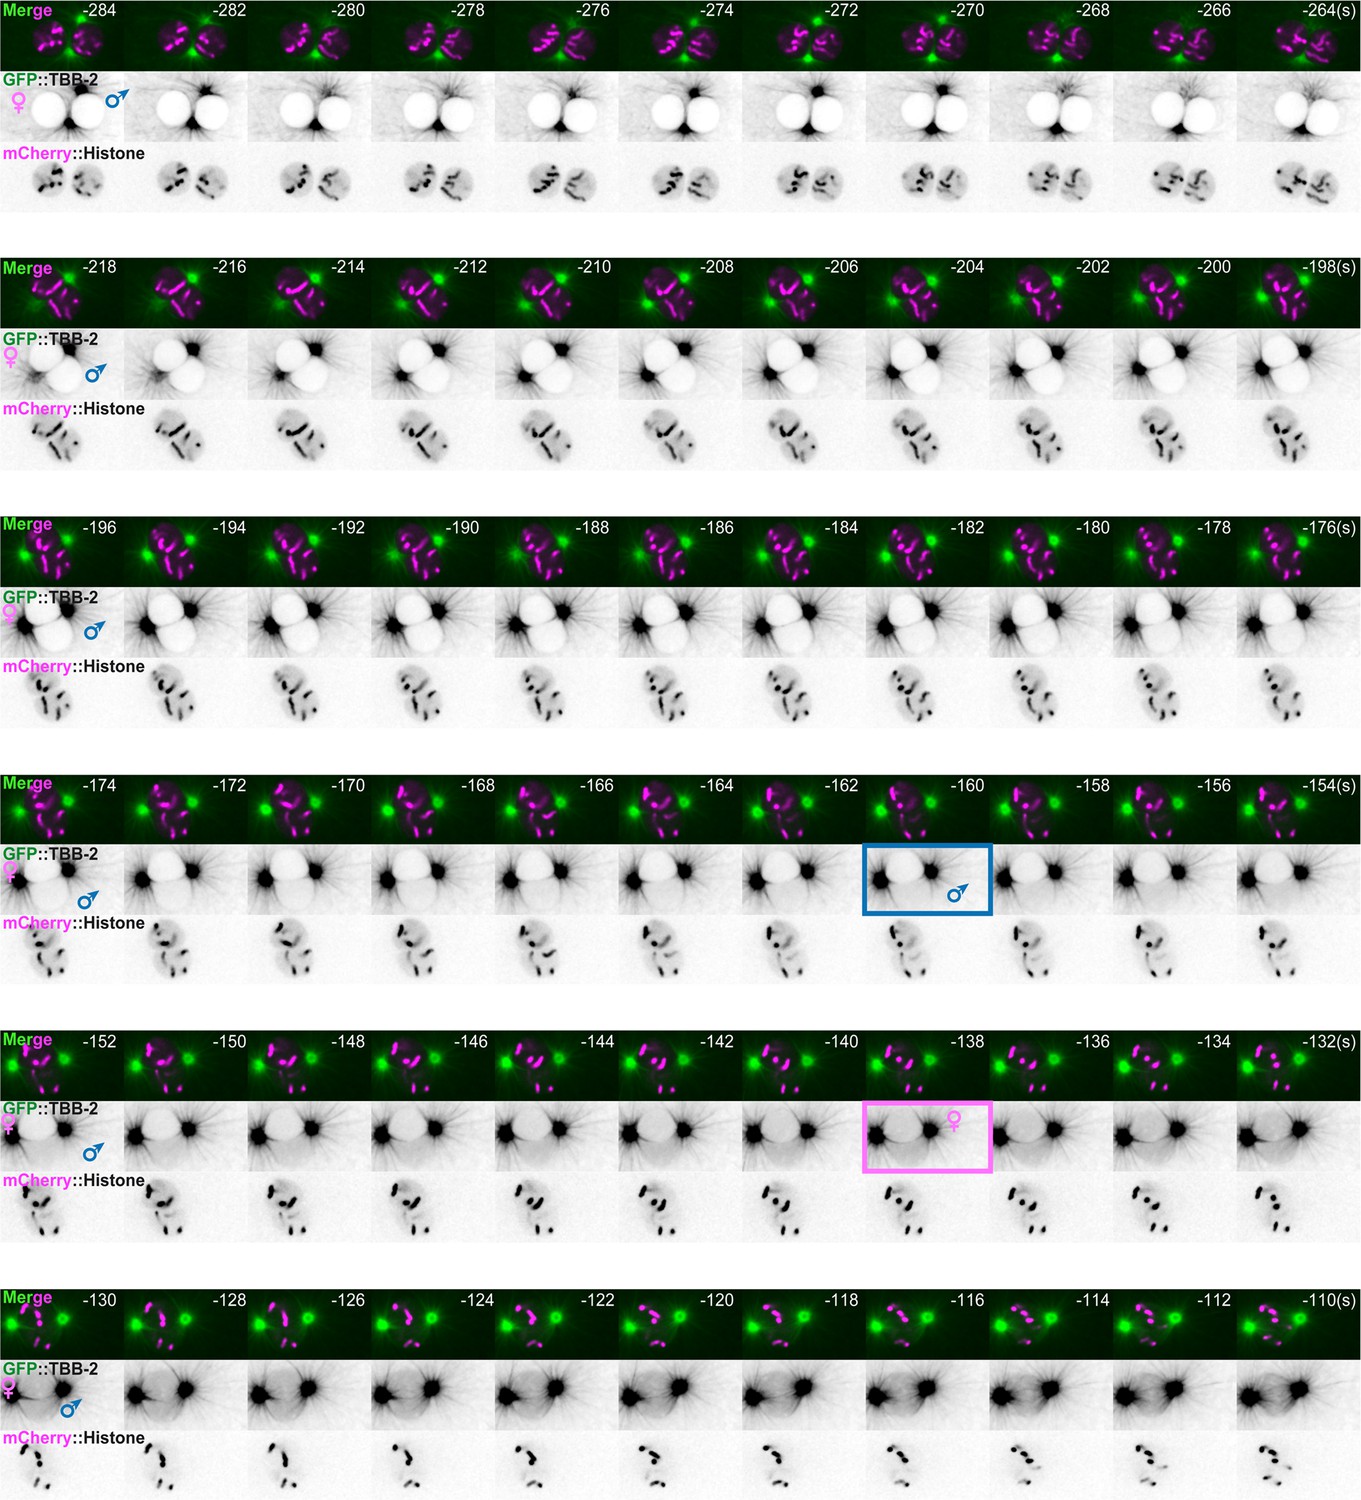
Timing of pronuclei permeabilization visualized by the appearance of soluble tubulin in the pronuclei.
Spinning disk confocal micrographs of embryos expressing GFP::TBB-2 (shown alone, and in green in the merged images) and mCherry::Histone (magenta, in the merged image) from pronuclei meeting to membrane permeabilization. The timing of paternal and maternal pronuclei permeabilization is indicated by a blue and pink rectangle, respectively. Time interval every 2 s, relative to anaphase onset (0 s). All panels are at the same magnification. Scale bar, 10 μm.
Figure 1—figure supplement 2
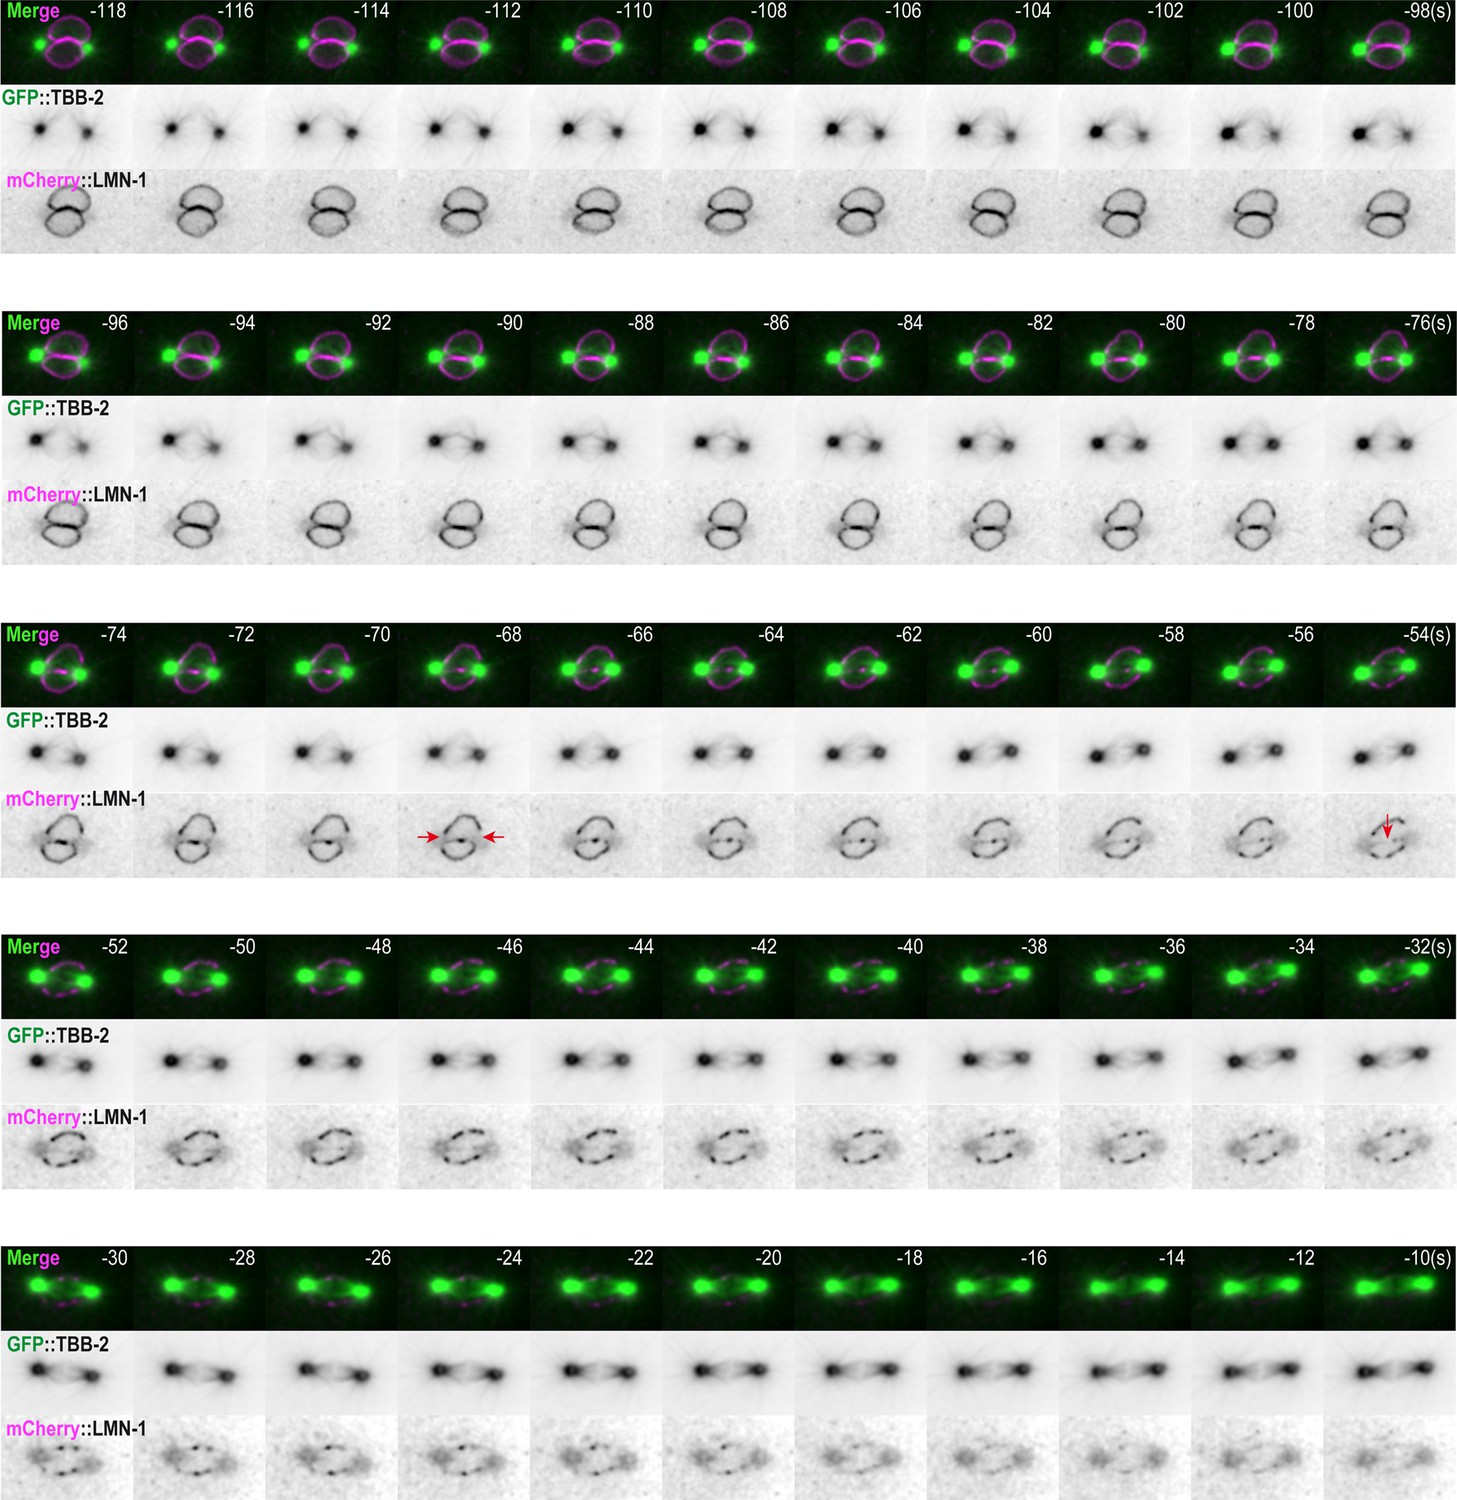
Spatio-temporal lamina depolymerization during mitosis.
Spinning disk confocal micrographs of embryos expressing GFP::TBB-2 (shown alone, and in green in the merged images) and mCherry::LMN-1 (shown alone and in magenta in the merged image). Time interval every 2 s, relative to anaphase onset (0 s). All panels are at the same magnification. Scale bar, 10 μm.
Figure 1—figure supplement 3
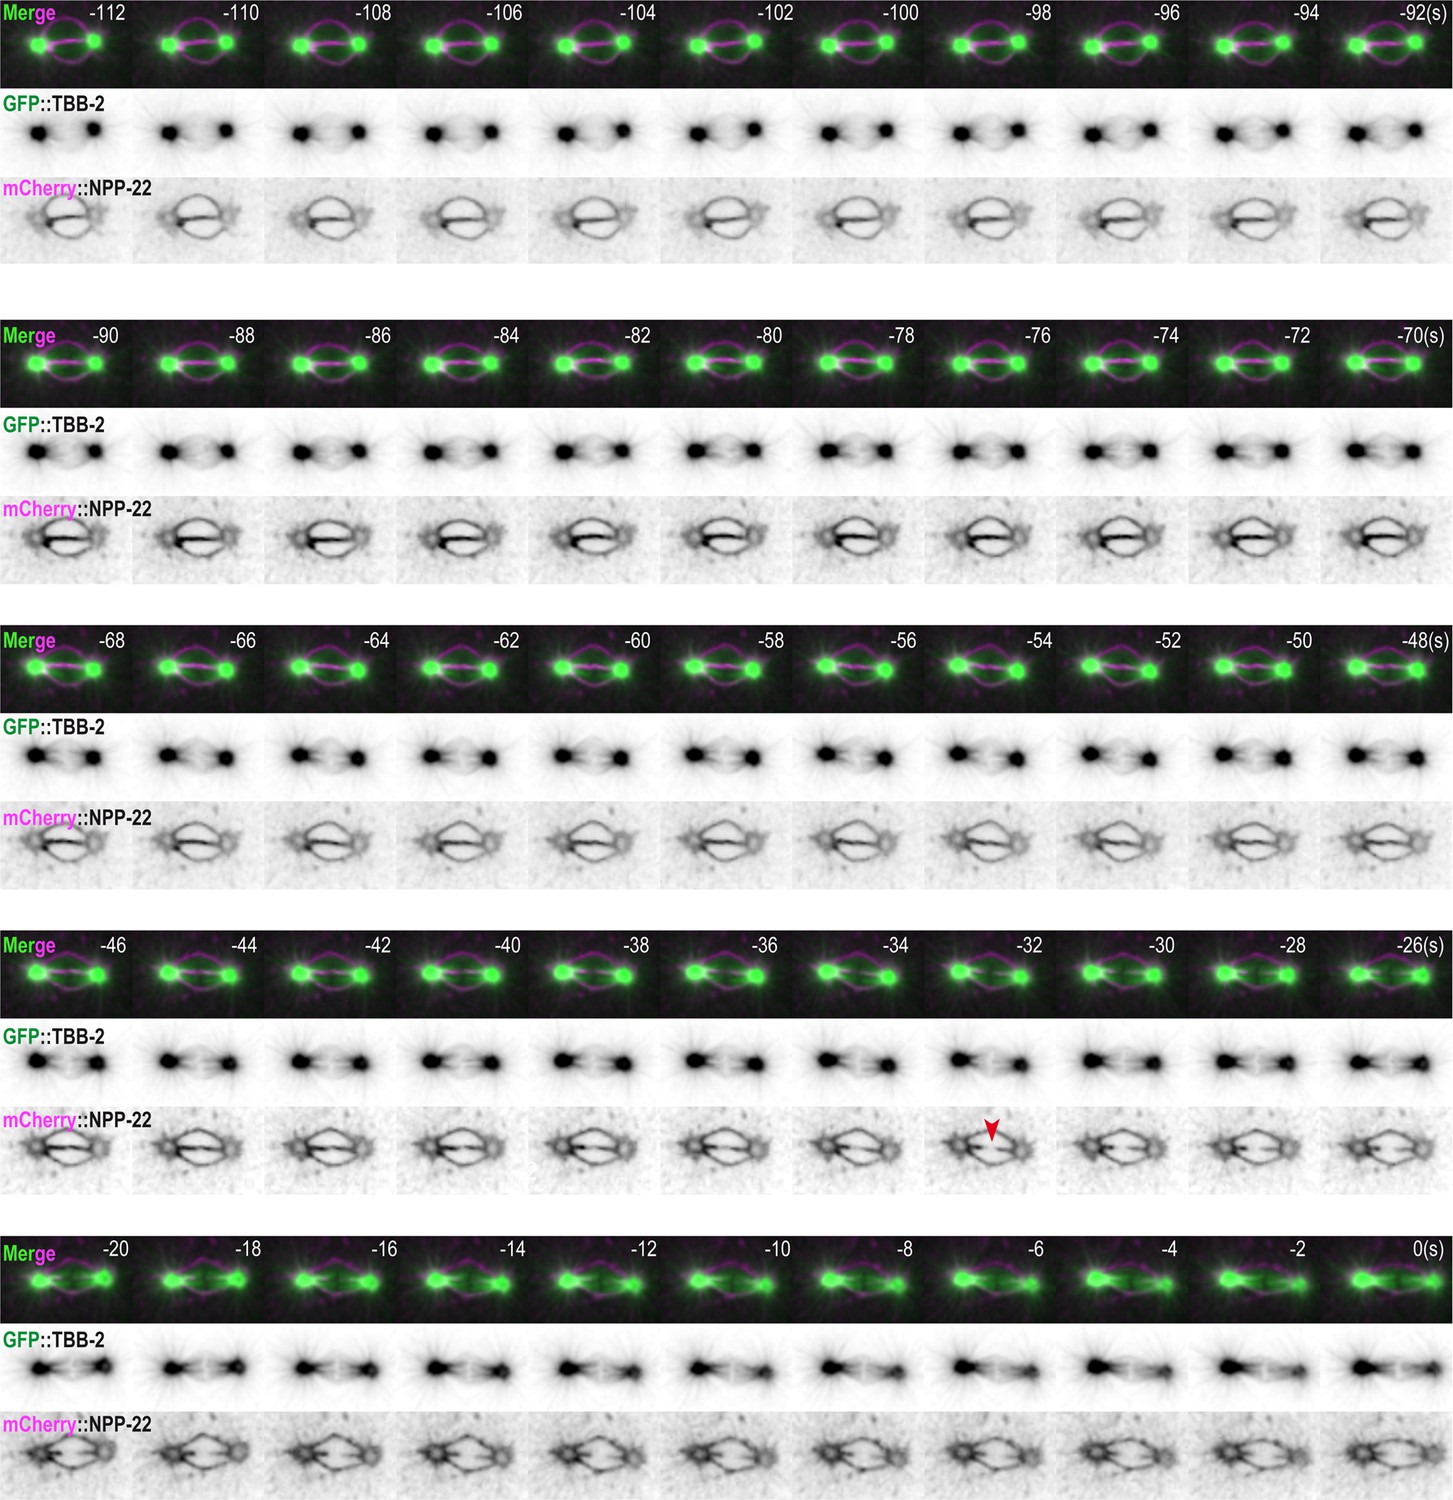
Timing of pronuclear envelopes scission.
Spinning disk confocal micrographs of embryos expressing GFP::TBB-2 (shown alone, and in green in the merged images) and mCherry::NPP-22 (shown alone and in magenta in the merged image). Time interval every 2 s, relative to anaphase onset (0 s). All panels are at the same magnification. Scale bar, 10 μm.
Figure 1—video 1
Embryos expressing mCherry::LMN-1 (magenta) and GFP::TBB-2 (green).
Figure 1—video 2
Embryos expressing mCherry::NPP-22 (magenta) and GFP::TBB-2 (green).
Figure 1—video 3
Embryos expressing mCherry::Histone (magenta) and GFP::TBB-2 (green).
Figure 2 with 1 supplement
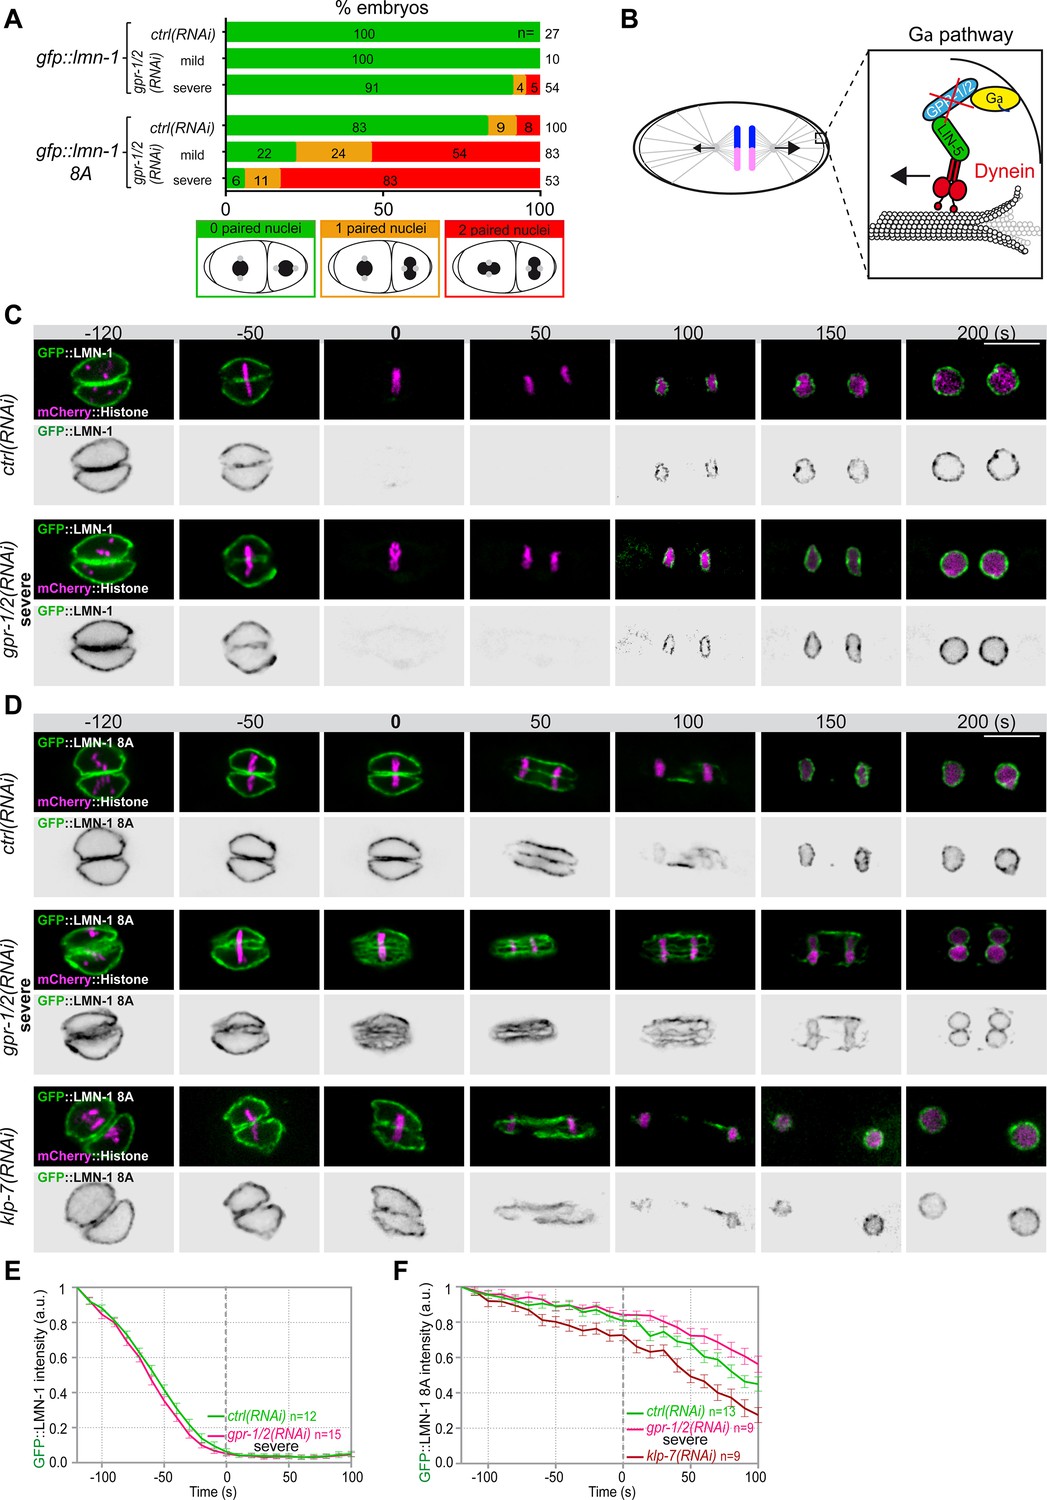
Astral microtubule pulling forces contribute to the union of the parental chromosomes during mitosis.
(A) Percentage of lmn-1∆; gfp::lmn-1 and lmn-1∆; gfp::lmn-1 8A embryos presenting 0 (green bars), 1 (orange bars), or 2 (red bars) paired nuclei at the two-cell stage upon exposure to mock RNAi (ctrl) or gpr-1/2(RNAi) at 20°C. The number of embryos of the indicated phenotype (n) is shown in the graph and was collected from more than three independent experiments. (B) Schematics of a one-cell Caenorhabditis elegans embryo in anaphase. The astral pulling forces mediated by the Gα pathway are schematized in the inset. This pathway, which comprises a complex of Gα (yellow), GPR-1/2 (blue), and LIN-5 (green), anchors dynein (red) to the cell cortex to generate pulling forces when dynein walks toward microtubule minus ends anchored at the spindle poles. Inactivation of GPR-1/2 (red cross) suppresses the astral pulling forces. (C, D) Spinning disk confocal micrographs of early lmn-1∆ mutant embryos expressing (C) wild-type GFP::LMN-1 or (D) GFP::LMN-1 8A (shown alone, and in green in the merged images) and mCherry::Histone (magenta, in the merged image) exposed to mock RNAi (ctrl) in the upper panels or gpr-1/2 and klp-7 RNAi in the lower panels. Times are in seconds relative to anaphase onset (0 s). All panels are at the same magnification Scale bar, 10 μm. (E, F) Quantification of (E) GFP::LMN-1 or (F) GFP::LMN-1 8A fluorescence signal intensity over time from central single focal planes above background at the nuclear envelope in embryos of the indicated genotype during mitosis. Times are in seconds relative to anaphase onset (0 s). The average signal intensity of GFP::LMN-1 and GFP::LMN-1 8A at 120 s before anaphase was defined as 1. The data points on the graphs are the normalized average signal intensity per pixel results ± SEM for n embryos of the indicated genotypes. Data were collected from three independent experiments.
-
Figure 2—source data 1
Quantification of: (A) Percentage of lmn-1∆; gfp::lmn-1 and lmn-1∆; gfp::lmn-1 8A embryos presenting zero-, one-, or two-paired nuclei at the two-cell stage upon exposure to mock RNAi (ctrl) or gpr-1/2(RNAi); (E) GFP::LMN-1 or GFP::LMN-1 8A (F, G) signal intensity during mitosis upon exposure to mock RNAi (ctrl), gpr-1/2(RNAi), or klp-7(RNAi).
- https://cdn.elifesciences.org/articles/75382/elife-75382-fig2-data1-v2.xlsx
Figure 2—figure supplement 1
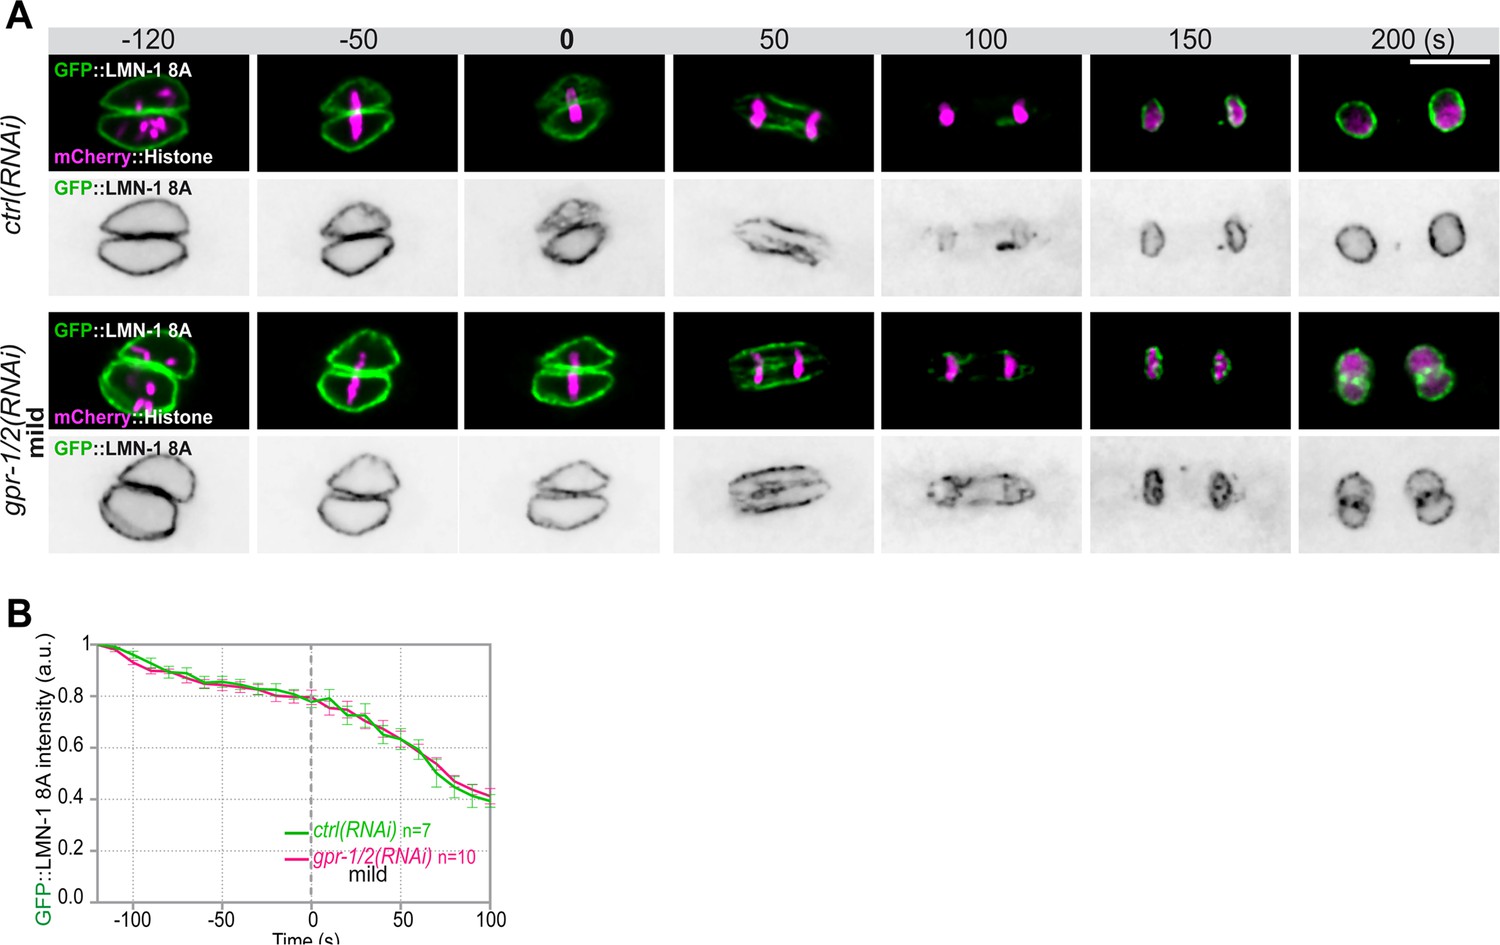
Quantification of GFP::LMN-1 8A signal intensity during mitosis upon reduced astral microtubule pulling forces.
(A) Spinning disk confocal micrographs of early lmn-1∆ mutant embryos expressing GFP::LMN-1 8A (shown alone, and in green in the merged images) and mCherry::Histone (magenta, in the merged image) exposed to mock RNAi (ctrl) in the upper panels or mild gpr1/2(RNAi) in the lower panels. Times are in seconds relative to anaphase onset (0 s). All panels are at the same magnification Scale bar, 10 μm.( B) Quantification of GFP::LMN-1 8A fluorescence signal intensity over time from central single focal planes above background at the nuclear envelope in embryos exposed to mock RNAi (ctrl) or mild gpr1/2(RNAi) during mitosis. The average signal intensity of GFP::LMN-1 8A at 120 s before anaphase was defined as 1. The data points on the graphs are the normalized average signal intensity per pixel results ± SEM for n embryos of the indicated genotypes. Data were collected from three independent experiments.
-
Figure 2—figure supplement 1—source data 1
Quantification of GFP::LMN-1 8A (B) signal intensity during mitosis upon exposure to mock RNAi (ctrl) or mild gpr-1/2(RNAi).
- https://cdn.elifesciences.org/articles/75382/elife-75382-fig2-figsupp1-data1-v2.xlsx
Figure 3
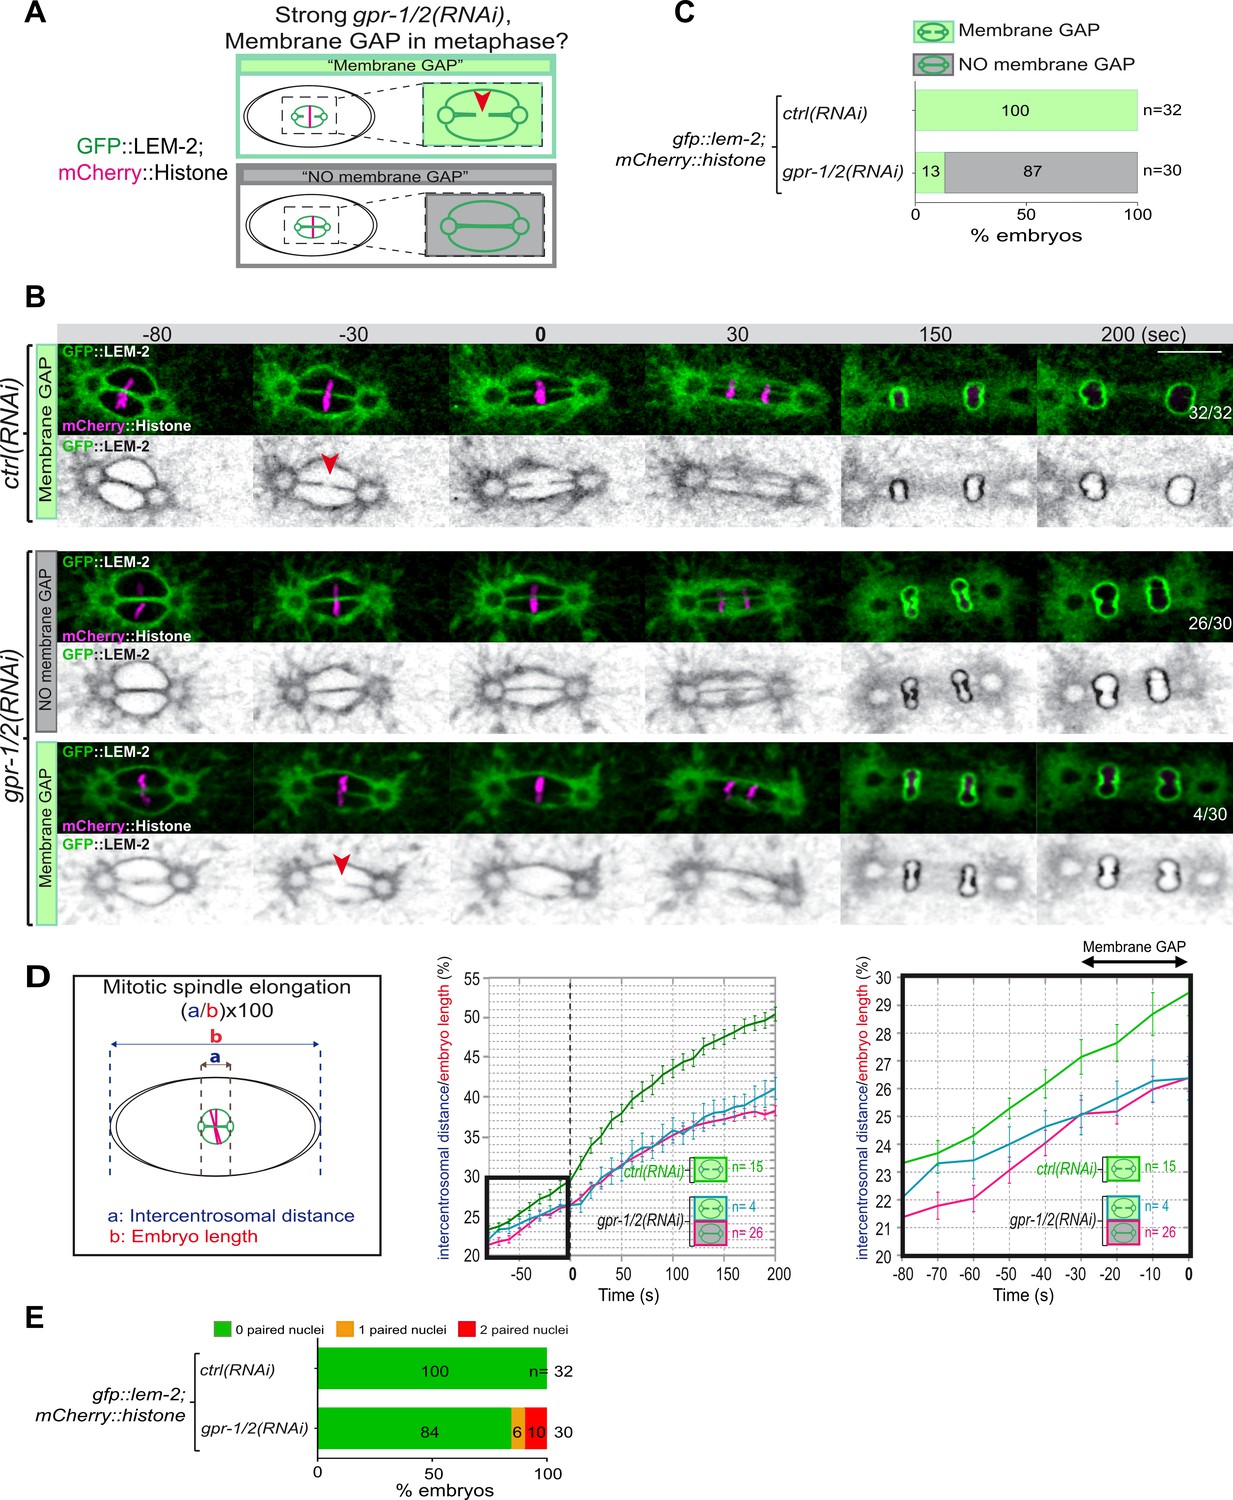
Reduction of astral pulling forces prevents pronuclear membranes scission.
(A) Schematics of the approach used to test the effect of a reduction of astral microtubule pulling forces on pronuclear envelopes scission (membrane gap) during mitosis. (B) Spinning disk confocal micrographs of one-cell stage embryos expressing the inner nuclear membrane protein GFP::LEM-2 (shown alone, and in green in the merged images) and mCherry::Histone (magenta, in the merged image) exposed to mock RNAi (ctrl) in the upper panels or gpr-1/2(RNAi) in the lower panels. Times are in seconds relative to anaphase onset (0 s). The fraction of embryos that showed the presented phenotype is indicated at the bottom right of each image. All panels are at the same magnification Scale bar, 10 μm. The orange arrowheads point to the pronuclear envelopes scission event. (C) Percentage of embryos presenting a pronuclear envelopes scission event upon exposure to mock RNAi (ctrl) or gpr-1/2(RNAi). (D) Graphs showing the intercentrosomal distance normalized to embryo length in percentage during mitosis upon exposure to mock RNAi (ctrl) or gpr-1/2(RNAi). Times are in seconds relative to anaphase onset (0 s). (E) Percentage of embryos presenting zero- (green bars), one- (orange bars), or two- (red bars) paired nuclei at the two-cell stage upon exposure to mock RNAi (ctrl) or gpr-1/2(RNAi). The number of embryos analyzed (n) is indicated on the graph and was collected from three independent experiments.
-
Figure 3—source data 1
Quantification of: (C) Percentage of embryos presenting a pronuclear envelopes scission event; (D) The intercentrosomal distance normalized to embryo length starting 80 s before anaphase onset (0 s); (E) Percentage of gfp-lem-2 embryos presenting zero-, one-, or two-paired nuclei at the two-cell stage upon exposure to mock RNAi (ctrl) or gpr-1/2(RNAi).
- https://cdn.elifesciences.org/articles/75382/elife-75382-fig3-data1-v2.xlsx
Figure 4 with 1 supplement
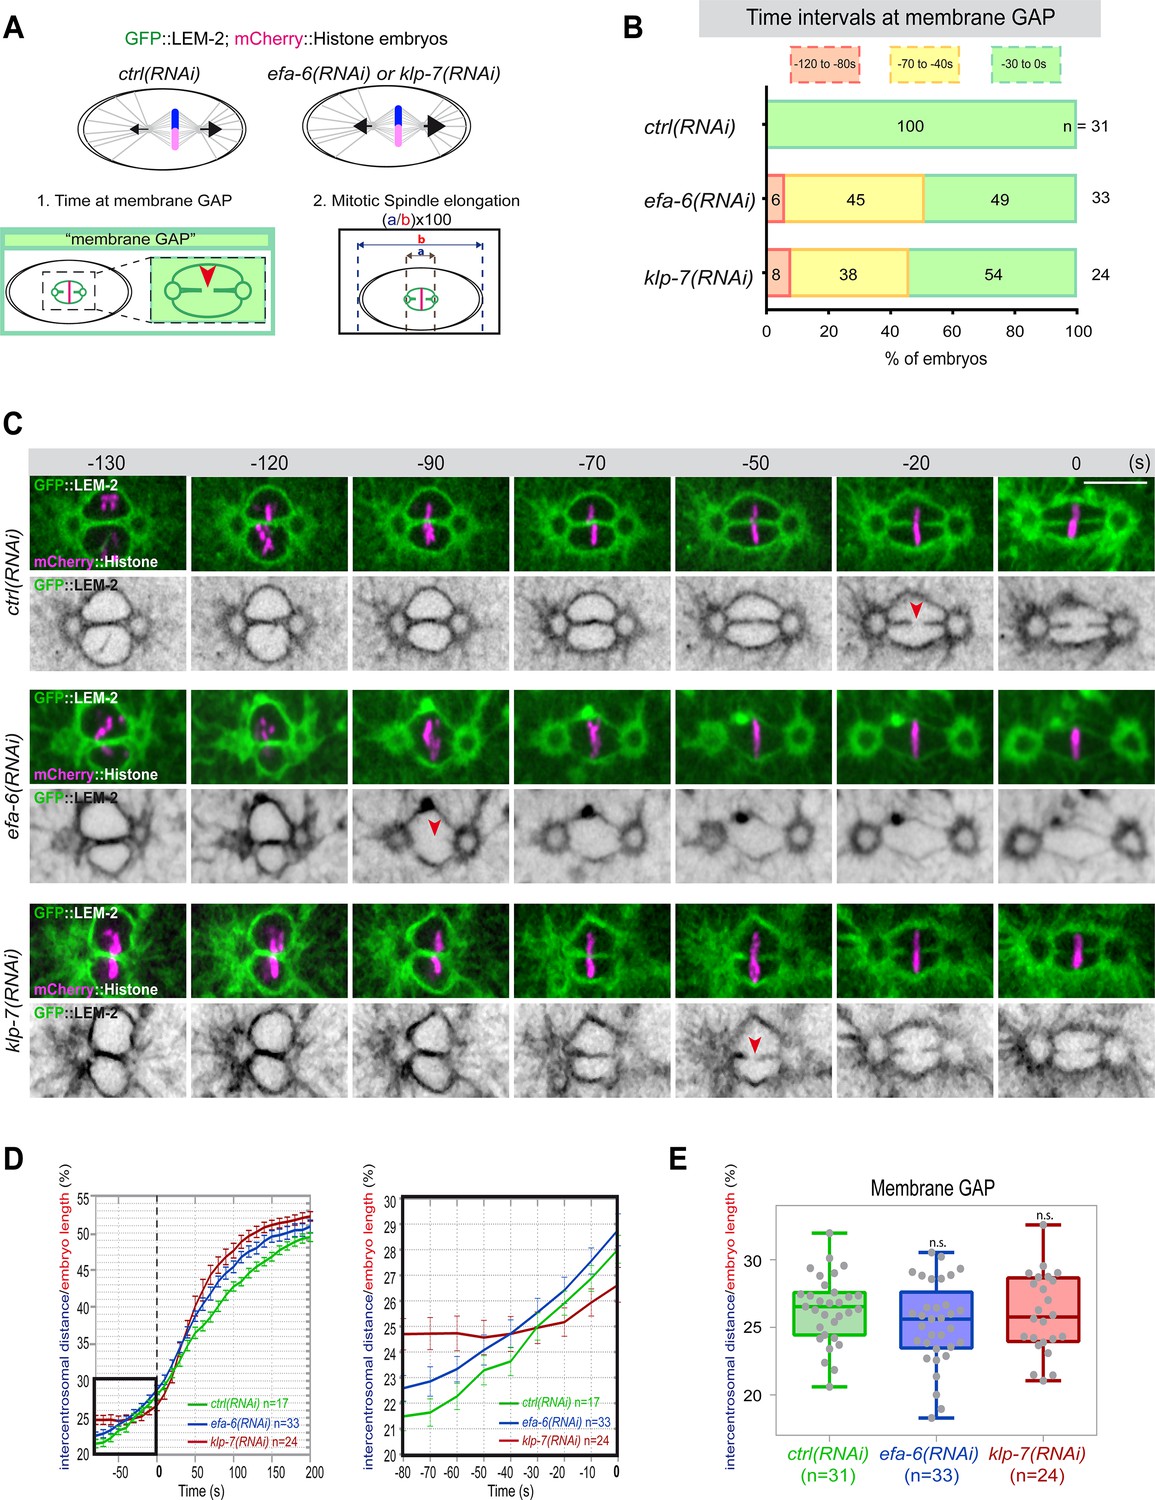
Premature pronuclear membranes scission event upon excessive astral microtubule pulling forces.
(A ) Schematics of the approach to test the effect of excessive astral microtubule pulling forces on pronuclear membranes scission (membrane gap) (1) and mitotic spindle elongation (2). (B) Percentage of embryos presenting the pronuclear membranes scission event at different time intervals relative to anaphase onset (0 s). The number of embryos (n) analyzed is indicated on the graph and was collected from three independent experiments. (C–) Spinning disk confocal micrographs of early embryos expressing mCherry::Histone, GFP::LEM-2 exposed to mock RNAi (ctrl), efa-6(RNAi), or klp-7(RNAi). Times are in seconds relative to anaphase onset (0 s). The red arrowheads indicate pronuclear membranes scission. All panels are at the same magnification Scale bar, 10 μm. (D) Intercentrosomal distance normalized to embryo length in percentage during mitosis upon exposure to mock RNAi (ctrl), efa-6, or klp-7(RNAi). Times are in seconds relative to anaphase onset (0 s). The graph on the right is a zoom of the first graph focused on the 80 s before anaphase onset (0 s). (E) Box and Whisker plots presenting the intercentrosomal distance normalized to embryo length in percentage at the time of pronuclear membranes gap formation in embryos of the indicated genotypes. n=number of embryos analyzed.
-
Figure 4—source data 1
Quantification of: (B) Percentage of embryos presenting a pronuclear membranes scission event at different time intervals relative to anaphase onset (0s); (D) The intercentrosomal distance normalized to embryo length starting 80s before anaphase onset (0s); (E) The intercentrosomal distance normalized to embryo length in percentage at the time of pronuclear membranes gap formation in embryos upon exposure to mock RNAi (ctrl), efa-6(RNAi), or klp-7(RNAi).
- https://cdn.elifesciences.org/articles/75382/elife-75382-fig4-data1-v2.xlsx
Figure 4—figure supplement 1

Chromosome configuration at the time of membrane gap formation upon an excessive astral microtubule pulling forces.
(C) Representative spinning disk confocal micrographs of one-cell stage embryos expressing GFP::LEM-2 (shown alone, and in green in the merged images) and mCherry::Histone (magenta, in the merged image) exposed to control, efa-6, or klp-7 RNAi. Embryos presenting pronuclear envelopes scission at each time interval are presented along with the configuration of their chromosomes (misaligned or aligned). n=number of embryos presenting a membrane scission at each time interval over the total number of embryos analyzed (in bold). The fraction of embryos presenting aligned or misaligned chromosomes at the time of pronuclear membranes scission is indicated at the top right of each image. Scale bar, 10 μm.
Figure 5
Chromosome alignment and lamina depolymerization are prerequisites for pronuclear membranes scission.
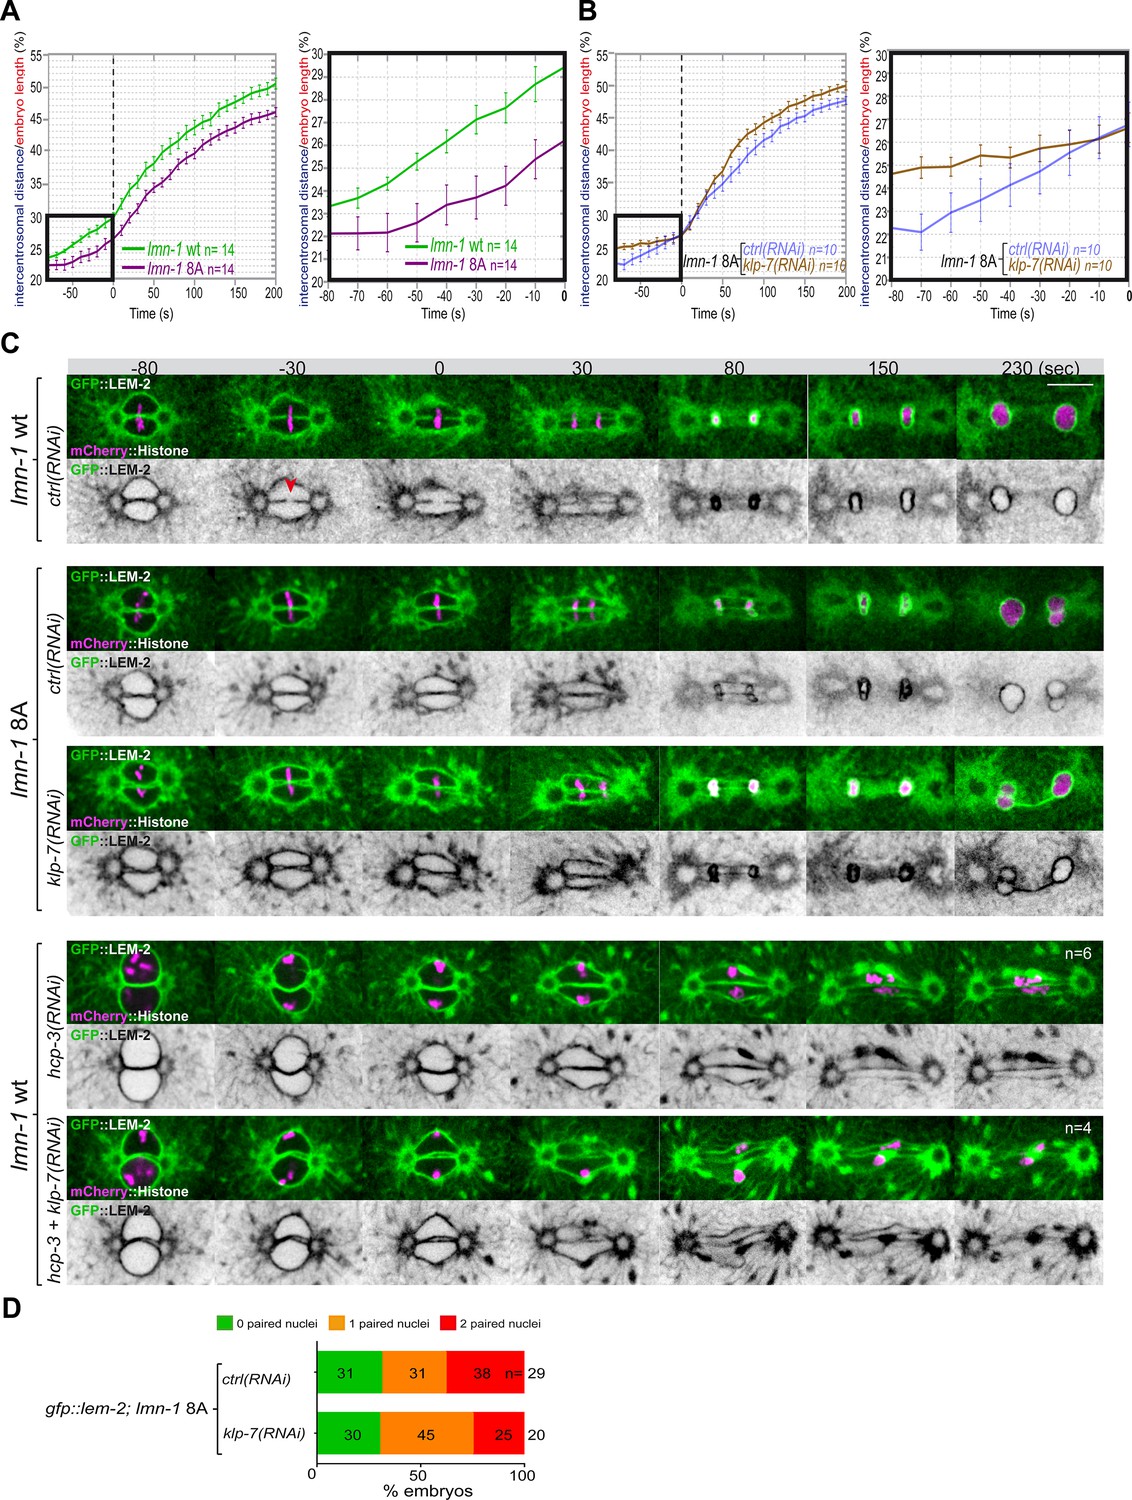
(A) Graphs showing the intercentrosomal distance normalized to embryo length in percentage in wild-type and lmn-1 8A embryos during mitosis. Times are in seconds relative to anaphase onset (0 s). The graph on the right is a zoom of the first graph focused on the 80 s before anaphase onset (0 s). (B) Graphs showing the intercentrosomal distance normalized to embryo length in percentage in lmn-1 8A embryos exposed to mock RNAi (ctrl) or klp-7(RNAi) during mitosis. Times are in seconds relative to anaphase onset (0 s). The graph on the right is a zoom of the first graph focused on the 80 s before anaphase onset (0 s). (C) Spinning disk confocal micrographs of one-cell stage embryos of the indicated genotype expressing the inner nuclear membrane protein GFP::LEM-2 (shown alone, and in green in the merged images) and mCherry::Histone (magenta, in the merged image). Times are in seconds relative to anaphase onset (0 s). The fraction of embryos that showed the presented phenotype is indicated at the bottom right of each image. All panels are at the same magnification Scale bar, 10 μm. The orange arrowheads point to the pronuclear envelopes scission event. (D) Percentage of embryos presenting zero- (green bars), one- (orange bars), or two- (red bars) paired nuclei at the two-cell stage upon exposure to mock RNAi (ctrl) or klp-7(RNAi). The number of embryos analyzed (n) is indicated on the graph and was collected from three independent experiments.
-
Figure 5—source data 1
Quantification of: (A) The intercentrosomal distance normalized to embryo length starting 80 s before anaphase onset (0 s) in lmn-1 wt and lmn-1 8A embryos; (B) The intercentrosomal distance normalized to embryo length starting 80s before anaphase onset (0s) in lmn-1 8A embryos upon exposure to mock (control, ctrl) or klp-7(RNAi); (E) Percentage of gfp-lem-2; lmn-1 8A embryos presenting zero-, one-, or two-paired nuclei at the two-cell stage upon exposure to mock RNAi (ctrl) or gpr-1/2(RNAi).
- https://cdn.elifesciences.org/articles/75382/elife-75382-fig5-data1-v2.xlsx
Figure 6

PLK-1 triggers pronuclear membranes scission mainly via lamina depolymerization.
(A) The schematics present the approach used to test whether partial lmn-1 inactivation in plk-1ts embryos expressing GFP::LEM-2 and mCherry::EMR-1 is sufficient to restore membrane gap formation. (B) Spinning disk confocal micrographs of wild-type or plk-1ts early embryos expressing mCherry::EMR-1 and GFP::LEM-2 exposed mock RNAi (ctrl) or lmn-1(RNAi). All panels are at the same magnification. Scale bar, 10 μm. (C) Percentage of embryos presenting zero- (green bars), one- (orange bars), or two- (red bars) paired nuclei at the two-cell stage upon exposure to mock RNAi (ctrl) or lmn-1(RNAi). The number of embryos analyzed (n) is indicated on the graph and was collected from three independent experiments. (D) Working model: temporal coordination between lamina depolymerization, chromosome alignment, and mitotic spindle elongation is required for pronuclear envelopes scission and parental genomes unification in the early Caenorhabditis elegans embryo.
-
Figure 6—source data 1
Quantification of: (C) Percentage of plk-1(or683ts) embryos, expressing GFP::LEM-2, and mCherry::EMR-1 presenting zero-, one-, or two-paired nuclei at the two-cell stage upon exposure to mock RNAi (ctrl) or lmn-1(RNAi).
- https://cdn.elifesciences.org/articles/75382/elife-75382-fig6-data1-v2.xlsx
Tables
Key resources table
| Reagent type (species) or resource | Designation | Source or reference | Identifiers | Additional information |
|---|---|---|---|---|
| Strain, strain background (Caenorhabditis elegans) | C. elegans N2 Bristol | Caenorhabditis Genetics Center(CGC) | http://www.cgc.cbs.umn.edu/strain.php?id=10570 | |
| Strain, strain background (C. elegans) | mCherry::NPP-22npp-22(syb1474)V | SunyBiotech | PHX1774 | |
| Strain, strain background (C. elegans) | mCherry::LMN-1; GFP::TBB-2:[mCherry::lmn-1] MosSCI: jfSi68[lmn-1(4 kb 5’UTR)::mCherry::lmn-1gDNA exon four recoded::3’UTR lmn-1 cb-unc-119(+)]II; ojIs1[Ppie-1_gfp::tbb-2]; unc-119(ed3)III | Pintard labThis study | WLP996 | |
| Strain, strain background (C. elegans) | mCherry::NPP-22; GFP::TBB-2:ojIs1[Ppie-1_gfp::tbb-2, cb-unc-119(+)]; unc-119(ed3)III; mCherry::npp-22(syb1474)V | Pintard labThis study | WLP993 | |
| Strain, strain background (Caenorhabditis elegans) | mCherry::HIS-58; GFP::TBB-2:ojIs1[Ppie-1_gfp::tbb-2]; unc-119(ed3)III; ltIs37[pAA64; Ppie1_mCherry::his-58; unc-119 (+)]IV | CGC | JCC483 | |
| Strain, strain background (C. elegans) | GFP::LMN-1; mCherry::Histone:lmn-1(tm1502)I; jfSi68[Plmn-1::gfp cb-unc-119(+)]II; mCherry::his-58 IV | Link et al., 2018 | UV142 | |
| Strain, strain background (C. elegans) | GFP::LMN-1 8A; mCherry::Histone:lmn-1(tm1502)I;jfSi89[Plmn-1S(21,22,24,32,397,398,403,405)A::gfp cb-unc-119(+)]II; mCherry::his-58 IV | Link et al., 2018 | UV144 | |
| Strain, strain background (C. elegans) | GFP::LEM-2; mCherry::HIS-58:Itls37 [(pAA64) pie-1p::mCherry::his-58 + unc-119(+)]IV qals3507 [pie-1::GFP::LEM-2 + unc-119(+)] | CGC | OD83 | |
| Strain, strain background (C. elegans) | lmn-1 8A; GFP::LEM-2; mCherry::HIS-58:lmn-1S8A S(21,22,24,32,397,398,403, 405)A Itls37 [(pAA64) pie-1p::mCherry::his-58 + unc-119(+)]IV qals3507 [pie-1::GFP::LEM-2 + unc-119(+)] | Velez-Aguilera et al., 2020 | WLP833 | |
| Strain, strain background (C. elegans) | GFP::LEM-2; mCherry::EMR-1:bqSi210 [lem-2p::lem-2::GFP + unc-119(+)] II; bqSi226 [emr-1p::emr-1::mCherry + unc-119(+)]IV | Morales-Martínez et al., 2015 | BN228 | |
| Strain, strain background (C. elegans) | plk-1(or683ts); GFP::LEM-2; mCherry::EMR-1:bqSi210 [lem-2p::lem-2::GFP+unc-119(+)] II; plk-1(or683ts)III; bqSi226 [emr-1p::emr-1::mCherry + unc-119(+)] IV | Pintard lab This study | WLP1041 | |
| Strain, strain background (Escherichia coli) | OP50 | CGC | http://www.cgc.cbs.umn.edu/strain.php?id=11078 | |
| Strain, strain background (E. coli) | HT115(DE3) | CGC | http://www.cgc.cbs.umn.edu/strain.php?id=11078 | |
| Chemical compound, drug | IPTG | Euromedex | Cat#EU0008-B | |
| Chemical compound, drug | Pfu | Promega | Cat#M7741 | |
| Chemical compound, drug | DpnI | Biolabs | Cat#R0176S | |
| Commercial assay or kit | BP Clonase II Enzyme Mix (Gateway cloning) | Invitrogen | Cat#11789-020 | |
| Commercial assay or kit | LR Clonase II Enzyme Mix (Gateway cloning) | Invitrogen | Cat#11791-020 | |
| Recombinant DNA reagent | L4440 (RNAi Feeding vector) | Kamath et al., 2001 | N/A | |
| Recombinant DNA reagent | gpr-1/2 cloned into L4440 | Kamath et al., 2003 | Arhinger Library | |
| Recombinant DNA reagent | klp-7 cloned into L4440 | Kamath et al., 2003 | Arhinger Library | |
| Recombinant DNA reagent | efa-6 cloned into L4440 | Kamath et al., 2003 | Arhinger Library | |
| Recombinant DNA reagent | hcp-3 cloned into L4440 | Kamath et al., 2003 | Arhinger Library | |
| Recombinant DNA reagent | lmn-1 cloned into L4440 | Kamath et al., 2003 | Arhinger Library | |
| Recombinant DNA reagent | pDESTttTi5605[R4-R3] for MOS insertion on Chromosome II | Frøkjaer-Jensen et al., 2008 | pCFJ150Addgene plasmid # 19329 | |
| Recombinant DNA reagent | MOS transposase Pglh-2::MosTase::glh-2utr | Frøkjaer-Jensen et al., 2008 | pJL43.1Addgene plasmid # 19332 | |
| Recombinant DNA reagent | Prab-3::mCherry | Frøkjaer-Jensen et al., 2008 | pGH8 | |
| Recombinant DNA reagent | Pmyo-2::mCherry::unc-54 | Frøkjaer-Jensen et al., 2008 | pCFJ90 | |
| Recombinant DNA reagent | Plmn-1_gfp::lmn-1_lmn-1 3’UTR in pCFJ150 | Link et al., 2018 | N/A | |
| Recombinant DNA reagent | Plmn-1_gfp::lmn-1(S8A) lmn-1 3’UTR in pCFJ150 | Link et al., 2018 | N/A | |
| Recombinant DNA reagent | mCherry::lmn-1 in pCFJ150 | This study | pLP2437 | |
| Sequence-based reagent | Forward to amplify 5′ of mCherry | This study | OLP2570PCR primers | CTCTTCAGAAAGCAGCGAGAAAAATGGGA GGTAGGGCCGGCTCTG |
| Sequence-based reagent | Reverse to amplify 5′ of mCherry | This study | OLP2571PCR primers | CAGAGCCGGCCCTACCTCCCATTTTTCT CGCTGCTTTCTGAAGAG |
| Sequence-based reagent | Forward to amplify 3′ of mCherry with linker before LMN-1 | This study | OLP2572PCR primers | GGTGGCATGGATGAATTGTATAAGGCAAGT TTGTACAAAAAAGCAGGCTCC |
| Sequence-based reagent | oJD580 Amp_For to amplify fragment of PCFJ150 | This study | OLP870PCR primers | ATCGTGGTGTCACGCTCGTCGTTTGGTATGG |
| Sequence-based reagent | oJD581 Amp_Rev to amplify fragment of PCFJ151 | This study | OLP871PCR primers | ATACCAAACGACGAGCGTGACACCACGATGC |
| Sequence-based reagent | Gibson Forward oligo for MosII LMN-1 construction. | This study | OLP2267 | CCTTGTCCGAATCCACCACCCATTCCTCCTG |
| Sequence-based reagent | Gibson Reverse oligo for MosII LMN-1 construction. | This study | OLP2266 | GGAGGAATGGGTGGTGGATTCGGACAAGGAC |
| Software, algorithm | Adobe Illustrator CS6 | Adobe | https://www.adobe.com/products/illustrator.html | |
| Software, algorithm | Adobe Photoshop CS4 | Adobe | https://www.adobe.com/products/photoshop.html | |
| Software, algorithm | ImageJ | NIH Schneider et al., 2012 | https://imagej.nih.gov/ij/ | |
| Software, algorithm | ZEN | Zeiss | https://www.zeiss.com/microscopy/int/products/microscope-software/zen.html | |
| Software, algorithm | PRISM | Graphpad | https://www.graphpad.com/ | |
| Software, algorithm | Metamorph | Molecular Devices | https://www.metamorph.com/ | |
| Software, algorithm | Imaris | Bitplane | Microscopy Image Analysis Software - Imaris - Oxford Instruments (oxinst.com) |
Additional files
Download links
A two-part list of links to download the article, or parts of the article, in various formats.
Downloads (link to download the article as PDF)
Open citations (links to open the citations from this article in various online reference manager services)
Cite this article (links to download the citations from this article in formats compatible with various reference manager tools)
Cortical microtubule pulling forces contribute to the union of the parental genomes in the Caenorhabditis elegans zygote
eLife 11:e75382.
https://doi.org/10.7554/eLife.75382


